Scolaris Content Display Scolaris Content Display

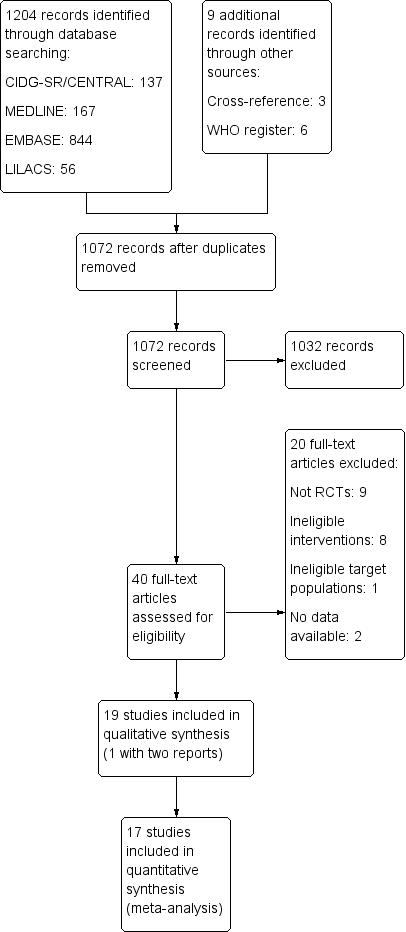
Study flow diagram.
Figuras y tablas -
Figure 1

Study flow diagram.

Risk of bias graph: review authors' judgements about each risk of bias item presented as percentages across all included studies.
Figuras y tablas -
Figure 2

Risk of bias graph: review authors' judgements about each risk of bias item presented as percentages across all included studies.

Risk of bias summary: review authors' judgements about each risk of bias item for each included study.
Figuras y tablas -
Figure 3

Risk of bias summary: review authors' judgements about each risk of bias item for each included study.

Comparison 1 Albendazole (once daily) versus metronidazole (three times daily), Outcome 1 Parasitological cure (at 1 to 3 weeks).
Figuras y tablas -
Analysis 1.1

Comparison 1 Albendazole (once daily) versus metronidazole (three times daily), Outcome 1 Parasitological cure (at 1 to 3 weeks).

Comparison 1 Albendazole (once daily) versus metronidazole (three times daily), Outcome 2 Time to achieve parasitological cure (hours).
Figuras y tablas -
Analysis 1.2

Comparison 1 Albendazole (once daily) versus metronidazole (three times daily), Outcome 2 Time to achieve parasitological cure (hours).

Comparison 1 Albendazole (once daily) versus metronidazole (three times daily), Outcome 3 Clinical improvement (at 2 to 3 weeks).
Figuras y tablas -
Analysis 1.3

Comparison 1 Albendazole (once daily) versus metronidazole (three times daily), Outcome 3 Clinical improvement (at 2 to 3 weeks).

Comparison 1 Albendazole (once daily) versus metronidazole (three times daily), Outcome 4 Time of symptomatic improvement (hours).
Figuras y tablas -
Analysis 1.4

Comparison 1 Albendazole (once daily) versus metronidazole (three times daily), Outcome 4 Time of symptomatic improvement (hours).

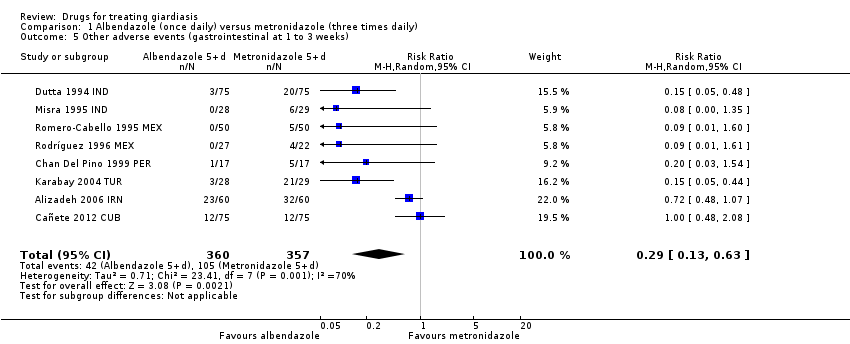
Comparison 1 Albendazole (once daily) versus metronidazole (three times daily), Outcome 5 Other adverse events (gastrointestinal at 1 to 3 weeks).
Figuras y tablas -
Analysis 1.5

Comparison 1 Albendazole (once daily) versus metronidazole (three times daily), Outcome 5 Other adverse events (gastrointestinal at 1 to 3 weeks).

Comparison 1 Albendazole (once daily) versus metronidazole (three times daily), Outcome 6 Other adverse events (neurological at 1 to 3 weeks).
Figuras y tablas -
Analysis 1.6

Comparison 1 Albendazole (once daily) versus metronidazole (three times daily), Outcome 6 Other adverse events (neurological at 1 to 3 weeks).

Comparison 1 Albendazole (once daily) versus metronidazole (three times daily), Outcome 7 Other adverse events (metallic taste at 3 weeks).
Figuras y tablas -
Analysis 1.7

Comparison 1 Albendazole (once daily) versus metronidazole (three times daily), Outcome 7 Other adverse events (metallic taste at 3 weeks).

Comparison 1 Albendazole (once daily) versus metronidazole (three times daily), Outcome 8 Other adverse events (allergic/cutaneous at 3 weeks).
Figuras y tablas -
Analysis 1.8

Comparison 1 Albendazole (once daily) versus metronidazole (three times daily), Outcome 8 Other adverse events (allergic/cutaneous at 3 weeks).

Comparison 1 Albendazole (once daily) versus metronidazole (three times daily), Outcome 9 Other adverse events (fever at 3 weeks).
Figuras y tablas -
Analysis 1.9

Comparison 1 Albendazole (once daily) versus metronidazole (three times daily), Outcome 9 Other adverse events (fever at 3 weeks).

Comparison 1 Albendazole (once daily) versus metronidazole (three times daily), Outcome 10 Other adverse events (transient elevation of liver enzymes at 3 weeks).
Figuras y tablas -
Analysis 1.10

Comparison 1 Albendazole (once daily) versus metronidazole (three times daily), Outcome 10 Other adverse events (transient elevation of liver enzymes at 3 weeks).

Comparison 1 Albendazole (once daily) versus metronidazole (three times daily), Outcome 11 Other adverse (transient neutropenia at 3 weeks).
Figuras y tablas -
Analysis 1.11

Comparison 1 Albendazole (once daily) versus metronidazole (three times daily), Outcome 11 Other adverse (transient neutropenia at 3 weeks).

Comparison 1 Albendazole (once daily) versus metronidazole (three times daily), Outcome 12 Non‐compliance to treatment (at 2 weeks).
Figuras y tablas -
Analysis 1.12

Comparison 1 Albendazole (once daily) versus metronidazole (three times daily), Outcome 12 Non‐compliance to treatment (at 2 weeks).

Comparison 2 Mebendazole (three times daily) versus metronidazole (three times daily), Outcome 1 Parasitological cure (at 1 to 2 weeks).
Figuras y tablas -
Analysis 2.1

Comparison 2 Mebendazole (three times daily) versus metronidazole (three times daily), Outcome 1 Parasitological cure (at 1 to 2 weeks).

Comparison 2 Mebendazole (three times daily) versus metronidazole (three times daily), Outcome 2 Other adverse events (nausea/vomiting at 1 to 2 weeks).
Figuras y tablas -
Analysis 2.2

Comparison 2 Mebendazole (three times daily) versus metronidazole (three times daily), Outcome 2 Other adverse events (nausea/vomiting at 1 to 2 weeks).

Comparison 2 Mebendazole (three times daily) versus metronidazole (three times daily), Outcome 3 Other adverse events (headache at 1 to 2 weeks).
Figuras y tablas -
Analysis 2.3

Comparison 2 Mebendazole (three times daily) versus metronidazole (three times daily), Outcome 3 Other adverse events (headache at 1 to 2 weeks).

Comparison 2 Mebendazole (three times daily) versus metronidazole (three times daily), Outcome 4 Other adverse events (urticaria at 1 to 2 weeks).
Figuras y tablas -
Analysis 2.4

Comparison 2 Mebendazole (three times daily) versus metronidazole (three times daily), Outcome 4 Other adverse events (urticaria at 1 to 2 weeks).

Comparison 3 Tinidazole (single dose) versus metronidazole (three times daily), Outcome 1 Parasitological cure (at 3 weeks to 1 month).
Figuras y tablas -
Analysis 3.1

Comparison 3 Tinidazole (single dose) versus metronidazole (three times daily), Outcome 1 Parasitological cure (at 3 weeks to 1 month).

Comparison 3 Tinidazole (single dose) versus metronidazole (three times daily), Outcome 2 Clinical improvement (at 3 weeks to 1 month).
Figuras y tablas -
Analysis 3.2

Comparison 3 Tinidazole (single dose) versus metronidazole (three times daily), Outcome 2 Clinical improvement (at 3 weeks to 1 month).

Comparison 3 Tinidazole (single dose) versus metronidazole (three times daily), Outcome 3 Other adverse events (gastrointestinal at 3 weeks to 1 month).
Figuras y tablas -
Analysis 3.3

Comparison 3 Tinidazole (single dose) versus metronidazole (three times daily), Outcome 3 Other adverse events (gastrointestinal at 3 weeks to 1 month).

Comparison 3 Tinidazole (single dose) versus metronidazole (three times daily), Outcome 4 Other adverse events (neurological at 3 weeks to 1 month).
Figuras y tablas -
Analysis 3.4

Comparison 3 Tinidazole (single dose) versus metronidazole (three times daily), Outcome 4 Other adverse events (neurological at 3 weeks to 1 month).

Comparison 3 Tinidazole (single dose) versus metronidazole (three times daily), Outcome 5 Other adverse events (allergic/cutaneous at 3 weeks to 1 month).
Figuras y tablas -
Analysis 3.5

Comparison 3 Tinidazole (single dose) versus metronidazole (three times daily), Outcome 5 Other adverse events (allergic/cutaneous at 3 weeks to 1 month).

Comparison 3 Tinidazole (single dose) versus metronidazole (three times daily), Outcome 6 Other adverse events (fever at 3 weeks to 1 month).
Figuras y tablas -
Analysis 3.6

Comparison 3 Tinidazole (single dose) versus metronidazole (three times daily), Outcome 6 Other adverse events (fever at 3 weeks to 1 month).

Comparison 3 Tinidazole (single dose) versus metronidazole (three times daily), Outcome 7 Serious adverse events (at 3 weeks to 1 month).
Figuras y tablas -
Analysis 3.7

Comparison 3 Tinidazole (single dose) versus metronidazole (three times daily), Outcome 7 Serious adverse events (at 3 weeks to 1 month).

Comparison 4 Metronidazole (single dose) versus metronidazole (three times daily), Outcome 1 Parasitological cure (at 2 weeks).
Figuras y tablas -
Analysis 4.1

Comparison 4 Metronidazole (single dose) versus metronidazole (three times daily), Outcome 1 Parasitological cure (at 2 weeks).

Comparison 4 Metronidazole (single dose) versus metronidazole (three times daily), Outcome 2 Other adverse events (gastrointestinal at 2 weeks).
Figuras y tablas -
Analysis 4.2

Comparison 4 Metronidazole (single dose) versus metronidazole (three times daily), Outcome 2 Other adverse events (gastrointestinal at 2 weeks).

Comparison 4 Metronidazole (single dose) versus metronidazole (three times daily), Outcome 3 Serious adverse events (at 2 weeks).
Figuras y tablas -
Analysis 4.3

Comparison 4 Metronidazole (single dose) versus metronidazole (three times daily), Outcome 3 Serious adverse events (at 2 weeks).

Comparison 5 Nitazoxanide (twice daily) versus metronidazole (twice daily), Outcome 1 Parasitological cure (at 1 week).
Figuras y tablas -
Analysis 5.1

Comparison 5 Nitazoxanide (twice daily) versus metronidazole (twice daily), Outcome 1 Parasitological cure (at 1 week).

Comparison 5 Nitazoxanide (twice daily) versus metronidazole (twice daily), Outcome 2 Reduction in symptoms of diarrhea (at 1 week).
Figuras y tablas -
Analysis 5.2

Comparison 5 Nitazoxanide (twice daily) versus metronidazole (twice daily), Outcome 2 Reduction in symptoms of diarrhea (at 1 week).

Comparison 5 Nitazoxanide (twice daily) versus metronidazole (twice daily), Outcome 3 Other adverse events (at 1 week).
Figuras y tablas -
Analysis 5.3

Comparison 5 Nitazoxanide (twice daily) versus metronidazole (twice daily), Outcome 3 Other adverse events (at 1 week).

Comparison 5 Nitazoxanide (twice daily) versus metronidazole (twice daily), Outcome 4 Other adverse events (abdominal pain at 1 week).
Figuras y tablas -
Analysis 5.4

Comparison 5 Nitazoxanide (twice daily) versus metronidazole (twice daily), Outcome 4 Other adverse events (abdominal pain at 1 week).

Comparison 5 Nitazoxanide (twice daily) versus metronidazole (twice daily), Outcome 5 Other adverse events (nausea/vomiting at 1 week).
Figuras y tablas -
Analysis 5.5

Comparison 5 Nitazoxanide (twice daily) versus metronidazole (twice daily), Outcome 5 Other adverse events (nausea/vomiting at 1 week).

Comparison 5 Nitazoxanide (twice daily) versus metronidazole (twice daily), Outcome 6 Other adverse events (headache at 1 week).
Figuras y tablas -
Analysis 5.6

Comparison 5 Nitazoxanide (twice daily) versus metronidazole (twice daily), Outcome 6 Other adverse events (headache at 1 week).

Albendazole (5+ days) compared to metronidazole (5+ days) for treating giardiasis

Patient or population: People with giardiasis infection
Settings: Endemic settings
Intervention: Albendazole once daily for five or more days
Comparison: Metronidazole three times daily for five or more days

Outcomes

Illustrative comparative risks* (95% CI)

Relative effect
(95% CI)

No of participants
(studies)

Quality of the evidence
(GRADE)

Comments

Assumed risk

Corresponding risk

Metronidazole
(three times daily for 5 to 10 days)

Albendazole
(once daily for 5 to 10 days)

Parasitological cure (Follow‐up: 1 to 2 weeks)

91 per 100

90 per 100
(86 to 94)

RR 0.99
(0.95 to 1.03)

932
(10 studies)

⊕⊕⊕⊝
moderate1,2,3

Clinical improvement (Follow‐up: 2 to 3 weeks)

91 per 100

89 per 100
(85 to 95)

RR 0.98
(0.93 to 1.04)

483
(5 studies)

⊕⊕⊕⊝
moderate1,2,3

Gastrointestinal side effects (Follow‐up: 1 to 3 weeks)

29 per 100

8 per 100
(4 to 18)

RR 0.29
(0.13 to 0.63)

717
(8 studies)

⊕⊕⊕⊝
moderate1,2

Neurological side effects (Follow‐up: 1 to 3 weeks)

15 per 100

5 per 100
(3 to 10)

RR 0.34
(0.18 to 0.64)

453
(5 studies)

⊕⊕⊝⊝
low1,2,4

*The basis for the assumed risk (eg the median control group risk across studies) is provided in footnotes. The corresponding risk (and its 95% CI) is based on the assumed risk in the comparison group and the relative effect of the intervention (and its 95% CI).
CI: Confidence interval; RR: Risk Ratio

GRADE Working Group grades of evidence
High quality: Further research is very unlikely to change our confidence in the estimate of effect.
Moderate quality: Further research is likely to have an important impact on our confidence in the estimate of effect and may change the estimate.
Low quality: Further research is very likely to have an important impact on our confidence in the estimate of effect and is likely to change the estimate.
Very low quality: We are very uncertain about the estimate.

1 These trials were conducted in adults and children in India, Mexico, Peru, Cuba, and Turkey. The dose of metronidazole was 250 mg to 500 mg three times daily for 5 to 10 days. The dose of albendazole was 400 mg once daily for five to 10 days.
2 Downgraded by 1 for risk of bias as none of these trials adequately described allocation concealment or blinding.
3 The finding of no difference between treatments is consistent across trials, and the 95% CI excludes clinically important differences.
4 Downgraded by 1 for imprecision as the number of neurological side effects in these trials was very low.

Figuras y tablas -

Mebendazole (5+ days) compared to metronidazole (5+ days) for treating giardiasis

Patient or population: People with giardiasis infection
Settings: Endemic settings
Intervention: Mebendazole once daily for five or more days
Comparison: Metronidazole three times daily for five or more days

Outcomes

Illustrative comparative risks* (95% CI)

Relative effect
(95% CI)

No of participants
(studies)

Quality of the evidence
(GRADE)

Comments

Assumed risk

Corresponding risk

Metronidazole
(three times daily for 5 to 10 days)

Mebendazole
(three times daily for 5 to 10 days)

Parasitological cure

(Follow‐up: 1 to 2 weeks)

90 per 100

52 per 100
(29 to 95)

RR 0.58
(0.32 to 1.06)

142
(5 studies)

⊕⊝⊝⊝
very low1,2,3

Clinical improvement

(0 studies)

Not reported

Side effects: nausea/vomiting

8 per 100

3 per 100
(0 to 15)

RR 0.32
(0.05 to 1.9)

100
(3 studies)

⊕⊝⊝⊝
very low1,2,3

Side effects: headache

8 per 100

2 per 100
(0 to 17)

RR 0.24
(0.03 to 2.06)

74
(2 studies)

⊕⊝⊝⊝
very low1,2,3

Serious adverse events

142
(5 studies)

Not reported

*The basis for the assumed risk (eg the median control group risk across studies) is provided in footnotes. The corresponding risk (and its 95% CI) is based on the assumed risk in the comparison group and the relative effect of the intervention (and its 95% CI).
CI: Confidence interval; RR: Risk Ratio

GRADE Working Group grades of evidence
High quality: Further research is very unlikely to change our confidence in the estimate of effect.
Moderate quality: Further research is likely to have an important impact on our confidence in the estimate of effect and may change the estimate.
Low quality: Further research is very likely to have an important impact on our confidence in the estimate of effect and is likely to change the estimate.
Very low quality: We are very uncertain about the estimate.

1These trials were conducted in adults and children from Spain, Turkey, and the UK. The usual dose of mebendazole was 200 mg three times daily for five to 10 days, and metronidazole 5 mg/kg (or 250 mg) three times daily for five to 10 days.
2 Downgraded by 1 for risk of bias. None of these trials adequately described allocation concealment or blinding.
3 Downgraded by 2 for imprecision. The trials were very small and underpowered to detect differences. The 95% CI is wide and includes no difference between treatments.

Figuras y tablas -

Tinidazole (single dose) compared to metronidazole (5+ days) for treating giardiasis

Patient or population: People with giardiasis infection
Settings: Endemic settings
Intervention: Tinidazole single dose
Comparison: Metronidazole three times daily for five or more days

Outcomes

Illustrative comparative risks* (95% CI)

Relative effect
(95% CI)

No of participants
(studies)

Quality of the evidence
(GRADE)

Comments

Assumed risk

Corresponding risk

Metronidazole
(three times daily for 5 to 10 days)

Tinidazole
(single dose)

Parasitological cure
(Follow‐up: 3 to 4 weeks)

73 per 100

89 per 100
(63 to 100)

RR 1.23
(0.87 to 1.73)

179
(3 studies)

⊕⊝⊝⊝
very low1,2,3

Clinical improvement
(Follow‐up: 3 to 4 weeks)

76 per 100

87 per 100
(76 to 100)

RR 1.15
(1 to 1.32)

179
(3 studies)

⊕⊝⊝⊝
very low1,2,3

Gastrointestinal side effects
(Follow‐up: 3 to 4 weeks)

8 per 100

5 per 100
(2 to 13)

RR 0.58
(0.21 to 1.62)

179
(3 studies)

⊕⊝⊝⊝
very low1,2,3

Neurological side effects
(Follow‐up: 3 to 4 weeks)

4 per 100

5 per 100
(1 to 22)

RR 1.3
(0.29 to 5.92)

138
(2 studies)

⊕⊝⊝⊝
very low1,2,3

Serious adverse events

179
(3 studies)

Not reported

GRADE Working Group grades of evidence
High quality: Further research is very unlikely to change our confidence in the estimate of effect.
Moderate quality: Further research is likely to have an important impact on our confidence in the estimate of effect and may change the estimate.
Low quality: Further research is very likely to have an important impact on our confidence in the estimate of effect and is likely to change the estimate.
Very low quality: We are very uncertain about the estimate.

1These trials were conducted in Iran, Spain and Peru. The usual dose of tinidazole was 50mg/kg as a single dose, and metronidazole 5 mg/kg (or 250 mg) three times daily for five to 10 days.
2 Downgraded by 1 for risk of bias. None of these trials adequately described allocation concealment or blinding.
3 Downgraded by 2 for imprecision. The trials were very small and underpowered to detect differences. The 95% CI is wide and includes no difference between treatments.

Figuras y tablas -
Comparison 1. Albendazole (once daily) versus metronidazole (three times daily)

Outcome or subgroup title

No. of studies

No. of participants

Statistical method

Effect size

1 Parasitological cure (at 1 to 3 weeks) Show forest plot

10

932

Risk Ratio (M‐H, Fixed, 95% CI)

0.99 [0.95, 1.03]

2 Time to achieve parasitological cure (hours) Show forest plot

1

57

Mean Difference (IV, Fixed, 95% CI)

‐19.0 [‐34.72, ‐3.28]

3 Clinical improvement (at 2 to 3 weeks) Show forest plot

5

483

Risk Ratio (M‐H, Fixed, 95% CI)

0.98 [0.93, 1.04]

4 Time of symptomatic improvement (hours) Show forest plot

2

97

Mean Difference (IV, Fixed, 95% CI)

‐5.69 [‐22.10, 10.73]

5 Other adverse events (gastrointestinal at 1 to 3 weeks) Show forest plot

8

717

Risk Ratio (M‐H, Random, 95% CI)

0.29 [0.13, 0.63]

6 Other adverse events (neurological at 1 to 3 weeks) Show forest plot

5

453

Risk Ratio (M‐H, Fixed, 95% CI)

0.34 [0.18, 0.64]

7 Other adverse events (metallic taste at 3 weeks) Show forest plot

3

327

Risk Ratio (M‐H, Fixed, 95% CI)

0.03 [0.01, 0.13]

8 Other adverse events (allergic/cutaneous at 3 weeks) Show forest plot

2

154

Risk Ratio (M‐H, Fixed, 95% CI)

0.2 [0.01, 4.08]

9 Other adverse events (fever at 3 weeks) Show forest plot

1

34

Risk Ratio (M‐H, Fixed, 95% CI)

1.0 [0.23, 4.27]

10 Other adverse events (transient elevation of liver enzymes at 3 weeks) Show forest plot

1

150

Risk Ratio (M‐H, Fixed, 95% CI)

1.0 [0.06, 15.69]

11 Other adverse (transient neutropenia at 3 weeks) Show forest plot

1

150

Risk Ratio (M‐H, Fixed, 95% CI)

5.0 [0.24, 102.42]

12 Non‐compliance to treatment (at 2 weeks) Show forest plot

1

57

Risk Ratio (M‐H, Fixed, 95% CI)

0.74 [0.27, 2.06]

Figuras y tablas -
Comparison 1. Albendazole (once daily) versus metronidazole (three times daily)
Comparison 2. Mebendazole (three times daily) versus metronidazole (three times daily)

Outcome or subgroup title

No. of studies

No. of participants

Statistical method

Effect size

1 Parasitological cure (at 1 to 2 weeks) Show forest plot

5

142

Risk Ratio (M‐H, Random, 95% CI)

0.58 [0.32, 1.06]

1.1 Children

3

100

Risk Ratio (M‐H, Random, 95% CI)

0.85 [0.62, 1.17]

1.2 Children and adults

2

42

Risk Ratio (M‐H, Random, 95% CI)

0.15 [0.05, 0.44]

2 Other adverse events (nausea/vomiting at 1 to 2 weeks) Show forest plot

3

100

Risk Ratio (M‐H, Fixed, 95% CI)

0.32 [0.05, 1.90]

3 Other adverse events (headache at 1 to 2 weeks) Show forest plot

2

74

Risk Ratio (M‐H, Fixed, 95% CI)

0.24 [0.03, 2.06]

4 Other adverse events (urticaria at 1 to 2 weeks) Show forest plot

1

Risk Ratio (M‐H, Fixed, 95% CI)

Totals not selected

Figuras y tablas -
Comparison 2. Mebendazole (three times daily) versus metronidazole (three times daily)
Comparison 3. Tinidazole (single dose) versus metronidazole (three times daily)

Outcome or subgroup title

No. of studies

No. of participants

Statistical method

Effect size

1 Parasitological cure (at 3 weeks to 1 month) Show forest plot

3

179

Risk Ratio (M‐H, Random, 95% CI)

1.23 [0.87, 1.73]

2 Clinical improvement (at 3 weeks to 1 month) Show forest plot

3

179

Risk Ratio (M‐H, Fixed, 95% CI)

1.20 [1.06, 1.36]

3 Other adverse events (gastrointestinal at 3 weeks to 1 month) Show forest plot

3

179

Risk Ratio (M‐H, Fixed, 95% CI)

0.58 [0.21, 1.62]

4 Other adverse events (neurological at 3 weeks to 1 month) Show forest plot

2

138

Risk Ratio (M‐H, Fixed, 95% CI)

1.30 [0.29, 5.92]

5 Other adverse events (allergic/cutaneous at 3 weeks to 1 month) Show forest plot

1

Risk Ratio (M‐H, Fixed, 95% CI)

Totals not selected

6 Other adverse events (fever at 3 weeks to 1 month) Show forest plot

1

Risk Ratio (M‐H, Fixed, 95% CI)

Totals not selected

7 Serious adverse events (at 3 weeks to 1 month) Show forest plot

3

179

Risk Ratio (M‐H, Fixed, 95% CI)

0.0 [0.0, 0.0]

Figuras y tablas -
Comparison 3. Tinidazole (single dose) versus metronidazole (three times daily)
Comparison 4. Metronidazole (single dose) versus metronidazole (three times daily)

Outcome or subgroup title

No. of studies

No. of participants

Statistical method

Effect size

1 Parasitological cure (at 2 weeks) Show forest plot

1

54

Risk Ratio (M‐H, Fixed, 95% CI)

1.0 [0.93, 1.08]

2 Other adverse events (gastrointestinal at 2 weeks) Show forest plot

1

54

Risk Ratio (M‐H, Fixed, 95% CI)

2.70 [0.26, 27.96]

3 Serious adverse events (at 2 weeks) Show forest plot

1

54

Risk Ratio (M‐H, Fixed, 95% CI)

0.0 [0.0, 0.0]

Figuras y tablas -
Comparison 4. Metronidazole (single dose) versus metronidazole (three times daily)
Comparison 5. Nitazoxanide (twice daily) versus metronidazole (twice daily)

Outcome or subgroup title

No. of studies

No. of participants

Statistical method

Effect size

1 Parasitological cure (at 1 week) Show forest plot

1

110

Risk Ratio (M‐H, Random, 95% CI)

0.95 [0.76, 1.20]

2 Reduction in symptoms of diarrhea (at 1 week) Show forest plot

1

110

Risk Ratio (M‐H, Random, 95% CI)

1.07 [0.90, 1.27]

3 Other adverse events (at 1 week) Show forest plot

1

110

Risk Ratio (M‐H, Fixed, 95% CI)

1.1 [0.51, 2.38]

4 Other adverse events (abdominal pain at 1 week) Show forest plot

1

110

Risk Ratio (M‐H, Fixed, 95% CI)

1.67 [0.65, 4.27]

5 Other adverse events (nausea/vomiting at 1 week) Show forest plot

1

110

Risk Ratio (M‐H, Fixed, 95% CI)

0.33 [0.01, 8.01]

6 Other adverse events (headache at 1 week) Show forest plot

1

110

Risk Ratio (M‐H, Fixed, 95% CI)

0.14 [0.01, 2.70]

Figuras y tablas -
Comparison 5. Nitazoxanide (twice daily) versus metronidazole (twice daily)