Agentes antidiabéticos orales para mujeres con diabetes establecida/tolerancia a la glucosa alterada o diabetes gestacional previa que planifican un embarazo, o embarazadas con diabetes preexistente
Información
- DOI:
- https://doi.org/10.1002/14651858.CD007724.pub3Copiar DOI

- Base de datos:
-
- Cochrane Database of Systematic Reviews
- Versión publicada:
-
- 18 octubre 2017see what's new
- Tipo:
-
- Intervention
- Etapa:
-
- Review
- Grupo Editorial Cochrane:
-
Grupo Cochrane de Embarazo y parto
- Copyright:
-
- Copyright © 2017 The Cochrane Collaboration. Published by John Wiley & Sons, Ltd.
Cifras del artículo
Altmetric:
Citado por:
Autores
Contributions of authors
Joanna Tieu wrote the protocol and the first version of this review with help from Philippa Middleton. Philippa Middleton, Suzette Coat and William Hague were involved in editing.
For this 2017 update, Emily Shepherd and Joanna Tieu screened studies for inclusion, extracted data and assessed quality for included trials. Emily Shepherd wrote the text with input and feedback from Joanna Tieu, Philippa Middleton, Suzette Coat and William Hague.
Sources of support
Internal sources
-
ARCH: Australian Research Centre for Health of Women and Babies, Robinson Research Institute, The University of Adelaide, Australia.
External sources
-
NHMRC: National Health and Medical Research Council, Australia.
Funding for the Pregnancy and Childbirth Australian and New Zealand Satellite
-
NIHR: National Institute for Health Research, UK.
Cochrane Programme Grant Project: 13/89/05 – Pregnancy and childbirth systematic reviews to support clinical
guidelines
Declarations of interest
Joanna Tieu is supported by an NHMRC postgraduate scholarship and Arthritis Australia Ken Muirden fellowship (jointly funded by the Australian Rheumatology Association and Roche).
Suzette Coat is involved in the conduct of the Treatment of Booking Gestational diabetes Mellitus Study (TOBoGM), Bishop 2017. This study seeks to determine whether diagnosis and treatment of gestational diabetes mellitus in the first trimester in women with risk factors for overt diabetes is beneficial to the woman and her fetus/baby.
William Hague: I am a chief investigator (CIB) for the Treatment of Booking GDM trial (TOBoGM), Bishop 2017, currently funded by a NHMRC project grant. I was an AI in the Mothers After Gestational Diabetes in Australia (MAGDA) study (O'Reilly 2016), and also a co‐author on some of the work by Van Ryswyk 2016, which impinge on this review. This was taken into account when writing the review.
Philippa Middleton: none known.
Emily Shepherd: none known.
Acknowledgements
We acknowledge the support from the Cochrane Pregnancy and Childbirth editorial team in Liverpool, and the Australia and New Zealand Satellite of Cochrane Pregnancy and Childbirth (funded by the Australian National Health and Medical Research Council (NHMRC)).
We thank Therese Dowswell from Cochrane Pregnancy and Childbirth who provided support for this update (including duplicate study screening, data extraction and quality assessment; and generation of the 'Summary of findings' tables). Therese Dowswell's contribution to this project was supported by the National Institute for Health Research (NIHR), via Cochrane programme grant funding to Cochrane Pregnancy and Childbirth. The views and opinions expressed herein are those of the authors and do not necessarily reflect those of the Systematic Reviews Programme, NIHR, National Health Service or the Department of Health.
As part of the prepublication editorial process, this review has been commented on by two peers (an editor and referee who is external to the editorial team), a member of the Pregnancy and Childbirth's international panel of consumers and the Statistical Adviser.
Version history
| Published | Title | Stage | Authors | Version |
| 2017 Oct 18 | Oral anti‐diabetic agents for women with established diabetes/impaired glucose tolerance or previous gestational diabetes planning pregnancy, or pregnant women with pre‐existing diabetes | Review | Joanna Tieu, Suzette Coat, William Hague, Philippa Middleton, Emily Shepherd | |
| 2010 Oct 06 | Oral anti‐diabetic agents for women with pre‐existing diabetes mellitus/impaired glucose tolerance or previous gestational diabetes mellitus | Review | Joanna Tieu, Suzette Coat, William Hague, Philippa Middleton | |
| 2009 Apr 15 | Oral anti‐diabetic agents for women with pre‐existing diabetes mellitus/impaired glucose tolerance or previous gestational diabetes mellitus | Protocol | Joanna Tieu, Suzette Coat, William Hague, Philippa Middleton | |
Differences between protocol and review
For this update, we have revised the outcomes, using the standard outcome set agreed by consensus between review authors of Cochrane Pregnancy and Childbirth systematic reviews for prevention and treatment of gestational diabetes mellitus and pre‐existing diabetes (which we adapted, as appropriate for this review question).
We updated the methods so that they met those outlined in the standard template used by Cochrane Pregnancy and Childbirth (including use of the GRADE approach to assess the quality of the body of evidence and the use of 'Summary of findings' tables).
Keywords
MeSH
Medical Subject Headings (MeSH) Keywords
- Administration, Oral;
- Diabetes Mellitus [*drug therapy];
- Diabetes, Gestational [drug therapy];
- Glucose Intolerance [*drug therapy];
- Hypoglycemia [chemically induced];
- Hypoglycemic Agents [*administration & dosage];
- Insulin [therapeutic use];
- Metformin [therapeutic use];
- Randomized Controlled Trials as Topic;
Medical Subject Headings Check Words
Female; Humans; Pregnancy;
PICO

Study flow diagram
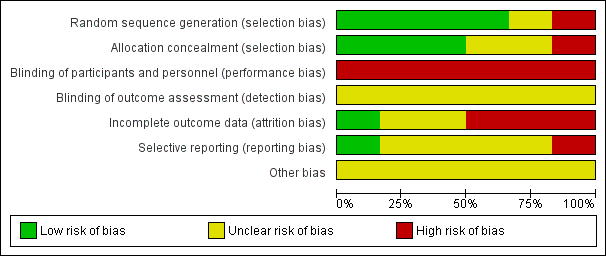
Risk of bias graph: review authors' judgements about each risk of bias item presented as percentages across all included studies
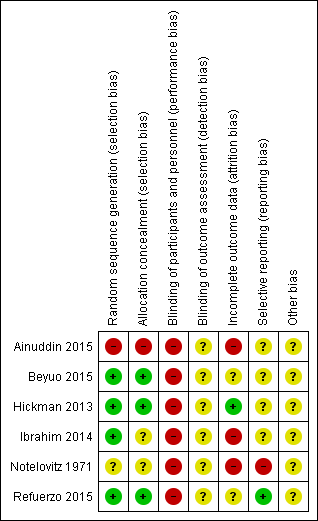
Risk of bias summary: review authors' judgements about each risk of bias item for each included study

Comparison 1 Oral anti‐diabetic agent (metformin) versus insulin, Outcome 1 Hypertensive disorders of pregnancy: pre‐eclampsia.
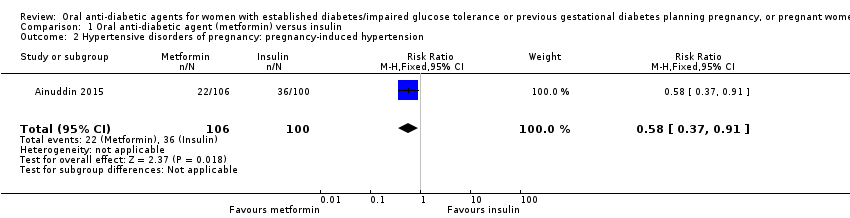
Comparison 1 Oral anti‐diabetic agent (metformin) versus insulin, Outcome 2 Hypertensive disorders of pregnancy: pregnancy‐induced hypertension.

Comparison 1 Oral anti‐diabetic agent (metformin) versus insulin, Outcome 3 Caesarean section.

Comparison 1 Oral anti‐diabetic agent (metformin) versus insulin, Outcome 4 Large‐for‐gestational age.

Comparison 1 Oral anti‐diabetic agent (metformin) versus insulin, Outcome 5 Perinatal mortality.

Comparison 1 Oral anti‐diabetic agent (metformin) versus insulin, Outcome 6 Miscarriage.

Comparison 1 Oral anti‐diabetic agent (metformin) versus insulin, Outcome 7 Induction of labour.

Comparison 1 Oral anti‐diabetic agent (metformin) versus insulin, Outcome 8 Postpartum haemorrhage.
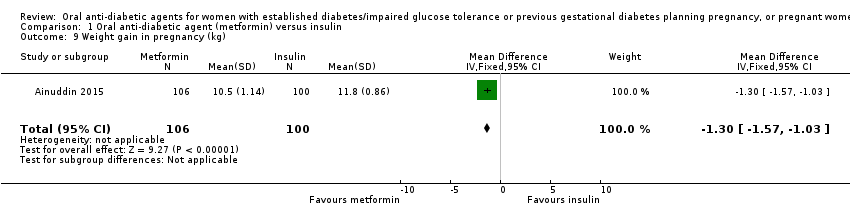
Comparison 1 Oral anti‐diabetic agent (metformin) versus insulin, Outcome 9 Weight gain in pregnancy (kg).
| Study | Metformin (N=9) | Insulin (N=6) |
| Hickman 2013 | Median (IQR): 3.16 (2.88, 4.50) | Median (IQR): 10.78 (8.15, 14.42) |
Comparison 1 Oral anti‐diabetic agent (metformin) versus insulin, Outcome 10 Weight gain in pregnancy (kg).

Comparison 1 Oral anti‐diabetic agent (metformin) versus insulin, Outcome 11 Adherence to the intervention (how often did you forget to take treatment?).

Comparison 1 Oral anti‐diabetic agent (metformin) versus insulin, Outcome 12 Adherence to the intervention.
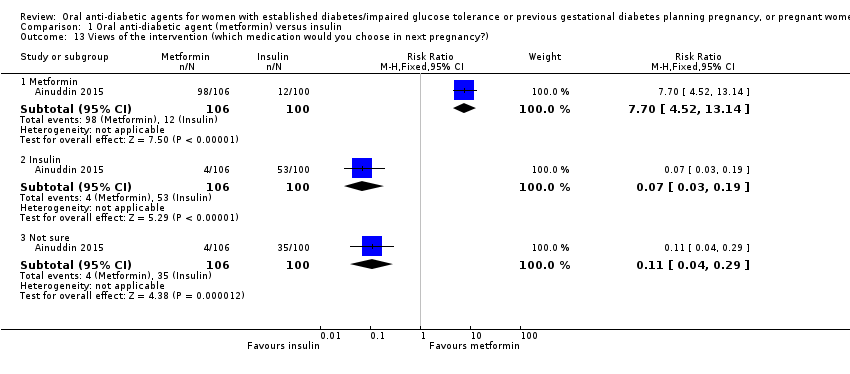
Comparison 1 Oral anti‐diabetic agent (metformin) versus insulin, Outcome 13 Views of the intervention (which medication would you choose in next pregnancy?).

Comparison 1 Oral anti‐diabetic agent (metformin) versus insulin, Outcome 14 Views of the intervention (which part of diabetes treatment was easy?).

Comparison 1 Oral anti‐diabetic agent (metformin) versus insulin, Outcome 15 Views of the intervention (which part of diabetes treatment was difficult?).
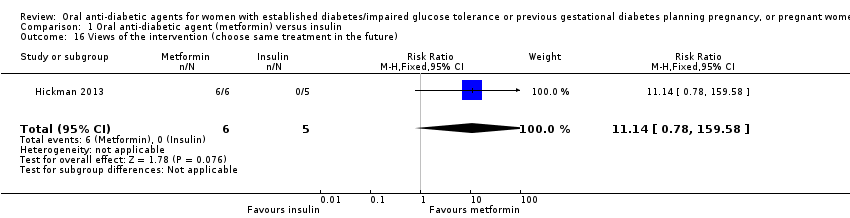
Comparison 1 Oral anti‐diabetic agent (metformin) versus insulin, Outcome 16 Views of the intervention (choose same treatment in the future).
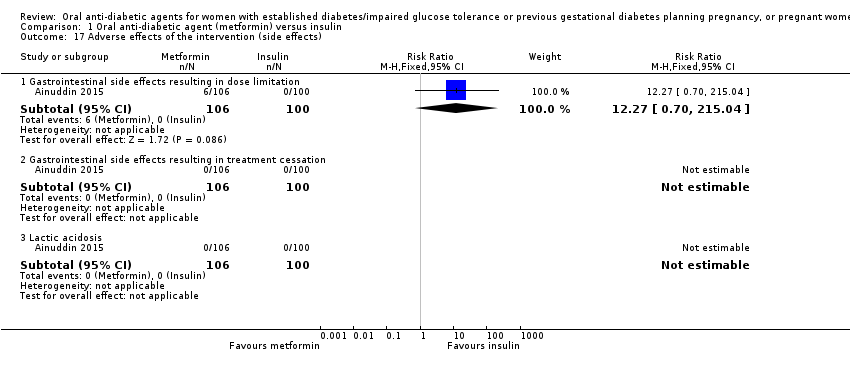
Comparison 1 Oral anti‐diabetic agent (metformin) versus insulin, Outcome 17 Adverse effects of the intervention (side effects).
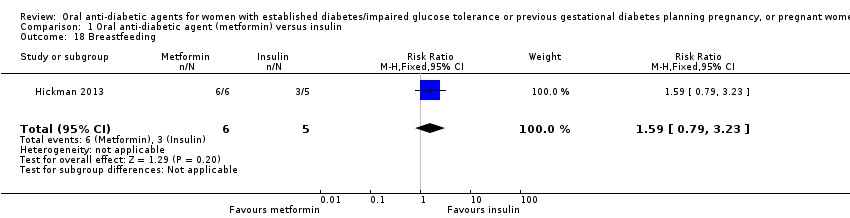
Comparison 1 Oral anti‐diabetic agent (metformin) versus insulin, Outcome 18 Breastfeeding.
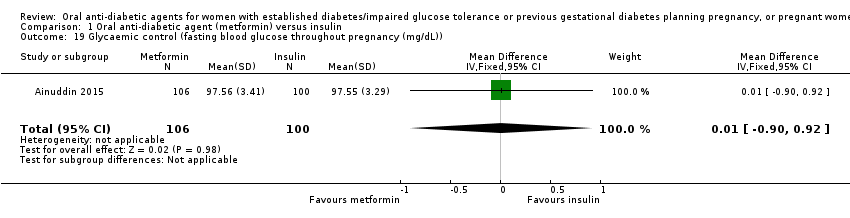
Comparison 1 Oral anti‐diabetic agent (metformin) versus insulin, Outcome 19 Glycaemic control (fasting blood glucose throughout pregnancy (mg/dL)).
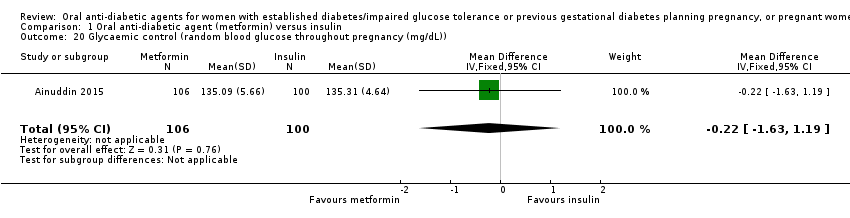
Comparison 1 Oral anti‐diabetic agent (metformin) versus insulin, Outcome 20 Glycaemic control (random blood glucose throughout pregnancy (mg/dL)).
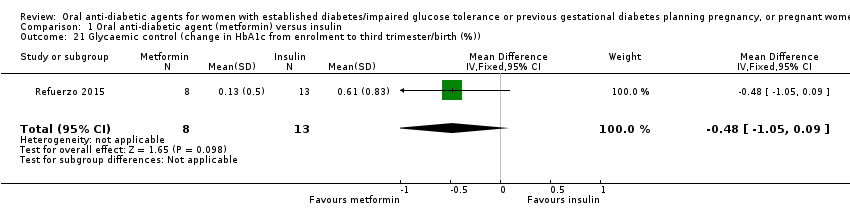
Comparison 1 Oral anti‐diabetic agent (metformin) versus insulin, Outcome 21 Glycaemic control (change in HbA1c from enrolment to third trimester/birth (%)).
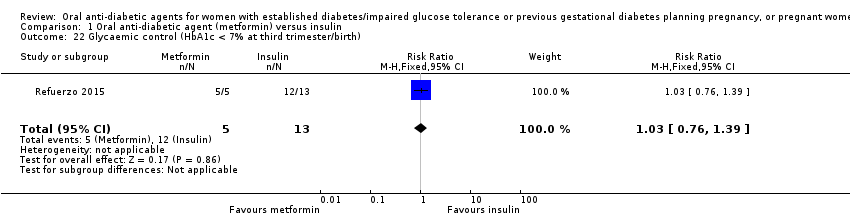
Comparison 1 Oral anti‐diabetic agent (metformin) versus insulin, Outcome 22 Glycaemic control (HbA1c < 7% at third trimester/birth).
| Study | Metformin (N=8) | Insulin (N=6) |
| Hickman 2013 | HbA1c 2nd trimester (%) Median (IQR): 5.55 (5.54, 5.70) | HbA1c 2nd trimester (%) Median (IQR): 5.70 (5.35, 6.28) |
| Hickman 2013 | HbA1c 3rd trimester (%) Median (IQR): 5.85 (5.73, 6.00) | HbA1c 3rd trimester (%) Median (IQR): 5.85 (5.53, 6.55) |
| Hickman 2013 | Delivery glucose (mg/dL) Median (IQR): 96.00 (92.00, 113.00) | Delivery glucose (mg/dL) Median (IQR): 127.50 (109.25, 122.00) |
| Hickman 2013 | Postpartum fasting glucose (mg/dL) Median (IQR): 97.50 (78.50, 108.75) | Postpartum fasting glucose (mg/dL) Median (IQR): 125.50 (109.75, 136.75) |
Comparison 1 Oral anti‐diabetic agent (metformin) versus insulin, Outcome 23 Glycaemic control.
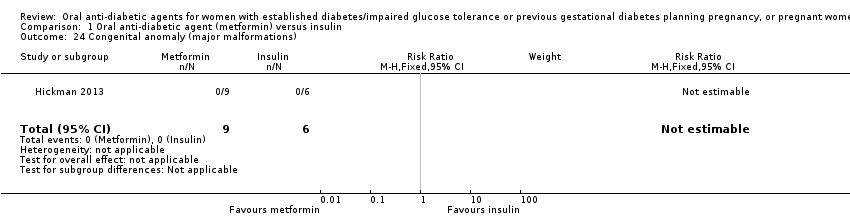
Comparison 1 Oral anti‐diabetic agent (metformin) versus insulin, Outcome 24 Congenital anomaly (major malformations).
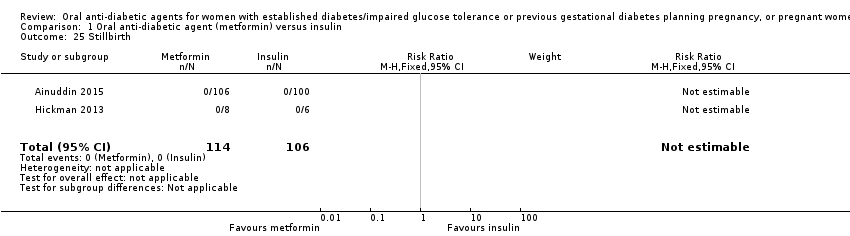
Comparison 1 Oral anti‐diabetic agent (metformin) versus insulin, Outcome 25 Stillbirth.
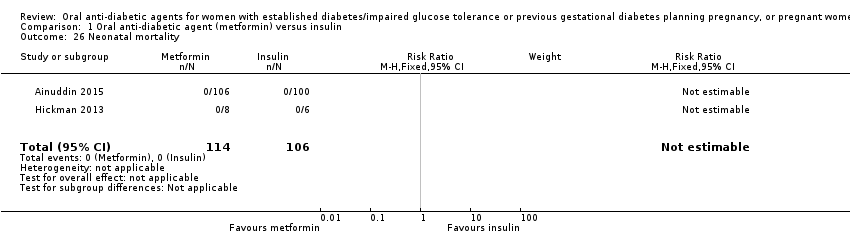
Comparison 1 Oral anti‐diabetic agent (metformin) versus insulin, Outcome 26 Neonatal mortality.
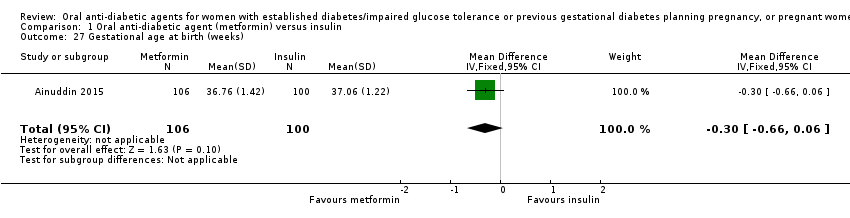
Comparison 1 Oral anti‐diabetic agent (metformin) versus insulin, Outcome 27 Gestational age at birth (weeks).
| Study | Metformin | Insulin | P value |
| Hickman 2013 | Median (IQR): 38.40 (37.10, 38.86) N=9 | Median (IQR): 37.50 (35.79, 38.00) N=6 | |
| Refuerzo 2015 | Median (range): 37 (35‐40) N=8 | Median (range): 37 (35‐41) N=13 | 0.977 |
Comparison 1 Oral anti‐diabetic agent (metformin) versus insulin, Outcome 28 Gestational age at birth (weeks).

Comparison 1 Oral anti‐diabetic agent (metformin) versus insulin, Outcome 29 Preterm birth.

Comparison 1 Oral anti‐diabetic agent (metformin) versus insulin, Outcome 30 Apgar score < 7 at 5 minutes.

Comparison 1 Oral anti‐diabetic agent (metformin) versus insulin, Outcome 31 Macrosomia (> 4000 g).
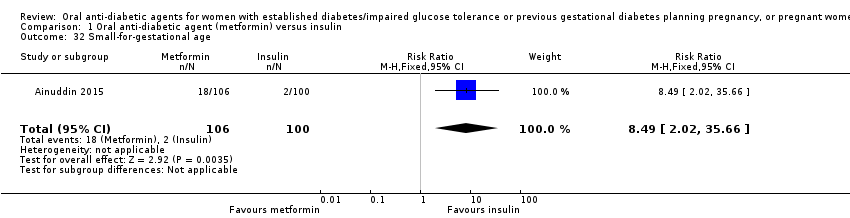
Comparison 1 Oral anti‐diabetic agent (metformin) versus insulin, Outcome 32 Small‐for‐gestational age.
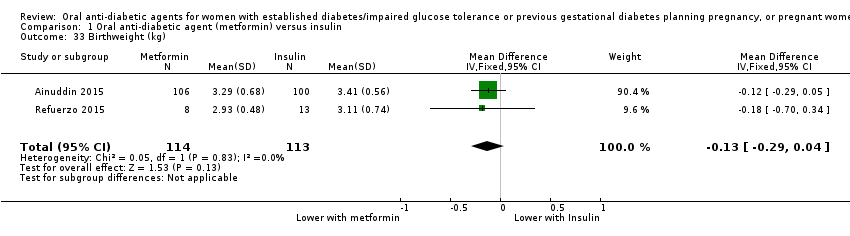
Comparison 1 Oral anti‐diabetic agent (metformin) versus insulin, Outcome 33 Birthweight (kg).
| Study | Metformin (N=8) | Insulin (N=6) |
| Hickman 2013 | Median (IQR): 3071.50 (2978.75, 3237.75) | Median (IQR): 3295.50 (2964.25, 3566.75) |
Comparison 1 Oral anti‐diabetic agent (metformin) versus insulin, Outcome 34 Birthweight (g).
| Study | Metformin (N=8) | Insulin (N=6) |
| Hickman 2013 | Median (IQR): 33.50 (32.48, 34.63) | Median (IQR): 33.50 (32.25, 34.75) |
Comparison 1 Oral anti‐diabetic agent (metformin) versus insulin, Outcome 35 Head circumference (cm).
| Study | Metformin (N=8) | Insulin (N=6) |
| Hickman 2013 | Median (IQR): 49.00 (48.07, 50.53) | Median (IQR): 49.50 (48.45, 52.25) |
Comparison 1 Oral anti‐diabetic agent (metformin) versus insulin, Outcome 36 Length (cm).

Comparison 1 Oral anti‐diabetic agent (metformin) versus insulin, Outcome 37 Shoulder dystocia.

Comparison 1 Oral anti‐diabetic agent (metformin) versus insulin, Outcome 38 Bone fracture (birth injury/birth trauma with clavicle fracture).

Comparison 1 Oral anti‐diabetic agent (metformin) versus insulin, Outcome 39 Respiratory distress syndrome.

Comparison 1 Oral anti‐diabetic agent (metformin) versus insulin, Outcome 40 Hypoglycaemia.
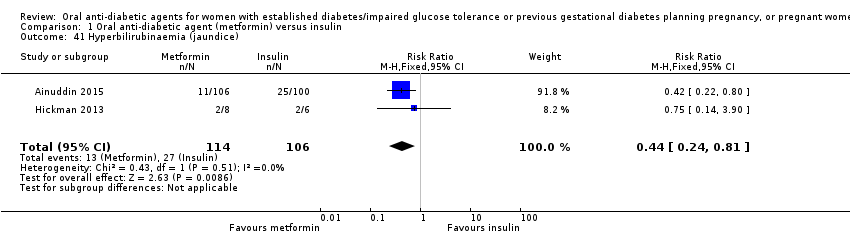
Comparison 1 Oral anti‐diabetic agent (metformin) versus insulin, Outcome 41 Hyperbilirubinaemia (jaundice).
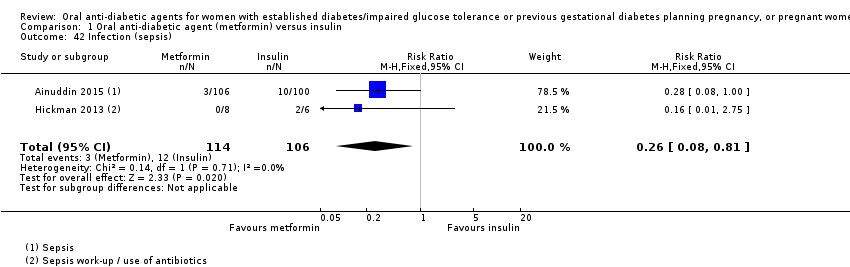
Comparison 1 Oral anti‐diabetic agent (metformin) versus insulin, Outcome 42 Infection (sepsis).
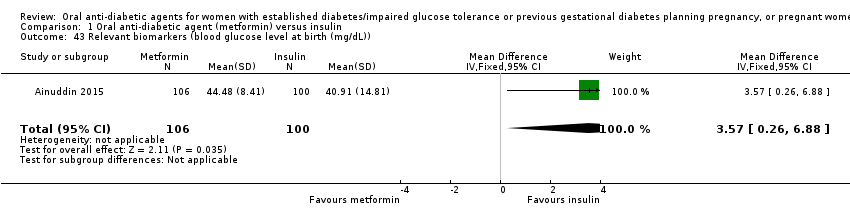
Comparison 1 Oral anti‐diabetic agent (metformin) versus insulin, Outcome 43 Relevant biomarkers (blood glucose level at birth (mg/dL)).
| Study | Metformin (N=6) | Insulin (N=4) |
| Hickman 2013 | Median (IQR): 1.25 (0.92, 1.65) | Median (IQR): 3.95 (2.78, 5.13) |
Comparison 1 Oral anti‐diabetic agent (metformin) versus insulin, Outcome 44 Relevant biomarker (cord C peptide).

Comparison 1 Oral anti‐diabetic agent (metformin) versus insulin, Outcome 45 Number of antenatal admissions.
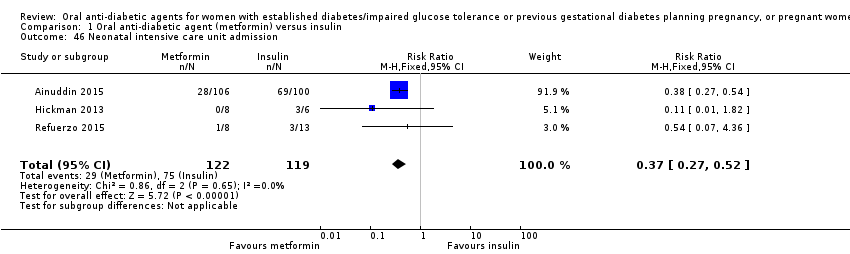
Comparison 1 Oral anti‐diabetic agent (metformin) versus insulin, Outcome 46 Neonatal intensive care unit admission.
| Study | Metformin | Insulin | P value |
| Refuerzo 2015 | Median (range): 3 (1‐8) N=8 | Median (range): 2 (1‐12) N=13 | 0.697 |
Comparison 1 Oral anti‐diabetic agent (metformin) versus insulin, Outcome 47 Length of postnatal stay (baby) (days).

Comparison 1 Oral anti‐diabetic agent (metformin) versus insulin, Outcome 48 Cost of maternal care (total cost of treatment throughout pregnancy (USD)).
| Maternal outcomes: oral anti‐diabetic agent (metformin) compared with insulin for women with established type 2 diabetes mellitus | ||||||
| Patient or population: women with type 2 diabetes | ||||||
| Outcomes | Anticipated absolute effects* (95% CI) | Relative effect | № of participants | Quality of the evidence | Comments | |
| Risk with insulin | Risk with oral anti‐diabetic (metformin) | |||||
| Hypertensive disorders of pregnancy: pre‐eclampsia | Study population | RR 0.63 | 227 | ⊕⊝⊝⊝ | ||
| 186 per 1000 | 117 per 1000 | |||||
| Hypertensive disorders of pregnancy: pregnancy‐induced hypertension | Study population | RR 0.58 | 206 | ⊕⊕⊝⊝ | ||
| 360 per 1000 | 209 per 1000 | |||||
| Caesarean section | Study population | RR 0.73 | 241 | ⊕⊕⊝⊝ | ||
| 765 per 1000 | 558 per 1000 | |||||
| Induction of labour | Study population | RR 1.42 | 35 | ⊕⊝⊝⊝ | ||
| 316 per 1000 | 448 per 1000 | |||||
| Perineal trauma | Study population | ‐ | (0 RCTs) | ‐ | None of the included RCTs reported this outcome | |
| See comment | See comment | |||||
| Postnatal depression | Study population | ‐ | (0 RCTs) | ‐ | None of the included RCTs reported these outcomes | |
| See comment | See comment | |||||
| Postnatal weight retention | Study population | ‐ | (0 RCTs) | ‐ | None of the included RCTs reported these outcomes | |
| See comment | See comment | |||||
| *The risk in the intervention group (and its 95% confidence interval) is based on the assumed risk in the comparison group and the relative effect of the intervention (and its 95% CI). | ||||||
| GRADE Working Group grades of evidence | ||||||
| 1 Study limitations (‐2): most of the weight in this analysis was from 1 RCT with very serious design limitations 2 Imprecision (‐2): wide 95% CI crossing the line of no effect and small sample sizes of RCTs 3 Study limitations (‐2): 1 RCT with very serious design limitations contributed data 4 Study limitations (‐1): 2 RCTs with design limitations contributed data | ||||||
| Infant outcomes: oral anti‐diabetic (metformin) compared with insulin for women with established diabetes | ||||||
| Patient or population: women with type 2 diabetes mellitus | ||||||
| Outcomes | Anticipated absolute effects* (95% CI) | Relative effect | № of participants | Quality of the evidence | Comments | |
| Risk with insulin | Risk with oral anti‐diabetic (metformin) | |||||
| Large‐for‐gestational age | Study population | RR 1.12 | 206 | ⊕⊝⊝⊝ | ||
| 270 per 1000 | 302 per 1000 | |||||
| Perinatal mortality | Study population | ‐ | 220 | ⊕⊝⊝⊝ | No perinatal mortality in the 2 RCTs | |
| See comment | See comment | |||||
| Hypoglycaemia | Study population | RR 0.34 | 241 | ⊕⊝⊝⊝ | ||
| 277 per 1000 | 94 per 1000 | |||||
| Neonatal mortality or morbidity composite | Study population | ‐ | (0 studies) | ‐ | None of the included RCTs reported this outcome | |
| See comment | See comment | |||||
| Childhood/adulthood neurosensory disability | Study population | ‐ | (0 studies) | ‐ | None of the included RCTs reported this outcome | |
| See comment | See comment | |||||
| Childhood/adulthood adiposity | Study population | ‐ | (0 studies) | ‐ | None of the included RCTs reported this outcome | |
| See comment | See comment | |||||
| Childhood/adulthood diabetes | Study population | ‐ | (0 studies) | ‐ | None of the included RCTs reported this outcome | |
| See comment | See comment | |||||
| *The risk in the intervention group (and its 95% confidence interval) is based on the assumed risk in the comparison group and the relative effect of the intervention (and its 95% CI). | ||||||
| GRADE Working Group grades of evidence | ||||||
| 1 Study limitations (‐2): 1 RCT with very serious design limitations contributed data 2 Imprecision (‐2): wide 95% CI crossing the line of no effect and small sample size of RCT 3 Study limitations (‐1): 2 RCTs with design limitations contributed data 4 Imprecision (‐2): no events 5 Study limitations (‐2): most of the weight in this analysis was from 1 RCT with very serious design limitations 6 Imprecision (‐1): small sample sizes of RCTs | ||||||
| Outcome or subgroup title | No. of studies | No. of participants | Statistical method | Effect size |
| 1 Hypertensive disorders of pregnancy: pre‐eclampsia Show forest plot | 2 | 227 | Risk Ratio (M‐H, Fixed, 95% CI) | 0.63 [0.33, 1.20] |
| 2 Hypertensive disorders of pregnancy: pregnancy‐induced hypertension Show forest plot | 1 | 206 | Risk Ratio (M‐H, Fixed, 95% CI) | 0.58 [0.37, 0.91] |
| 3 Caesarean section Show forest plot | 3 | 241 | Risk Ratio (M‐H, Fixed, 95% CI) | 0.73 [0.61, 0.88] |
| 4 Large‐for‐gestational age Show forest plot | 1 | 206 | Risk Ratio (M‐H, Fixed, 95% CI) | 1.12 [0.73, 1.72] |
| 5 Perinatal mortality Show forest plot | 2 | 220 | Risk Ratio (M‐H, Fixed, 95% CI) | 0.0 [0.0, 0.0] |
| 6 Miscarriage Show forest plot | 1 | 15 | Risk Ratio (M‐H, Fixed, 95% CI) | 2.1 [0.10, 44.40] |
| 7 Induction of labour Show forest plot | 2 | 35 | Risk Ratio (M‐H, Fixed, 95% CI) | 1.42 [0.62, 3.28] |
| 8 Postpartum haemorrhage Show forest plot | 1 | 14 | Risk Ratio (M‐H, Fixed, 95% CI) | 0.0 [0.0, 0.0] |
| 9 Weight gain in pregnancy (kg) Show forest plot | 1 | 206 | Mean Difference (IV, Fixed, 95% CI) | ‐1.30 [‐1.57, ‐1.03] |
| 10 Weight gain in pregnancy (kg) Show forest plot | Other data | No numeric data | ||
| 11 Adherence to the intervention (how often did you forget to take treatment?) Show forest plot | 1 | Risk Ratio (M‐H, Fixed, 95% CI) | Subtotals only | |
| 11.1 Never or rarely | 1 | 206 | Risk Ratio (M‐H, Fixed, 95% CI) | 1.37 [1.14, 1.64] |
| 11.2 2 to 4 times/week | 1 | 206 | Risk Ratio (M‐H, Fixed, 95% CI) | 0.45 [0.28, 0.72] |
| 12 Adherence to the intervention Show forest plot | 1 | Risk Ratio (M‐H, Fixed, 95% CI) | Subtotals only | |
| 12.1 No missed appointments | 1 | 15 | Risk Ratio (M‐H, Fixed, 95% CI) | 2.0 [0.59, 6.79] |
| 12.2 Log book completed > 50% | 1 | 15 | Risk Ratio (M‐H, Fixed, 95% CI) | 1.9 [0.89, 4.04] |
| 13 Views of the intervention (which medication would you choose in next pregnancy?) Show forest plot | 1 | Risk Ratio (M‐H, Fixed, 95% CI) | Subtotals only | |
| 13.1 Metformin | 1 | 206 | Risk Ratio (M‐H, Fixed, 95% CI) | 7.70 [4.52, 13.14] |
| 13.2 Insulin | 1 | 206 | Risk Ratio (M‐H, Fixed, 95% CI) | 0.07 [0.03, 0.19] |
| 13.3 Not sure | 1 | 206 | Risk Ratio (M‐H, Fixed, 95% CI) | 0.11 [0.04, 0.29] |
| 14 Views of the intervention (which part of diabetes treatment was easy?) Show forest plot | 1 | Risk Ratio (M‐H, Fixed, 95% CI) | Subtotals only | |
| 14.1 Doing finger pricks | 1 | 206 | Risk Ratio (M‐H, Fixed, 95% CI) | 0.0 [0.0, 0.0] |
| 14.2 Diet control | 1 | 206 | Risk Ratio (M‐H, Fixed, 95% CI) | 0.02 [0.00, 0.30] |
| 14.3 Drug treatment | 1 | 206 | Risk Ratio (M‐H, Fixed, 95% CI) | 1.33 [1.19, 1.49] |
| 15 Views of the intervention (which part of diabetes treatment was difficult?) Show forest plot | 1 | Risk Ratio (M‐H, Fixed, 95% CI) | Subtotals only | |
| 15.1 Doing finger pricks | 1 | 206 | Risk Ratio (M‐H, Fixed, 95% CI) | 3.46 [2.42, 4.95] |
| 15.2 Diet control | 1 | 206 | Risk Ratio (M‐H, Fixed, 95% CI) | 0.75 [0.31, 1.84] |
| 15.3 Drug treatment | 1 | 206 | Risk Ratio (M‐H, Fixed, 95% CI) | 0.14 [0.08, 0.26] |
| 16 Views of the intervention (choose same treatment in the future) Show forest plot | 1 | 11 | Risk Ratio (M‐H, Fixed, 95% CI) | 11.14 [0.78, 159.58] |
| 17 Adverse effects of the intervention (side effects) Show forest plot | 1 | Risk Ratio (M‐H, Fixed, 95% CI) | Subtotals only | |
| 17.1 Gastrointestinal side effects resulting in dose limitation | 1 | 206 | Risk Ratio (M‐H, Fixed, 95% CI) | 12.27 [0.70, 215.04] |
| 17.2 Gastrointestinal side effects resulting in treatment cessation | 1 | 206 | Risk Ratio (M‐H, Fixed, 95% CI) | 0.0 [0.0, 0.0] |
| 17.3 Lactic acidosis | 1 | 206 | Risk Ratio (M‐H, Fixed, 95% CI) | 0.0 [0.0, 0.0] |
| 18 Breastfeeding Show forest plot | 1 | 11 | Risk Ratio (M‐H, Fixed, 95% CI) | 1.59 [0.79, 3.23] |
| 19 Glycaemic control (fasting blood glucose throughout pregnancy (mg/dL)) Show forest plot | 1 | 206 | Mean Difference (IV, Fixed, 95% CI) | 0.01 [‐0.90, 0.92] |
| 20 Glycaemic control (random blood glucose throughout pregnancy (mg/dL)) Show forest plot | 1 | 206 | Mean Difference (IV, Fixed, 95% CI) | ‐0.22 [‐1.63, 1.19] |
| 21 Glycaemic control (change in HbA1c from enrolment to third trimester/birth (%)) Show forest plot | 1 | 21 | Mean Difference (IV, Fixed, 95% CI) | ‐0.48 [‐1.05, 0.09] |
| 22 Glycaemic control (HbA1c < 7% at third trimester/birth) Show forest plot | 1 | 18 | Risk Ratio (M‐H, Fixed, 95% CI) | 1.03 [0.76, 1.39] |
| 23 Glycaemic control Show forest plot | Other data | No numeric data | ||
| 24 Congenital anomaly (major malformations) Show forest plot | 1 | 15 | Risk Ratio (M‐H, Fixed, 95% CI) | 0.0 [0.0, 0.0] |
| 25 Stillbirth Show forest plot | 2 | 220 | Risk Ratio (M‐H, Fixed, 95% CI) | 0.0 [0.0, 0.0] |
| 26 Neonatal mortality Show forest plot | 2 | 220 | Risk Ratio (M‐H, Fixed, 95% CI) | 0.0 [0.0, 0.0] |
| 27 Gestational age at birth (weeks) Show forest plot | 1 | 206 | Mean Difference (IV, Fixed, 95% CI) | ‐0.30 [‐0.66, 0.06] |
| 28 Gestational age at birth (weeks) Show forest plot | Other data | No numeric data | ||
| 29 Preterm birth Show forest plot | 2 | 35 | Risk Ratio (M‐H, Fixed, 95% CI) | 0.42 [0.08, 2.30] |
| 30 Apgar score < 7 at 5 minutes Show forest plot | 1 | 14 | Risk Ratio (M‐H, Fixed, 95% CI) | 0.0 [0.0, 0.0] |
| 31 Macrosomia (> 4000 g) Show forest plot | 2 | 35 | Risk Ratio (M‐H, Fixed, 95% CI) | 0.37 [0.04, 3.10] |
| 32 Small‐for‐gestational age Show forest plot | 1 | 206 | Risk Ratio (M‐H, Fixed, 95% CI) | 8.49 [2.02, 35.66] |
| 33 Birthweight (kg) Show forest plot | 2 | 227 | Mean Difference (IV, Fixed, 95% CI) | ‐0.13 [‐0.29, 0.04] |
| 34 Birthweight (g) Show forest plot | Other data | No numeric data | ||
| 35 Head circumference (cm) Show forest plot | Other data | No numeric data | ||
| 36 Length (cm) Show forest plot | Other data | No numeric data | ||
| 37 Shoulder dystocia Show forest plot | 2 | 35 | Risk Ratio (M‐H, Fixed, 95% CI) | 4.67 [0.21, 102.47] |
| 38 Bone fracture (birth injury/birth trauma with clavicle fracture) Show forest plot | 2 | 220 | Risk Ratio (M‐H, Fixed, 95% CI) | 0.94 [0.14, 6.57] |
| 39 Respiratory distress syndrome Show forest plot | 3 | 241 | Risk Ratio (M‐H, Fixed, 95% CI) | 0.52 [0.24, 1.13] |
| 40 Hypoglycaemia Show forest plot | 3 | 241 | Risk Ratio (M‐H, Fixed, 95% CI) | 0.34 [0.18, 0.62] |
| 41 Hyperbilirubinaemia (jaundice) Show forest plot | 2 | 220 | Risk Ratio (M‐H, Fixed, 95% CI) | 0.44 [0.24, 0.81] |
| 42 Infection (sepsis) Show forest plot | 2 | 220 | Risk Ratio (M‐H, Fixed, 95% CI) | 0.26 [0.08, 0.81] |
| 43 Relevant biomarkers (blood glucose level at birth (mg/dL)) Show forest plot | 1 | 206 | Mean Difference (IV, Fixed, 95% CI) | 3.57 [0.26, 6.88] |
| 44 Relevant biomarker (cord C peptide) Show forest plot | Other data | No numeric data | ||
| 45 Number of antenatal admissions Show forest plot | 1 | 15 | Risk Ratio (M‐H, Fixed, 95% CI) | 0.22 [0.03, 1.66] |
| 46 Neonatal intensive care unit admission Show forest plot | 3 | 241 | Risk Ratio (M‐H, Fixed, 95% CI) | 0.37 [0.27, 0.52] |
| 47 Length of postnatal stay (baby) (days) Show forest plot | Other data | No numeric data | ||
| 48 Cost of maternal care (total cost of treatment throughout pregnancy (USD)) Show forest plot | 1 | 206 | Mean Difference (IV, Fixed, 95% CI) | ‐65.3 [‐77.92, ‐52.68] |