Intervenciones farmacológicas y mecánicas para la inducción del trabajo de parto en el ámbito ambulatorio
Información
- DOI:
- https://doi.org/10.1002/14651858.CD007701.pub3Copiar DOI

- Base de datos:
-
- Cochrane Database of Systematic Reviews
- Versión publicada:
-
- 13 septiembre 2017see what's new
- Tipo:
-
- Intervention
- Etapa:
-
- Review
- Grupo Editorial Cochrane:
-
Grupo Cochrane de Embarazo y parto
- Copyright:
-
- Copyright © 2017 The Cochrane Collaboration. Published by John Wiley & Sons, Ltd.
Cifras del artículo
Altmetric:
Citado por:
Autores
Contributions of authors
For the trials added to this review update, Joshua Vogel and Alfred Osoti assessed study eligibility, carried out data extraction and data entry, analysed results and drafted text of the review. All authors reviewed and agreed on the final text of this review. Zarko Alfirevic is guarantor for the review.
Sources of support
Internal sources
-
The University of Liverpool, UK.
External sources
-
No sources of support supplied
Declarations of interest
Joshua P Vogel: none known.
Alfred O Osoti: none known.
Anthony J Kelly: none known.
Stefania Livio: none known.
Jane E Norman: Jane Norman was an investigator on two trials included in this review (Bollapragada 2006b; Osman 2006); the reports from these trials were independently assessed by two other review authors. Jane Norman has received a grant of GBP 11,000 (paid to her institution) from the Chief Scientist's Office, Scottish Executive, for an epidemiological study entitled: "Ferguson EF, Norman JE, Chalmers J, Shanks E, Finlayson A. Investigation of the beneficial and adverse effects of induction of labour." Jane Norman has received a number of research grants (paid to her institution) to support research into improving perinatal outcome ‐ none specifically related to immediate versus deferred delivery. Jane has also received small amounts of money for speaking at meetings about prematurity but not immediate versus deferred delivery.
Zarko Alfirevic: none known.
Acknowledgements
As part of the pre‐publication editorial process, this review has been commented on by three peers (an editor and two referees who are external to the editorial team), a member of the Pregnancy and Childbirth Group's international panel of consumers and the Group's Statistical Adviser.
We thank Dr Elham Shakibazadeh for her assistance with translation and data extraction for one paper. We thank Ms Nancy Medley for her assistance with GRADE tables. We thank Therese Dowswell for her contribution as an author on previous versions of this review.
The World Health Organization, Zarko Alfirevic, Alfred Osoti, Anthony Kelly, Stephania Livio and Jane Norman retain copyright and all other rights in their respective contributions to the manuscript of this Review as submitted for publication.
This project was supported by the National Institute for Health Research, via Cochrane Infrastructure funding to the Cochrane Pregnancy and Childbirth Group. The views and opinions expressed therein are those of the authors and do not necessarily reflect those of the Systematic Reviews Programme, NIHR, NHS or the Department of Health.
Version history
| Published | Title | Stage | Authors | Version |
| 2017 Sep 13 | Pharmacological and mechanical interventions for labour induction in outpatient settings | Review | Joshua P Vogel, Alfred O Osoti, Anthony J Kelly, Stefania Livio, Jane E Norman, Zarko Alfirevic | |
| 2010 Aug 04 | Different methods for the induction of labour in outpatient settings | Review | Therese Dowswell, Anthony J Kelly, Stefania Livio, Jane E Norman, Zarko Alfirevic | |
| 2009 Apr 15 | Different methods for the induction of labour in outpatient settings | Protocol | Anthony J Kelly, Zarko Alfirevic, Jane E Norman, Therese Dowswell | |
Differences between protocol and review
We have added a number of additional (non‐prespecified) outcomes focusing on proxy measures of progress towards birth, and potential adverse effects. These were added to capture additional outcome data that relate to the effectiveness and potential harms of the treatments in outpatient settings.
Maternal and caregiver satisfaction were previously defined as "mother (or caregiver) not satisfied", however these were revised during this update.
Three GRADE 'Summary of findings' tables have been added for this update (2017).
The title has changed from the 2010 version of the review from, Different methods for the induction of labour in outpatient settings, to Pharmacological and mechanical interventions for labour induction in outpatient settings, in this 2017 update.
The objectives have been amended in this update (2017) to:
To examine pharmacological and mechanical interventions to induce labour or ripen the cervix in outpatient settings in terms of effectiveness, maternal satisfaction, healthcare costs and, where information is available, safety.
In the previous version of this review,(2010), the objectives were:
To examine pharmacological and mechanical interventions to induce labour in outpatient settings in terms of feasibility, effectiveness, maternal satisfaction, healthcare costs and, where information is available safety. The review complements existing reviews on labour induction examining effectiveness and safety.
Keywords
MeSH
Medical Subject Headings (MeSH) Keywords
- *Ambulatory Care;
- Acupuncture Therapy [methods];
- Cesarean Section [statistics & numerical data];
- Dinoprostone [administration & dosage];
- Feasibility Studies;
- Intensive Care, Neonatal [statistics & numerical data];
- Labor, Induced [*methods];
- Misoprostol [administration & dosage];
- Oxytocics;
- Randomized Controlled Trials as Topic;
Medical Subject Headings Check Words
Female; Humans; Pregnancy;
PICO

Study flow diagram.
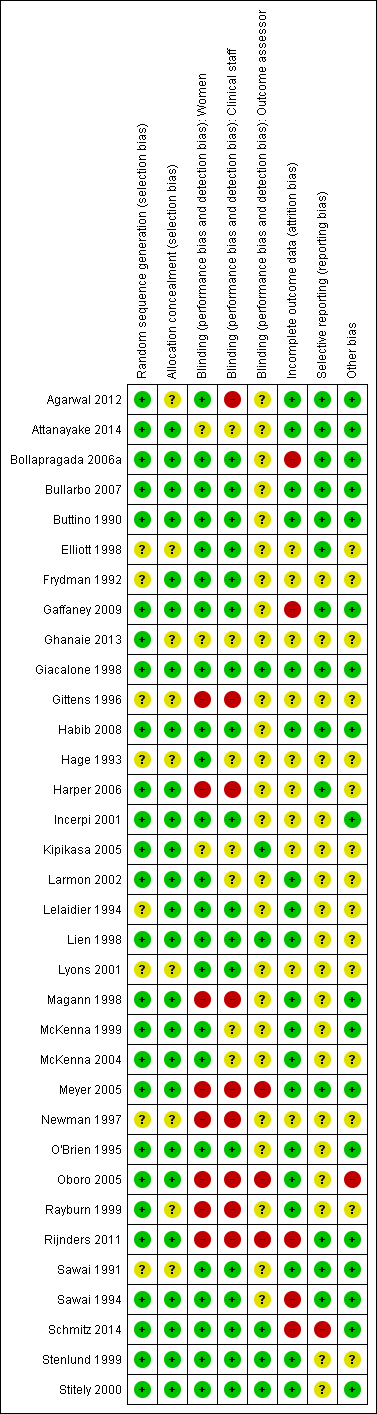
Risk of bias summary: review authors' judgements about each risk of bias item for each included study.

Risk of bias graph: review authors' judgements about each risk of bias item presented as percentages across all included studies.

Comparison 1 Intravaginal PGE₂ gel versus placebo or expectant management, Outcome 1 Additional induction agents required.

Comparison 1 Intravaginal PGE₂ gel versus placebo or expectant management, Outcome 2 Epidural.

Comparison 1 Intravaginal PGE₂ gel versus placebo or expectant management, Outcome 3 Uterine hyperstimulation (FHR changes unclear).
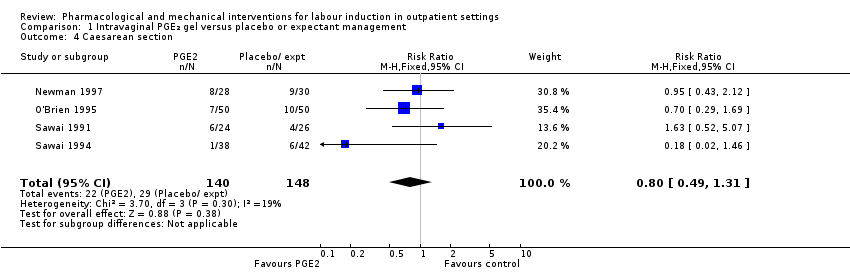
Comparison 1 Intravaginal PGE₂ gel versus placebo or expectant management, Outcome 4 Caesarean section.
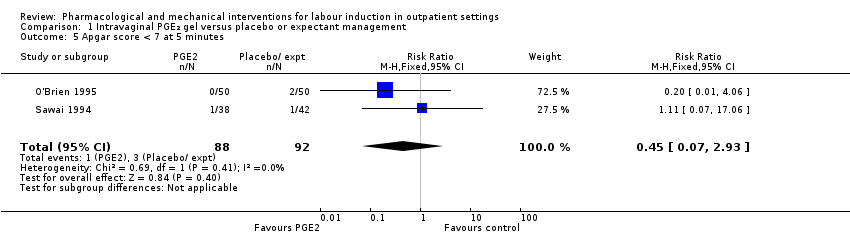
Comparison 1 Intravaginal PGE₂ gel versus placebo or expectant management, Outcome 5 Apgar score < 7 at 5 minutes.

Comparison 1 Intravaginal PGE₂ gel versus placebo or expectant management, Outcome 6 NICU admission.

Comparison 1 Intravaginal PGE₂ gel versus placebo or expectant management, Outcome 7 Chorioamnionitis.
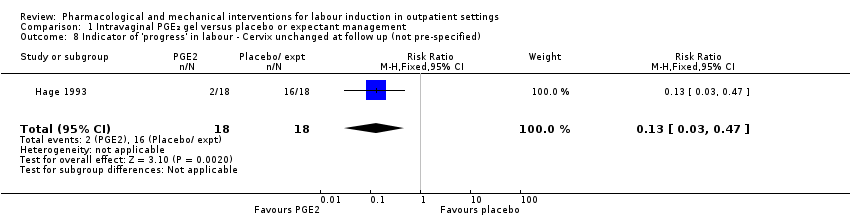
Comparison 1 Intravaginal PGE₂ gel versus placebo or expectant management, Outcome 8 Indicator of 'progress' in labour ‐ Cervix unchanged at follow up (not pre‐specified).

Comparison 1 Intravaginal PGE₂ gel versus placebo or expectant management, Outcome 9 'Spontaneous labour' within 48 hours.
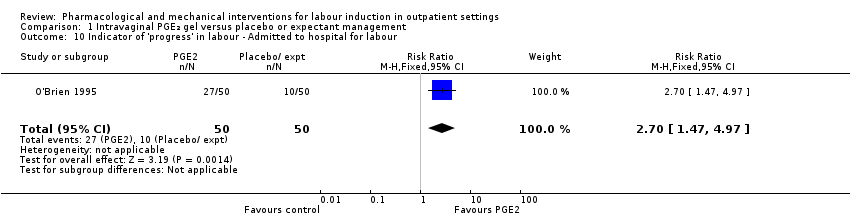
Comparison 1 Intravaginal PGE₂ gel versus placebo or expectant management, Outcome 10 Indicator of 'progress' in labour ‐ Admitted to hospital for labour.

Comparison 1 Intravaginal PGE₂ gel versus placebo or expectant management, Outcome 11 Time to birth ‐ Gestational age at birth (weeks).

Comparison 1 Intravaginal PGE₂ gel versus placebo or expectant management, Outcome 12 Time to birth ‐ Gestational age on admission (days).
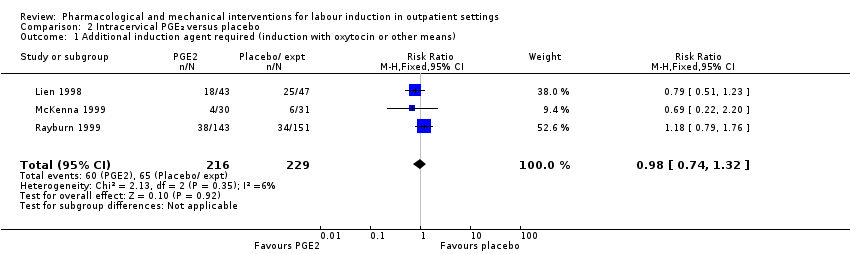
Comparison 2 Intracervical PGE₂ versus placebo, Outcome 1 Additional induction agent required (induction with oxytocin or other means).
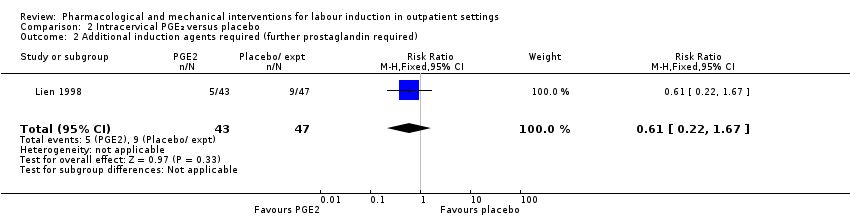
Comparison 2 Intracervical PGE₂ versus placebo, Outcome 2 Additional induction agents required (further prostaglandin required).
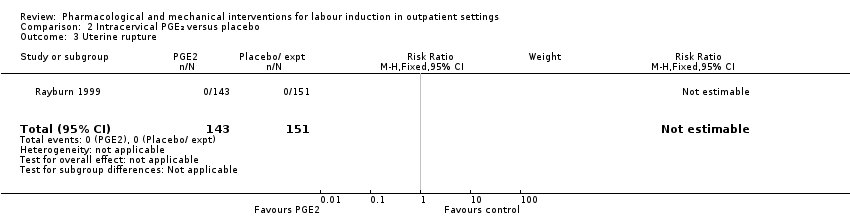
Comparison 2 Intracervical PGE₂ versus placebo, Outcome 3 Uterine rupture.

Comparison 2 Intracervical PGE₂ versus placebo, Outcome 4 Birth not achieved in 48 to 72 hours.

Comparison 2 Intracervical PGE₂ versus placebo, Outcome 5 Oxytocin augmentation.
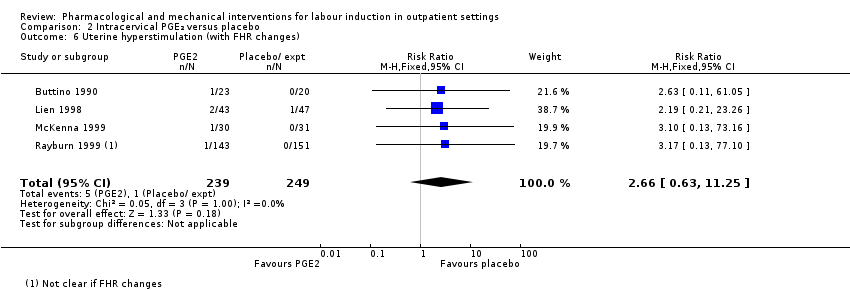
Comparison 2 Intracervical PGE₂ versus placebo, Outcome 6 Uterine hyperstimulation (with FHR changes).

Comparison 2 Intracervical PGE₂ versus placebo, Outcome 7 Assisted (instrumental) vaginal birth.
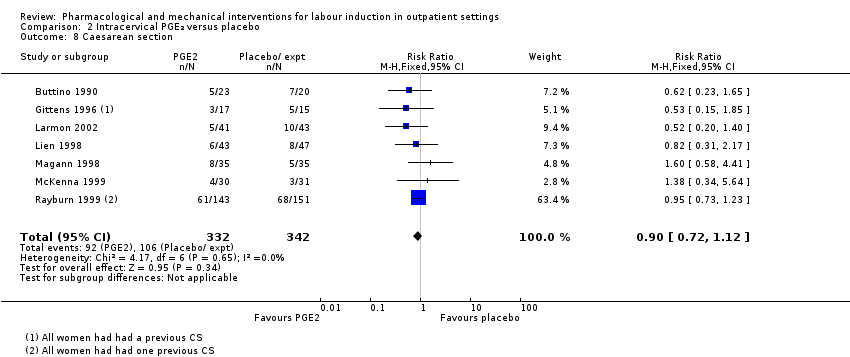
Comparison 2 Intracervical PGE₂ versus placebo, Outcome 8 Caesarean section.
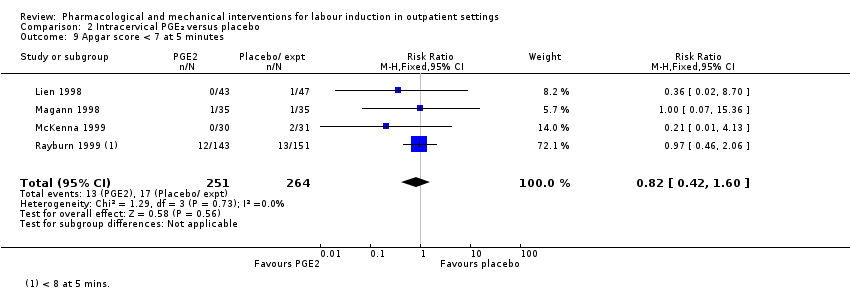
Comparison 2 Intracervical PGE₂ versus placebo, Outcome 9 Apgar score < 7 at 5 minutes.

Comparison 2 Intracervical PGE₂ versus placebo, Outcome 10 NICU admission.

Comparison 2 Intracervical PGE₂ versus placebo, Outcome 11 Postpartum haemorrhage (> 500 mL).
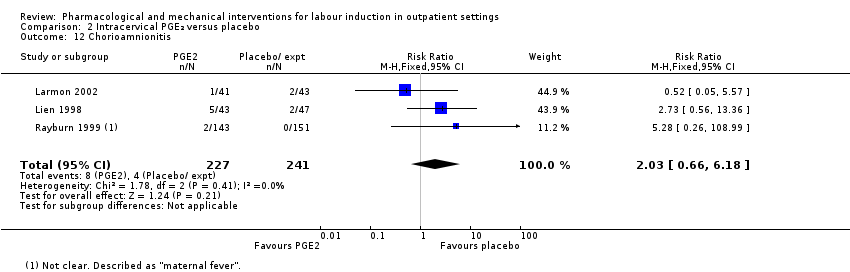
Comparison 2 Intracervical PGE₂ versus placebo, Outcome 12 Chorioamnionitis.

Comparison 2 Intracervical PGE₂ versus placebo, Outcome 13 Endometritis.

Comparison 2 Intracervical PGE₂ versus placebo, Outcome 14 Side effects ‐ Maternal side effects.

Comparison 2 Intracervical PGE₂ versus placebo, Outcome 15 Time to birth ‐ Interval from intervention to birth (days).

Comparison 2 Intracervical PGE₂ versus placebo, Outcome 16 Time to birth ‐ Gestational age at birth (weeks).
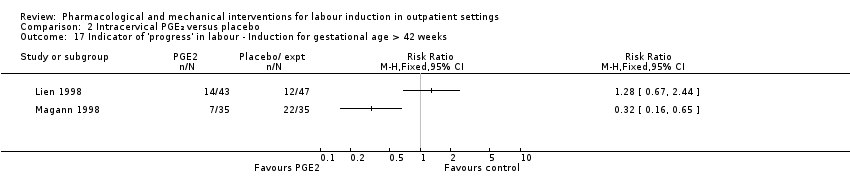
Comparison 2 Intracervical PGE₂ versus placebo, Outcome 17 Indicator of 'progress' in labour ‐ Induction for gestational age > 42 weeks.

Comparison 2 Intracervical PGE₂ versus placebo, Outcome 18 Time to birth ‐ Birth within 48 hours of treatment (all births).

Comparison 3 Vaginal misoprostol versus placebo, Outcome 1 Serious neonatal morbidity or death.
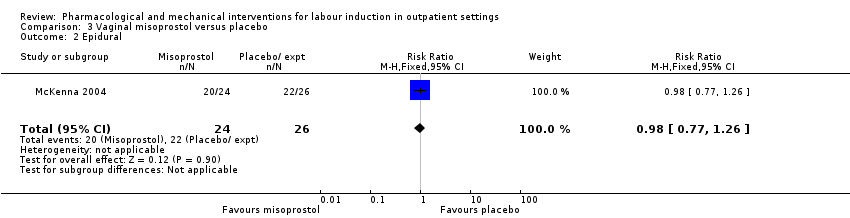
Comparison 3 Vaginal misoprostol versus placebo, Outcome 2 Epidural.

Comparison 3 Vaginal misoprostol versus placebo, Outcome 3 Uterine hyperstimulation (with FHR changes).
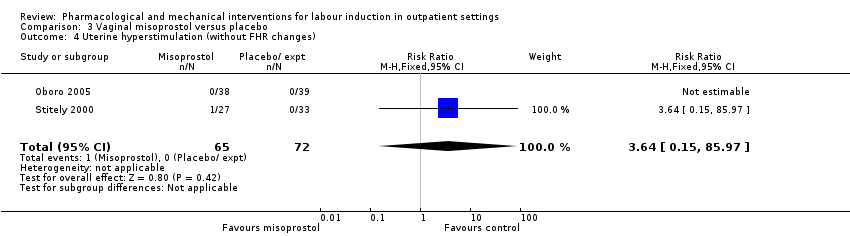
Comparison 3 Vaginal misoprostol versus placebo, Outcome 4 Uterine hyperstimulation (without FHR changes).
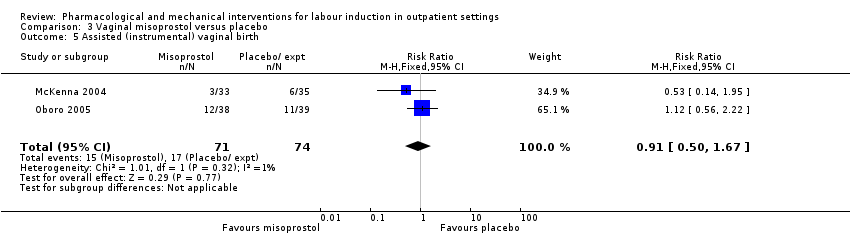
Comparison 3 Vaginal misoprostol versus placebo, Outcome 5 Assisted (instrumental) vaginal birth.

Comparison 3 Vaginal misoprostol versus placebo, Outcome 6 Caesarean section.

Comparison 3 Vaginal misoprostol versus placebo, Outcome 7 Apgar score < 7 at 5 minutes.
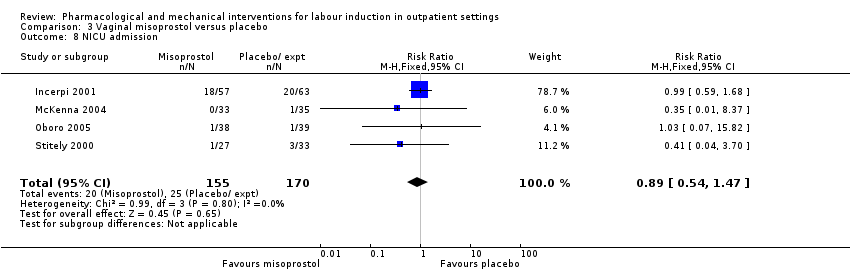
Comparison 3 Vaginal misoprostol versus placebo, Outcome 8 NICU admission.
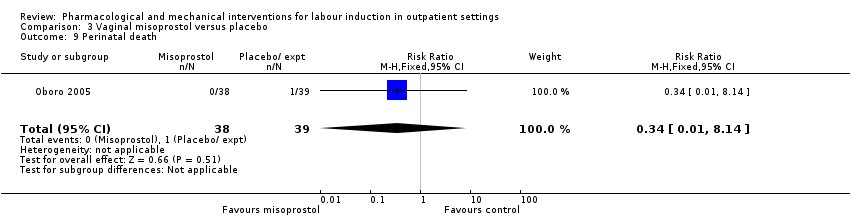
Comparison 3 Vaginal misoprostol versus placebo, Outcome 9 Perinatal death.

Comparison 3 Vaginal misoprostol versus placebo, Outcome 10 Neonatal infection.

Comparison 3 Vaginal misoprostol versus placebo, Outcome 11 Indicator of 'progress' in labour ‐ Oxytocin dose used (mU).

Comparison 3 Vaginal misoprostol versus placebo, Outcome 12 Indicator of 'progress' in labour ‐ Number of medication dose.

Comparison 3 Vaginal misoprostol versus placebo, Outcome 13 Indicator of 'progress' in labour ‐ Number of women requiring dosing on day 2.

Comparison 3 Vaginal misoprostol versus placebo, Outcome 14 Indicator of 'progress' in labour ‐ Number of women requiring induction on day 3.

Comparison 3 Vaginal misoprostol versus placebo, Outcome 15 Indicator of 'progress' in labour ‐ Days to admission (all) (days).
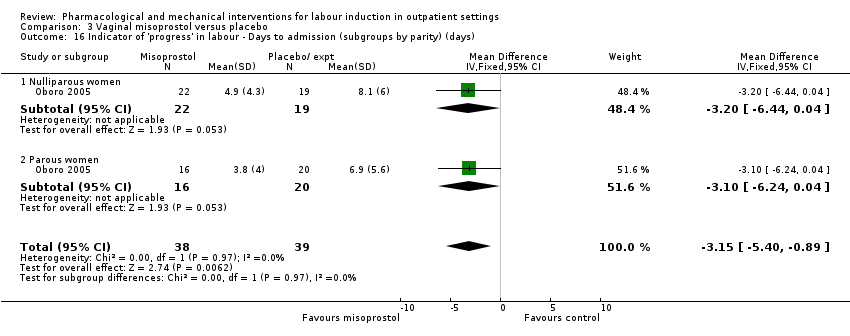
Comparison 3 Vaginal misoprostol versus placebo, Outcome 16 Indicator of 'progress' in labour ‐ Days to admission (subgroups by parity) (days).

Comparison 3 Vaginal misoprostol versus placebo, Outcome 17 Indicator of 'progress' in labour ‐ Gestational age at labour (weeks).

Comparison 3 Vaginal misoprostol versus placebo, Outcome 18 Indicator of 'progress' in labour ‐ Days to admission (parous) (weeks).

Comparison 3 Vaginal misoprostol versus placebo, Outcome 19 Indicator of 'progress' in labour ‐ Days to PROM (days).
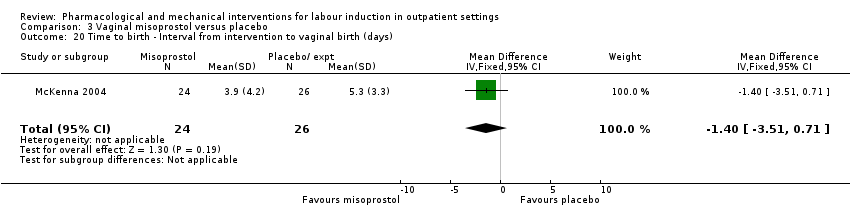
Comparison 3 Vaginal misoprostol versus placebo, Outcome 20 Time to birth ‐ Interval from intervention to vaginal birth (days).

Comparison 3 Vaginal misoprostol versus placebo, Outcome 21 Time to birth ‐ Days to birth (all) (days).

Comparison 3 Vaginal misoprostol versus placebo, Outcome 22 Time to birth ‐ Days to birth (subgroups by parity) (days).
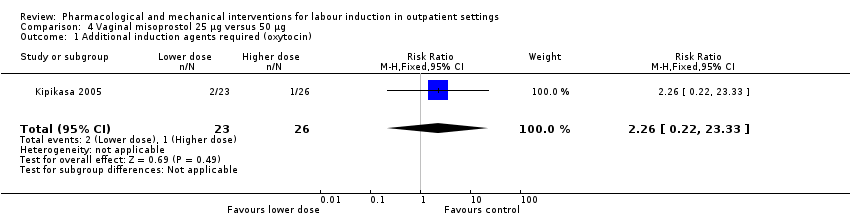
Comparison 4 Vaginal misoprostol 25 µg versus 50 µg, Outcome 1 Additional induction agents required (oxytocin).

Comparison 4 Vaginal misoprostol 25 µg versus 50 µg, Outcome 2 Uterine hyperstimulation.

Comparison 4 Vaginal misoprostol 25 µg versus 50 µg, Outcome 3 Caesarean section.
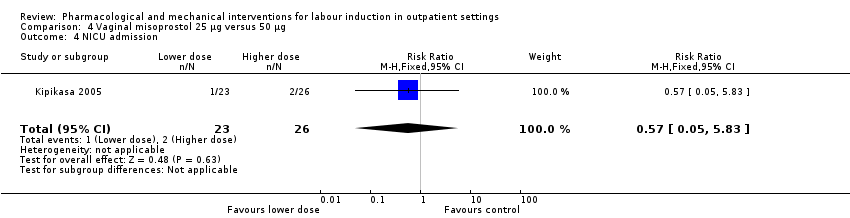
Comparison 4 Vaginal misoprostol 25 µg versus 50 µg, Outcome 4 NICU admission.

Comparison 4 Vaginal misoprostol 25 µg versus 50 µg, Outcome 5 Interval from treatment to birth (in days, all births).
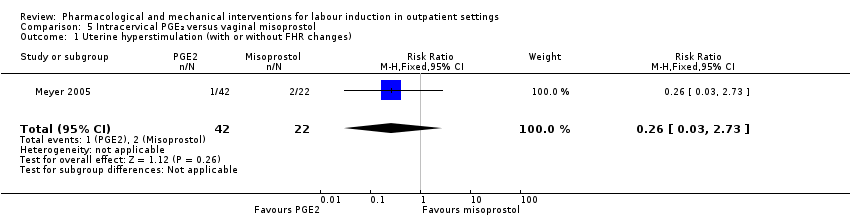
Comparison 5 Intracervical PGE₂ versus vaginal misoprostol, Outcome 1 Uterine hyperstimulation (with or without FHR changes).

Comparison 5 Intracervical PGE₂ versus vaginal misoprostol, Outcome 2 Caesarean section.

Comparison 5 Intracervical PGE₂ versus vaginal misoprostol, Outcome 3 Apgar score < 7 after 5 minutes.
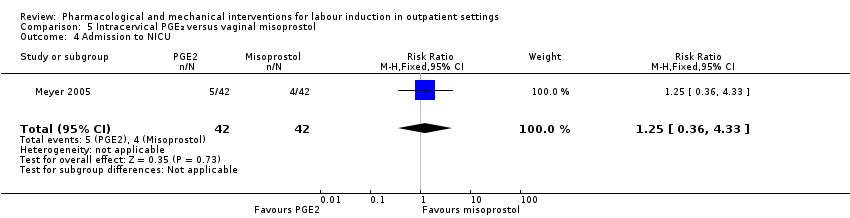
Comparison 5 Intracervical PGE₂ versus vaginal misoprostol, Outcome 4 Admission to NICU.
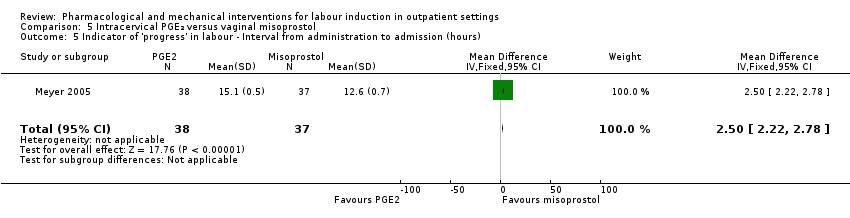
Comparison 5 Intracervical PGE₂ versus vaginal misoprostol, Outcome 5 Indicator of 'progress' in labour ‐ Interval from administration to admission (hours).

Comparison 5 Intracervical PGE₂ versus vaginal misoprostol, Outcome 6 Indicator of 'progress' in labour ‐ Labour or SROM during ripening.

Comparison 5 Intracervical PGE₂ versus vaginal misoprostol, Outcome 7 Time to birth ‐ Birth within 24 hours.
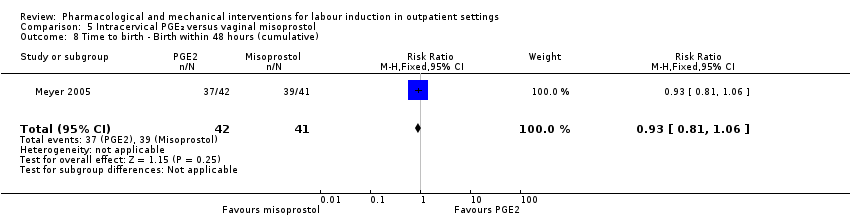
Comparison 5 Intracervical PGE₂ versus vaginal misoprostol, Outcome 8 Time to birth ‐ Birth within 48 hours (cumulative).
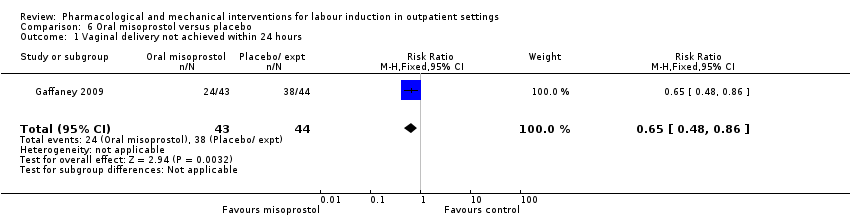
Comparison 6 Oral misoprostol versus placebo, Outcome 1 Vaginal delivery not achieved within 24 hours.
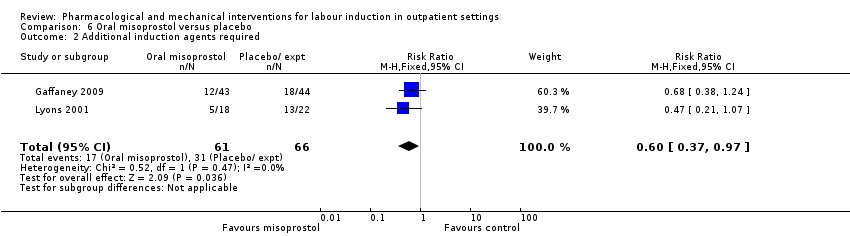
Comparison 6 Oral misoprostol versus placebo, Outcome 2 Additional induction agents required.

Comparison 6 Oral misoprostol versus placebo, Outcome 3 Oxytocin augmentation.
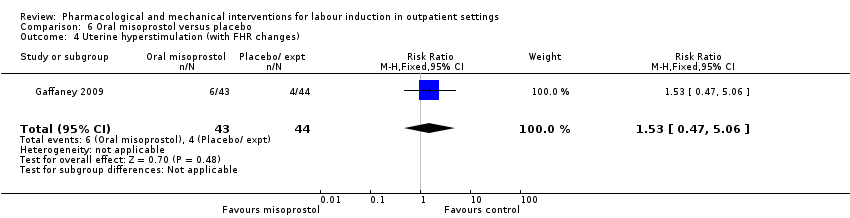
Comparison 6 Oral misoprostol versus placebo, Outcome 4 Uterine hyperstimulation (with FHR changes).
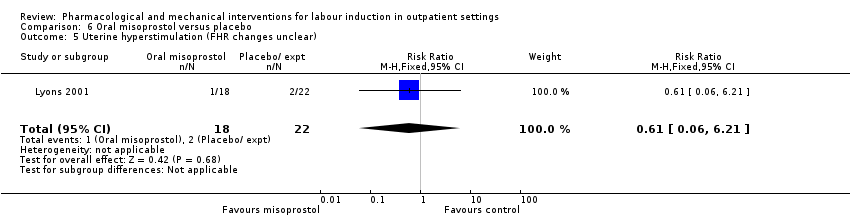
Comparison 6 Oral misoprostol versus placebo, Outcome 5 Uterine hyperstimulation (FHR changes unclear).
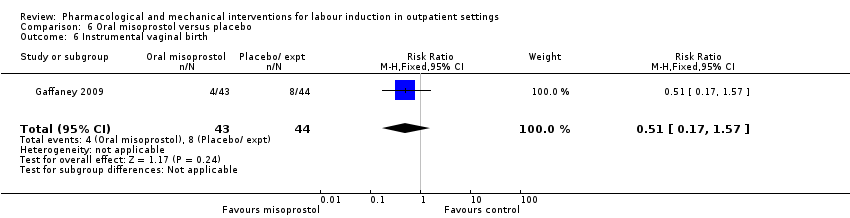
Comparison 6 Oral misoprostol versus placebo, Outcome 6 Instrumental vaginal birth.

Comparison 6 Oral misoprostol versus placebo, Outcome 7 Caesarean section.

Comparison 6 Oral misoprostol versus placebo, Outcome 8 Apgar score < 7 at 5 minutes.
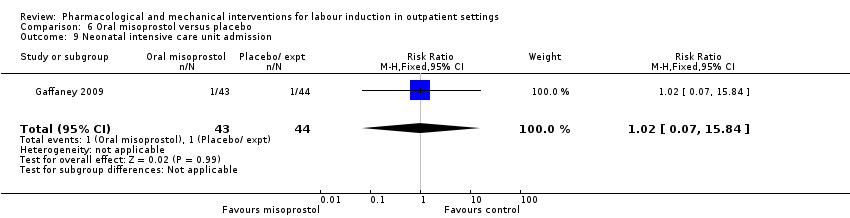
Comparison 6 Oral misoprostol versus placebo, Outcome 9 Neonatal intensive care unit admission.

Comparison 6 Oral misoprostol versus placebo, Outcome 10 Postpartum haemorrhage.

Comparison 6 Oral misoprostol versus placebo, Outcome 11 Chorioamnionitis.
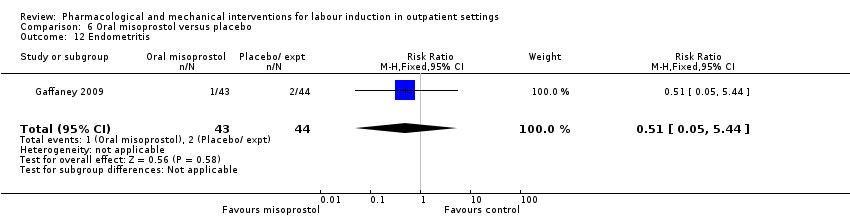
Comparison 6 Oral misoprostol versus placebo, Outcome 12 Endometritis.

Comparison 6 Oral misoprostol versus placebo, Outcome 13 Indicator of 'progress' in labour ‐ Time from first dose to active labor (hours).
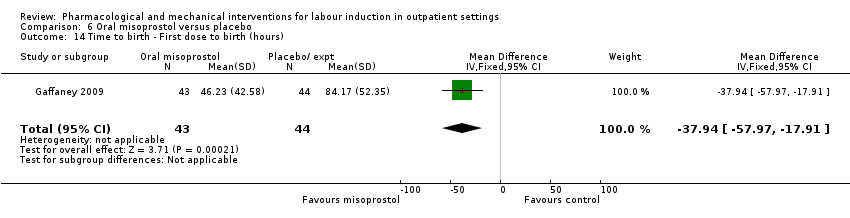
Comparison 6 Oral misoprostol versus placebo, Outcome 14 Time to birth ‐ First dose to birth (hours).

Comparison 6 Oral misoprostol versus placebo, Outcome 15 Indicator of 'progress' in labour ‐ Total doses of medication.

Comparison 7 Mifepristone versus placebo, Outcome 1 Additional induction agents required.
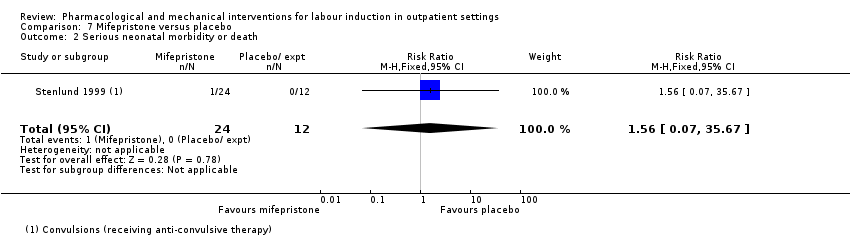
Comparison 7 Mifepristone versus placebo, Outcome 2 Serious neonatal morbidity or death.
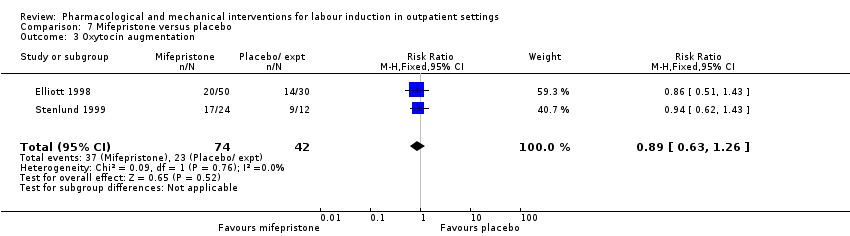
Comparison 7 Mifepristone versus placebo, Outcome 3 Oxytocin augmentation.

Comparison 7 Mifepristone versus placebo, Outcome 4 Epidural.
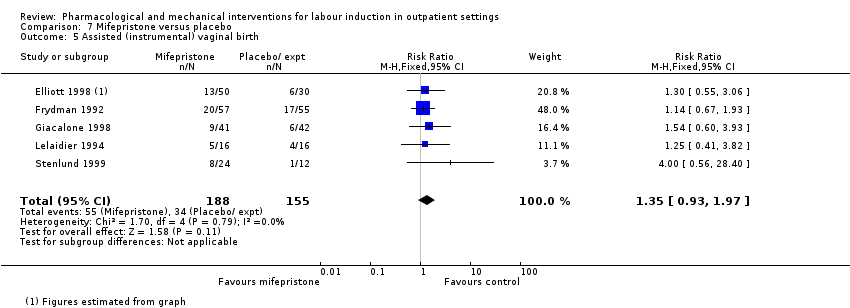
Comparison 7 Mifepristone versus placebo, Outcome 5 Assisted (instrumental) vaginal birth.
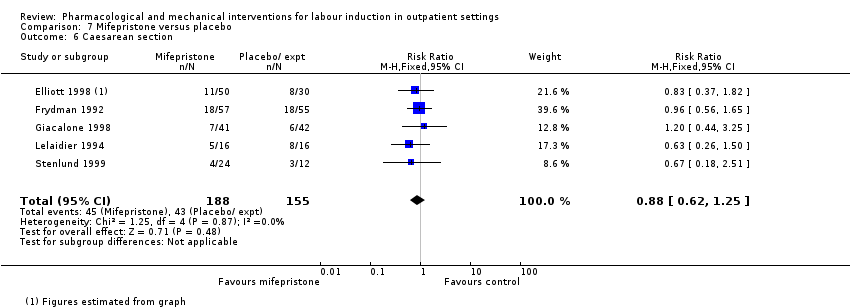
Comparison 7 Mifepristone versus placebo, Outcome 6 Caesarean section.
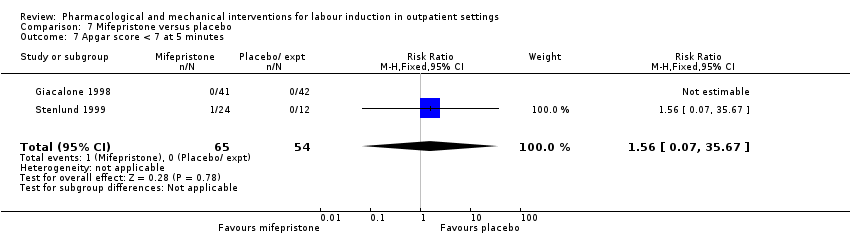
Comparison 7 Mifepristone versus placebo, Outcome 7 Apgar score < 7 at 5 minutes.

Comparison 7 Mifepristone versus placebo, Outcome 8 NICU admission.
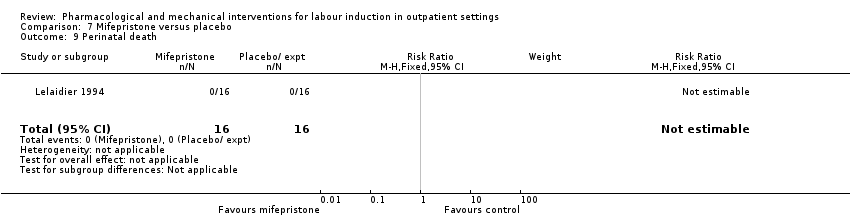
Comparison 7 Mifepristone versus placebo, Outcome 9 Perinatal death.

Comparison 7 Mifepristone versus placebo, Outcome 10 Uterine scar separation.

Comparison 7 Mifepristone versus placebo, Outcome 11 Chorioamnionitis.
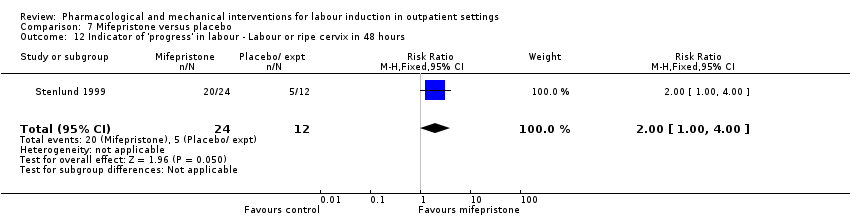
Comparison 7 Mifepristone versus placebo, Outcome 12 Indicator of 'progress' in labour ‐ Labour or ripe cervix in 48 hours.
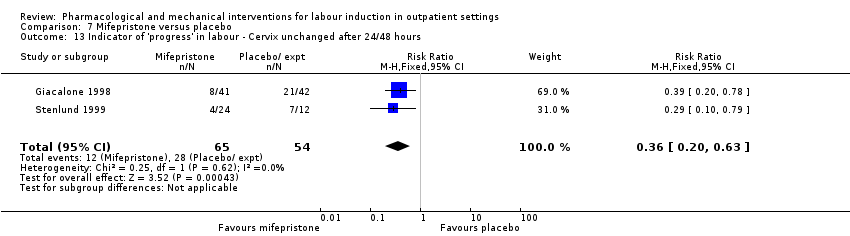
Comparison 7 Mifepristone versus placebo, Outcome 13 Indicator of 'progress' in labour ‐ Cervix unchanged after 24/48 hours.

Comparison 7 Mifepristone versus placebo, Outcome 14 Indicator of 'progress' in labour ‐ Spontaneous labour within 72 hours.

Comparison 7 Mifepristone versus placebo, Outcome 15 Indicator of 'progress' in labour ‐ Spontaneous labour within 48 hours.

Comparison 7 Mifepristone versus placebo, Outcome 16 Indicator of 'progress' in labour ‐ Oxytocin requirements (IU).
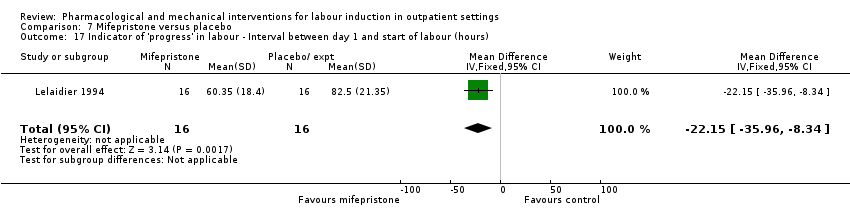
Comparison 7 Mifepristone versus placebo, Outcome 17 Indicator of 'progress' in labour ‐ Interval between day 1 and start of labour (hours).

Comparison 8 Oestrogens versus placebo, Outcome 1 Oxytocin augmentation.

Comparison 8 Oestrogens versus placebo, Outcome 2 Assisted (instrumental) vaginal birth.

Comparison 8 Oestrogens versus placebo, Outcome 3 Caesarean section.

Comparison 8 Oestrogens versus placebo, Outcome 4 NICU admission.

Comparison 8 Oestrogens versus placebo, Outcome 5 Chorioamnionitis.
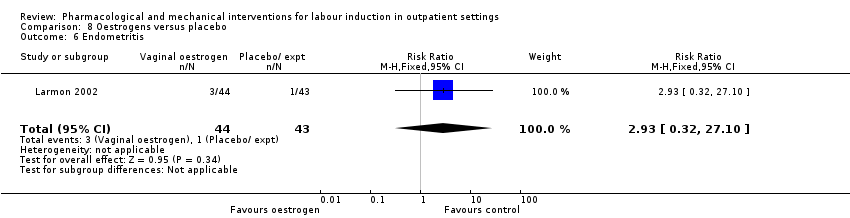
Comparison 8 Oestrogens versus placebo, Outcome 6 Endometritis.

Comparison 9 Vaginal isosorbide mononitrate (IMN) versus placebo, Outcome 1 Vaginal birth not achieved in 24/48 hours.

Comparison 9 Vaginal isosorbide mononitrate (IMN) versus placebo, Outcome 2 Additional induction agents required.
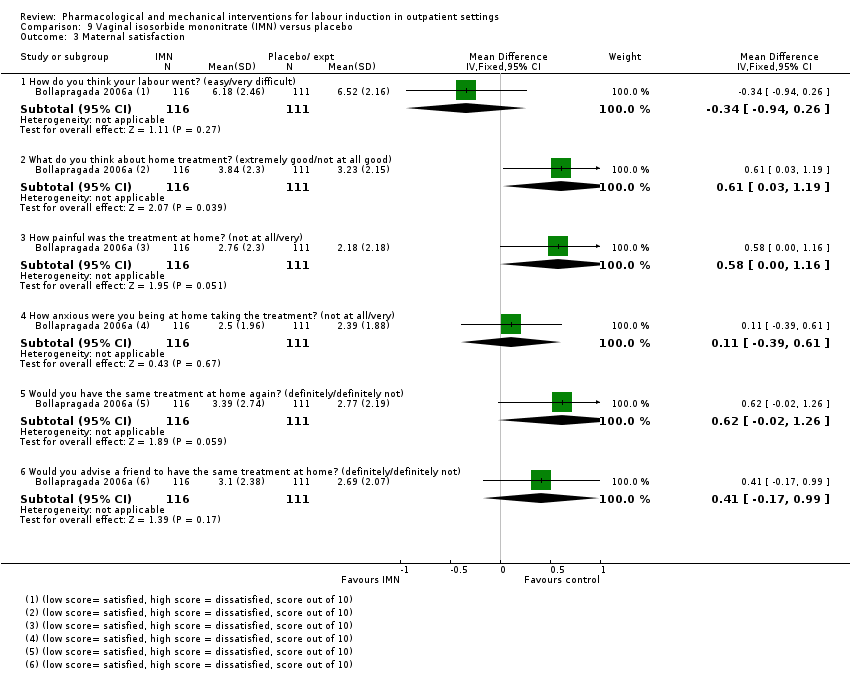
Comparison 9 Vaginal isosorbide mononitrate (IMN) versus placebo, Outcome 3 Maternal satisfaction.

Comparison 9 Vaginal isosorbide mononitrate (IMN) versus placebo, Outcome 4 Maternal satisfaction.

Comparison 9 Vaginal isosorbide mononitrate (IMN) versus placebo, Outcome 5 Perinatal death.

Comparison 9 Vaginal isosorbide mononitrate (IMN) versus placebo, Outcome 6 Neonatal trauma (long bone fracture, collarbone fracture, basal skull fracture, brachial plexus palsy, facial nerve palsy, phrenic nerve palsy, or subdural haemorrhage).

Comparison 9 Vaginal isosorbide mononitrate (IMN) versus placebo, Outcome 7 Neonatal convulsions in the first 24 hours.

Comparison 9 Vaginal isosorbide mononitrate (IMN) versus placebo, Outcome 8 Tracheal ventilation > 24 hours.

Comparison 9 Vaginal isosorbide mononitrate (IMN) versus placebo, Outcome 9 Neonatal ICU admission for 5 or more days.
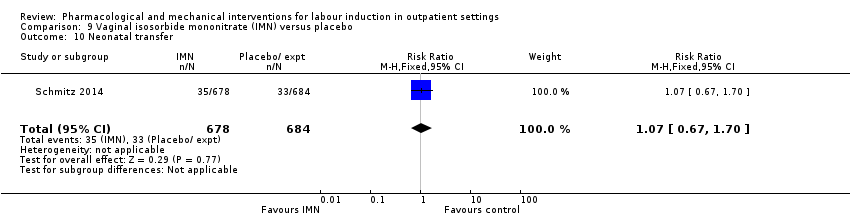
Comparison 9 Vaginal isosorbide mononitrate (IMN) versus placebo, Outcome 10 Neonatal transfer.

Comparison 9 Vaginal isosorbide mononitrate (IMN) versus placebo, Outcome 11 Maternal death.
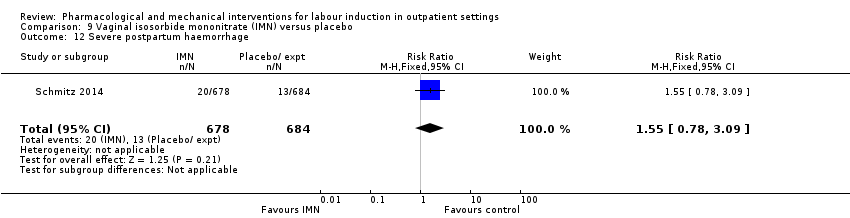
Comparison 9 Vaginal isosorbide mononitrate (IMN) versus placebo, Outcome 12 Severe postpartum haemorrhage.

Comparison 9 Vaginal isosorbide mononitrate (IMN) versus placebo, Outcome 13 Deep vein thrombosis.

Comparison 9 Vaginal isosorbide mononitrate (IMN) versus placebo, Outcome 14 Oxytocin augmentation.
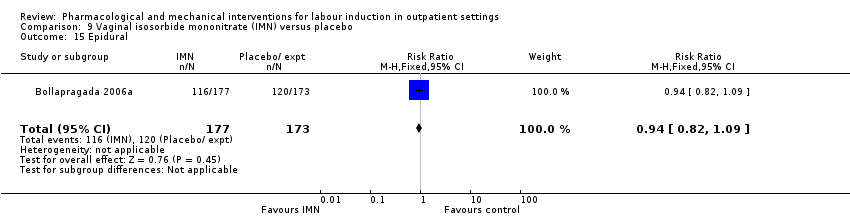
Comparison 9 Vaginal isosorbide mononitrate (IMN) versus placebo, Outcome 15 Epidural.
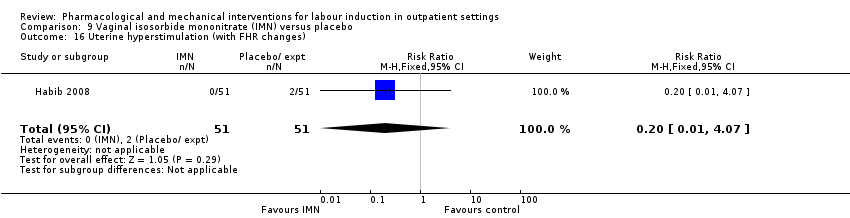
Comparison 9 Vaginal isosorbide mononitrate (IMN) versus placebo, Outcome 16 Uterine hyperstimulation (with FHR changes).

Comparison 9 Vaginal isosorbide mononitrate (IMN) versus placebo, Outcome 17 Uterine hyperstimulation (FHR changes unclear).
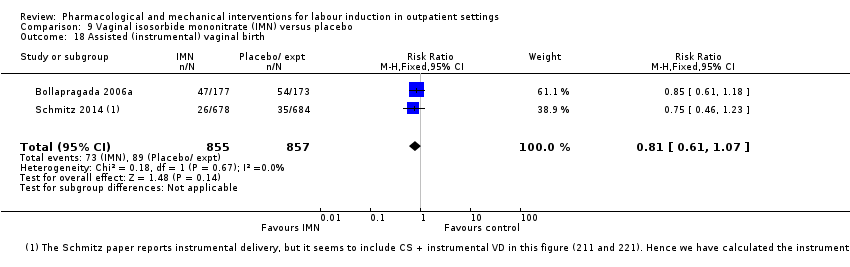
Comparison 9 Vaginal isosorbide mononitrate (IMN) versus placebo, Outcome 18 Assisted (instrumental) vaginal birth.

Comparison 9 Vaginal isosorbide mononitrate (IMN) versus placebo, Outcome 19 Caesarean section.
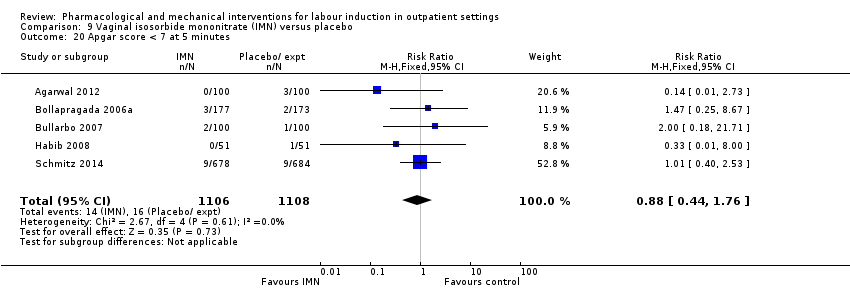
Comparison 9 Vaginal isosorbide mononitrate (IMN) versus placebo, Outcome 20 Apgar score < 7 at 5 minutes.

Comparison 9 Vaginal isosorbide mononitrate (IMN) versus placebo, Outcome 21 NICU (or SCBU) admission.
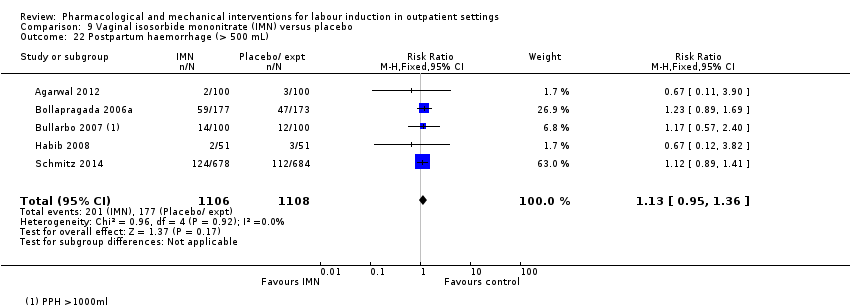
Comparison 9 Vaginal isosorbide mononitrate (IMN) versus placebo, Outcome 22 Postpartum haemorrhage (> 500 mL).

Comparison 9 Vaginal isosorbide mononitrate (IMN) versus placebo, Outcome 23 Neonatal infection.

Comparison 9 Vaginal isosorbide mononitrate (IMN) versus placebo, Outcome 24 Side effects ‐ Maternal side effect ‐ nausea.

Comparison 9 Vaginal isosorbide mononitrate (IMN) versus placebo, Outcome 25 Side effects ‐ Maternal side effect ‐ headache.

Comparison 9 Vaginal isosorbide mononitrate (IMN) versus placebo, Outcome 26 Side effects ‐ Maternal side effects ‐ severe headache.

Comparison 9 Vaginal isosorbide mononitrate (IMN) versus placebo, Outcome 27 Indicator of 'progress' in labour ‐ Admitted in established labour within 24 hours.
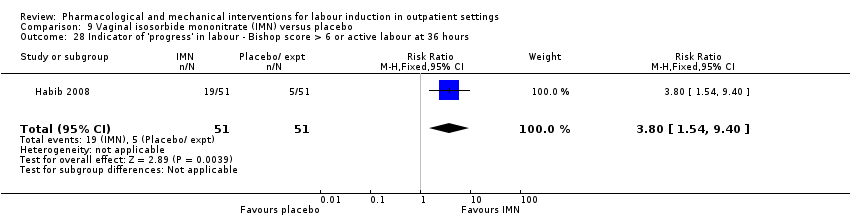
Comparison 9 Vaginal isosorbide mononitrate (IMN) versus placebo, Outcome 28 Indicator of 'progress' in labour ‐ Bishop score > 6 or active labour at 36 hours.

Comparison 9 Vaginal isosorbide mononitrate (IMN) versus placebo, Outcome 29 Time to birth ‐ Time in hours from admission to birth (all women).
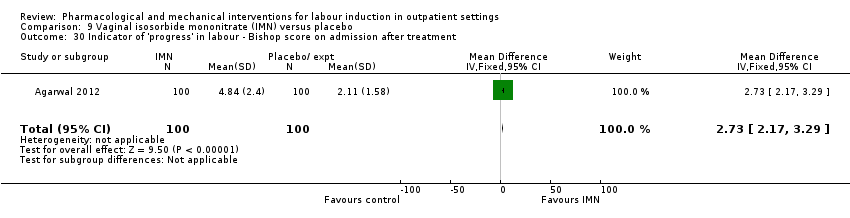
Comparison 9 Vaginal isosorbide mononitrate (IMN) versus placebo, Outcome 30 Indicator of 'progress' in labour ‐ Bishop score on admission after treatment.

Comparison 9 Vaginal isosorbide mononitrate (IMN) versus placebo, Outcome 31 Indicator of 'progress' in labour ‐ Change in Bishop score.

Comparison 9 Vaginal isosorbide mononitrate (IMN) versus placebo, Outcome 32 Time to birth ‐ Interval from onset of labour to birth (hours).
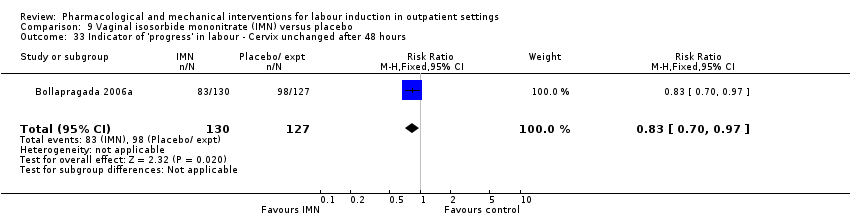
Comparison 9 Vaginal isosorbide mononitrate (IMN) versus placebo, Outcome 33 Indicator of 'progress' in labour ‐ Cervix unchanged after 48 hours.

Comparison 9 Vaginal isosorbide mononitrate (IMN) versus placebo, Outcome 34 Time to birth ‐ Interval from admission to vaginal birth (hours).
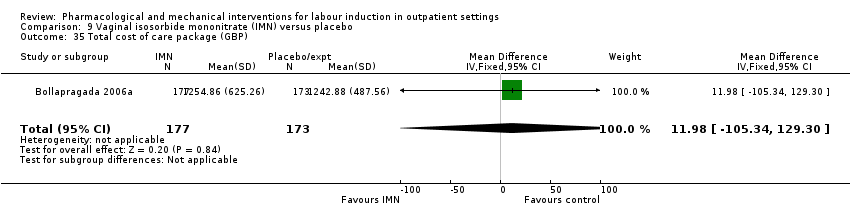
Comparison 9 Vaginal isosorbide mononitrate (IMN) versus placebo, Outcome 35 Total cost of care package (GBP).

Comparison 10 Acupuncture versus routine care, Outcome 1 Additional induction agents required.

Comparison 10 Acupuncture versus routine care, Outcome 2 Caesarean section.

Comparison 11 Outpatient amniotomy for induction versus routine care, Outcome 1 Maternal satisfaction ‐ I look back positively on the treatment I received.

Comparison 11 Outpatient amniotomy for induction versus routine care, Outcome 2 Maternal satisfaction ‐ In retrospect, I would have preferred another treatment than received.
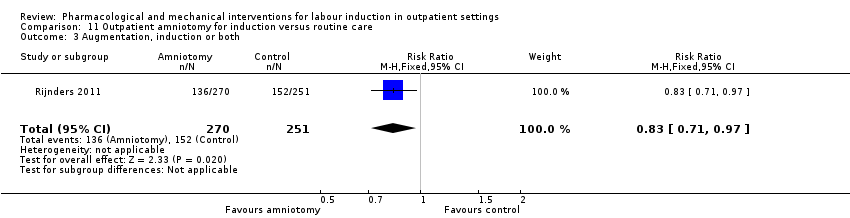
Comparison 11 Outpatient amniotomy for induction versus routine care, Outcome 3 Augmentation, induction or both.
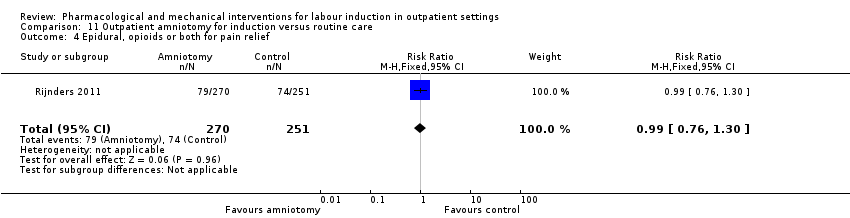
Comparison 11 Outpatient amniotomy for induction versus routine care, Outcome 4 Epidural, opioids or both for pain relief.
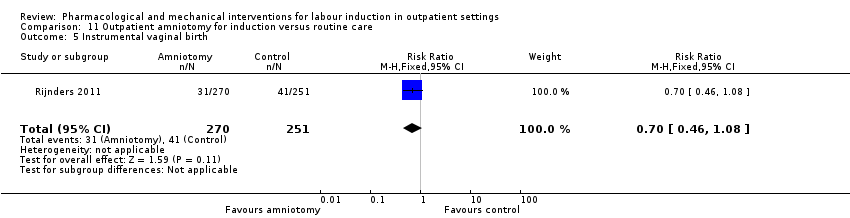
Comparison 11 Outpatient amniotomy for induction versus routine care, Outcome 5 Instrumental vaginal birth.

Comparison 11 Outpatient amniotomy for induction versus routine care, Outcome 6 Caesarean section.

Comparison 11 Outpatient amniotomy for induction versus routine care, Outcome 7 Apgar < 7 at 5 minutes.

Comparison 11 Outpatient amniotomy for induction versus routine care, Outcome 8 Neonatal intensive care unit admission.

Comparison 11 Outpatient amniotomy for induction versus routine care, Outcome 9 Duration of birth (hours).
| Vaginal PGE₂ compared to placebo or expectant management for the induction of labour in outpatient settings | ||||||
| Patient or population: women requiring term labour induction | ||||||
| Outcomes | Anticipated absolute effects* (95% CI) | Relative effect | № of participants | Quality of the evidence | Comments | |
| Risk with placebo or expectant management | Risk with intravaginal PGE₂ gel | |||||
| Vaginal birth not achieved within 24 h | Study population | ‐ | (0 study) | ‐ | No included trial reported this outcome. | |
| see comment | see comment | |||||
| Vaginal birth not achieved in 48 to 72 h | Study population | ‐ | (0 study) | ‐ | No included trial reported this outcome. | |
| see comment | see comment | |||||
| Uterine hyperstimulation (fetal heart rate changes unclear) | Study population | RR 3.76 | 244 | ⊕⊕⊝⊝ | There were no events in the control group and so it was not possible to calculate the anticipated absolute effects. | |
| see comment | see comment | |||||
| Caesarean section | Study population | RR 0.80 | 288 | ⊕⊕⊝⊝ | ||
| 196 per 1000 | 157 per 1000 | |||||
| Serious neonatal morbidity or death | Study population | ‐ | (0 study) | ‐ | No included trial reported this outcome. | |
| see comment | see comment | |||||
| Serious maternal morbidity or death | Study population | ‐ | (0 studies) | ‐ | No included trial reported this outcome. | |
| see comment | see comment | |||||
| Neonatal intensive care unit admission | Study population | RR 0.32 | 230 | ⊕⊕⊝⊝ | ||
| 93 per 1000 | 30 per 1000 | |||||
| *The risk in the intervention group (and its 95% confidence interval) is based on the assumed risk in the comparison group and the relative effect of the intervention (and its 95% CI). | ||||||
| GRADE Working Group grades of evidence | ||||||
| 1 Wide confidence interval crossing the line of no effect, few events and small sample size (‐2). 2 Wide confidence interval crossing the line of no effect and small sample size (‐2). | ||||||
| Intracervical PGE₂ compared to placebo for the induction of labour in outpatient settings | ||||||
| Patient or population: women requiring induction of labour | ||||||
| Outcomes | Anticipated absolute effects* (95% CI) | Relative effect | № of participants | Quality of the evidence | Comments | |
| Risk with placebo | Risk with intracervical PGE₂ | |||||
| Vaginal birth not achieved within 24 h | Study population | ‐ | (0 study) | ‐ | No included trial reported this outcome. | |
| see comment | see comment | |||||
| Vaginal birth not achieved in 48 to 72 h | Study population | RR 0.83 | 43 | ⊕⊕⊝⊝ | ||
| 1000 per 1000 | 830 per 1000 | |||||
| Uterine hyperstimulation (with fetal heart rate changes) | Study population | RR 2.66 | 488 | ⊕⊕⊝⊝ | ||
| 4 per 1000 | 11 per 1000 | |||||
| Caesarean section | Study population | RR 0.90 | 674 | ⊕⊕⊕⊝ | ||
| 310 per 1000 | 279 per 1000 | |||||
| Serious neonatal morbidity or death | Study population | ‐ | (0 study) | ‐ | ||
| see comment | see comment | |||||
| Serious maternal morbidity or death | Study population | ‐ | (0 study) | ‐ | ||
| see comment | see comment | |||||
| Neonatal intensive care unit admission | Study population | RR 1.61 | 215 | ⊕⊕⊝⊝ | ||
| 28 per 1000 | 44 per 1000 | |||||
| *The risk in the intervention group (and its 95% confidence interval) is based on the assumed risk in the comparison group and the relative effect of the intervention (and its 95% CI). | ||||||
| GRADE Working Group grades of evidence | ||||||
| 1 Wide confidence interval crossing the line of no effect, few events and small sample size (‐2). 2 Wide confidence interval crossing the line of no effect (‐1). | ||||||
| Vaginal misoprostol compared to placebo for the induction of labour in outpatient settings | ||||||
| Patient or population: women requiring induction of labour | ||||||
| Outcomes | Anticipated absolute effects* (95% CI) | Relative effect | № of participants | Quality of the evidence | Comments | |
| Risk with placebo | Risk with vaginal misoprostol | |||||
| Vaginal birth not achieved within 24 h | Study population | ‐ | (0 study) | ‐ | No included trial reported this outcome. | |
| see comment | see comment | |||||
| Vaginal birth not achieved within 48 and 72 h | Study population | ‐ | (0 study) | ‐ | No included trial reported this outcome. | |
| see comment | see comment | |||||
| Uterine hyperstimulation (with fetal heart rate changes) | Study population | RR 1.97 | 265 | ⊕⊕⊝⊝ | ||
| 15 per 1000 | 29 per 1000 | |||||
| Caesarean section | Study population | RR 0.94 | 325 | ⊕⊕⊝⊝ | ||
| 206 per 1000 | 194 per 1000 | |||||
| Serious neonatal morbidity or death | Study population | RR 0.34 | 77 | ⊕⊕⊝⊝ | Study reported perinatal deaths. | |
| 26 per 1000 | 9 per 1000 | |||||
| Serious maternal morbidity or death | Study population | ‐ | (0 study) | ‐ | No included trial reported this outcome. | |
| see comment | see comment | |||||
| Neonatal intensive care unit admission | Study population | RR 0.89 | 325 | ⊕⊕⊝⊝ | ||
| 147 per 1000 | 131 per 1000 | |||||
| *The risk in the intervention group (and its 95% confidence interval) is based on the assumed risk in the comparison group and the relative effect of the intervention (and its 95% CI). | ||||||
| GRADE Working Group grades of evidence | ||||||
| 1 Wide confidence interval crossing the line of no effect, few events and small sample size (‐2). 2 Wide confidence interval crossing the line of no effect and small sample size (‐2). | ||||||
| Uterine hyperstimulation | |
| PGE₂(vaginal) | |
| 1/18 PGE group (FHR status unknown), 0/18 in placebo group | |
| 2/28 PGE group (FHR status unknown), 0/30 in control group (no treatment) | |
| 1/50 PGE group (normal FHR), 0/50 in placebo group | |
| Total | 4/96 PGE, 0/98 in control group |
| PGE₂(intracervical) | |
| 1/23 PGE group (with FHR decelerations), 0/20 in placebo group | |
| 2/43 PGE group, 1/47 placebo group with FHR deceleration in both | |
| 1/30 PGE group (fetal bradycardia), 0/31 placebo group | |
| 1/143 PGE group, 0/151 control (no treatment) with hyperstimulation 11/143 FHR decelerations in PGE group, 12/151 in control | |
| Total | 5/239 PGE, 1/249 control with hyperstimulation |
| Intravaginal misoprostol | |
| 2/27 misoprostol group with FHR deceleration, 2/33 placebo group 1/27 misoprostol with tachysystole without FHR changes, 0/33 placebo group | |
| 3/57 misoprostol with hyperstimulation (FHR unknown), 2/63 placebo group 2/57 misoprostol with hypertonus, 5/57 misoprostol with tachysystole, none control | |
| 1/33 misoprostol (FHR deceleration), 0/35 placebo group | |
| Oral misoprostol | |
| 1/18 misoprostol, 2/22 placebo group (FHR unknown) with hyperstimulation | |
| 8/43 misoprostol, 4/44 placebo group hyperstimulation syndrome (tachysystole or hypertonus, with FHR changes) | |
| Total | 9/61 misoprostol, 6/66 placebo group |
| Mifepristone | |
| 4/41 mifepristone group, 0/42 placebo group with hypertonia (FHR unknown) | |
| 0/16 in both groups | |
| Total | 4/57 mifepristone, 0/58 placebo with hypertonia |
| IMN | |
| 0/51 IMN group, 2/51 placebo group with hyperstimulation (abnormal FHR) 1/51 IMN, 8/51 placebo group with tachysystolia (FHR normal) | |
| 0/100 IMN group, 5/100 placebo group with hyperstimulation (FHR changes unclear) | |
| Total | 1/151 IMN group, 15/151 placebo group (hyperstimulation or tachysystolia, ±FHR changes) |
| IMN: isosorbide mononitrate; FHR: fetal heart rate | |
| Neonatal complications | |
| PGE₂vaginal | |
| 0/24 in PGE₂ group; 2/26 in placebo group to NICU | |
| 2/38 in PGE₂; 4/42 in placebo group to NICU | |
| 1/50 in PGE₂; 5/50 in placebo group to NICU | |
| Total | 3/112 PGE, 11/118 control to NICU |
| PGE₂intracervical | |
| 6/41 PGE group, 8/43 placebo group with complication such as tachypnoea, meconium aspiration, meconium or admission to NICU | |
| 3/35 PGE₂ versus 0/35 control NICU admission | |
| 1/30 PGE, 2/31 placebo group with complication | |
| Total | 10/106 PGE, 10/109 controls with neonatal complications/admitted to NICU |
| Vaginal misoprostol | |
| 1/27 misoprostol, 3/33 placebo group to NICU | |
| 18/57 misoprostol, 20/63 placebo group to NICU | |
| 0/33 misoprostol, 1/35 placebo group to NICU | |
| 1/38 misoprostol, 1/39 control (no treatment) to NICU | |
| 1/43 misoprostol, 1/44 placebo group to NICU | |
| Total | 21/198 misoprostol, 26/214 control to NICU |
| Misoprostol 25 µg versus 50 µg | |
| 1/23 25 µg, 2/26 50 µg misoprostol to NICU | |
| Intracervical PGE₂versus intravaginal misoprostol | |
| 5/42 PGE, 4/42 misoprostol to NICU | |
| Mifepristone | |
| 0/50 mifepristone, 1/30 placebo group to NICU | |
| 5/41 mifepristone, 4/42 control to NICU | |
| Total | 5/91 mifepristone, 5/72 control to NICU |
| IMN | |
| 18/177 IMN, 16/173 placebo group to NICU | |
| 13/100 IMN, 9/100 placebo group to NICU | |
| 0/51 IMN, 1/51 placebo group to NICU | |
| 5/100 IMN, 14/100 placebo group to nursery admission | |
| 0/36 IMN, 0/36 placebo group to NICU | |
| 1/72 IMN, 1/72 placebo group to NICU | |
| Total | 37/536 IMN, 41/532 placebo group to NICU |
| Outpatient amniotomy for induction versus routine care | |
| 27/270 IMN, 23/251 placebo group to NICU | |
| NICU: neonatal intensive‐care unit | |
| Maternal complications | |
| Intracervical PGE₂ | |
| 4/41 PGE, 10/43 placebo group with complication such as endometritis, chorioamnionitis and pre‐eclampsia | |
| 6/43 PGE, 3/47 placebo group with complication such as endometritis and chorioamnionitis | |
| 1/30 PGE with PPH, 0/31 placebo group 2/30 PGE, 2/31 placebo group with infection | |
| 8/143 PGE, 7/151 control (no treatment) with endometritis | |
| Total | 21/257 PGE₂, 22/272 control with maternal complications |
| Oral misoprostol | |
| 8/43 misoprostol group, 9/44 placebo group with chorioamnionitis 1/43 misoprostol group, 2/44 placebo group with endometritis 2/43 misoprostol group, 0/44 placebo group with PPH | |
| Total | 11/43 misoprostol group, 11/44 placebo group with maternal complications |
| IMN | |
| Blood loss > 500 mL: 59/177 IMN, 47/173 placebo group | |
| Blood loss > 1000 mL: 14/100 IMN, 12/100 placebo group | |
| PPH: 2/51 IMN, 3/51 placebo group | |
| 2/100 IMN group, 3/100 placebo group with PPH | |
| 0/36 IMN group, 0/36 placebo group with need for blood transfusion | |
| 0/678 IMN group, 0/684 placebo group for maternal death 124/678 IMN group, 112/684 placebo group for PPH 20/678 IMN group, 13/684 placebo group for severe PPH 1/678 IMN group, 0/684 placebo group for deep vein thrombosis | |
| Total | 202/1142 IMN group, 204/1148 placebo group with maternal complications |
| Outpatient amniotomy | |
| 26/270 amniotomy group, 29/251 routine care group ‐ mother treated with antibiotics | |
| PPH: postpartum haemorrhage | |
| Outcome or subgroup title | No. of studies | No. of participants | Statistical method | Effect size |
| 1 Additional induction agents required Show forest plot | 2 | 150 | Risk Ratio (M‐H, Fixed, 95% CI) | 0.52 [0.27, 0.99] |
| 2 Epidural Show forest plot | 1 | 100 | Risk Ratio (M‐H, Fixed, 95% CI) | 0.83 [0.62, 1.12] |
| 3 Uterine hyperstimulation (FHR changes unclear) Show forest plot | 4 | 244 | Risk Ratio (M‐H, Fixed, 95% CI) | 3.76 [0.64, 22.24] |
| 4 Caesarean section Show forest plot | 4 | 288 | Risk Ratio (M‐H, Fixed, 95% CI) | 0.80 [0.49, 1.31] |
| 5 Apgar score < 7 at 5 minutes Show forest plot | 2 | 180 | Risk Ratio (M‐H, Fixed, 95% CI) | 0.45 [0.07, 2.93] |
| 6 NICU admission Show forest plot | 3 | 230 | Risk Ratio (M‐H, Fixed, 95% CI) | 0.32 [0.10, 1.03] |
| 7 Chorioamnionitis Show forest plot | 2 | 180 | Risk Ratio (M‐H, Fixed, 95% CI) | 0.37 [0.15, 0.90] |
| 8 Indicator of 'progress' in labour ‐ Cervix unchanged at follow up (not pre‐specified) Show forest plot | 1 | 36 | Risk Ratio (M‐H, Fixed, 95% CI) | 0.13 [0.03, 0.47] |
| 9 'Spontaneous labour' within 48 hours Show forest plot | 1 | 58 | Risk Ratio (M‐H, Fixed, 95% CI) | 6.43 [2.12, 19.48] |
| 10 Indicator of 'progress' in labour ‐ Admitted to hospital for labour Show forest plot | 1 | 100 | Risk Ratio (M‐H, Fixed, 95% CI) | 2.7 [1.47, 4.97] |
| 11 Time to birth ‐ Gestational age at birth (weeks) Show forest plot | 1 | 100 | Mean Difference (IV, Fixed, 95% CI) | ‐0.60 [‐0.99, ‐0.21] |
| 12 Time to birth ‐ Gestational age on admission (days) Show forest plot | 1 | 80 | Mean Difference (IV, Fixed, 95% CI) | ‐2.0 [‐4.17, 0.17] |
| Outcome or subgroup title | No. of studies | No. of participants | Statistical method | Effect size |
| 1 Additional induction agent required (induction with oxytocin or other means) Show forest plot | 3 | 445 | Risk Ratio (M‐H, Fixed, 95% CI) | 0.98 [0.74, 1.32] |
| 2 Additional induction agents required (further prostaglandin required) Show forest plot | 1 | 90 | Risk Ratio (M‐H, Fixed, 95% CI) | 0.61 [0.22, 1.67] |
| 3 Uterine rupture Show forest plot | 1 | 294 | Risk Ratio (M‐H, Fixed, 95% CI) | 0.0 [0.0, 0.0] |
| 4 Birth not achieved in 48 to 72 hours Show forest plot | 1 | 43 | Risk Ratio (M‐H, Fixed, 95% CI) | 0.83 [0.68, 1.02] |
| 5 Oxytocin augmentation Show forest plot | 1 | 84 | Risk Ratio (M‐H, Fixed, 95% CI) | 0.67 [0.40, 1.12] |
| 6 Uterine hyperstimulation (with FHR changes) Show forest plot | 4 | 488 | Risk Ratio (M‐H, Fixed, 95% CI) | 2.66 [0.63, 11.25] |
| 7 Assisted (instrumental) vaginal birth Show forest plot | 4 | 538 | Risk Ratio (M‐H, Fixed, 95% CI) | 1.29 [0.85, 1.96] |
| 8 Caesarean section Show forest plot | 7 | 674 | Risk Ratio (M‐H, Fixed, 95% CI) | 0.90 [0.72, 1.12] |
| 9 Apgar score < 7 at 5 minutes Show forest plot | 4 | 515 | Risk Ratio (M‐H, Fixed, 95% CI) | 0.82 [0.42, 1.60] |
| 10 NICU admission Show forest plot | 3 | 215 | Risk Ratio (M‐H, Fixed, 95% CI) | 1.61 [0.43, 6.05] |
| 11 Postpartum haemorrhage (> 500 mL) Show forest plot | 1 | 61 | Risk Ratio (M‐H, Fixed, 95% CI) | 3.10 [0.13, 73.16] |
| 12 Chorioamnionitis Show forest plot | 3 | 468 | Risk Ratio (M‐H, Fixed, 95% CI) | 2.03 [0.66, 6.18] |
| 13 Endometritis Show forest plot | 2 | 174 | Risk Ratio (M‐H, Fixed, 95% CI) | 1.60 [0.27, 9.37] |
| 14 Side effects ‐ Maternal side effects Show forest plot | 2 | 384 | Risk Ratio (M‐H, Fixed, 95% CI) | 0.59 [0.13, 2.77] |
| 15 Time to birth ‐ Interval from intervention to birth (days) Show forest plot | 2 | 133 | Std. Mean Difference (IV, Fixed, 95% CI) | ‐0.20 [‐0.55, 0.14] |
| 16 Time to birth ‐ Gestational age at birth (weeks) Show forest plot | 2 | 156 | Mean Difference (IV, Random, 95% CI) | ‐0.06 [‐0.35, 0.23] |
| 17 Indicator of 'progress' in labour ‐ Induction for gestational age > 42 weeks Show forest plot | 2 | Risk Ratio (M‐H, Fixed, 95% CI) | Totals not selected | |
| 18 Time to birth ‐ Birth within 48 hours of treatment (all births) Show forest plot | 1 | 61 | Risk Ratio (M‐H, Fixed, 95% CI) | 3.1 [1.29, 7.47] |
| Outcome or subgroup title | No. of studies | No. of participants | Statistical method | Effect size |
| 1 Serious neonatal morbidity or death Show forest plot | 1 | 77 | Risk Ratio (M‐H, Fixed, 95% CI) | 0.34 [0.01, 8.14] |
| 2 Epidural Show forest plot | 1 | 50 | Risk Ratio (M‐H, Fixed, 95% CI) | 0.98 [0.77, 1.26] |
| 3 Uterine hyperstimulation (with FHR changes) Show forest plot | 3 | 265 | Risk Ratio (M‐H, Fixed, 95% CI) | 1.97 [0.43, 9.00] |
| 4 Uterine hyperstimulation (without FHR changes) Show forest plot | 2 | 137 | Risk Ratio (M‐H, Fixed, 95% CI) | 3.64 [0.15, 85.97] |
| 5 Assisted (instrumental) vaginal birth Show forest plot | 2 | 145 | Risk Ratio (M‐H, Fixed, 95% CI) | 0.91 [0.50, 1.67] |
| 6 Caesarean section Show forest plot | 4 | 325 | Risk Ratio (M‐H, Fixed, 95% CI) | 0.94 [0.61, 1.46] |
| 7 Apgar score < 7 at 5 minutes Show forest plot | 3 | 248 | Risk Ratio (M‐H, Fixed, 95% CI) | 0.21 [0.01, 4.25] |
| 8 NICU admission Show forest plot | 4 | 325 | Risk Ratio (M‐H, Fixed, 95% CI) | 0.89 [0.54, 1.47] |
| 9 Perinatal death Show forest plot | 1 | 77 | Risk Ratio (M‐H, Fixed, 95% CI) | 0.34 [0.01, 8.14] |
| 10 Neonatal infection Show forest plot | 1 | 68 | Risk Ratio (M‐H, Fixed, 95% CI) | 0.30 [0.07, 1.36] |
| 11 Indicator of 'progress' in labour ‐ Oxytocin dose used (mU) Show forest plot | 1 | 72 | Mean Difference (IV, Fixed, 95% CI) | 1508.70 [‐2357.55, 5374.95] |
| 12 Indicator of 'progress' in labour ‐ Number of medication dose Show forest plot | 1 | 60 | Mean Difference (IV, Fixed, 95% CI) | ‐0.44 [‐0.49, ‐0.39] |
| 13 Indicator of 'progress' in labour ‐ Number of women requiring dosing on day 2 Show forest plot | 1 | 60 | Risk Ratio (M‐H, Fixed, 95% CI) | 0.61 [0.43, 0.87] |
| 14 Indicator of 'progress' in labour ‐ Number of women requiring induction on day 3 Show forest plot | 1 | 60 | Risk Ratio (M‐H, Fixed, 95% CI) | 0.13 [0.04, 0.38] |
| 15 Indicator of 'progress' in labour ‐ Days to admission (all) (days) Show forest plot | 1 | 77 | Mean Difference (IV, Fixed, 95% CI) | ‐2.90 [‐4.99, ‐0.81] |
| 16 Indicator of 'progress' in labour ‐ Days to admission (subgroups by parity) (days) Show forest plot | 1 | 77 | Mean Difference (IV, Fixed, 95% CI) | ‐3.15 [‐5.40, ‐0.89] |
| 16.1 Nulliparous women | 1 | 41 | Mean Difference (IV, Fixed, 95% CI) | ‐3.20 [‐6.44, 0.04] |
| 16.2 Parous women | 1 | 36 | Mean Difference (IV, Fixed, 95% CI) | ‐3.10 [‐6.24, 0.04] |
| 17 Indicator of 'progress' in labour ‐ Gestational age at labour (weeks) Show forest plot | 1 | 77 | Mean Difference (IV, Fixed, 95% CI) | ‐0.80 [‐1.05, ‐0.55] |
| 18 Indicator of 'progress' in labour ‐ Days to admission (parous) (weeks) Show forest plot | 1 | 36 | Mean Difference (IV, Fixed, 95% CI) | ‐3.10 [‐6.24, 0.04] |
| 19 Indicator of 'progress' in labour ‐ Days to PROM (days) Show forest plot | 1 | 77 | Mean Difference (IV, Fixed, 95% CI) | ‐2.5 [‐4.14, ‐0.86] |
| 20 Time to birth ‐ Interval from intervention to vaginal birth (days) Show forest plot | 1 | 50 | Mean Difference (IV, Fixed, 95% CI) | ‐1.4 [‐3.51, 0.71] |
| 21 Time to birth ‐ Days to birth (all) (days) Show forest plot | 1 | 68 | Mean Difference (IV, Fixed, 95% CI) | ‐1.90 [‐3.74, ‐0.06] |
| 22 Time to birth ‐ Days to birth (subgroups by parity) (days) Show forest plot | 1 | Mean Difference (IV, Fixed, 95% CI) | Subtotals only | |
| 22.1 Nulliparous women | 1 | 39 | Mean Difference (IV, Fixed, 95% CI) | ‐3.0 [‐5.42, ‐0.58] |
| 22.2 Parous women | 1 | 29 | Mean Difference (IV, Fixed, 95% CI) | ‐0.60 [‐3.51, 2.31] |
| Outcome or subgroup title | No. of studies | No. of participants | Statistical method | Effect size |
| 1 Additional induction agents required (oxytocin) Show forest plot | 1 | 49 | Risk Ratio (M‐H, Fixed, 95% CI) | 2.26 [0.22, 23.33] |
| 2 Uterine hyperstimulation Show forest plot | 1 | 49 | Risk Ratio (M‐H, Fixed, 95% CI) | 0.0 [0.0, 0.0] |
| 3 Caesarean section Show forest plot | 1 | 49 | Risk Ratio (M‐H, Fixed, 95% CI) | 0.94 [0.33, 2.68] |
| 4 NICU admission Show forest plot | 1 | 49 | Risk Ratio (M‐H, Fixed, 95% CI) | 0.57 [0.05, 5.83] |
| 5 Interval from treatment to birth (in days, all births) Show forest plot | 1 | 49 | Mean Difference (IV, Fixed, 95% CI) | 1.5 [1.19, 1.81] |
| Outcome or subgroup title | No. of studies | No. of participants | Statistical method | Effect size |
| 1 Uterine hyperstimulation (with or without FHR changes) Show forest plot | 1 | 64 | Risk Ratio (M‐H, Fixed, 95% CI) | 0.26 [0.03, 2.73] |
| 2 Caesarean section Show forest plot | 1 | 84 | Risk Ratio (M‐H, Fixed, 95% CI) | 0.89 [0.38, 2.08] |
| 3 Apgar score < 7 after 5 minutes Show forest plot | 1 | 84 | Risk Ratio (M‐H, Fixed, 95% CI) | 0.33 [0.01, 7.96] |
| 4 Admission to NICU Show forest plot | 1 | 84 | Risk Ratio (M‐H, Fixed, 95% CI) | 1.25 [0.36, 4.33] |
| 5 Indicator of 'progress' in labour ‐ Interval from administration to admission (hours) Show forest plot | 1 | 75 | Mean Difference (IV, Fixed, 95% CI) | 2.5 [2.22, 2.78] |
| 6 Indicator of 'progress' in labour ‐ Labour or SROM during ripening Show forest plot | 1 | 83 | Risk Ratio (M‐H, Fixed, 95% CI) | 0.31 [0.14, 0.69] |
| 7 Time to birth ‐ Birth within 24 hours Show forest plot | 1 | 83 | Risk Ratio (M‐H, Fixed, 95% CI) | 0.90 [0.75, 1.07] |
| 8 Time to birth ‐ Birth within 48 hours (cumulative) Show forest plot | 1 | 83 | Risk Ratio (M‐H, Fixed, 95% CI) | 0.93 [0.81, 1.06] |
| Outcome or subgroup title | No. of studies | No. of participants | Statistical method | Effect size |
| 1 Vaginal delivery not achieved within 24 hours Show forest plot | 1 | 87 | Risk Ratio (M‐H, Fixed, 95% CI) | 0.65 [0.48, 0.86] |
| 2 Additional induction agents required Show forest plot | 2 | 127 | Risk Ratio (M‐H, Fixed, 95% CI) | 0.60 [0.37, 0.97] |
| 3 Oxytocin augmentation Show forest plot | 1 | 87 | Risk Ratio (M‐H, Fixed, 95% CI) | 0.81 [0.61, 1.08] |
| 4 Uterine hyperstimulation (with FHR changes) Show forest plot | 1 | 87 | Risk Ratio (M‐H, Fixed, 95% CI) | 1.53 [0.47, 5.06] |
| 5 Uterine hyperstimulation (FHR changes unclear) Show forest plot | 1 | 40 | Risk Ratio (M‐H, Fixed, 95% CI) | 0.61 [0.06, 6.21] |
| 6 Instrumental vaginal birth Show forest plot | 1 | 87 | Risk Ratio (M‐H, Fixed, 95% CI) | 0.51 [0.17, 1.57] |
| 7 Caesarean section Show forest plot | 1 | 86 | Risk Ratio (M‐H, Fixed, 95% CI) | 0.62 [0.28, 1.33] |
| 8 Apgar score < 7 at 5 minutes Show forest plot | 1 | 87 | Risk Ratio (M‐H, Fixed, 95% CI) | 0.0 [0.0, 0.0] |
| 9 Neonatal intensive care unit admission Show forest plot | 1 | 87 | Risk Ratio (M‐H, Fixed, 95% CI) | 1.02 [0.07, 15.84] |
| 10 Postpartum haemorrhage Show forest plot | 1 | 87 | Risk Ratio (M‐H, Fixed, 95% CI) | 5.11 [0.25, 103.51] |
| 11 Chorioamnionitis Show forest plot | 2 | 124 | Risk Ratio (M‐H, Fixed, 95% CI) | 1.06 [0.52, 2.17] |
| 12 Endometritis Show forest plot | 1 | 87 | Risk Ratio (M‐H, Fixed, 95% CI) | 0.51 [0.05, 5.44] |
| 13 Indicator of 'progress' in labour ‐ Time from first dose to active labor (hours) Show forest plot | 2 | 127 | Mean Difference (IV, Fixed, 95% CI) | ‐37.08 [‐52.44, ‐21.72] |
| 14 Time to birth ‐ First dose to birth (hours) Show forest plot | 1 | 87 | Mean Difference (IV, Fixed, 95% CI) | ‐37.94 [‐57.97, ‐17.91] |
| 15 Indicator of 'progress' in labour ‐ Total doses of medication Show forest plot | 1 | 40 | Mean Difference (IV, Fixed, 95% CI) | ‐0.51 [‐0.92, ‐0.10] |
| Outcome or subgroup title | No. of studies | No. of participants | Statistical method | Effect size |
| 1 Additional induction agents required Show forest plot | 4 | 311 | Risk Ratio (M‐H, Random, 95% CI) | 0.59 [0.37, 0.95] |
| 2 Serious neonatal morbidity or death Show forest plot | 1 | 36 | Risk Ratio (M‐H, Fixed, 95% CI) | 1.56 [0.07, 35.67] |
| 3 Oxytocin augmentation Show forest plot | 2 | 116 | Risk Ratio (M‐H, Fixed, 95% CI) | 0.89 [0.63, 1.26] |
| 4 Epidural Show forest plot | 1 | 112 | Risk Ratio (M‐H, Fixed, 95% CI) | 0.87 [0.73, 1.03] |
| 5 Assisted (instrumental) vaginal birth Show forest plot | 5 | 343 | Risk Ratio (M‐H, Fixed, 95% CI) | 1.35 [0.93, 1.97] |
| 6 Caesarean section Show forest plot | 5 | 343 | Risk Ratio (M‐H, Fixed, 95% CI) | 0.88 [0.62, 1.25] |
| 7 Apgar score < 7 at 5 minutes Show forest plot | 2 | 119 | Risk Ratio (M‐H, Fixed, 95% CI) | 1.56 [0.07, 35.67] |
| 8 NICU admission Show forest plot | 2 | 163 | Risk Ratio (M‐H, Fixed, 95% CI) | 0.93 [0.31, 2.79] |
| 9 Perinatal death Show forest plot | 1 | 32 | Risk Ratio (M‐H, Fixed, 95% CI) | 0.0 [0.0, 0.0] |
| 10 Uterine scar separation Show forest plot | 1 | 32 | Risk Ratio (M‐H, Fixed, 95% CI) | 1.0 [0.07, 14.64] |
| 11 Chorioamnionitis Show forest plot | 1 | 32 | Risk Ratio (M‐H, Fixed, 95% CI) | 2.0 [0.20, 19.91] |
| 12 Indicator of 'progress' in labour ‐ Labour or ripe cervix in 48 hours Show forest plot | 1 | 36 | Risk Ratio (M‐H, Fixed, 95% CI) | 2.0 [1.00, 4.00] |
| 13 Indicator of 'progress' in labour ‐ Cervix unchanged after 24/48 hours Show forest plot | 2 | 119 | Risk Ratio (M‐H, Fixed, 95% CI) | 0.36 [0.20, 0.63] |
| 14 Indicator of 'progress' in labour ‐ Spontaneous labour within 72 hours Show forest plot | 1 | 80 | Risk Ratio (M‐H, Fixed, 95% CI) | 1.46 [0.68, 3.10] |
| 15 Indicator of 'progress' in labour ‐ Spontaneous labour within 48 hours Show forest plot | 1 | 83 | Risk Ratio (M‐H, Fixed, 95% CI) | 2.05 [1.27, 3.30] |
| 16 Indicator of 'progress' in labour ‐ Oxytocin requirements (IU) Show forest plot | 1 | 32 | Mean Difference (IV, Fixed, 95% CI) | ‐2.56 [‐4.01, ‐1.11] |
| 17 Indicator of 'progress' in labour ‐ Interval between day 1 and start of labour (hours) Show forest plot | 1 | 32 | Mean Difference (IV, Fixed, 95% CI) | ‐22.15 [‐35.96, ‐8.34] |
| Outcome or subgroup title | No. of studies | No. of participants | Statistical method | Effect size |
| 1 Oxytocin augmentation Show forest plot | 1 | 87 | Risk Ratio (M‐H, Fixed, 95% CI) | 0.93 [0.61, 1.43] |
| 2 Assisted (instrumental) vaginal birth Show forest plot | 1 | 87 | Risk Ratio (M‐H, Fixed, 95% CI) | 0.84 [0.44, 1.60] |
| 3 Caesarean section Show forest plot | 1 | 87 | Risk Ratio (M‐H, Fixed, 95% CI) | 1.27 [0.63, 2.58] |
| 4 NICU admission Show forest plot | 1 | 87 | Risk Ratio (M‐H, Fixed, 95% CI) | 0.98 [0.06, 15.13] |
| 5 Chorioamnionitis Show forest plot | 1 | 87 | Risk Ratio (M‐H, Fixed, 95% CI) | 1.95 [0.38, 10.12] |
| 6 Endometritis Show forest plot | 1 | 87 | Risk Ratio (M‐H, Fixed, 95% CI) | 2.93 [0.32, 27.10] |
| Outcome or subgroup title | No. of studies | No. of participants | Statistical method | Effect size |
| 1 Vaginal birth not achieved in 24/48 hours Show forest plot | 1 | 238 | Risk Ratio (M‐H, Fixed, 95% CI) | 0.97 [0.83, 1.15] |
| 2 Additional induction agents required Show forest plot | 4 | 1921 | Risk Ratio (M‐H, Random, 95% CI) | 0.87 [0.75, 1.00] |
| 3 Maternal satisfaction Show forest plot | 1 | Mean Difference (IV, Fixed, 95% CI) | Subtotals only | |
| 3.1 How do you think your labour went? (easy/very difficult) | 1 | 227 | Mean Difference (IV, Fixed, 95% CI) | ‐0.34 [‐0.94, 0.26] |
| 3.2 What do you think about home treatment? (extremely good/not at all good) | 1 | 227 | Mean Difference (IV, Fixed, 95% CI) | 0.61 [0.03, 1.19] |
| 3.3 How painful was the treatment at home? (not at all/very) | 1 | 227 | Mean Difference (IV, Fixed, 95% CI) | 0.58 [‐0.00, 1.16] |
| 3.4 How anxious were you being at home taking the treatment? (not at all/very) | 1 | 227 | Mean Difference (IV, Fixed, 95% CI) | 0.11 [‐0.39, 0.61] |
| 3.5 Would you have the same treatment at home again? (definitely/definitely not) | 1 | 227 | Mean Difference (IV, Fixed, 95% CI) | 0.62 [‐0.02, 1.26] |
| 3.6 Would you advise a friend to have the same treatment at home? (definitely/definitely not) | 1 | 227 | Mean Difference (IV, Fixed, 95% CI) | 0.41 [‐0.17, 0.99] |
| 4 Maternal satisfaction Show forest plot | 2 | Risk Ratio (M‐H, Fixed, 95% CI) | Subtotals only | |
| 4.1 Felt satisfied (very or extremely) | 1 | 1049 | Risk Ratio (M‐H, Fixed, 95% CI) | 0.80 [0.67, 0.94] |
| 4.2 Would recommend the same treatment | 1 | 1049 | Risk Ratio (M‐H, Fixed, 95% CI) | 0.84 [0.77, 0.90] |
| 4.3 Would recommend procedure | 1 | 193 | Risk Ratio (M‐H, Fixed, 95% CI) | 1.01 [0.94, 1.08] |
| 5 Perinatal death Show forest plot | 2 | 1712 | Risk Ratio (M‐H, Random, 95% CI) | 1.61 [0.08, 33.26] |
| 6 Neonatal trauma (long bone fracture, collarbone fracture, basal skull fracture, brachial plexus palsy, facial nerve palsy, phrenic nerve palsy, or subdural haemorrhage) Show forest plot | 1 | 1362 | Risk Ratio (M‐H, Fixed, 95% CI) | 0.67 [0.19, 2.37] |
| 7 Neonatal convulsions in the first 24 hours Show forest plot | 1 | 1362 | Risk Ratio (M‐H, Fixed, 95% CI) | 0.0 [0.0, 0.0] |
| 8 Tracheal ventilation > 24 hours Show forest plot | 1 | 1362 | Risk Ratio (M‐H, Fixed, 95% CI) | 1.01 [0.14, 7.14] |
| 9 Neonatal ICU admission for 5 or more days Show forest plot | 1 | 1362 | Risk Ratio (M‐H, Fixed, 95% CI) | 0.67 [0.19, 2.37] |
| 10 Neonatal transfer Show forest plot | 1 | 1362 | Risk Ratio (M‐H, Fixed, 95% CI) | 1.07 [0.67, 1.70] |
| 11 Maternal death Show forest plot | 1 | 1362 | Risk Ratio (M‐H, Fixed, 95% CI) | 0.0 [0.0, 0.0] |
| 12 Severe postpartum haemorrhage Show forest plot | 1 | 1362 | Risk Ratio (M‐H, Fixed, 95% CI) | 1.55 [0.78, 3.09] |
| 13 Deep vein thrombosis Show forest plot | 1 | 1362 | Risk Ratio (M‐H, Fixed, 95% CI) | 3.03 [0.12, 74.16] |
| 14 Oxytocin augmentation Show forest plot | 3 | 1816 | Risk Ratio (M‐H, Random, 95% CI) | 0.95 [0.78, 1.14] |
| 15 Epidural Show forest plot | 1 | 350 | Risk Ratio (M‐H, Fixed, 95% CI) | 0.94 [0.82, 1.09] |
| 16 Uterine hyperstimulation (with FHR changes) Show forest plot | 1 | 102 | Risk Ratio (M‐H, Fixed, 95% CI) | 0.2 [0.01, 4.07] |
| 17 Uterine hyperstimulation (FHR changes unclear) Show forest plot | 1 | 200 | Risk Ratio (M‐H, Fixed, 95% CI) | 0.09 [0.01, 1.62] |
| 18 Assisted (instrumental) vaginal birth Show forest plot | 2 | 1712 | Risk Ratio (M‐H, Fixed, 95% CI) | 0.81 [0.61, 1.07] |
| 19 Caesarean section Show forest plot | 6 | 2286 | Risk Ratio (M‐H, Fixed, 95% CI) | 0.99 [0.87, 1.14] |
| 20 Apgar score < 7 at 5 minutes Show forest plot | 5 | 2214 | Risk Ratio (M‐H, Fixed, 95% CI) | 0.88 [0.44, 1.76] |
| 21 NICU (or SCBU) admission Show forest plot | 6 | 1068 | Risk Ratio (M‐H, Fixed, 95% CI) | 0.89 [0.59, 1.36] |
| 22 Postpartum haemorrhage (> 500 mL) Show forest plot | 5 | 2214 | Risk Ratio (M‐H, Fixed, 95% CI) | 1.13 [0.95, 1.36] |
| 23 Neonatal infection Show forest plot | 1 | 200 | Risk Ratio (M‐H, Fixed, 95% CI) | 1.0 [0.26, 3.89] |
| 24 Side effects ‐ Maternal side effect ‐ nausea Show forest plot | 4 | 1926 | Risk Ratio (M‐H, Random, 95% CI) | 2.39 [1.54, 3.70] |
| 25 Side effects ‐ Maternal side effect ‐ headache Show forest plot | 7 | 2300 | Risk Ratio (M‐H, Random, 95% CI) | 5.45 [3.38, 8.81] |
| 26 Side effects ‐ Maternal side effects ‐ severe headache Show forest plot | 1 | 220 | Risk Ratio (M‐H, Fixed, 95% CI) | 21.21 [2.91, 154.65] |
| 27 Indicator of 'progress' in labour ‐ Admitted in established labour within 24 hours Show forest plot | 1 | 200 | Risk Ratio (M‐H, Fixed, 95% CI) | 2.75 [1.29, 5.88] |
| 28 Indicator of 'progress' in labour ‐ Bishop score > 6 or active labour at 36 hours Show forest plot | 1 | 102 | Risk Ratio (M‐H, Fixed, 95% CI) | 3.8 [1.54, 9.40] |
| 29 Time to birth ‐ Time in hours from admission to birth (all women) Show forest plot | 3 | 374 | Mean Difference (IV, Random, 95% CI) | ‐4.70 [‐6.08, ‐3.31] |
| 30 Indicator of 'progress' in labour ‐ Bishop score on admission after treatment Show forest plot | 1 | 200 | Mean Difference (IV, Fixed, 95% CI) | 2.73 [2.17, 3.29] |
| 31 Indicator of 'progress' in labour ‐ Change in Bishop score Show forest plot | 2 | 272 | Mean Difference (IV, Fixed, 95% CI) | 2.76 [2.48, 3.03] |
| 32 Time to birth ‐ Interval from onset of labour to birth (hours) Show forest plot | 1 | 200 | Mean Difference (IV, Fixed, 95% CI) | ‐1.24 [‐1.82, ‐0.66] |
| 33 Indicator of 'progress' in labour ‐ Cervix unchanged after 48 hours Show forest plot | 1 | 257 | Risk Ratio (M‐H, Fixed, 95% CI) | 0.83 [0.70, 0.97] |
| 34 Time to birth ‐ Interval from admission to vaginal birth (hours) Show forest plot | 1 | 128 | Mean Difference (IV, Fixed, 95% CI) | ‐0.70 [‐6.11, 4.71] |
| 35 Total cost of care package (GBP) Show forest plot | 1 | 350 | Mean Difference (IV, Fixed, 95% CI) | 11.98 [‐105.34, 129.30] |
| Outcome or subgroup title | No. of studies | No. of participants | Statistical method | Effect size |
| 1 Additional induction agents required Show forest plot | 1 | 56 | Risk Ratio (M‐H, Fixed, 95% CI) | 0.6 [0.31, 1.17] |
| 2 Caesarean section Show forest plot | 1 | 56 | Risk Ratio (M‐H, Fixed, 95% CI) | 0.43 [0.17, 1.11] |
| Outcome or subgroup title | No. of studies | No. of participants | Statistical method | Effect size |
| 1 Maternal satisfaction ‐ I look back positively on the treatment I received Show forest plot | 1 | 404 | Risk Ratio (M‐H, Fixed, 95% CI) | 1.04 [0.97, 1.10] |
| 2 Maternal satisfaction ‐ In retrospect, I would have preferred another treatment than received Show forest plot | 1 | 472 | Risk Ratio (M‐H, Fixed, 95% CI) | 0.51 [0.36, 0.72] |
| 3 Augmentation, induction or both Show forest plot | 1 | 521 | Risk Ratio (M‐H, Fixed, 95% CI) | 0.83 [0.71, 0.97] |
| 4 Epidural, opioids or both for pain relief Show forest plot | 1 | 521 | Risk Ratio (M‐H, Fixed, 95% CI) | 0.99 [0.76, 1.30] |
| 5 Instrumental vaginal birth Show forest plot | 1 | 521 | Risk Ratio (M‐H, Fixed, 95% CI) | 0.70 [0.46, 1.08] |
| 6 Caesarean section Show forest plot | 1 | 521 | Risk Ratio (M‐H, Fixed, 95% CI) | 1.20 [0.78, 1.86] |
| 7 Apgar < 7 at 5 minutes Show forest plot | 1 | 521 | Risk Ratio (M‐H, Fixed, 95% CI) | 1.86 [0.34, 10.06] |
| 8 Neonatal intensive care unit admission Show forest plot | 1 | 521 | Risk Ratio (M‐H, Fixed, 95% CI) | 1.09 [0.64, 1.85] |
| 9 Duration of birth (hours) Show forest plot | 1 | 521 | Mean Difference (IV, Fixed, 95% CI) | 0.40 [‐0.72, 1.52] |