Intervenciones farmacológicas y mecánicas para la inducción del trabajo de parto en el ámbito ambulatorio
Resumen
Antecedentes
La inducción del trabajo de parto se realiza para varias indicaciones y se utilizan diferentes métodos. En el caso de las mujeres con bajo riesgo de complicaciones en el embarazo, algunos métodos de inducción del trabajo de parto o de maduración del cuello uterino pueden ser adecuados para su uso en entornos ambulatorios.
Objetivos
Examinar las intervenciones farmacológicas y mecánicas para inducir el trabajo de parto en el ámbito ambulatorio en cuanto a la factibilidad, la efectividad, la satisfacción materna, los costes de la asistencia sanitaria y, cuando se disponga de información, la seguridad.
Métodos de búsqueda
Se realizaron búsquedas en el Registro de ensayos del Grupo Cochrane de Embarazo y Parto (30 de noviembre 2016) y en las listas de referencias de los estudios encontrados.
Criterios de selección
Se incluyeron los ensayos controlados aleatorizados que examinaron la maduración cervical o la inducción del trabajo de parto en ámbitos ambulatorios con agentes farmacológicos o métodos mecánicos. Los ensayos grupales fueron elegibles para inclusión.
Obtención y análisis de los datos
Dos autores de la revisión de forma independiente evaluaron los ensayos para la inclusión y el riesgo de sesgo, extrajeron los datos y verificaron su exactitud. La evidencia se evaluó mediante los criterios GRADE.
Resultados principales
Esta revisión actualizada incluyó 34 estudios de 11 métodos diferentes para la inducción del trabajo de parto con 5003 mujeres asignadas al azar, en los que las mujeres recibieron tratamiento en el domicilio o se las envió a casa después del tratamiento y la monitorización iniciales en el hospital.
Los estudios examinaron la prostaglandina vaginal e intracervical E₂ (PGE₂), el misoprostol vaginal y oral, el mononitrato de isosorbida, la mifepristona, los estrógenos, la amniotomía y la acupuntura, en comparación con placebo, ningún tratamiento o la atención habitual. Los ensayos generalmente reclutaron mujeres sanas con un embarazo a término. El riesgo de sesgo fue en su mayor parte bajo o incierto; sin embargo, en 16 ensayos el cegamiento fue incierto o no se intentó. En general, hubo datos limitados disponibles sobre los resultados principales y adicionales de la revisión. La evidencia se calificó como de calidad baja a moderada.
1. Vaginal PGE₂ versus tratamiento expectante o placebo (cinco estudios)
Menos mujeres del grupo de PGE₂ vaginal necesitaron agentes de inducción adicionales para inducir el trabajo de parto; sin embargo, los intervalos de confianza fueron amplios (riesgo relativo [RR] 0,52, intervalo de confianza [IC] del 95%: 0,27 a 0,99; 150 mujeres; dos ensayos). No hubo diferencias claras entre los grupos en cuanto a la hiperestimulación uterina (con o sin cambios en la frecuencia cardíaca fetal [FCF]) (RR 3,76; IC del 95%: 0,64 a 22,24; 244 mujeres; cuatro estudios; evidencia de calidad baja), la cesárea (RR 0,80; IC del 95% 0,49 a 1,31; 288 mujeres; cuatro estudios; evidencia de calidad baja), o el ingreso en una unidad de cuidados intensivos neonatales (UCIN) (RR 0,32; IC del 95% 0,10 a 1,03; 230 recién nacidos; tres estudios; evidencia de calidad baja).
No hubo información sobre el parto vaginal en 24, 48 o 72 horas, la duración de la estancia hospitalaria, el uso de los servicios de emergencia o la satisfacción de la madre o el cuidador. No se informó sobre casos de morbilidad grave o muertes maternas y neonatales.
2. PGE₂ intracervical versus tratamiento expectante o placebo (siete estudios)
No hubo una diferencia clara entre las mujeres que recibieron PGE₂ intracervical y ningún tratamiento o placebo en cuanto a la necesidad de agentes de inducción adicionales (RR 0,98; IC del 95%: 0,74 a 1,32; 445 mujeres; tres estudios), el parto vaginal no logrado en las 48 a 72 horas (RR 0,83; IC del 95%: 0,68 a 1,02; 43 mujeres; un estudio; evidencia de calidad baja), hiperestimulación uterina (con cambios en la FCF) (RR 2,66; IC del 95%: 0,63 a 11,25; 488 mujeres; cuatro estudios; evidencia de calidad baja), la cesárea (RR 0,90; IC del 95%: 0,72 a 1,12; 674 mujeres; siete estudios; evidencia de calidad moderada), o recién nacidos ingresados en la UCIN (RR 1,61; IC del 95%: 0,43 a 6,05; 215 recién nacidos; tres estudios; evidencia de calidad baja). No hubo roturas uterinas en el grupo de PGE₂ ni en el grupo placebo.
No hubo información disponible sobre el parto vaginal no logrado en 24 horas, la duración de la estancia hospitalaria, el uso de los servicios de emergencia, la satisfacción de la madre o del cuidador, o la morbilidad grave o la morbilidad neonatal o la muerte perinatal.
3. Misoprostol vaginal versus placebo (cuatro estudios)
Un pequeño estudio informó sobre la tasa de mortalidad perinatal, sin diferencias claras entre los grupos; no hubo muertes en el grupo de tratamiento en comparación con un mortinato (no se informó la razón) en el grupo control (RR 0,34; IC del 95%: 0,01 a 8,14; 77 recién nacidos; un estudio; evidencia de calidad baja).
No hubo diferencias claras entre los grupos en cuanto a las tasas de hiperestimulación uterina con cambios en la FCF (RR 1,97; IC del 95%: 0,43 a 9,00; 265 mujeres; tres estudios; evidencia de calidad baja), la cesárea (RR 0,94; IC del 95%: 0,61 a 1,46; 325 mujeres; cuatro estudios; evidencia de calidad baja) y los recién nacidos ingresados en la UCIN (RR 0,89; IC del 95%: 0,54 a 1,47; 325 recién nacidos; cuatro estudios; evidencia de calidad baja).
No hubo información disponible sobre el parto vaginal no logrado en 24, 48 o 72 horas, los agentes de inducción adicionales necesarios, la duración de la estancia hospitalaria, el uso de los servicios de emergencia, la satisfacción de la madre o del cuidador, morbilidad materna o neonatal graves, o mortalidad materna o neonatal.
No se encontraron diferencias sustanciales en otras comparaciones. Un estudio pequeño determinó que las mujeres que recibieron misoprostol oral tuvieron más probabilidades de dar a luz en las 24 horas (RR 0,65; IC del 95%: 0,48 a 0,86; 87 mujeres; un estudio) y tuvieron menos probabilidades de requerir agentes de inducción adicionales (RR 0,60; IC del 95%: 0,37 a 0,97; 127 mujeres; dos estudios). Las mujeres que recibieron mifepristona también tuvieron menos probabilidades de requerir agentes de inducción adicionales (RR promedio 0,59; IC del 95%: 0,37 a 0,95; 311 mujeres; cuatro estudios; I² = 74%); sin embargo, este resultado se debe interpretar con cautela debido a la gran heterogeneidad. Se incluyó un ensayo de acupuntura y otro de amniotomía ambulatoria, pero se informaron pocos resultados de la revisión.
Conclusiones de los autores
La inducción del trabajo de parto en entornos ambulatorios parece factible y los eventos adversos importantes parecen poco frecuentes; sin embargo, en general no hay evidencia suficiente para detectar diferencias. No hubo evidencia sólida de que los agentes administrados para inducir el trabajo de parto ambulatorio tuvieran una repercusión (positiva o negativa) sobre la salud materna o neonatal. Hubo alguna evidencia de que, en comparación con placebo o ningún tratamiento, los agentes de inducción redujeron la necesidad de intervenciones adicionales para inducir el trabajo de parto y acortaron el intervalo desde la intervención hasta el parto.
No existe evidencia suficiente para conocer qué métodos de inducción son los preferidos por las mujeres, o qué intervenciones son las más efectivas y seguras en el ámbito ambulatorio, o cuál es su coste efectividad. Se necesitan más estudios en los que se comparen de manera directa varios protocolos ambulatorios favorables a la mujer. Como parte de dicho trabajo, se les debe consultar a las mujeres sobre el tipo de tratamiento que preferirían.
PICOs
Resumen en términos sencillos
Fármacos e intervenciones mecánicas para la inducción del trabajo de parto en entornos ambulatorios
¿Cuál es el problema?
La inducción del trabajo de parto (iniciar el trabajo de parto artificialmente) suele ser necesaria por razones médicas, como cuando las mujeres han pasado la fecha de parto. Se pueden utilizar diferentes métodos de inducción como medicamentos (como la prostaglandina E₂, el misoprostol o el mononitrato de isosorbida) o la rotura de las membranas. Las inducciones se suelen realizar en el hospital; algunos métodos pueden ser adecuados para su administración a mujeres tratadas como pacientes ambulatorias, y se les permite ir a casa para esperar a que el trabajo de parto progrese. Se examinó la factibilidad, la efectividad y la seguridad de la inducción ambulatoria, así como la satisfacción de las mujeres y los costes de la atención médica.
¿Por qué es esto importante?
A las embarazadas que han llegado a la fecha prevista se les evaluar en el hospital como pacientes ambulatorias, con un tratamiento de inducción seguido de un seguimiento durante un breve período de tiempo, y luego enviarlas a casa. Alternativamente, se les proporciona el fármaco o el tratamiento para que lo tomen en su domicilio. Las mujeres se pueden sentir más cómodas si esperan que el trabajo de parto comience en su domicilio, y la atención ambulatoria puede ser menos costosa para los servicios sanitarios.
¿Qué evidencia se encontró?
Esta es una revisión actualizada que incluye seis estudios nuevos. Se incluyeron 34 ensayos controlados aleatorizados con 5003 embarazadas (fecha de la búsqueda: noviembre de 2016). Las mujeres estaban sanas y tenían bajo riesgo de complicaciones. Se les realizó la inducción, un tratamiento simulado (placebo) o ningún tratamiento. Hubo información limitada disponible sobre los resultados de interés, y el riesgo de sesgo generalmente fue bajo o incierto. Se consideró que la calidad de la evidencia fue baja, con unos pocos hallazgos de calidad moderada.
Las mujeres a término a las que se les indujo de manera ambulatoria pueden tener menos probabilidades de necesitar una inducción adicional, en comparación con las mujeres que recibieron placebo o ningún tratamiento. Medicamentos como la PGE₂ vaginal, la mifepristona y el misoprostol oral parecen ser efectivos. No se informaron diferencias claras en cuanto a la actividad excesiva del útero (hiperestimulación), la cesárea o la necesidad de cuidados intensivos neonatales.
Hubo muy pocas mujeres en estos ensayos para determinar las diferencias en eventos poco frecuentes como las muertes de los recién nacidos o enfermedades graves de las madres o los recién nacidos. Los ensayos no informaron sobre el uso de los servicios de emergencia para regresar al hospital. Algunos medicamentos causaron efectos secundarios (como dolores de cabeza). En general hubo poca información sobre los costes de los diferentes métodos.
¿Qué significa esto?
En el caso de las embarazadas sanas y de bajo riesgo a término, parece factible la inducción ambulatoria y la posibilidad de que las mujeres regresen a casa para esperar el inicio del trabajo de parto. Los tratamientos de inducción ambulatorios pueden reducir la necesidad de más medicamentos y el tiempo que transcurre desde el tratamiento hasta el parto. No parece aumentar la probabilidad de necesitar otras intervenciones durante el trabajo de parto. Sin embargo, no hay evidencia suficiente para determinar de manera definitiva si la inducción ambulatoria es segura. Los estudios de investigación futuros se deberían centrar en los métodos que prefieren las mujeres y que son más efectivos y seguros.
Authors' conclusions
Summary of findings
| Vaginal PGE₂ compared to placebo or expectant management for the induction of labour in outpatient settings | ||||||
| Patient or population: women requiring term labour induction | ||||||
| Outcomes | Anticipated absolute effects* (95% CI) | Relative effect | № of participants | Quality of the evidence | Comments | |
| Risk with placebo or expectant management | Risk with intravaginal PGE₂ gel | |||||
| Vaginal birth not achieved within 24 h | Study population | ‐ | (0 study) | ‐ | No included trial reported this outcome. | |
| see comment | see comment | |||||
| Vaginal birth not achieved in 48 to 72 h | Study population | ‐ | (0 study) | ‐ | No included trial reported this outcome. | |
| see comment | see comment | |||||
| Uterine hyperstimulation (fetal heart rate changes unclear) | Study population | RR 3.76 | 244 | ⊕⊕⊝⊝ | There were no events in the control group and so it was not possible to calculate the anticipated absolute effects. | |
| see comment | see comment | |||||
| Caesarean section | Study population | RR 0.80 | 288 | ⊕⊕⊝⊝ | ||
| 196 per 1000 | 157 per 1000 | |||||
| Serious neonatal morbidity or death | Study population | ‐ | (0 study) | ‐ | No included trial reported this outcome. | |
| see comment | see comment | |||||
| Serious maternal morbidity or death | Study population | ‐ | (0 studies) | ‐ | No included trial reported this outcome. | |
| see comment | see comment | |||||
| Neonatal intensive care unit admission | Study population | RR 0.32 | 230 | ⊕⊕⊝⊝ | ||
| 93 per 1000 | 30 per 1000 | |||||
| *The risk in the intervention group (and its 95% confidence interval) is based on the assumed risk in the comparison group and the relative effect of the intervention (and its 95% CI). | ||||||
| GRADE Working Group grades of evidence | ||||||
| 1 Wide confidence interval crossing the line of no effect, few events and small sample size (‐2). 2 Wide confidence interval crossing the line of no effect and small sample size (‐2). | ||||||
| Intracervical PGE₂ compared to placebo for the induction of labour in outpatient settings | ||||||
| Patient or population: women requiring induction of labour | ||||||
| Outcomes | Anticipated absolute effects* (95% CI) | Relative effect | № of participants | Quality of the evidence | Comments | |
| Risk with placebo | Risk with intracervical PGE₂ | |||||
| Vaginal birth not achieved within 24 h | Study population | ‐ | (0 study) | ‐ | No included trial reported this outcome. | |
| see comment | see comment | |||||
| Vaginal birth not achieved in 48 to 72 h | Study population | RR 0.83 | 43 | ⊕⊕⊝⊝ | ||
| 1000 per 1000 | 830 per 1000 | |||||
| Uterine hyperstimulation (with fetal heart rate changes) | Study population | RR 2.66 | 488 | ⊕⊕⊝⊝ | ||
| 4 per 1000 | 11 per 1000 | |||||
| Caesarean section | Study population | RR 0.90 | 674 | ⊕⊕⊕⊝ | ||
| 310 per 1000 | 279 per 1000 | |||||
| Serious neonatal morbidity or death | Study population | ‐ | (0 study) | ‐ | ||
| see comment | see comment | |||||
| Serious maternal morbidity or death | Study population | ‐ | (0 study) | ‐ | ||
| see comment | see comment | |||||
| Neonatal intensive care unit admission | Study population | RR 1.61 | 215 | ⊕⊕⊝⊝ | ||
| 28 per 1000 | 44 per 1000 | |||||
| *The risk in the intervention group (and its 95% confidence interval) is based on the assumed risk in the comparison group and the relative effect of the intervention (and its 95% CI). | ||||||
| GRADE Working Group grades of evidence | ||||||
| 1 Wide confidence interval crossing the line of no effect, few events and small sample size (‐2). 2 Wide confidence interval crossing the line of no effect (‐1). | ||||||
| Vaginal misoprostol compared to placebo for the induction of labour in outpatient settings | ||||||
| Patient or population: women requiring induction of labour | ||||||
| Outcomes | Anticipated absolute effects* (95% CI) | Relative effect | № of participants | Quality of the evidence | Comments | |
| Risk with placebo | Risk with vaginal misoprostol | |||||
| Vaginal birth not achieved within 24 h | Study population | ‐ | (0 study) | ‐ | No included trial reported this outcome. | |
| see comment | see comment | |||||
| Vaginal birth not achieved within 48 and 72 h | Study population | ‐ | (0 study) | ‐ | No included trial reported this outcome. | |
| see comment | see comment | |||||
| Uterine hyperstimulation (with fetal heart rate changes) | Study population | RR 1.97 | 265 | ⊕⊕⊝⊝ | ||
| 15 per 1000 | 29 per 1000 | |||||
| Caesarean section | Study population | RR 0.94 | 325 | ⊕⊕⊝⊝ | ||
| 206 per 1000 | 194 per 1000 | |||||
| Serious neonatal morbidity or death | Study population | RR 0.34 | 77 | ⊕⊕⊝⊝ | Study reported perinatal deaths. | |
| 26 per 1000 | 9 per 1000 | |||||
| Serious maternal morbidity or death | Study population | ‐ | (0 study) | ‐ | No included trial reported this outcome. | |
| see comment | see comment | |||||
| Neonatal intensive care unit admission | Study population | RR 0.89 | 325 | ⊕⊕⊝⊝ | ||
| 147 per 1000 | 131 per 1000 | |||||
| *The risk in the intervention group (and its 95% confidence interval) is based on the assumed risk in the comparison group and the relative effect of the intervention (and its 95% CI). | ||||||
| GRADE Working Group grades of evidence | ||||||
| 1 Wide confidence interval crossing the line of no effect, few events and small sample size (‐2). 2 Wide confidence interval crossing the line of no effect and small sample size (‐2). | ||||||
Background
Introduction
This Cochrane Review was first published in 2010 and updated in 2017. The review complements existing reviews on labour induction examining effectiveness and safety.
Description of the condition
The number of women whose labours are induced has risen over the past two decades. Rates in the USA and the UK now exceed 20% of all births (Glantz 2003; Kirby 2004; NHS 2014‐15). There is considerable variation in reported induction rates, and the reasons for this variability are often not clear. In some units in the USA, up to half of all births follow induction of labour (Rayburn 2002). Fewer data are available on induction rates in facilities in low‐ and middle‐income countries; however, the World Health Organization (WHO) Global Survey of Maternal and Perinatal Health of facility obstetric practices in 22 countries reported induction rates of 11.4% in eight Latin American countries, 4.4% in seven African countries, and 12.1% in nine Asian countries (Guerra 2009; Vogel 2013).
It has not been definitively shown that increased use of induction has been associated with improvements in maternal, fetal or neonatal outcomes; women who are induced also tend to be less satisfied with their experience of childbirth (Shetty 2005). In this context, and with increasing pressure on healthcare resources, it is particularly important to address questions about how to provide induction of labour safely and effectively, in settings and ways that are acceptable to women, and in the most cost‐effective way possible.
Description of the intervention
A number of pharmacological and mechanical methods of cervical ripening and induction of labour are available, and these have been the focus of a series of Cochrane Reviews that share generic protocols (Hofmeyr 2009). On the basis of these Cochrane Reviews, WHO currently recommends oral misoprostol (25 μg, 2 hourly) and vaginal low‐dose misoprostol (25 μg, 6 hourly) for induction of labour (misoprostol is not recommended for women with a previous caesarean section) (WHO 2011). If prostaglandins are not available, WHO recommends intravenous oxytocin alone for induction. Balloon catheter is recommended for induction, but amniotomy alone is not. The combination of balloon catheter plus oxytocin is recommended as an alternative method of induction of labour when prostaglandins (including misoprostol) are not available or are contra‐indicated. Importantly, the WHO recommendations stipulate the need to assess maternal and fetal well‐being during induction.
In these reviews, the safety and effectiveness of different methods and agents have been examined, but less attention was paid to the setting in which cervical ripening and induction of labour take place. In this review, we brought together some of the studies included in previous reviews, focusing specifically on those studies where labour induction or cervical ripening was carried out in outpatient settings. For most methods of induction, the number of trials carried out in outpatient settings is likely to be small, making it difficult to definitively establish benefits and harms. The purpose of this review was to examine issues such as benefits and harms, health service utilisation, feasibility and women's views about their care. For some interventions, there may be sufficient data to address questions of effectiveness and safety. In this way, this review complements others in the suite rather than simply duplicating findings.
A related review included trials in which the same methods of ripening or induction were compared in outpatient and hospital settings (Kelly 2013).
Induction of labour is carried out for a variety of indications and using a range of pharmacological, mechanical and other methods. The main indication for induction of labour is prolonged pregnancy, and there is evidence from a related Cochrane Review (Gülmezoglu 2012) that for pregnancies which have continued beyond 41 weeks, induction of labour may reduce perinatal mortality. Other inductions are carried out on an individual basis. Most inductions of labour are carried out in inpatient settings. Outpatient procedures may not be safe for women with some risk factors, and some methods may only be feasible and safe in hospital, or in settings with specialised staff and facilities available. For example, outpatient induction is unlikely to be suitable for women with serious medical conditions or complications in the current pregnancy (Sawai 1995). Some women may be unsuitable for home care simply because they live at an unacceptable travelling distance from emergency care facilities.
How the intervention might work
Ideally, the agents or methods used for cervical ripening at home would achieve changes in the cervix similar to the normal physiological changes which promote the 'spontaneous' onset of labour, but without causing uterine contractions (Sawai 1995). Most methods for cervical ripening or induction of labour do have some undesirable side effects, including, on occasions, excessive uterine activity. The consequences of excessive uterine activity as a result of iatrogenic uterine hyperstimulation can be life‐threatening for the mother and fetus.
Sometimes drugs to induce labour can only be administered by intravenous infusion or by repeated injections, or using specialist procedures that cannot easily be carried out in an outpatient setting. Drugs that can be taken orally, or procedures that are simple to perform, and require only limited monitoring, may lend themselves more readily for use in an outpatient setting. At least theoretically, outpatient induction may offer a number of advantages to women, clinical staff and providers of health services. Outpatient induction may be more convenient for and preferred by women; it may reduce hospital bed occupancy, and therefore, be associated with lower healthcare costs.
A number of papers have set out indications for outpatient cervical ripening or induction such as post‐dates pregnancy in women who are otherwise well, and where there have been no signs of fetal distress. Several outpatient induction protocols have been described in observational studies suggesting that such inductions are feasible, safe and acceptable to women (Elliott 1992; McGill 2007; Neale 2002).
Why it is important to do this review
For some methods, and for selected groups of women, induction of labour is already being carried out in outpatient settings. This Cochrane Review brings together evidence from available trials in outpatient settings to assess benefits and harms of outpatient induction, as well as preferences of women and providers, and the feasibility of their use in outpatient settings. To achieve this, we pooled data from trials examining the same methods to address questions of safety.
In the context of this review, the issue of safety is of great importance. At the same time, it is unlikely that safety could be adequately addressed in studies of randomised cohorts. Severe maternal and neonatal mortality and morbidity are likely to be very rare events in the low‐risk population included in studies of outpatient induction. Information on adverse events and the relative safety of outpatient methods is most likely to emerge where there have been several large studies and where the same methods have been directly compared in different settings. Information on rare adverse events takes time to accumulate, but by systematically recording information on adverse events in all the studies included in the review, we may shed some light on this question.
We did not include studies where the same method of cervical ripening or induction of labour was compared in outpatient versus inpatient settings: this has been addressed in a related Cochrane Review (Kelly 2013).
Objectives
To examine pharmacological and mechanical interventions to induce labour or ripen the cervix in outpatient settings in terms of effectiveness, maternal satisfaction, healthcare costs and, where information is available, safety.
This Cochrane Review complements existing Cochrane Reviews on labour induction examining effectiveness and safety.
Methods
Criteria for considering studies for this review
Types of studies
All published and unpublished randomised trials which compared different methods of cervical ripening or induction of labour carried out in outpatient settings were eligible for inclusion. All trials included random allocation to intervention and control groups. We did not include quasi‐randomised trials. We included studies reported in abstracts and brief reports provided that sufficient information was available to allow us to assess eligibility and risk of bias; where such information was not provided we attempted to contact trial authors. We planned to include cluster‐randomised trials if they were otherwise eligible. We did not include cross‐over studies because we did not consider they were appropriate in this topic area.
Types of participants
Pregnant women (with a viable fetus) at or near team (greater than 35 weeks) in an outpatient setting. Specifically, women in whom induction of labour is being considered, but where expectant management is acceptable.
Types of interventions
We included studies examining outpatient cervical ripening or induction of labour with pharmacological agents or mechanical methods. We included studies where different methods of induction of labour in outpatient settings were compared; where a method was compared with a placebo; where a method was compared with expectant management or routine care; or where different doses of the same drug were compared. 'Outpatient' was defined by the trialists and included any cervical ripening or induction of labour intervention (with the exception of membrane sweeping) that can be carried out at home or within community healthcare settings. It also includes a package of care initially provided in hospital (fetal monitoring, drug administration) after which the woman is allowed home until later review or admission in labour. We did not include interventions where women remain in hospital throughout (even if they were in 'day‐care' settings, or in other parts of the hospital, but not formally admitted as inpatients) because a purpose of this review was to examine outcomes where women do not have immediate access to emergency care facilities. Trials comparing inpatient versus outpatient induction of labour were considered in Kelly 2013.
Types of outcome measures
Clinically relevant outcomes for trials of methods of cervical ripening and labour induction have been pre‐specified by two authors of labour induction reviews (Justus Hofmeyr and Zarko Alfirevic) (Hofmeyr 2009). We have used most of these outcomes (relevant to both inpatient and outpatient settings) in this review.
In addition, we attempted to use relevant outcome measures to quantify any cost effectiveness benefits of outpatient ripening.
Main outcomes
-
Vaginal birth not achieved within 24 hours.
-
Additional induction agents required.
-
Length of hospital stay.
-
Use of emergency services.
-
Maternal satisfaction
-
Caregiver satisfaction
-
Serious neonatal morbidity or perinatal death (composite outcome will include, for example, seizures, birth asphyxia defined by trialists, neonatal encephalopathy, disability in childhood).
-
Serious maternal morbidity or death (composite outcome will include, for example, uterine rupture, admission to intensive care unit, septicaemia).
Additional outcomes of interest
Additional outcomes of interest related to measures of effectiveness, complications and satisfaction
Measures of effectiveness
-
Vaginal birth not achieved within 48 and 72 hours.
-
Randomisation to birth interval.
-
Oxytocin augmentation.
-
Pain relief requirements (epidural, opioids).
Complications
-
Uterine hyperstimulation (with fetal heart rate (FHR) changes).
-
Uterine hyperstimulation (without FHR changes).
-
Instrumental vaginal birth.
-
Caesarean section.
-
Apgar score < 7 at 5 minutes.
-
Neonatal intensive care unit admission.
-
Perinatal death.
-
Postpartum haemorrhage (as defined by the trial authors).
-
Serious maternal complications (considered as separate outcomes, e.g. intensive care unit admission, septicaemia, uterine rupture).
-
Serious neonatal complications (considered as separate outcomes).
In the absence of formal economic evaluation, we had planned to estimate potential cost savings and the impact of interventions used within an outpatient setting. These estimates could involve using some measures of effectiveness and complications in combination with estimates of healthcare provision.
We also included some additional outcomes that may serve as proxy measures of progress towards labour or birth.
-
Indicators of progress in labour such as: preterm rupture of membranes, diagnosis of active/spontaneous labour, self‐referral back to hospital, Bishop scores at fixed time points post‐randomisation.
-
Failed induction (as defined by trialists, but excluding the use of oxytocin for augmentation in women already in established labour).
-
Time to birth including the interval from randomisation to birth; interval to admission along with length of labour.
-
Side effects or adverse outcomes (not specified above) related or possibly related to the intervention.
Detailed definitions for outcomes
-
Perinatal and maternal morbidity and mortality are composite outcomes. This is not an ideal solution because some components are clearly less severe than others. It is possible for one intervention to cause more deaths but less severe morbidity. However, in the context of labour induction at term, this is unlikely. All these events are rare, and a modest change in their incidence will be easier to detect if composite outcomes are presented. The incidence of individual components are explored as additional outcomes (see above).
-
'Uterine rupture' includes all clinically significant ruptures of unscarred or scarred uteri. Trivial scar dehiscence noted incidentally at the time of surgery is excluded.
-
The terminology of uterine hyperstimulation is problematic (Curtis 1987). In the reviews, the term 'uterine hyperstimulation' is defined as uterine tachysystole (more than 5 contractions per 10 minutes for at least 20 minutes) and uterine hypersystole/hypertonus (a contraction lasting at least 2 minutes).
-
'Uterine hyperstimulation with FHR changes' is usually defined as uterine hyperstimulation syndrome (tachysystole or hypersystole with FHR changes such as persistent decelerations, tachycardia or decreased short‐term variability). However, due to varied reporting, there is the possibility of subjective bias in the interpretation of these outcomes. Also, it is not always clear from trials if these outcomes are reported in a mutually exclusive manner. More importantly, continuous monitoring is unlikely in an outpatient setting. Therefore, there is a high risk of biased reporting of uterine hyperstimulation (with or without FHR changes). It is possible that bias will favour the outpatient setting (i.e. by failure to recognise mild forms of hyperstimulation without continuous monitoring). On the other hand, clinicians who favour inpatient induction may, in the absence of continuous monitoring, label any maternal description of painful, frequent uterine contractions as hyperstimulation. Therefore, in the absence of blinding, hyperstimulation and other 'soft' outcomes should be interpreted with extreme caution.
While we sought data on all of the outcomes listed above, we documented only those with data in the analysis tables. We included outcomes in the analysis if reasonable measures were taken to minimise observer bias, and data were available according to original treatment allocation.
Search methods for identification of studies
The following methods section of this review is based on a standard template used by Cochrane Pregnancy and Childbirth.
Electronic searches
We searched Cochrane Pregnancy and Childbirth’s Trials Register by contacting their Information Specialist (30 November 2016).
The Register is a database containing over 23,000 reports of controlled trials in the field of pregnancy and childbirth. For full search methods used to populate Pregnancy and Childbirth’s Trials Register including the detailed search strategies for CENTRAL, MEDLINE, Embase and CINAHL; the list of handsearched journals and conference proceedings, and the list of journals reviewed via the current awareness service, please follow this link to the editorial information about the Cochrane Pregnancy and Childbirth in the Cochrane Library and select the ‘Specialized Register ’ section from the options on the left side of the screen.
Briefly, Cochrane Pregnancy and Childbirth’s Trials Register is maintained by their Information Specialist and contains trials identified from:
-
monthly searches of the Cochrane Central Register of Controlled Trials (CENTRAL);
-
weekly searches of MEDLINE (Ovid);
-
weekly searches of Embase (Ovid);
-
monthly searches of CINAHL (EBSCO);
-
handsearches of 30 journals and the proceedings of major conferences;
-
weekly current awareness alerts for a further 44 journals plus monthly BioMed Central email alerts.
Search results are screened by two people and the full text of all relevant trial reports identified through the searching activities described above is reviewed. Based on the intervention described, each trial report is assigned a number that corresponds to a specific Pregnancy and Childbirth review topic (or topics), and is then added to the Register. The Information Specialist searches the Register for each review using this topic number rather than keywords. This results in a more specific search set which has been fully accounted for in the relevant review sections (Included studies; Excluded studies; Studies awaiting classification).
Searching other resources
We searched the reference lists of retrieved studies.
We did not apply any language or date restrictions.
Data collection and analysis
For methods used in the previous version of this review, see Dowswell 2010.
For this update, the following methods were used to assess the 10 reports that were identified as a result of the updated search.
The following methods section of this review is based on a standard template used by Cochrane Pregnancy and Childbirth.
Selection of studies
Two review authors independently assessed all the potential studies identified as a result of the search strategy for inclusion. We resolved any disagreement through discussion or, if required, we consulted a third review author.
Data extraction and management
We designed a form to extract data. For eligible studies, two review authors extracted the data using the agreed form. We resolved discrepancies through discussion or, if required, we consulted the third review author. Data were entered into Review Manager software (RevMan 2014) and checked for accuracy.
When information regarding any of the above was unclear, we planned to contact authors of the original reports to provide further details.
Assessment of risk of bias in included studies
Two review authors independently assessed risk of bias for each study using the criteria outlined in the Cochrane Handbook for Systematic Reviews of Interventions (Higgins 2011). Any disagreement was resolved by discussion or by involving a third assessor.
(1) Random sequence generation (checking for possible selection bias)
We described for each included study the method used to generate the allocation sequence in sufficient detail to allow an assessment of whether it should produce comparable groups.
We assessed the method as:
-
low risk of bias (any truly random process, e.g. random number table; computer random number generator);
-
high risk of bias (any non‐random process, e.g. odd or even date of birth; hospital or clinic record number);
-
unclear risk of bias.
(2) Allocation concealment (checking for possible selection bias)
We described for each included study the method used to conceal allocation to interventions prior to assignment and assessed whether intervention allocation could have been foreseen in advance of, or during recruitment, or changed after assignment.
We assessed the methods as:
-
low risk of bias (e.g. telephone or central randomisation; consecutively numbered sealed opaque envelopes);
-
high risk of bias (open random allocation; unsealed or non‐opaque envelopes, alternation; date of birth);
-
unclear risk of bias.
(3.1) Blinding of participants and personnel (checking for possible performance bias)
We described for each included study the methods used, if any, to blind study participants and personnel from knowledge of which intervention a participant received. We considered that studies were at low risk of bias if they were blinded, or if we judged that the lack of blinding unlikely to affect results. We assessed blinding separately for different outcomes or classes of outcomes.
We assessed the methods as:
-
low, high or unclear risk of bias for participants;
-
low, high or unclear risk of bias for personnel.
(3.2) Blinding of outcome assessment (checking for possible detection bias)
We described for each included study the methods used, if any, to blind outcome assessors from knowledge of which intervention a participant received. We assessed blinding separately for different outcomes or classes of outcomes.
We assessed methods used to blind outcome assessment as:
-
low, high or unclear risk of bias.
(4) Incomplete outcome data (checking for possible attrition bias due to the amount, nature and handling of incomplete outcome data)
We described for each included study, and for each outcome or class of outcomes, the completeness of data including attrition and exclusions from the analysis. We stated whether attrition and exclusions were reported and the numbers included in the analysis at each stage (compared with the total randomised participants), reasons for attrition or exclusion where reported, and whether missing data were balanced across groups or were related to outcomes. Where sufficient information was reported, or could be supplied by the trial authors, we planned to re‐include missing data in the analyses which we undertook.
We assessed methods as:
-
low risk of bias (e.g. no missing outcome data; missing outcome data balanced across groups);
-
high risk of bias (e.g. numbers or reasons for missing data imbalanced across groups; ‘as treated’ analysis done with substantial departure of intervention received from that assigned at randomisation);
-
unclear risk of bias.
(5) Selective reporting (checking for reporting bias)
We described for each included study how we investigated the possibility of selective outcome reporting bias and what we found.
We assessed the methods as:
-
low risk of bias (where it is clear that all of the study’s pre‐specified outcomes and all expected outcomes of interest to the review have been reported);
-
high risk of bias (where not all the study’s pre‐specified outcomes have been reported; one or more reported primary outcomes were not pre‐specified; outcomes of interest are reported incompletely and so cannot be used; study fails to include results of a key outcome that would have been expected to have been reported);
-
unclear risk of bias.
(6) Other bias (checking for bias due to problems not covered by (1) to (5) above)
We described for each included study any important concerns we had about other possible sources of bias.
(7) Overall risk of bias
We made explicit judgements about whether studies were at high risk of bias, according to the criteria given in the Handbook (Higgins 2011). With reference to (1) to (6) above, we planned to assess the likely magnitude and direction of the bias and whether we considered it is likely to impact on the findings. In future updates, we will explore the impact of the level of bias through undertaking sensitivity analyses (see Sensitivity analysis).
Assessment of the quality of the evidence using the GRADE approach
For this update the quality of the evidence was assessed using the GRADE approach as outlined in the GRADE handbook to assess the quality of the body of evidence relating to the following outcomes for the main comparisons (vaginal PGE₂ versus placebo or expectant management; intracervical PGE₂ versus placebo or expectant management; vaginal misoprostol versus placebo or expectant management):
-
Vaginal birth not achieved within 24 hours.
-
Vaginal birth not achieved within 48 and 72 hours.
-
Uterine hyperstimulation with FHR changes.
-
Caesarean section.
-
Serious neonatal morbidity or perinatal death (composite outcome will include, for example, seizures, birth asphyxia defined by trialists, neonatal encephalopathy, disability in childhood).
-
Serious maternal morbidity or death (composite outcome will include, for example, uterine rupture, admission to intensive care unit, septicaemia).
-
Neonatal intensive care unit admission.
GRADEpro Guideline Development Tool was used to import data from Review Manager 5.3 (RevMan 2014) to create 'Summary of findings' tables. A summary of the intervention effect and a measure of quality for each of the above outcomes was produced using the GRADE approach. The GRADE approach uses five considerations (study limitations, consistency of effect, imprecision, indirectness and publication bias) to assess the quality of the body of evidence for each outcome. The evidence can be downgraded from 'high quality' by one level for serious (or by 2 levels for very serious) limitations, depending on assessments for risk of bias, indirectness of evidence, serious inconsistency, imprecision of effect estimates or potential publication bias.
Measures of treatment effect
Dichotomous data
We presented results as summary risk ratio with 95% confidence intervals for dichotomous data.
Continuous data
We used the mean difference if outcomes were measured in the same way between trials for continuous data. We used the standardised mean difference to combine trials that measured the same outcome, but used different methods.
Unit of analysis issues
Cluster‐randomised trials
If future searches identify eligible cluster‐randomised trials, we will include these in the analyses along with individually randomised trials. We will adjust their sample sizes or standard errors using the methods described in the Handbook (Section 16.3.4 or 16.3.6 as appropriate) using an estimate of the intracluster correlation co‐efficient (ICC) derived from the trial (if possible), from a similar trial or from a study of a similar population. If we use ICCs from other sources, we will report this and conduct sensitivity analyses to investigate the effect of variation in the ICC. If we identify both cluster‐randomised trials and individually‐randomised trials, we plan to synthesise the relevant information. We will consider it reasonable to combine the results from both if there is little heterogeneity between the study designs and the interaction between the effect of intervention and the choice of randomisation unit is considered to be unlikely.
We will also acknowledge heterogeneity in the randomisation unit and perform a sensitivity analysis to investigate the effects of the randomisation unit.
Cross‐over trials
We decided to exclude cross‐over trials as we did not think this design was appropriate in this topic area.
Other unit of analysis issues
Trials with multiple arms
Two trials had multiple intervention arms ‐ Larmon 2002 and Magann 1998. Larmon 2002 was a three‐arm trial comparing intracervical PGE₂, oestrogen and placebo and is included in more than one comparison. In Magann 1998, one intervention was not eligible for inclusion so data for this were not included. If we identify further multiple‐armed trials in future searches, we will divide the control group in the analysis to avoid double counting, and follow the methods set out in the Handbook (Higgins 2011).
Dealing with missing data
Levels of attrition were noted for included studies. In future updates, if more eligible studies are included, the impact of including studies with high levels of missing data in the overall assessment of treatment effect will be explored by using sensitivity analysis.
For all outcomes, analyses were carried out, as far as possible, on an intention‐to‐treat basis, i.e. we attempted to include all participants randomised to each group in the analyses. The denominator for each outcome in each trial was the number randomised minus any participants whose outcomes were known to be missing.
Assessment of heterogeneity
We assessed statistical heterogeneity in each meta‐analysis using the Tau², I² and Chi² statistics. We regarded heterogeneity as substantial if I² was greater than 30% and either Tau² was greater than zero, or there was a low P value (< 0.10) in the Chi² test for heterogeneity. If we identified substantial heterogeneity (> 30%), we planned to explore the source in pre‐specified subgroup analysis.
Assessment of reporting biases
In future updates, if there are 10 or more studies in the meta‐analysis we will investigate reporting biases (such as publication bias) using funnel plots. We will assess funnel plot asymmetry visually. If asymmetry is suggested by a visual assessment, we will perform exploratory analyses to investigate the source.
Data synthesis
We carried out statistical analysis using the Review Manager software (RevMan 2014). We used fixed‐effect meta‐analysis for combining data where it was reasonable to assume that studies were estimating the same underlying treatment effect: i.e. where trials were examining the same intervention, and the trials’ populations and methods were judged sufficiently similar.
If there was clinical heterogeneity sufficient to expect that the underlying treatment effects differed between trials, or if substantial statistical heterogeneity was detected, we used random‐effects meta‐analysis to produce an overall summary if an average treatment effect across trials was considered clinically meaningful. The random‐effects summary will be treated as the average range of possible treatment effects and we will discuss the clinical implications of treatment effects differing between trials. If the average treatment effect is not clinically meaningful, we will not combine trials. If we used random‐effects analyses, the results were presented as the average treatment effect with 95% confidence intervals, and the estimates of Tau² and I².
Subgroup analysis and investigation of heterogeneity
If we identified substantial heterogeneity, we investigated the source using subgroup analyses. We considered whether an overall summary was meaningful, and if it was, we used random‐effects analysis to produce the effect.
If sufficient data were available, we planned to carry out the following subgroup analyses.
-
Nulliparous versus multiparous.
-
Induction indication.
We planned to use only the primary outcomes in subgroup analysis.
We also planned to assess subgroup differences by interaction tests available in RevMan (RevMan 2014), and to report the results of subgroup analyses quoting the Chi² statistic and P value, and the interaction test I² value. However, insufficient data were available to permit any subgroup analyses.
Sensitivity analysis
We planned to carry out sensitivity analyses to explore the effect of trial quality assessed by concealment of allocation, high attrition rates, or both, with poor quality studies being excluded from the analyses in order to assess whether this makes any difference to the overall result. Gaffaney 2009 and Rijnders 2011 were assessed as being at high risk of attrition bias. However, insufficient data were available to permit any sensitivity analyses.
Results
Description of studies
Results of the search
The previous version of this review identified 72 reports, representing 55 separate studies (some trials were reported in more than one published paper) (Dowswell 2010). A total of 28 studies were included in the review, 25 were excluded and two awaiting classification (Ascher‐Walsh 2000; Thakur 2005) (Figure 1).

Study flow diagram.
For this update, the search identified an additional 10 reports. We also reassessed two studies that were awaiting further classification in Dowswell 2010. A total of six new studies were included (Agarwal 2012; Attanayake 2014; Gaffaney 2009; Ghanaie 2013; Rijnders 2011; Schmitz 2014), one excluded (Rezk 2014;), and one new study is awaiting classification (Mostaghel 2009). One report was included as an additional report of a study already included in the review (Bollapragada 2006a). Both studies previously awaiting classification (Ascher‐Walsh 2000; Thakur 2005) remain; and ISRCTN47736435 (previously excluded) was included as an additional report of Rijnders 2011. See Characteristics of studies awaiting classification tables.
Included studies
We included 34 studies that involved a total of 5003 women (Characteristics of included studies).
The studies included a variety of different comparisons.
-
Vaginal prostaglandin (PGE₂) versus expectant management or placebo (5 studies) (Hage 1993; Newman 1997; O'Brien 1995; Sawai 1991; Sawai 1994).
-
Intracervical prostaglandin (PgE₂) versus expectant management or placebo (7 studies) (Buttino 1990; Gittens 1996; Larmon 2002; Lien 1998; Magann 1998; McKenna 1999; Rayburn 1999).
-
Vaginal misoprostol versus placebo (4 studies) (Incerpi 2001; McKenna 2004; Oboro 2005; Stitely 2000).
-
Vaginal misoprostol 25 µg versus 50 µg (1 study) (Kipikasa 2005).
-
Intracervical prostaglandin (PGE₂) versus vaginal misoprostol (1 study) (Meyer 2005).
-
Oral misoprostol versus placebo (2 studies) (Gaffaney 2009; Lyons 2001).
-
Mifepristone versus placebo (5 studies) (Elliott 1998; Frydman 1992; Giacalone 1998; Lelaidier 1994; Stenlund 1999).
-
Oestrogen versus placebo (1 study) (Larmon 2002).
-
Vaginal isosorbide mononitrate (IMN) versus placebo (7 studies) (Agarwal 2012; Attanayake 2014; Bollapragada 2006a; Bullarbo 2007; Ghanaie 2013; Habib 2008; Schmitz 2014).
-
Acupuncture versus routine care (1 study) (Harper 2006).
-
Outpatient amniotomy for induction versus routine care (1 study) (Rijnders 2011).
In all trials it was intended that women would spend part of the study period at home. In most studies women received the initial treatment in a hospital setting (and frequently underwent a period of surveillance) before discharge home. Women were advised to seek help or return to hospital if any problems arose, if labour commenced, or after a predefined period. In some studies, women self‐administered the study intervention at home, and again were advised to return either if they had concerns, if labour started, or for review after a specified period (e.g. in Bollapragada 2006a women scheduled for labour induction were given vaginal IMN with instructions on self‐administration 48, 32 and 16 hours before the scheduled induction time).
The studies almost invariably recruited healthy women at term. A small number of studies focused on women with particular histories. In the trials by Gittens 1996, Lelaidier 1994 and Rayburn 1999 women who had a previous caesarean birth were recruited; Incerpi 2001 focused on women with insulin‐dependent diabetes and Newman 1997 included women with diabetes along with those requiring induction of labour for post maturity. Two studies (Lelaidier 1994; Rayburn 1999) recruited women who had a previous caesarean section and who were aiming to achieve a vaginal birth. In the remaining studies the main indication for induction of labour was prolonged pregnancy, although recruitment was not always restricted to this group. Six studies included only primiparous women (Bollapragada 2006a; Elliott 1998; Ghanaie 2013; Hage 1993; Harper 2006; Schmitz 2014) and two multiparous women only (Lelaidier 1994; Rayburn 1999).
The main recruitment criterion in all of these studies was that labour had not already started (i.e. women were not having regular painful contractions). Most studies also specified a Bishop score indicating an unfavourable cervix as an inclusion criterion although the definition of an unfavourable cervix (low Bishop score) varied. No studies specifically recruited women where the cervix was favourable. Where it was mentioned, studies invariably recruited women with intact membranes; no studies specifically focused on women with ruptured membranes. Most of these studies specifically mentioned that multiple pregnancies were excluded, and at recruitment it was usually specified as an inclusion criterion that the fetus was in good condition with no signs of distress (e.g. normal fetal heart rate monitoring and normal amniotic fluid volume).
Further information on interventions, participants and inclusion and exclusion criteria are set out in the Characteristics of included studies tables.
Excluded studies
We excluded 25 trials (Characteristics of excluded studies). The main reason for excluding studies was study design.
Four studies used a cross‐over design; we had decided to exclude cross‐over trials as we did not think this design was appropriate in this topic area; in all of these studies the focus was on breast stimulation. Women in the control groups initially received no intervention, while those in intervention groups were asked to stimulate their nipples for a specified time period; after this time period, women then crossed over into the control or intervention arm (Adewole 1993; Di Lieto 1989; Elliott 1984; Salmon 1986).
In three studies (Damania 1988; Griffin 2003; Manidakis 1999) there was too little information on study methods to allow us to ascertain whether group allocation was truly random, or to allow us to carry out an assessment of risk of bias (the studies by Griffin 2003 and Manidakis 1999 were reported in brief abstracts; we attempted to contact the authors for more information without success). Two studies used quasi‐randomisation and were at high risk of bias (Garry 2000; Kadar 1990). Evans 1983 described findings from two separate studies, one of which seemed to be carried out in a hospital setting and included a control group receiving no treatment; a second "outpatient" study did not include a control group; different doses of porcine ovarian relaxin were compared. In the study by Ohel 1996, whilst there seemed to be random allocation to treatment groups, results were not reported by randomisation group, and we were not able to include data in the review. In one study reported in a brief abstract, no original data were reported in the results section (Krammer 1995).
A number of studies focused on interventions that we had either specifically excluded (e.g. Doany 1997; Kaul 2004; Magann 1999; Salamalekis 2000 looked at membrane sweeping), or interventions that are not currently used in clinical practice (extra amniotic saline infusion was examined by Moghtadaei 2007; it was not clear that women in both arms of this trial were discharged home; Spallicci 2007 examined the use of hyaluronidase injection).
In five studies it was not clear that the study was carried out in an outpatient setting or that the women were expected to spend some of the study period at home (Damania 1992; Herabutya 1992; Rayburn 1988; Voss 1996; Ziaei 2003). One study (Rezk 2014) was not conducted in an outpatient setting.
Dorfman 1987 looked at homeopathic preparations (caulophyllum‐arnica‐actea and racemosa‐pulsatilla‐gelsemium) used with the intention of generally preparing women for childbirth rather than for labour induction.
Risk of bias in included studies
Summary of risk bias assessments are presented graphically (Figure 2; Figure 3).

Risk of bias summary: review authors' judgements about each risk of bias item for each included study.
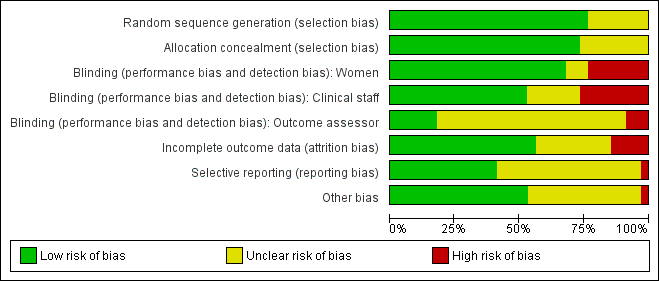
Risk of bias graph: review authors' judgements about each risk of bias item presented as percentages across all included studies.
Allocation
We assessed most of the included studies as using adequate methods to generate the randomisation sequence and to conceal group allocation.
Sequence generation was either computer generated or derived from random number tables in 26 of the 34 included studies. In eight trials the methods used to generate the randomisation order were not clear (Elliott 1998; Frydman 1992; Gittens 1996; Hage 1993; Lelaidier 1994; Lyons 2001; Newman 1997; Sawai 1991).
Eighteen studies used either external or pharmacy randomisation services, or identical coded drug packs from pharmacy to conceal group allocation (Bollapragada 2006a; Buttino 1990; Frydman 1992; Gaffaney 2009; Giacalone 1998; Habib 2008; Incerpi 2001; Kipikasa 2005; Lelaidier 1994; Lien 1998; McKenna 1999; McKenna 2004; O'Brien 1995; Stenlund 1999; Rijnders 2011; Sawai 1994; Schmitz 2014; Stitely 2000). Four trials used sealed, opaque, sequentially numbered envelopes to conceal allocation (Bullarbo 2007; Harper 2006; Larmon 2002; Magann 1998). Opaque envelopes were used in Attanayake 2014 and Meyer 2005 , although it was not stated that they were sealed. Oboro 2005 used sealed envelopes, but did not state they were opaque. In nine trials, methods to conceal group allocation were not clear (Agarwal 2012; Elliott 1998; Ghanaie 2013; Gittens 1996; Hage 1993; Lyons 2001; Newman 1997; Rayburn 1999; Sawai 1991).
Blinding
Most (26) of the included studies were placebo controlled, and women and clinical staff were described as blind to group allocation. However, it was not always clear when the randomisation code was broken, so it was difficult to assess whether outcome assessment was carried out by blinded investigators. Eighteen studies were judged to be at low risk of bias by adequately blinding the women and staff (Bollapragada 2006a; Bullarbo 2007; Buttino 1990; Elliott 1998; Frydman 1992; Gaffaney 2009; Giacalone 1998; Habib 2008; Incerpi 2001; Lelaidier 1994; Lien 1998; Lyons 2001; O'Brien 1995; Sawai 1991; Sawai 1994; Schmitz 2014; Stenlund 1999; Stitely 2000). In two of the placebo controlled trials, blinding may not have been convincing; in the Kipikasa 2005 trial women in both groups were given tablet fragments (either an eighth or a quarter of whole tablets) so the tablets may have not appeared identical (at least to staff). In the Larmon 2002 study women may have been blind to intravaginal preparations, but staff are unlikely to have been.
In eight trials women in both arms of the studies were given different interventions; therefore blinding of women and staff was not feasible, or not attempted (Gittens 1996; Harper 2006; Magann 1998; Meyer 2005; Newman 1997; Oboro 2005; Rayburn 1999; Rijnders 2011). The lack of blinding in these studies may have affected some of the outcomes examined in the review.
Outcome assessors were not blinded in three studies (Meyer 2005; Oboro 2005; Rijnders 2011). Six studies reportedly blinded outcome assessors until analysis was completed (Giacalone 1998; Kipikasa 2005; Lien 1998; Schmitz 2014; Stenlund 1999; Stitely 2000). The blinding of outcome assessors was unclear in the remaining studies.
Incomplete outcome data
Loss of women to follow up and missing data were not serious problems in most of the included studies. In 10 studies the levels of attrition were not clear (Elliott 1998; Frydman 1992; Ghanaie 2013; Gittens 1996; Hage 1993; Harper 2006; Incerpi 2001; Kipikasa 2005; Lyons 2001; Newman 1997).
Five trials were assessed as high risk of attrition bias. In the study by Sawai 1994, attrition was approximately 12% and some of the exclusions were for non‐compliance. Attrition was also high in the study by Bollapragada 2006a; in this trial randomisation occurred up to nine days before the initiation of treatment, hence 80 of the 350 women did not start treatment as they had already gone into labour. To reduce risk of bias, the authors reported an intention‐to‐treat analysis (including all women randomised) for the trial's primary outcomes but not for secondary outcomes. In Gaffaney 2009, nine women were excluded post‐randomisation and not included for analysis. In Schmitz 2014, 10 women (5 in each group) were excluded post‐randomisation, and the maternal satisfaction outcome had 23% attrition. Rijnders 2011 and used a satisfaction survey, however, responses were not balanced (221 at home and 183 in hospital). In Kipikasa 2005, there were inconsistencies in figures between the text and the tables, hence rated unclear risk of attrition bias.
Selective reporting
Reporting bias was difficult to assess, as many studies did not pre‐specify all the outcomes that were reported (Frydman 1992; Ghanaie 2013; Gittens 1996; Hage 1993; Incerpi 2001; Kipikasa 2005; Larmon 2002; Lelaidier 1994; Lien 1998; Lyons 2001; Magann 1998; McKenna 1999; McKenna 2004; Newman 1997; O'Brien 1995; Oboro 2005; Rayburn 1999; Stenlund 1999; Stitely 2000). Schmitz 2014 pre‐specified maternal and newborn intensive care unit admission outcomes, but these were not reported.
Other potential sources of bias
In many included studies women were likely to receive other interventions at some stage in their treatment as well as the study allocated intervention (e.g. amniotomy, membrane sweeping, additional medication) and these in turn may have affected other outcomes (e.g. length of labour and rate of caesarean section). Without adequate blinding, it is possible that women in intervention and control groups may have had different co‐interventions, or co‐interventions at different stages. For example, in the study by Harper 2006, women in the intervention group attended for treatment on three occasions, and at these visits (not available to women in the control group) may have been exposed to a range of co‐interventions, or additional tests or observations, that may have had an impact on outcomes.
Other sources of bias included baseline imbalance in parity between groups (Oboro 2005) and imbalance in numbers of randomised women between the treatment and control groups (Elliott 1998).
Effects of interventions
See: Summary of findings for the main comparison Vaginal PGE₂ compared to placebo or expectant management for the induction of labour in outpatient settings; Summary of findings 2 Intracervical PGE₂ compared to placebo for the induction of labour in outpatient settings; Summary of findings 3 Vaginal misoprostol compared to placebo for the induction of labour in outpatient settings
1. Vaginal prostaglandin (PGE₂) versus placebo or expectant management: five studies, 335 women
Main outcomes
We included five studies in this comparison (Hage 1993; Newman 1997; O'Brien 1995; Sawai 1991; Sawai 1994). None of the studies collected information on most of the review's main outcomes. We do not have information on the numbers of women achieving vaginal birth within 24 hours, on length of hospital stay, on the use of emergency services or on maternal or caregiver satisfaction. Maternal and perinatal deaths were not reported.
Additional induction agents required
O'Brien 1995 and Sawai 1991 reported the numbers of women requiring further (non‐study) induction agents with fewer women in the PGE₂ group needing further medication to induce labour. While 14.8% of the PGE₂ group needed further induction agents this applied to 28.9% of the control group. However, as only two relatively small studies contributed data for this outcome, confidence intervals were wide and very close to the line of no effect (risk ratio (RR) 0.52, 95% confidence interval (CI) 0.27 to 0.99; 150 women; 2 trials; Analysis 1.1).
Additional outcomes of interest
Measures of effectiveness
None of the trials reported vaginal birth not achieved within 48 and 72 hours, randomisation to birth interval, or oxytocin augmentation.
Pain relief requirements (epidural, opioids)
O'Brien 1995 examined the use of epidural; again, there was no strong evidence of any difference between groups (RR 0.83, 95% CI 0.62 to 1.12; 100 women; 1 study; Analysis 1.2).
Complications
There was no clear evidence of differences between women who received vaginal PGE₂ and placebo or expectant management for the following outcomes:
-
Uterine hyperstimulation (with or without FHR changes ‐ unclear) (RR 3.76, 95% CI 0.64 to 22.24; 244 women; 4 studies; Analysis 1.3; low‐quality evidence).
-
Caesarean section (RR 0.80, 95% CI 0.49 to 1.31; 288 women; 4 studies; Analysis 1.4; low‐quality evidence).
-
Apgar score less than seven at five minutes (RR 0.45, 95% CI 0.07 to 2.93; 180 infants; 2 studies; Analysis 1.5).
-
Neonatal intensive care unit (NICU) admission (RR 0.32, 95% CI 0.10 to 1.03; 230 infants; 3 studies; Analysis 1.6; low‐quality evidence).
Serious maternal complications (considered as separate outcomes, e.g. intensive care unit admission, septicaemia, uterine rupture)
There was only limited information on the impact of interventions on the health of mothers and babies. O'Brien 1995 and Sawai 1994 reported rates of chorioamnionitis and results favoured women in the PGE₂ group (RR 0.37, 95% CI 0.15 to 0.90; 180 women; 2 studies; Analysis 1.7). There was no information on the use of antibiotics or on rates of endometritis.
Instrumental vaginal birth, perinatal death, postpartum haemorrhage (as defined by the trial authors), and serious neonatal complications (considered as separate outcomes) were not reported by any study.
Non‐prespecified outcomes
While none of these five studies reported the numbers of women achieving vaginal birth within a certain specified period, other 'proxy' measures of progress towards labour or birth were included. Each study reported different outcomes.
Hage 1993 reported on the rate of change in Bishop scores and, compared with women receiving PGE₂, those in the control group were more likely to have score changes of less than three at follow‐up (RR 0.13, 95% CI 0.03 to 0.47; 36 women; 1 study; Analysis 1.8) although it was not clear when follow‐up occurred.
Newman 1997 reported figures for the number of women going into "spontaneous labour" within 48 hours of treatment commencing; it was more likely for labour to start in the PGE₂ group compared with women receiving routine care (RR 6.43, 95% CI 2.12 to 19.48; 58 women; 1 study; Analysis 1.9).
O'Brien 1995 reported that the median interval from study enrolment to birth was four days in the PGE₂ group (range 0 to 28 days) versus 10 days (range 0 to 26 days) in the control group (P = 0.002). The shorter interval between randomisation and birth was reflected in a lower gestational age (weeks) at birth in the intervention group (mean difference (MD) ‐0.60 weeks, 95% CI ‐0.99 to ‐0.21; 100 women; 1 study; Analysis 1.11). It was also reported that, during the five‐day treatment period, compared with controls, more women in the intervention group were admitted to hospital "for labour" (RR 2.70, 95% CI 1.47 to 4.97; 100 women; 1 study; Analysis 1.10), although it was not clear whether this included women in active labour only, or women admitted after premature rupture of membranes (PROM) or for other reasons. The numbers of women diagnosed with post‐term pregnancy was small in both groups (2 women in the intervention group and 3 in the control group).
Sawai 1991 described Bishop scores in control and intervention groups at hospital admission, but there were differences between groups at baseline and the authors report no significant differences between groups at follow‐up (data not shown). Sawai 1994 reported the mean gestational age (in days) at hospital admission (although the indications for admission included pregnancy complications as well as signs of the onset of labour). There was not a clear difference between groups (MD ‐2.00 days, 95% CI ‐4.17 to 0.17; 80 women; 1 study; Analysis 1.12).
2. Intracervical prostaglandin (PGE₂) versus expectant management or placebo: seven studies, 678 women
Main outcomes
We included seven studies in this comparison (Buttino 1990; Gittens 1996; Larmon 2002; Lien 1998; Magann 1998; McKenna 1999; Rayburn 1999).
Additional induction agents required
Three studies (Lien 1998; McKenna 1999; Rayburn 1999) looked at whether, compared with no treatment or placebo, women receiving intracervical PGE₂ were less likely to need further (non‐study) interventions to induce labour. There was no strong evidence of a difference between groups (RR 0.98, 95% CI 0.74 to 1.32; 445 women; 3 studies; Analysis 2.1). Lien 1998 also examined whether women given intracervical PGE₂ were less likely to receive further doses of prostaglandin to induce labour. Again, there was no evidence to suggest a difference between groups (RR 0.61, 95% CI 0.22 to 1.67; 90 women; 1 study; Analysis 2.2).
Serious maternal morbidity or death (composite outcome will include, for example, uterine rupture, admission to intensive care unit, septicaemia)
Rayburn 1999 reported rates of uterine rupture, and there were no events in either the PGE₂ group or control group participants (Analysis 2.3).
There was no information on vaginal birth not achieved within 24 hours, length of hospital stay, use of emergency services, maternal or caregiver satisfaction, or serious neonatal morbidity or perinatal death.
Additional outcomes of interest
Measures of effectiveness
Vaginal birth not achieved within 48 and 72 hours
Buttino 1990 reported on the number of women not giving birth within 48 to 72 hours, and although results favoured the PGE₂ group, did not show a clear difference as the confidence intervals just crossed the line of no effect (RR 0.83, 95% CI 0.68 to 1.02; 43 women; 1 study; Analysis 2.4; low‐quality evidence).
Oxytocin augmentation
There was no strong evidence of differences between groups for the number of women who received oxytocin augmentation (RR 0.67, 95% CI 0.40 to 1.12; 84 women; 1 study; Analysis 2.5).
Randomisation to birth interval, and pain relief requirements were not reported under this comparison.
Complications
The impact of interventions on maternal health were explored in five studies (Buttino 1990; Larmon 2002; Lien 1998; McKenna 1999; Rayburn 1999).
There was no clear evidence of differences between women who received intracervical PGE₂ and placebo or expectant management for the following outcomes:
-
Uterine hyperstimulation (with FHR changes) (RR 2.66, 95% CI 0.63 to 11.25; 488 women; 4 studies; Analysis 2.6; low‐quality evidence).
-
Assisted (instrumental) vaginal birth (RR 1.29, 95% CI 0.85 to 1.96; 538 women; 4 studies; Analysis 2.7).
-
Caesarean section (RR 0.90, 95% CI 0.72 to 1.12; 674 women; 7 studies; Analysis 2.8; moderate‐quality evidence).
-
Apgar score less than seven at five minutes (RR 0.82, 95% CI 0.42 to 1.60; 515 infants; 4 studies; Analysis 2.9).
-
NICU admission (RR 1.61, 95% CI 0.43 to 6.05; 215 infants; 3 studies; Analysis 2.10; low‐quality evidence).
-
Postpartum haemorrhage (RR 3.10, 95% CI 0.13 to 73.16; 61 women; 1 study; Analysis 2.11).
-
Serious maternal complications (considered as separate outcomes, e.g. intensive care unit admission, septicaemia, uterine rupture)
-
Chorioamnionitis (RR 2.03, 95% CI 0.66 to 6.18; 468 women; 3 studies; Analysis 2.12).
-
Endometritis (RR 1.60, 95% CI 0.27 to 9.37; 174 women; 2 studies; Analysis 2.13).
-
Maternal side effects (RR 0.59, 95% CI 0.13 to 2.77; 384 women; 2 studies; Analysis 2.14).
-
The included studies did not provide information on other review outcomes including uterine hyperstimulation (without FHR changes), perinatal death, other serious maternal complications such as admission to intensive care, and other serious neonatal complications such as the use of antibiotics, and neonatal infection.
Non‐prespecified outcomes
All seven studies collected information on progress towards labour and birth; again reported outcomes were different in each study (Buttino 1990; Gittens 1996; Larmon 2002; Lien 1998; Magann 1998; McKenna 1999; Rayburn 1999).
Buttino 1990 and Lien 1998 reported no differences between women in the PGE₂ and control groups in the time interval (days) between the first dose of drug or placebo and birth (SMD ‐0.20 days, 95% CI ‐0.55 to 0.14; 133 women; 2 studies; Analysis 2.15).
Larmon 2002 found no differences between groups for the median number of days from recruitment to hospital admission (16.8 days for the PGE₂ group versus 15.4 days for the control group (data not shown)). For other outcomes reported in this study (Bishop score on admission, and estimated gestational age on admission) there were no clear differences between groups. However, some women were admitted for induction rather than in labour and it was not clear if these mean figures included all women.
Lien 1998 and Magann 1998 reported the estimated gestational age at birth (in weeks) and found no difference between groups for this outcome (MD ‐0.06 weeks, 95% CI ‐0.35 to 0.23; 156 women; 2 studies; I² = 85%; Tau² = 0.04; Chi² = 6.79; Analysis 2.16) (there was high heterogeneity for this outcome and results should be interpreted with caution). Lien 1998 and Magann 1998 provided information on the number of women requiring induction for 'postdates' pregnancy (women reaching 42 weeks' gestation). In view of high heterogeneity and different clinical management in the two studies, we did not pool results for this outcome but have set out the data in Analysis 2.17. While in the Magann 1998 study more women in the control group required induction (22 of 35 women) compared to the PGE₂ group (7 of 35 women) the results were difficult to interpret as some women had been admitted to hospital for induction at an earlier stage because of changes in Bishop score or for other reasons.
McKenna 1999 reported the median time from recruitment to admission to hospital; the interval was shorter in the PGE₂ group compared with control group participants (2.5 days versus 7 days, P = 0.02). However, reasons for admission included change in Bishop score, as well as for onset of labour. McKenna 1999 also reported the number of women delivering within two days of commencing treatment; more women gave birth within two days if they had the active treatment (RR 3.10, 95% CI 1.29 to 7.47; 61 women; 1 study; Analysis 2.18).
Rayburn 1999 reported the numbers of women delivering at various gestational ages (all deliveries). There were no clear differences between groups at any of the time points measured (data not shown).
3. Vaginal misoprostol versus placebo: four studies, 274 women
Four studies compared vaginal misoprostol with placebo (Incerpi 2001; McKenna 2004; Oboro 2005; Stitely 2000). In all four studies the initial dose of misoprostol was 25 µg; in the study by Incerpi 2001 women received a second dose after three to four days if labour had not commenced, and in the study by Stitely 2000 a second dose was administered after one day.
Main outcomes
Serious neonatal morbidity or perinatal death (composite outcome will include, for example, seizures, birth asphyxia defined by trialists, neonatal encephalopathy, disability in childhood)
For this comparison, only Oboro 2005 reported on the rate of perinatal death with no clear differences between groups; there were no deaths in the active treatment group (N = 38) compared with one stillbirth (reason not reported) in the control group (N = 39) (RR 0.34, 95% CI 0.01 to 8.14; 77 infants; 1 study; Analysis 3.1; low‐quality evidence).
There was no information on other review outcomes such as failure to achieve vaginal birth within 24 hours, additional induction agents required, length of hospital stay, use of emergency services, maternal or caregiver satisfaction, and serious maternal morbidity or death.
Additional outcomes of interest
Measures of effectiveness
Oxytocin augmentation
No study reported rates of oxytocin augmentation between groups; however, mean dose of oxytocin used was reported in Incerpi 2001, and is described in Non‐prespecified outcomes.
Pain relief requirements (epidural, opioids)
McKenna 2004 reported similar numbers of women in each group had epidural anaesthesia (RR 0.98, 95% CI 0.77 to 1.26; 50 women; 1 study; Analysis 3.2). Opioid use was not reported.
Vaginal birth not achieved within 48 and 72 hours, and randomisation to birth interval were not reported in any study.
Complications
There was little information from these studies on the impact of interventions on mothers' and babies' health.
There was no clear evidence of differences between women who received vaginal misoprostol and placebo for the following outcomes:
-
Uterine hyperstimulation (with fetal heart rate (FHR) changes) (RR 1.97, 95% CI 0.43 to 9.00; 265 women; 3 studies; Analysis 3.3; low‐quality evidence).
-
Uterine hyperstimulation (without FHR changes) (RR 3.64, 95% CI 0.15 to 85.97; 137 women; 2 studies; Analysis 3.4).
-
Instrumental vaginal birth (RR 0.91, 95% CI 0.50 to 1.67; 145 women; 2 studies; Analysis 3.5).
-
Caesarean section (RR 0.94, 95% CI 0.61 to 1.46; 325 women; 4 studies; Analysis 3.6; low‐quality evidence).
-
Apgar score less than seven at five minutes (RR 0.21, 95% CI 0.01 to 4.25; 248 infants; 3 studies; Analysis 3.7).
-
NICU admission (RR 0.89, 95% CI 0.54 to 1.47; 325 infants; 4 studies; Analysis 3.8; low‐quality evidence).
-
Serious neonatal complications (considered as separate outcomes).
-
Neonatal infection (RR 0.30, 95% CI 0.07 to 1.36; 68 infants; 1 study; Analysis 3.10).
-
No information was provided in these studies on other review outcomes including postpartum haemorrhage, use of neonatal antibiotics or other maternal or neonatal complications.
Non‐prespecified outcomes
Incerpi 2001 reported the mean dose of oxytocin used for each group; there was no evidence of any difference between the groups (MD 1508.70 mU, 95% CI ‐2357.55 to 5374.95; 72 women; 1 study; Analysis 3.11).
Stitely 2000 gave information about the number doses of medication given to the women (MD ‐0.44, 95% CI ‐0.49 to ‐0.39; 60 women; 1 study; Analysis 3.12) and the number of women requiring subsequent doses on study days two and three; fewer women received further doses in the intravaginal misoprostol group (P < 0.01 for both time points: day two RR 0.61, 95% CI 0.43 to 0.87; 60 women; 1 study; Analysis 3.13, day three RR 0.13, 95% CI 0.04 to 0.38; 60 women; 1 study; Analysis 3.14).
Oboro 2005 reported that the interval from the commencement of treatment to hospital admission (in days) was shorter for the misoprostol group both for nulliparous and parous women (MD ‐2.90 days, 95% CI ‐4.99 to ‐0.81; 77 women; 1 study; Analysis 3.15). Data are shown separately for nulliparous and parous women in Analysis 3.16. There was also evidence from this trial that the gestational age at labour (in weeks) was reduced in the misoprostol group compared with women in the control group, with labour approximately a week earlier in the misoprostol group (MD ‐0.80 weeks, 95% CI ‐1.05 to ‐0.55; 77 women; 1 study; Analysis 3.17). There was also evidence that the time to preterm rupture of membranes (in days) was shorter in the misoprostol group (MD ‐2.50 days, 95% CI ‐4.14 to ‐0.86; 77 women; 1 study; Analysis 3.19), although it was not clear whether this was the interval from commencement of treatment or from hospital admission.
McKenna 2004 provided data on the interval from treatment to vaginal birth (in days); the difference between groups was not clear (MD ‐1.40 days, 95% CI ‐3.51 to 0.71; 50 women; 1 study; Analysis 3.20). McKenna 2004 also reported the mean interval from recruitment to birth (in days), which was less for the misoprostol group compared with women receiving placebo (Analysis 3.21); information was provided separately for nulliparous and multiparous women (Analysis 3.22). It was not clear whether the figures included those women who had caesarean sections or other interventions in labour.
4. Vaginal misoprostol 25 µg versus 50 µg: one study with 52 women
Kipikasa 2005 looked at two different doses of vaginal misoprostol.
Main outcomes
Additional induction agents required
There were no differences between groups in the number of women requiring further induction agents (oxytocin) (RR 2.26, 95% CI 0.22 to 23.33; 49 women; 1 study; Analysis 4.1).
There was no information on any other of the review's main outcomes: vaginal birth not achieved within 24 hours, length of hospital stay, use of emergency services, maternal or caregiver satisfaction, serious neonatal morbidity or perinatal death (composite outcome will include, for example, seizures, birth asphyxia defined by trialists, neonatal encephalopathy, disability in childhood), and serious maternal morbidity or death (composite outcome will include, for example, uterine rupture, admission to intensive care unit, septicaemia).
Additional outcomes
Measures of effectiveness
No outcomes of measures of effectiveness were reported: vaginal birth not achieved within 48 and 72 hours, randomisation to birth interval, oxytocin augmentation, pain relief requirements (epidural, opioids).
Complications
There was little difference between groups for the following outcomes:
-
uterine hyperstimulation ‐ there were no cases of hyperstimulation in either group (Analysis 4.2);
-
rates of caesarean section (RR 0.94, 95% CI 0.33 to 2.68; 49 women; 1 study; Analysis 4.3); and
-
NICU admission (RR 0.57, 95% CI 0.05 to 5.83; 49 infants; 1 study; Analysis 4.4).
Apgar score
One baby in the higher dose group had a low Apgar score (< 6) at five minutes (data not shown).
There was no information on instrumental vaginal birth, perinatal death, postpartum haemorrhage (as defined by the trial authors), serious maternal complications (considered as separate outcomes, e.g. intensive care unit admission, septicaemia, uterine rupture), or serious neonatal complications (considered as separate outcomes).
Non‐prespecified outcomes
The interval to birth (in days) was reported to be shorter in the group receiving the higher dose of misoprostol; with women receiving 50 µg delivering, on average, one and a half days earlier than those receiving 25 µg (MD 1.50 days, 95% CI 1.19 to 1.81; 49 women; 1 study; Analysis 4.5).
5. Intracervical PGE₂ versus vaginal misoprostol: one study, 84 women
Main outcomes
One study is included in this comparison between intracervical PGE₂ and vaginal misoprostol (Meyer 2005). None of the review's primary outcomes were considered in this study.
Additional outcomes
Measures of effectiveness
No outcomes of measures of effectiveness were reported.
Complications
There was no strong evidence of differences between intervention and control groups for the following outcomes:
-
uterine hyperstimulation (with or without FHR changes) (RR 0.26, 95% CI 0.03 to 2.73; 64 women; 1 study; Analysis 5.1);
-
caesarean section (RR 0.89, 95% CI 0.38 to 2.08; 84 women; 1 study; Analysis 5.2)
-
Apgar scores less than seven at five minutes (RR 0.33, 95% CI 0.01 to 7.96; 84 infants; 1 study; Analysis 5.3); and
-
NICU admission (RR 1.25, 95% CI 0.36 to 4.33; 84 women; 1 study; Analysis 5.4).
There was no information on instrumental vaginal birth, perinatal death, postpartum haemorrhage (as defined by the trial authors), serious maternal complications (considered as separate outcomes, e.g. intensive care unit admission, septicaemia, uterine rupture), or serious neonatal complications (considered as separate outcomes).
Non‐prespecified outcomes
It was reported that the proportion of women not requiring oxytocin was 22% in the misoprostol group versus 2% in for those in the PGE₂ group (P = 0.006). The dose of oxytocin used was also reported to be decreased in those women receiving misoprostol (P = 0.008 for cumulative dose of oxytocin) (data not shown) (Meyer 2005).
The interval from the administration of the cervical ripening agent to admission (hours) was shorter for women who received misoprostol (MD 2.50 hours, 95% CI 2.22 to 2.78; 75 women; 1 study; Analysis 5.5), and misoprostol was also reported to increase by 32% the number of women starting labour or with SROM during the ripening period (RR 0.31, 95% CI 0.14 to 0.69; 83 women; 1 study; Analysis 5.6).
Misoprostol was reported to increase the number of deliveries within 24 and 48 hours (RR 0.90, 95% CI 0.75 to 1.07; Analysis 5.7; and RR 0.93, 95% CI 0.81 to 1.06; Analysis 5.8 (respectively); 83 women; 1 study), but the differences between groups were not clear.
6. Oral misoprostol versus placebo: two studies, 127 women
Main outcomes
Two studies were included in this comparison (Gaffaney 2009; Lyons 2001). Gaffaney 2009 was assessed as being at high risk of attrition bias so should have been removed according to the pre‐specified sensitivity analysis. However, there were insufficient studies in this comparison for meaningful sensitivity analysis.
Vaginal birth not achieved within 24 hours
Women in the oral misoprostol group had a higher rate of vaginal birth achieved within 24 hours (RR 0.65, 95% CI 0.48 to 0.86; 87 women; 1 study; Analysis 6.1).
Additional induction agents required
Women in the oral misoprostol group had lower rates of additional induction agents compared to the placebo group (RR 0.60, 95% CI 0.37 to 0.97; 127 women; 2 studies; Analysis 6.2).
There was no information for length of hospital stay, use of emergency services, maternal or caregiver satisfaction, serious neonatal morbidity or perinatal death, or serious maternal morbidity or death.
Additional outcomes
Measures of effectiveness
Oxytocin augmentation
There was no evidence of a difference between groups for women who received oxytocin augmentation (RR 0.81, 95% CI 0.61 to 1.08; 87 women; 1 study; Analysis 6.3).
Vaginal birth not achieved within 48 and 72 hours, randomisation to birth interval, and pain relief requirements (epidural, opioids) were not reported.
Complications
There was no evidence of differences between the misoprostol and placebo groups for the following outcomes:
-
uterine hyperstimulation with FHR changes (RR 1.53, 95% CI 0.47 to 5.06; 87 women; 1 studies; Analysis 6.4), or where it was unclear if there were FHR changes (RR 0.61, 95% CI 0.06 to 6.21; 40 women; 1 study; Analysis 6.5);
-
rate of instrumental vaginal birth (RR 0.51, 95% CI 0.17 to 1.57; 87 women; 1 study; Analysis 6.6);
-
rate of caesarean section (RR 0.62, 95% CI 0.28 to 1.33; 86 women; 1 study; Analysis 6.7);
-
Apgar scores of less than seven at five minutes (there were none in either group) (Analysis 6.8);
-
NICU admission (RR 1.02, 95% CI 0.07 to 15.84; 87 infants; 1 study; Analysis 6.9);
-
postpartum haemorrhage (RR 5.11, 95% CI 0.25 to 103.51; 87 women; 1 study; Analysis 6.10);
-
serious maternal complications:
-
chorioamnionitis (RR 1.06, 95% CI 0.52 to 2.17; 124 women; 2 studies; Analysis 6.11); and
-
endometritis (RR 0.51, 95% CI 0.05 to 5.44; 87 women; 1 study; Analysis 6.12).
-
Perinatal death, other serious maternal complication, and serious neonatal complications are not reported.
Non‐pre‐specified outcomes
Oral misoprostol may be associated with a reduction in the times (hours) from first dose to active labour and first dose to birth (MD ‐37.08, 95% CI ‐52.44 to ‐21.72; 127 women; 2 studies; Analysis 6.13, and MD ‐37.94, 95% CI ‐57.97 to ‐17.91; 87 women; 1 study; Analysis 6.14), which is reflected in the larger total doses of medication in the placebo group (MD ‐0.51, 95% CI ‐0.92 to ‐0.10; 40 women; 1 study; Analysis 6.15).
7. Mifepristone versus placebo: five studies, 393 women
We included five studies in this comparison (Elliott 1998; Frydman 1992; Giacalone 1998; Lelaidier 1994; Stenlund 1999).
Main outcomes
Additional induction agents required
Women in the mifepristone group were less likely to require further medication to induce labour compared with those in the control group (average RR 0.59, 95% CI 0.37 to 0.95; 311 women; 4 studies; I² = 74%; Analysis 7.1). However, there was considerable heterogeneity for this outcome (I² = 74%, Tau² = 0.16, Chi² test for heterogeneity P = 0.009). The wide 95% prediction interval (0.08 to 4.39) indicated that this result should be interpreted cautiously as some further study might yield a negative result.
Serious neonatal morbidity or perinatal death (composite outcome will include, for example, seizures, birth asphyxia defined by trialists, neonatal encephalopathy, disability in childhood)
Stenlund 1999 examined serious neonatal morbidity (the number of babies requiring antIconvulsive therapy); there was little difference between groups (RR 1.56, 95% CI 0.07 to 35.67; 36 infants; 1 study; Analysis 7.2). Lelaidier 1994 reported on perinatal mortality and there were no deaths in either group (Analysis 7.9).
There was no information on vaginal birth not achieved within 24 hours, length of hospital stay, use of emergency services, maternal or caregiver satisfaction, or serious maternal morbidity or death.
Additional outcomes of interest
Measures of effectiveness
Oxytocin augmentation
There was no evidence that mifepristone had an impact on the number of women who required oxytocin augmentation (RR 0.89, 95% CI 0.63 to 1.26; 116 women; 2 studies; Analysis 7.3).
Pain relief requirements (epidural, opioids)
A similar number of women in each group used epidural anaesthesia (RR 0.87, 95% CI 0.73 to 1.03; 112 women; 1 study; Analysis 7.4).
Vaginal birth not achieved within 48 and 72 hours, and randomisation to birth interval were not reported.
Complications
There was only limited evidence on the impact of mifepristone on maternal and neonatal health.
There were no clear differences between the groups for the following outcomes:
-
instrumental vaginal birth (RR 1.35, 95% CI 0.93 to 1.97; 343 women; 5 studies; Analysis 7.5);
-
caesarean section (RR 0.88, 95% CI 0.62 to 1.25; 343 women; 5 studies; Analysis 7.6);
-
Apgar score < 7 at five minutes (RR 1.56, 95% CI 0.07 to 35.67; 119 infants; 2 studies; Analysis 7.7);
-
NICU admission (RR 0.93, 95% CI 0.31 to 2.79; 163 infants; 2 studies; Analysis 7.8)
-
Serious maternal complications:
-
uterine scar separation (one women in each group) (RR 1.00, 95% CI 0.07 to 14.64; 32 women; 1 study; Analysis 7.10); and
-
chorioamnionitis (RR 2.00, 95% CI 0.20 to 19.91; 32 women; 1 study; Analysis 7.11).
-
Uterine hyperstimulation (with and without fetal heart rate (FHR) changes), postpartum haemorrhage (as defined by the trial authors), other serious maternal complications, and serious neonatal complications were not reported.
Non‐prespecified outcomes
Stenlund 1999 reported that during the first 48 hours after treatment started, 83.3% of women with mifepristone and 41.7% with placebo went into labour or had a ripe cervix (RR 2.00, 95% CI 1.00 to 4.00; 36 women; 1 study; Analysis 7.12). The median time to onset of labour from commencing treatment was 24 hours 10 minutes for women who had mifepristone and 52 hours for women with placebo. Giacalone 1998 and Stenlund 1999 looked at failure to achieve changes in the cervix after 24 to 48 hours and here results favoured the mifepristone group (RR 0.36, 95% CI 0.20 to 0.63; 119 women; 2 studies; Analysis 7.13).
None of the studies reported on the number of women achieving vaginal birth within 24 hours, but Elliott 1998 described the number of women in spontaneous labour within 72 hours. There was no evidence of a difference between groups receiving mifepristone versus placebo (RR 1.46, 95% CI 0.68 to 3.10; 80 women; 1 study; Analysis 7.14). The time to onset of labour was similar in all three study groups, with a median of 81 hours 15 minutes for placebo, 80 hours 20 minutes for 50 mg mifepristone, and 75 hours 50 minutes for 200 mg mifepristone.
Giacalone 1998 reported on "spontaneous labour" within 48 hours and results favoured the mifepristone group (RR 2.05, 95% CI 1.27 to 3.30; 83 women; 1 study; Analysis 7.15). There was a shorter interval between the beginning of treatment and onset of labour, and between treatment and vaginal birth for the mifepristone group (the median interval to labour onset was 31.7 hours for mifepristone group versus 53.9 hours for placebo, and 31.3 hours versus 58.5 hours between treatment and birth; with a reported P = 0.02 for both outcomes). Lelaidier 1994 reported a reduction in oxytocin dose (international units, IU) (MD ‐2.56 IU, 95% CI ‐4.01 to ‐1.11; 32 women; 1 study; Analysis 7.16) and also reported that the interval between the start of treatment and the onset of labour (hours) was shorter in the mifepristone group (MD ‐22.15, 95% CI ‐35.96 to ‐8.34; 32 women; 1 study; Analysis 7.17). In the Frydman 1992 study, mifepristone reduced the total dose (described in French as "international measurement" units, IM) of oxytocin for women having both vaginal (MD ‐2.07 IM, 95% CI ‐3.21 to ‐0.93; 76 women) and caesarean deliveries (MD ‐1.97 IM, 95% CI ‐3.37 to ‐0.57; 36 women); however, this should be interpreted with caution (data not shown).
8. Oestrogen versus placebo: one study, analysis for 87 women
Main outcomes
We included one study (Larmon 2002) in this comparison and there was no information reported on any of the review's main outcomes.
Additional outcomes of interest
Measures of effectiveness
Oxytocin augmentation
Similar numbers of women in each group received oxytocin augmentation (RR 0.93, 95% CI 0.61 to 1.43; 87 women; 1 study; Analysis 8.1)
There was no information on vaginal birth not achieved within 48 and 72 hours, randomisation to birth interval, and pain relief requirements (epidural, opioids).
Complications
There was no clear differences between the oestrogen and placebo groups for:
-
instrumental vaginal birth (RR 0.84, 95% CI 0.44 to 1.60; 87 women; 1 study; Analysis 8.2);
-
caesarean section (RR 1.27, 95% CI 0.63 to 2.58; 87 women; 1 study; Analysis 8.3);
-
NICU admission (RR 0.98, 95% CI 0.06 to 15.13; 87 infants; 1 study; Analysis 8.4)
-
serious maternal complications:
-
chorioamnionitis (RR 1.95, 95% CI 0.38 to 10.12; 87 women; 1 study; Analysis 8.5); and
-
endometritis (RR 2.93, 95% CI 0.32 to 27.10; 87 women; 1 study; Analysis 8.6).
-
There was no information for uterine hyperstimulation (with or without FHR changes), Apgar score less than seven at five minutes, perinatal death, postpartum haemorrhage, other serious maternal complications, or serious neonatal complications.
9. Vaginal isosorbide mononitrate (IMN) versus placebo: seven studies, 2287 women
We included four trials in this comparison group (Bollapragada 2006a; Bullarbo 2007; Habib 2008; Schmitz 2014). Schmitz 2014 was a large multicenter trial of 1362 women in France which provided additional data for a range of outcomes for this update.
Main outcomes
There was no clear differences between the vaginal isosorbide mononitrate and placebo groups for:
-
vaginal birth not achieved within 24 hours (RR 0.97, 95% CI 0.83 to 1.15; 238 women; 1 study; Analysis 9.1);
-
additional induction agents required (average RR 0.87, 95% CI 0.75 to 1.00; 4 studies; I² = 66%; Tau² = 0.01; Chi² = 8.92; Analysis 9.2);
-
serious neonatal morbidity or perinatal death:
-
perinatal death (average RR 1.61, 95% CI 0.08 to 33.26; 1712 infants; 2 studies; I² = 48%; Tau² = 2.31; Chi² = 1.94; Analysis 9.5);
-
neonatal trauma (long bone fracture, collarbone fracture, basal skull fracture, brachial plexus palsy, facial nerve palsy, phrenic nerve palsy, or subdural haemorrhage) (RR 0.67, 95% CI 0.19 to 2.37; 1362 infants; 1 study; Analysis 9.6);
-
neonatal convulsions in first 24 hours (there were no incidences of this outcome in either group; Analysis 9.7);
-
tracheal ventilation longer than 24 hours (RR 1.01, 95% CI 0.14 to 7.14; 1362 infants; 1 study; Analysis 9.8);
-
NICU admission for five or more days (RR 0.67, 95% CI 0.19 to 2.37; 1362 infants; 1 study; Analysis 9.9);
-
neonatal transfer (RR 1.07, 95% CI 0.67 to 1.70; 1362 infants; 1 study; Analysis 9.10);
-
-
serious maternal morbidity or death:
-
maternal death (there were no incidences of maternal death in either group; Analysis 9.11);
-
severe postpartum haemorrhage (RR 1.55, 95% CI 0.78 to 3.09; 1362 women; 1 study; Analysis 9.12);
-
deep vein thrombosis (RR 3.03, 95% CI 0.12 to 74.16; 1362 women; 1 study; Analysis 9.13);
-
perinatal death (average RR 1.61, 95% CI 0.08 to 33.26; 1712 infants; 2 studies; I² = 48%; Tau² = 2.31; Chi² = 1.94; Analysis 9.5);
-
neonatal trauma (long bone fracture, collarbone fracture, basal skull fracture, brachial plexus palsy, facial nerve palsy, phrenic nerve palsy, or subdural haemorrhage) (RR 0.67, 95% CI 0.19 to 2.37; 1362 infants; 1 study; Analysis 9.6);
-
neonatal convulsions in first 24 hours (there were no incidences of this outcome in either group; Analysis 9.7);
-
tracheal ventilation longer than 24 hours (RR 1.01, 95% CI 0.14 to 7.14; 1362 infants; 1 study; Analysis 9.8);
-
NICU admission for five or more days (RR 0.67, 95% CI 0.19 to 2.37; 1362 infants; 1 study; Analysis 9.9);
-
neonatal transfer (RR 1.07, 95% CI 0.67 to 1.70; 1362 infants; 1 study; Analysis 9.10);
-
Maternal satisfaction
In four trials, women were asked to rate their satisfaction, however results could not be meta‐analysed due to differences in how questions were structured. Bullarbo 2007 found no difference in levels of satisfaction between women in the two arms of the trial (Analysis 9.4). Schmitz 2014 asked women to rate their satisfaction, and whether they would recommend the same treatment, finding that more women in the IMN group felt very or extremely satisfied, and would recommend the same treatment (Analysis 9.4). In the study by Bollapragada 2006a, women were asked to rate their satisfaction with the induction process at home. On five of the six measures of satisfaction, women in the placebo group were slightly more satisfied with their care compared with those in the IMN group, although the differences between groups were not large, and the mean scores in both groups suggested general satisfaction (Analysis 9.3). Satisfaction data from Attanayake 2014 could not be meta‐analysed, as only narrative results were provided ‐ they reported that greater than 75% of women in both groups considered the therapy as a good intervention (rather than inpatient therapy), and greater than 85% were happy to use outpatient therapy in a subsequent pregnancy, and would recommend to a friend.
Length of hospital stay, use of emergency services, and caregiver satisfaction were not reported.
Additional outcomes of interest
Measures of effectiveness
There were no clear differences between the groups for the outcomes:
-
oxytocin augmentation (average RR 0.95, 95% CI 0.78 to 1.14; 1816 women; 3 studies; I² = 72%; Tau² = 0.02; Chi² = 7.11; Analysis 9.14); and
-
pain relief requirements (epidural) (RR 0.94, 95% CI 0.82 to 1.09; 350 women; 1 study; Analysis 9.15).
No information was available for vaginal birth not achieved within 48 and 72 hours, or randomisation to birth interval.
Complications
There was no evidence of clear difference between groups for:
-
uterine hyperstimulation (with FHR changes) (RR 0.20, 95% CI 0.01 to 4.07; 102 women; 1 study; Analysis 9.16);
-
uterine hyperstimulation (unclear if with or without FHR changes) (RR 0.09, 95% CI 0.01 to 1.62; 200 women; 1 study; Analysis 9.17);
-
Instrumental vaginal birth (RR 0.81, 95% CI 0.61 to 1.07; 1712 women; 2 studies; Analysis 9.18);
-
caesarean section (RR 0.99, 95% CI 0.87 to 1.14; 2286 women; 6 studies; Analysis 9.19);
-
Apgar score less than seven at five minutes (RR 0.88, 95% CI 0.44 to 1.76; 2214 infants; 5 studies; Analysis 9.20);
-
NICU admission (RR 0.89, 95% CI 0.59 to 1.36; 1068 infants; 6 studies; Analysis 9.21);
-
perinatal death (reported in Serious neonatal morbidity or perinatal death);
-
postpartum haemorrhage (> 500 mL) (RR 1.13, 95% CI 0.95 to 1.36; 2214 women; 5 studies; Analysis 9.22); and
-
serious neonatal complications:
-
neonatal infection (RR 1.00, 95% CI 0.26 to 3.89; 200 infants; 1 study; Analysis 9.23).
-
No other serious maternal complications were reported.
Non‐prespecified outcomes
IMN use was associated with increased side effects, including nausea (RR 2.39, 95% CI 1.54 to 3.70; 1926 women; 4 studies; I² = 37%; Tau² = 0.07; Chi² = 4.78; Analysis 9.24), and particularly headaches (RR 5.45, 95% CI 3.38 to 8.81; 2300 women; 7 studies; I² = 76%; Tau² = 0.21; Chi² = 21.09; Analysis 9.25). In one study 22/112 women in the IMN group reported severe headaches compared with only 1/108 in the placebo group (RR 21.21, 95% CI 2.91 to 154.65; 220 women; 1 study; Analysis 9.26).
Several measures of progress in labour were reported, with one to three trials available per outcome. In general, results indicate that IMN increased the likelihood of being admitted in established labour within 24 hours (RR 2.75, 95% CI 1.29 to 5.88; 200 women; 1 study; Analysis 9.27) and caused changes in the Bishop score (Bishop score < 6 or active labour at 36 hours: RR 3.80, 95% CI 1.54 to 9.40; 102 women; 1 study; Analysis 9.28, Bishop score on admission after treatment: MD 2.73, 95% CI 2.17 to 3.29; 200 women; 1 study; Analysis 9.30. Change in Bishop score: MD 2.76, 95% CI 2.48 to 3.03; 272 women; 2 studies; Analysis 9.31). Time in hours from admission to birth (days) was also reduced (MD ‐4.7 hours, 95% CI ‐6.08 to ‐3.31; I² =42%; Tau² =0.63; 374 women; 3 studies; Analysis 9.29).
However, Agarwal 2012 reported that the interval from onset of labour to birth (hours) was not different between IMN and placebo (MD ‐1.24 hours, 95% CI ‐1.82 to ‐0.66; 200 women; 1 study; Analysis 9.32), and Bollapragada 2006a reported that the rate of cervix unchanged after 48 hours was higher in the IMN group compared to placebo (RR 0.83, 95% CI 0.70 to 0.97; 257 women; 1 study; Analysis 9.33).
Bollapragada 2006a also reported the mean interval from hospital admission to birth (hours) for all women (MD ‐0.70 hours, 95% CI ‐6.11 to 4.71; 128 women; 1 study; Analysis 9.34), and for those women having vaginal deliveries, along with the mean change in Bishop scores at 48 hours after baseline; there were no differences between groups for any of these outcomes (data not shown).
Bollapragada 2006a collected information on the cost of providing care; the mean overall cost of the care (GBP) package was very similar for women in both groups (MD 11.98 GBP, 95% CI ‐105.34 to 129.30; Analysis 9.35).
10. Acupuncture versus routine care: one study 56 women
Harper 2006 presented limited information relevant to this review. The intervention did not appear to have any impact on the number of women requiring additional agents to induce labour (RR 0.60, 95% CI 0.31 to 1.17; 56 women; 1 study; Analysis 10.1) or having caesarean section (RR 0.43, 95% CI 0.17 to 1.11; 56 women; 1 study; Analysis 10.2). There were no clear differences between groups for women starting labour spontaneously, cervical dilatation at hospital admission, or the mean time from study enrolment to birth (data not shown). No further main or additional outcomes were reported in this study.
11. Outpatient amniotomy for induction of labour versus routine care: one study, 521 women
Rijnders 2011 was an unblinded trial that randomised 521 women to amniotomy in an outpatient setting (at home) for induction between 292 and 294 days gestation, or routine care (as per local guidelines, this was referral to an obstetrician for foetal assessment on the morning of day 294). Rijnders 2011 was assessed as being at high risk of attrition bias so should have been removed according to the pre‐specified sensitivity analysis. However as this was the only study in this comparison, sensitivity analysis was not performed.
Main outcomes
Maternal satisfaction
While measures of maternal satisfaction were higher in the amniotomy at home group (look back positively on treatment: RR 1.04, 95% CI 0.97 to 1.10; 404 women; 1 study; Analysis 11.1. Would have preferred other treatment: RR 0.51, 95% CI 0.36 to 0.72; 472 women; 1 study; Analysis 11.2), the proportion of women completing the survey was higher in the amniotomy group (82% versus 73%), and it seems likely that a response bias may have occurred for surveys conducted in home settings.
There was no information on vaginal birth not achieved within 24 hours, additional induction agents required, length of hospital stay, use of emergency services, caregiver satisfaction, serious neonatal morbidity or perinatal death (composite outcome will include, for example, seizures, birth asphyxia defined by trialists, neonatal encephalopathy, disability in childhood), or serious maternal morbidity or death (composite outcome will include, for example, uterine rupture, admission to intensive care unit, septicaemia).
Additional outcomes of interest
Measures of effectiveness
Oxytocin augmentation
Fewer women had augmentation or induction or both in the outpatient amniotomy group than in the routine care group (RR 0.83, 95% CI 0.71 to 0.97; 521 women; 1 study; Analysis 11.3).
Pain relief requirements (epidural, opioids)
There was little difference between groups for women receiving epidural or opioids or both (RR 0.99, 95% CI 0.76 to 1.30; 521 women; 1 study; Analysis 11.4).
Vaginal birth not achieved within 48 and 72 hours and randomisation to birth interval were not reported.
Complications
There were no clear differences between the groups for the following outcomes:
-
instrumental vaginal birth (RR 0.70, 95% CI 0.46 to 1.08; 521 women; 1 study; Analysis 11.5);
-
caesarean section (RR 1.20, 95% CI 0.78 to 1.86; 521 women; 1 study; Analysis 11.6);
-
Apgar score less than seven at five minutes (RR 1.86, 95% CI 0.34 to 10.06; 521 women; 1 study; Analysis 11.7); and
-
NICU admission (RR 1.09, 95% CI 0.64 to 1.85; 521 women; 1 study; Analysis 11.8).
There was no information for uterine hyperstimulation (with FHR changes), uterine hyperstimulation (without FHR changes), perinatal death, postpartum haemorrhage, serious maternal complications (considered as separate outcomes, e.g. intensive care unit admission, septicaemia, uterine rupture), or serious neonatal complications (considered as separate outcomes).
Non‐prespecified outcomes
Mean duration of birth (hours) was very similar in each group (MD 0.40 hours, 95% CI ‐0.72 to 1.52; 521 women; 1 study; Analysis 11.9).
Discussion
Summary of main results
The included studies examined 11 different types of interventions in outpatient settings. Overall, the results demonstrate that outpatient induction of labour is feasible and that important adverse events are rare (Table 1; Table 2; Table 3). However, the safety data should be treated with considerable caution. First, very few of the studies provided information on maternal and neonatal death or serious morbidity. It may not be safe to assume that because adverse outcomes were not reported, they did not occur. Further, even where outcomes such as perinatal mortality, maternal complications or serious neonatal morbidity were reported, the finding that there was no apparent difference between groups was not surprising as none of these studies had the statistical power to detect differences for such rare outcomes in relatively low‐risk populations.
| Uterine hyperstimulation | |
| PGE₂(vaginal) | |
| 1/18 PGE group (FHR status unknown), 0/18 in placebo group | |
| 2/28 PGE group (FHR status unknown), 0/30 in control group (no treatment) | |
| 1/50 PGE group (normal FHR), 0/50 in placebo group | |
| Total | 4/96 PGE, 0/98 in control group |
| PGE₂(intracervical) | |
| 1/23 PGE group (with FHR decelerations), 0/20 in placebo group | |
| 2/43 PGE group, 1/47 placebo group with FHR deceleration in both | |
| 1/30 PGE group (fetal bradycardia), 0/31 placebo group | |
| 1/143 PGE group, 0/151 control (no treatment) with hyperstimulation 11/143 FHR decelerations in PGE group, 12/151 in control | |
| Total | 5/239 PGE, 1/249 control with hyperstimulation |
| Intravaginal misoprostol | |
| 2/27 misoprostol group with FHR deceleration, 2/33 placebo group 1/27 misoprostol with tachysystole without FHR changes, 0/33 placebo group | |
| 3/57 misoprostol with hyperstimulation (FHR unknown), 2/63 placebo group 2/57 misoprostol with hypertonus, 5/57 misoprostol with tachysystole, none control | |
| 1/33 misoprostol (FHR deceleration), 0/35 placebo group | |
| Oral misoprostol | |
| 1/18 misoprostol, 2/22 placebo group (FHR unknown) with hyperstimulation | |
| 8/43 misoprostol, 4/44 placebo group hyperstimulation syndrome (tachysystole or hypertonus, with FHR changes) | |
| Total | 9/61 misoprostol, 6/66 placebo group |
| Mifepristone | |
| 4/41 mifepristone group, 0/42 placebo group with hypertonia (FHR unknown) | |
| 0/16 in both groups | |
| Total | 4/57 mifepristone, 0/58 placebo with hypertonia |
| IMN | |
| 0/51 IMN group, 2/51 placebo group with hyperstimulation (abnormal FHR) 1/51 IMN, 8/51 placebo group with tachysystolia (FHR normal) | |
| 0/100 IMN group, 5/100 placebo group with hyperstimulation (FHR changes unclear) | |
| Total | 1/151 IMN group, 15/151 placebo group (hyperstimulation or tachysystolia, ±FHR changes) |
IMN: isosorbide mononitrate; FHR: fetal heart rate
| Neonatal complications | |
| PGE₂vaginal | |
| 0/24 in PGE₂ group; 2/26 in placebo group to NICU | |
| 2/38 in PGE₂; 4/42 in placebo group to NICU | |
| 1/50 in PGE₂; 5/50 in placebo group to NICU | |
| Total | 3/112 PGE, 11/118 control to NICU |
| PGE₂intracervical | |
| 6/41 PGE group, 8/43 placebo group with complication such as tachypnoea, meconium aspiration, meconium or admission to NICU | |
| 3/35 PGE₂ versus 0/35 control NICU admission | |
| 1/30 PGE, 2/31 placebo group with complication | |
| Total | 10/106 PGE, 10/109 controls with neonatal complications/admitted to NICU |
| Vaginal misoprostol | |
| 1/27 misoprostol, 3/33 placebo group to NICU | |
| 18/57 misoprostol, 20/63 placebo group to NICU | |
| 0/33 misoprostol, 1/35 placebo group to NICU | |
| 1/38 misoprostol, 1/39 control (no treatment) to NICU | |
| 1/43 misoprostol, 1/44 placebo group to NICU | |
| Total | 21/198 misoprostol, 26/214 control to NICU |
| Misoprostol 25 µg versus 50 µg | |
| 1/23 25 µg, 2/26 50 µg misoprostol to NICU | |
| Intracervical PGE₂versus intravaginal misoprostol | |
| 5/42 PGE, 4/42 misoprostol to NICU | |
| Mifepristone | |
| 0/50 mifepristone, 1/30 placebo group to NICU | |
| 5/41 mifepristone, 4/42 control to NICU | |
| Total | 5/91 mifepristone, 5/72 control to NICU |
| IMN | |
| 18/177 IMN, 16/173 placebo group to NICU | |
| 13/100 IMN, 9/100 placebo group to NICU | |
| 0/51 IMN, 1/51 placebo group to NICU | |
| 5/100 IMN, 14/100 placebo group to nursery admission | |
| 0/36 IMN, 0/36 placebo group to NICU | |
| 1/72 IMN, 1/72 placebo group to NICU | |
| Total | 37/536 IMN, 41/532 placebo group to NICU |
| Outpatient amniotomy for induction versus routine care | |
| 27/270 IMN, 23/251 placebo group to NICU | |
NICU: neonatal intensive‐care unit
| Maternal complications | |
| Intracervical PGE₂ | |
| 4/41 PGE, 10/43 placebo group with complication such as endometritis, chorioamnionitis and pre‐eclampsia | |
| 6/43 PGE, 3/47 placebo group with complication such as endometritis and chorioamnionitis | |
| 1/30 PGE with PPH, 0/31 placebo group 2/30 PGE, 2/31 placebo group with infection | |
| 8/143 PGE, 7/151 control (no treatment) with endometritis | |
| Total | 21/257 PGE₂, 22/272 control with maternal complications |
| Oral misoprostol | |
| 8/43 misoprostol group, 9/44 placebo group with chorioamnionitis 1/43 misoprostol group, 2/44 placebo group with endometritis 2/43 misoprostol group, 0/44 placebo group with PPH | |
| Total | 11/43 misoprostol group, 11/44 placebo group with maternal complications |
| IMN | |
| Blood loss > 500 mL: 59/177 IMN, 47/173 placebo group | |
| Blood loss > 1000 mL: 14/100 IMN, 12/100 placebo group | |
| PPH: 2/51 IMN, 3/51 placebo group | |
| 2/100 IMN group, 3/100 placebo group with PPH | |
| 0/36 IMN group, 0/36 placebo group with need for blood transfusion | |
| 0/678 IMN group, 0/684 placebo group for maternal death 124/678 IMN group, 112/684 placebo group for PPH 20/678 IMN group, 13/684 placebo group for severe PPH 1/678 IMN group, 0/684 placebo group for deep vein thrombosis | |
| Total | 202/1142 IMN group, 204/1148 placebo group with maternal complications |
| Outpatient amniotomy | |
| 26/270 amniotomy group, 29/251 routine care group ‐ mother treated with antibiotics | |
PPH: postpartum haemorrhage
There was some evidence that, compared with placebo or no treatment, induction agents reduced the need for further intervention to induce labour, and potentially shorten the interval from intervention to birth. However, we were unable to pool results on outcomes relating to progress in labour, as studies tended to measure a very broad range of outcomes.
There was no evidence that induction agents increased interventions in labour such as operative deliveries. Only five studies (Attanayake 2014; Bollapragada 2006a; Bullarbo 2007; Rijnders 2011; Schmitz 2014) collected information on women's views about the induction process, and overall there was very little information on the costs to health services of different methods of induction of labour in outpatient settings.
Few studies reported on maternal satisfaction. The Bollapragada 2006a trial suggested that women receiving isosorbide mononitrate were less satisfied than controls. This finding may have been associated with the relatively high number of women in the intervention group experiencing unpleasant side effects (particularly headaches) during the treatment period.
Overall completeness and applicability of evidence
It is debatable what would constitute definitive evidence on the effectiveness and safety of various induction protocols in the outpatient (home) environment. The issues that are likely to be important to women and healthcare providers were not adequately addressed in the included trials in this review or a related Cochrane Review comparing home and hospital inductions (Kelly 2013).
Safety
Adverse events in the pregnant population of women who are likely to be eligible for outpatient induction are rare (Table 1; Table 2). There is no consensus on what would be an unacceptable risk of an outpatient induction; views may vary among different healthcare systems and among women, doctors and healthcare commissioners in the same system. Assuming that one additional serious adverse event (e.g. perinatal death/serious morbidity) for every 500 outpatient inductions is considered unacceptable (irrespective of the cost savings made), a very large randomised trial or meta‐analysis including thousands of women would be needed to be able to exclude a possibility of such an excess risk. A trial (or meta‐analysis) of this size designed to exclude such an excess risk (equivalence trial) is unlikely to be funded, irrespective of the method used.
In the absence of adequate safety data from randomised trials, the only pragmatic solution is to rely on observational data from large cohorts with relatively robust surrogate outcomes such as emergency caesarean section for presumed fetal distress or emergency transfer to hospital. A paper from Canada (Salvador 2009) reported on 567 outpatient inductions with no serious complications, but it is not entirely clear what was included in this composite outcome. Other surrogate outcomes, such as uterine hyperstimulation or fetal heart rate abnormalities (which have been reported in some studies (e.g. Ramsey 2005)), may be difficult to interpret unless there are clear definitions of what these outcomes mean. The use of common outcomes with agreed definitions applicable to all healthcare settings would be welcome; see Implications for research.
Experience of women and staff
Outpatient induction may be more convenient for women, who may feel more comfortable at home, and prefer being there rather than in hospital. On the other hand, women may feel worried about the induction process (especially if they live at some distance from emergency facilities) and the induction agent may cause side effects that are distressing, so some women may prefer the reassurance offered by hospital care. We have very limited information on what women would prefer, and no evidence on whether any women were forced to make arrangements for rapid transfer to hospital.
Outcomes such as average time to 'admission in labour' may be difficult to understand if there is no clear definition of what this means. The time may be partly determined by women's decisions about when to attend hospital, which may depend on a broad range of physiological, psychological, social and practical factors. For example, a woman experiencing unpleasant side effects, living at a distance from emergency facilities may seek early admission; under these circumstances the outcome does not serve as a good proxy for progress in labour. Criteria for admission to hospital in the trials were frequently not specified and included active labour (variously defined), ruptured membranes and a range of other indications. Further, a short interval to admission is not necessarily a good thing; a very short interval means that sending women home may not be worthwhile, a long interval may not be harmful provided women are reasonably comfortable and there is no urgent need for birth. A short interval to admission is also meaningless if it is offset by prolonged and painful labour. Reporting these two outcomes separately may not, therefore, be helpful.
Measures of cervical change (Bishop score) may also be problematic, for example, mean increases in Bishop scores on hospital admission, or Bishop scores reaching a certain level at given time points, are not straightforward to interpret. Such outcomes may not give any clear idea of when birth will occur, whether more rapid cervical dilatation is predictive of a more rapid labour, or whether the birth will be more or less likely to be normal.
Cost
Health service providers may also assume that transferring care to community or outpatient settings may reduce the total costs of care; we have no evidence to support this assumption. In the absence of formal economic evaluation, descriptive information on the total length of hospital stay for mothers and babies receiving active or placebo interventions may have been helpful in understanding the impact of outpatient procedures on health service utilisation. Such information was generally not provided. Instead, studies tended to focus on proxy measures for progress in labour, but we would advise caution in the way such information is collected and interpreted.
It is possible that different induction agents perform quite differently at different stages of cervical dilatation or at different gestational ages. Most included studies recruited women requiring induction for 'postdates pregnancy'. In different studies 'postdates' was defined differently, and may have been any gestational age between approximately 39 to 44 weeks; in some studies women were recruited from 37 weeks. The cervical status at recruitment also varied considerably with Bishop scores at recruitment being any value less than nine. One of the included studies recruited women with diabetes; there is insufficient evidence to know whether outpatient induction is safe and acceptable for women in high‐risk groups.
With one or two exceptions, information on costs to women was generally not reported in the included trials. In the absence of such data the assumption must be that women were not asked for their views on care, or about costs or inconvenience associated with hospital or outpatient care. The potential importance of such outcomes (patient‐related outcome measures) is increasingly being recognised by commissioners of healthcare services.
Quality of the evidence
Most included studies were assessed as being at relatively low risk of bias; most of the trials were placebo controlled with adequate methods of randomisation and low levels of attrition. There was no blinding in eight trials where interventions were compared with no intervention or routine care. Lack of blinding may be a particular problem in these studies, as many of the outcomes reported may have depended on clinical judgements by staff (e.g. need for hospital admission, prescription of additional drugs to induce or augment labour, and other interventions in labour). In other words, clinical decisions may have been affected by knowledge of treatment allocation. Summaries of 'Risk of bias' assessments are presented in Figure 3 and Figure 2.
For the comparison of vaginal PGE₂ versus placebo or expectant management for the induction of labour in outpatient settings, we graded evidence for uterine hyperstimulation (fetal heart rate (FHR) changes unclear), caesarean section, and neonatal intensive care unit (NICU) admission as low quality (summary of findings Table for the main comparison). There was no evidence for vaginal birth not achieved within 24 hours, vaginal birth not achieved in 48 to 72 hours, serious neonatal morbidity or death, or serious maternal morbidity or death.
For the comparison of intracervical PGE₂ versus placebo, we graded the evidence for vaginal birth not achieved in 48 to 72 hours, uterine hyperstimulation (with FHR changes), and NICU admission as low quality, and evidence for caesarean section as moderate quality (summary of findings Table 2). Vaginal birth not achieved within 24 hours, serious neonatal morbidity or death, and serious maternal morbidity or death were not reported.
For the comparison of vaginal misoprostol versus placebo, we graded the evidence as low for uterine hyperstimulation (with FHR changes), caesarean section, serious neonatal morbidity or death, and NICU admission (summary of findings Table 3). Vaginal birth not achieved in 24 hours, vaginal birth not achieved within 48 and 72 hours, and serious maternal morbidity or death were not reported.
Evidence across the three comparisons was downgraded for imprecision of effect estimates, few events, and small sample sizes.
Potential biases in the review process
We acknowledge that there was a possibility of introducing bias at every stage of the review process. We attempted to minimise bias in a number of ways; two review authors assessed eligibility for inclusion, carried out data extraction and assessed risk of bias. Each worked independently. Nevertheless, the process of assessing risk of bias, for example, is not an exact science and includes many personal judgements. Further, the process of reviewing research studies is known to be affected by prior beliefs and attitudes. It is difficult to control for this type of bias.
While we attempted to be as inclusive as possible in the search strategy, the literature identified was predominantly written in English and published in North American and European journals. We did not attempt to formally assess reporting bias, constraints of time meant that assessment of risk of bias largely relied on information available in the published trial reports and thus, reporting bias was not usually apparent. Too few studies were included in each comparison in the review to allow us to explore possible publication bias.
Agreements and disagreements with other studies or reviews
A number of related Cochrane Reviews have examined the same methods of induction of labour considered in this review, namely: vaginal PGE₂ (Thomas 2014), intracervical PGE₂ (Boulvain 2008), vaginal misoprostol (Hofmeyr 2010), oral misoprostol (Alfirevic 2014), mifepristone (Hapangama 2009), oestrogens (Thomas 2001), nitric oxide donors (Ghosh 2016) and acupuncture (Smith 2013). Compared with these other reviews (which included both hospital (inpatient) and home (outpatient) inductions), the current review contains relatively few studies, and therefore, has insufficient statistical power to demonstrate differences between groups. This is particularly the case for relatively rare outcomes such as uterine rupture, but is also true for more common complications such as uterine hyperstimulation.
Evidence from the related Cochrane Reviews is mainly in agreement with the findings of this review. Findings from these reviews indicate that compared with placebo, PGE₂ (vaginal and intracervical) and vaginal and oral misoprostol are effective induction agents in that vaginal birth within 24 hours was more likely for women receiving these agents. There is less evidence regarding the effectiveness of mifepristone, oestrogens, nitric oxide donors (including IMN) and acupuncture. Findings regarding safety suggest that some methods of induction (PGE₂ and vaginal misoprostol) may be associated with an increased risk of uterine hyperstimulation. However, despite the relatively large number of studies included in some of these reviews, even pooled results from studies do not provide strong evidence regarding serious maternal and neonatal morbidity and death; as we have discussed above, with such rare outcomes very large trials are needed to exclude excess risk, or risk must be imputed by examining surrogate outcomes. None of these reviews specifically considered the issue of outpatient induction and we must remain cautious about assuming that methods that appear safe in hospital will achieve the same levels of safety (and indeed effectiveness) in outpatient settings. As we have indicated in this review, related reviews also illustrate that very little attention has been paid to consumer views or the costs of care.
Most of the related Cochrane Reviews examined the effectiveness of induction agents compared with placebo. Relatively few studies have examined different methods of induction directly. Where different agents have been compared (e.g. IMN with vaginal PGE₂ (Osman 2006)) some agents may have advantages over others, and the safety profile of different agents (and doses) may differ. This may mean that they are more or less suitable for outpatient use.
Another Cochrane Review compared the same method of induction in home and hospital settings directly, but this review contained only four trials and was unable to shed much light on issues of either the relative effectiveness, safety or costs associated with outpatient induction (Kelly 2013).
Risk of bias summary: review authors' judgements about each risk of bias item for each included study.
Risk of bias graph: review authors' judgements about each risk of bias item presented as percentages across all included studies.

Comparison 1 Intravaginal PGE₂ gel versus placebo or expectant management, Outcome 1 Additional induction agents required.
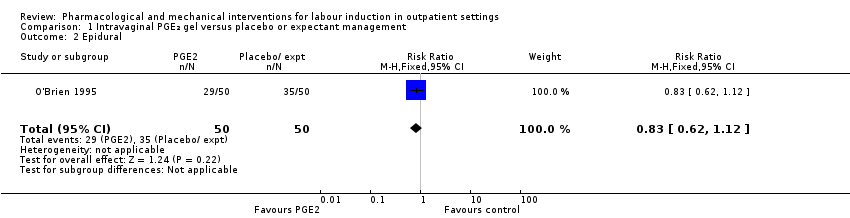
Comparison 1 Intravaginal PGE₂ gel versus placebo or expectant management, Outcome 2 Epidural.
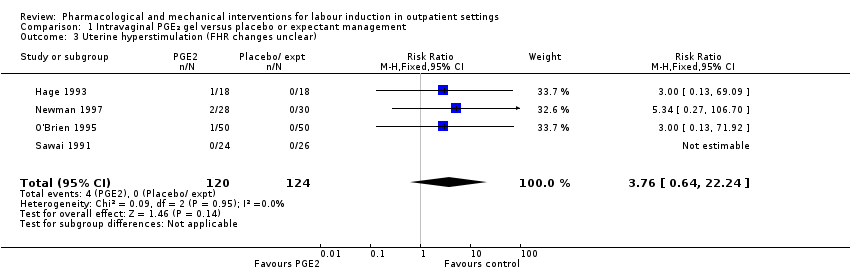
Comparison 1 Intravaginal PGE₂ gel versus placebo or expectant management, Outcome 3 Uterine hyperstimulation (FHR changes unclear).

Comparison 1 Intravaginal PGE₂ gel versus placebo or expectant management, Outcome 4 Caesarean section.

Comparison 1 Intravaginal PGE₂ gel versus placebo or expectant management, Outcome 5 Apgar score < 7 at 5 minutes.
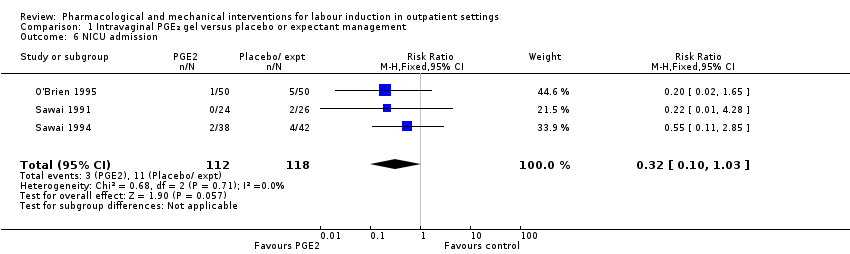
Comparison 1 Intravaginal PGE₂ gel versus placebo or expectant management, Outcome 6 NICU admission.
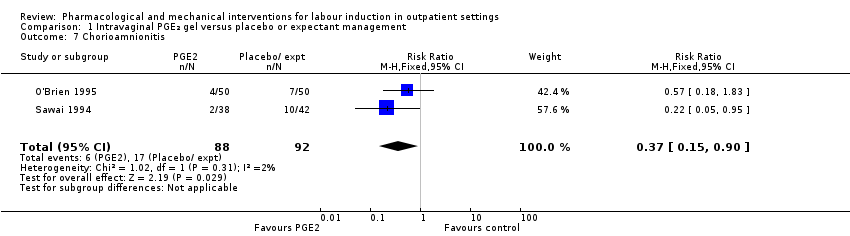
Comparison 1 Intravaginal PGE₂ gel versus placebo or expectant management, Outcome 7 Chorioamnionitis.

Comparison 1 Intravaginal PGE₂ gel versus placebo or expectant management, Outcome 8 Indicator of 'progress' in labour ‐ Cervix unchanged at follow up (not pre‐specified).

Comparison 1 Intravaginal PGE₂ gel versus placebo or expectant management, Outcome 9 'Spontaneous labour' within 48 hours.
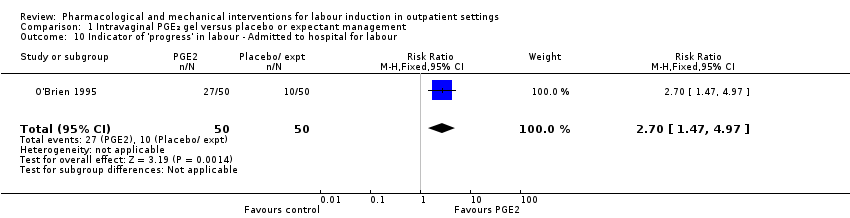
Comparison 1 Intravaginal PGE₂ gel versus placebo or expectant management, Outcome 10 Indicator of 'progress' in labour ‐ Admitted to hospital for labour.

Comparison 1 Intravaginal PGE₂ gel versus placebo or expectant management, Outcome 11 Time to birth ‐ Gestational age at birth (weeks).

Comparison 1 Intravaginal PGE₂ gel versus placebo or expectant management, Outcome 12 Time to birth ‐ Gestational age on admission (days).

Comparison 2 Intracervical PGE₂ versus placebo, Outcome 1 Additional induction agent required (induction with oxytocin or other means).

Comparison 2 Intracervical PGE₂ versus placebo, Outcome 2 Additional induction agents required (further prostaglandin required).

Comparison 2 Intracervical PGE₂ versus placebo, Outcome 3 Uterine rupture.

Comparison 2 Intracervical PGE₂ versus placebo, Outcome 4 Birth not achieved in 48 to 72 hours.

Comparison 2 Intracervical PGE₂ versus placebo, Outcome 5 Oxytocin augmentation.
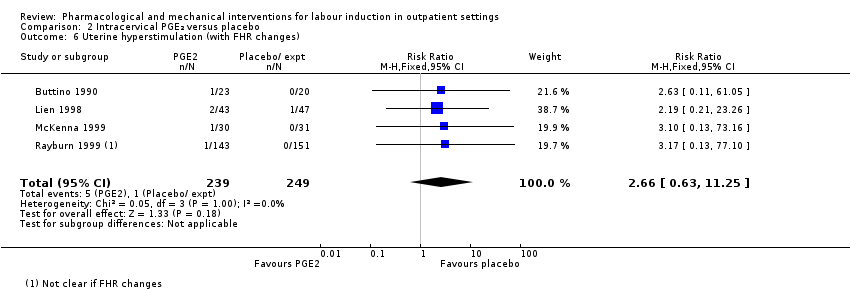
Comparison 2 Intracervical PGE₂ versus placebo, Outcome 6 Uterine hyperstimulation (with FHR changes).

Comparison 2 Intracervical PGE₂ versus placebo, Outcome 7 Assisted (instrumental) vaginal birth.

Comparison 2 Intracervical PGE₂ versus placebo, Outcome 8 Caesarean section.
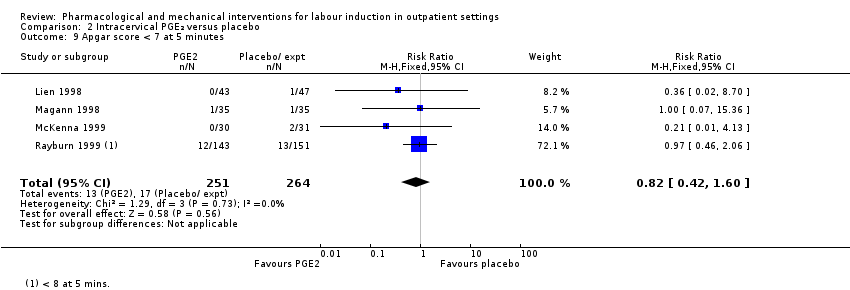
Comparison 2 Intracervical PGE₂ versus placebo, Outcome 9 Apgar score < 7 at 5 minutes.
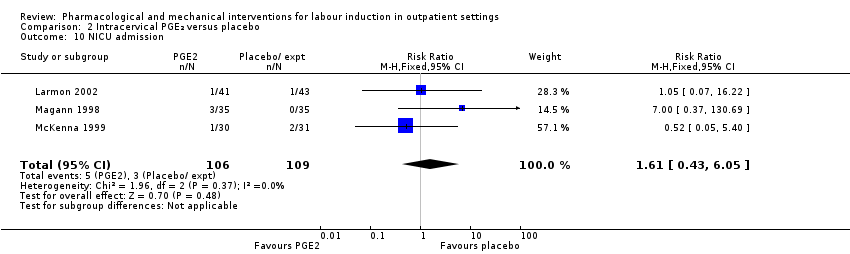
Comparison 2 Intracervical PGE₂ versus placebo, Outcome 10 NICU admission.
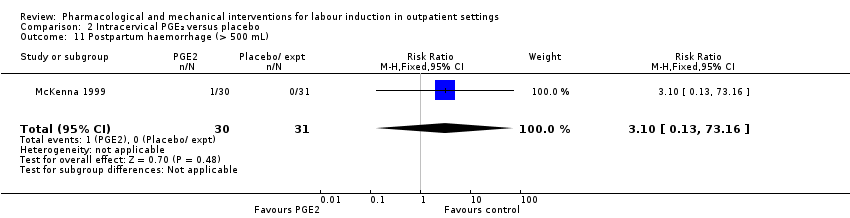
Comparison 2 Intracervical PGE₂ versus placebo, Outcome 11 Postpartum haemorrhage (> 500 mL).

Comparison 2 Intracervical PGE₂ versus placebo, Outcome 12 Chorioamnionitis.

Comparison 2 Intracervical PGE₂ versus placebo, Outcome 13 Endometritis.

Comparison 2 Intracervical PGE₂ versus placebo, Outcome 14 Side effects ‐ Maternal side effects.

Comparison 2 Intracervical PGE₂ versus placebo, Outcome 15 Time to birth ‐ Interval from intervention to birth (days).

Comparison 2 Intracervical PGE₂ versus placebo, Outcome 16 Time to birth ‐ Gestational age at birth (weeks).
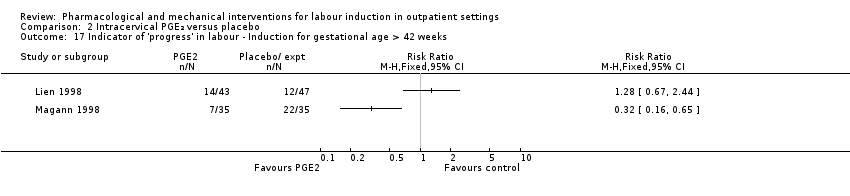
Comparison 2 Intracervical PGE₂ versus placebo, Outcome 17 Indicator of 'progress' in labour ‐ Induction for gestational age > 42 weeks.

Comparison 2 Intracervical PGE₂ versus placebo, Outcome 18 Time to birth ‐ Birth within 48 hours of treatment (all births).

Comparison 3 Vaginal misoprostol versus placebo, Outcome 1 Serious neonatal morbidity or death.

Comparison 3 Vaginal misoprostol versus placebo, Outcome 2 Epidural.
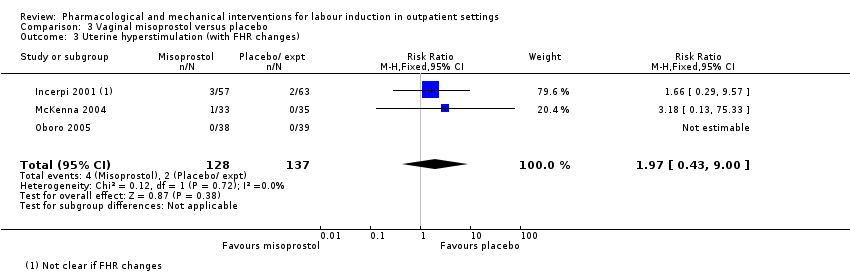
Comparison 3 Vaginal misoprostol versus placebo, Outcome 3 Uterine hyperstimulation (with FHR changes).

Comparison 3 Vaginal misoprostol versus placebo, Outcome 4 Uterine hyperstimulation (without FHR changes).
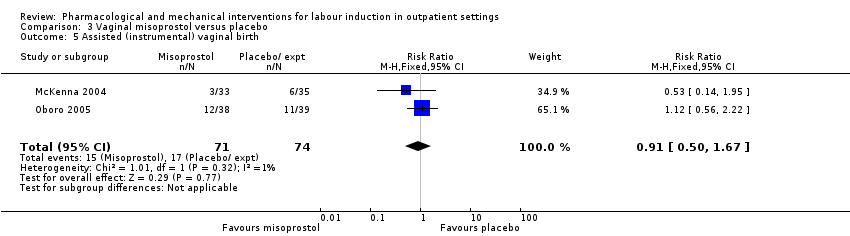
Comparison 3 Vaginal misoprostol versus placebo, Outcome 5 Assisted (instrumental) vaginal birth.

Comparison 3 Vaginal misoprostol versus placebo, Outcome 6 Caesarean section.
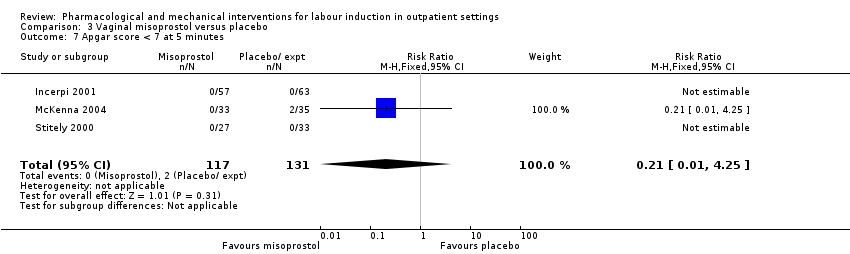
Comparison 3 Vaginal misoprostol versus placebo, Outcome 7 Apgar score < 7 at 5 minutes.

Comparison 3 Vaginal misoprostol versus placebo, Outcome 8 NICU admission.

Comparison 3 Vaginal misoprostol versus placebo, Outcome 9 Perinatal death.

Comparison 3 Vaginal misoprostol versus placebo, Outcome 10 Neonatal infection.

Comparison 3 Vaginal misoprostol versus placebo, Outcome 11 Indicator of 'progress' in labour ‐ Oxytocin dose used (mU).
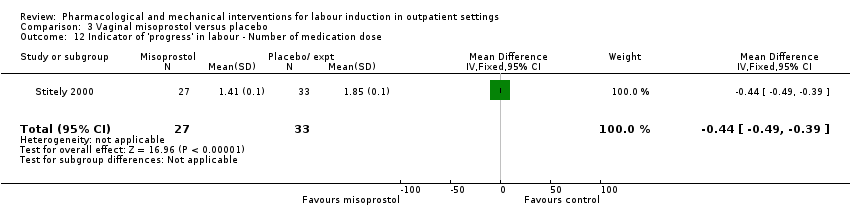
Comparison 3 Vaginal misoprostol versus placebo, Outcome 12 Indicator of 'progress' in labour ‐ Number of medication dose.
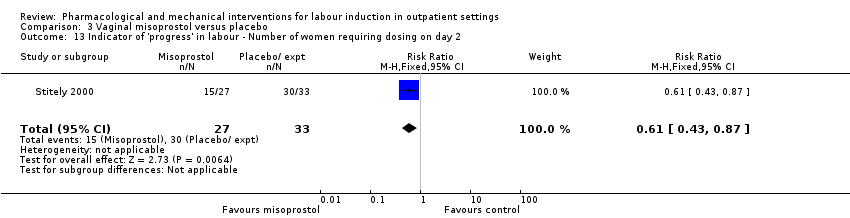
Comparison 3 Vaginal misoprostol versus placebo, Outcome 13 Indicator of 'progress' in labour ‐ Number of women requiring dosing on day 2.
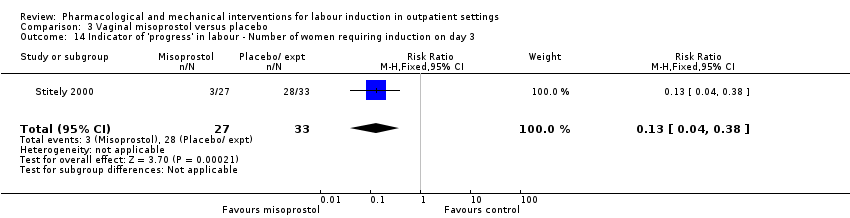
Comparison 3 Vaginal misoprostol versus placebo, Outcome 14 Indicator of 'progress' in labour ‐ Number of women requiring induction on day 3.

Comparison 3 Vaginal misoprostol versus placebo, Outcome 15 Indicator of 'progress' in labour ‐ Days to admission (all) (days).

Comparison 3 Vaginal misoprostol versus placebo, Outcome 16 Indicator of 'progress' in labour ‐ Days to admission (subgroups by parity) (days).

Comparison 3 Vaginal misoprostol versus placebo, Outcome 17 Indicator of 'progress' in labour ‐ Gestational age at labour (weeks).

Comparison 3 Vaginal misoprostol versus placebo, Outcome 18 Indicator of 'progress' in labour ‐ Days to admission (parous) (weeks).
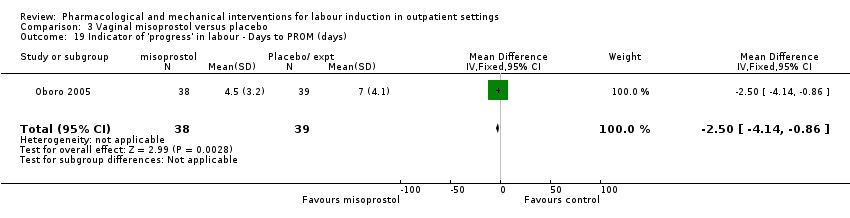
Comparison 3 Vaginal misoprostol versus placebo, Outcome 19 Indicator of 'progress' in labour ‐ Days to PROM (days).
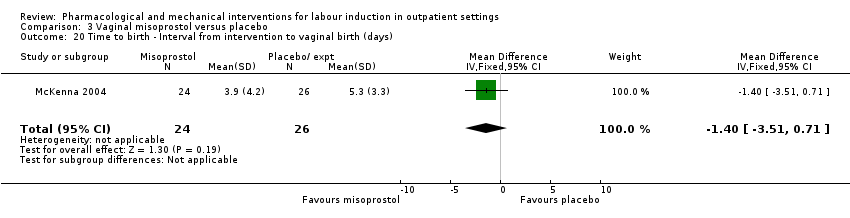
Comparison 3 Vaginal misoprostol versus placebo, Outcome 20 Time to birth ‐ Interval from intervention to vaginal birth (days).

Comparison 3 Vaginal misoprostol versus placebo, Outcome 21 Time to birth ‐ Days to birth (all) (days).

Comparison 3 Vaginal misoprostol versus placebo, Outcome 22 Time to birth ‐ Days to birth (subgroups by parity) (days).

Comparison 4 Vaginal misoprostol 25 µg versus 50 µg, Outcome 1 Additional induction agents required (oxytocin).
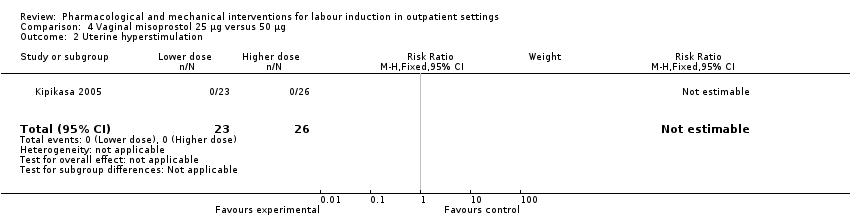
Comparison 4 Vaginal misoprostol 25 µg versus 50 µg, Outcome 2 Uterine hyperstimulation.
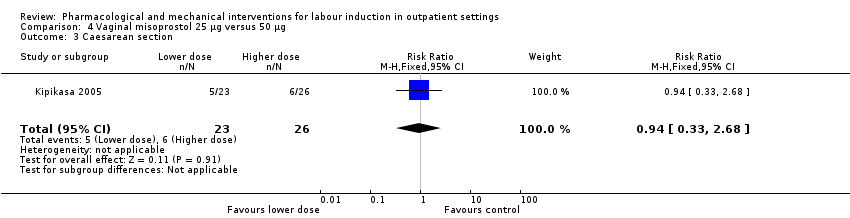
Comparison 4 Vaginal misoprostol 25 µg versus 50 µg, Outcome 3 Caesarean section.

Comparison 4 Vaginal misoprostol 25 µg versus 50 µg, Outcome 4 NICU admission.

Comparison 4 Vaginal misoprostol 25 µg versus 50 µg, Outcome 5 Interval from treatment to birth (in days, all births).

Comparison 5 Intracervical PGE₂ versus vaginal misoprostol, Outcome 1 Uterine hyperstimulation (with or without FHR changes).

Comparison 5 Intracervical PGE₂ versus vaginal misoprostol, Outcome 2 Caesarean section.

Comparison 5 Intracervical PGE₂ versus vaginal misoprostol, Outcome 3 Apgar score < 7 after 5 minutes.
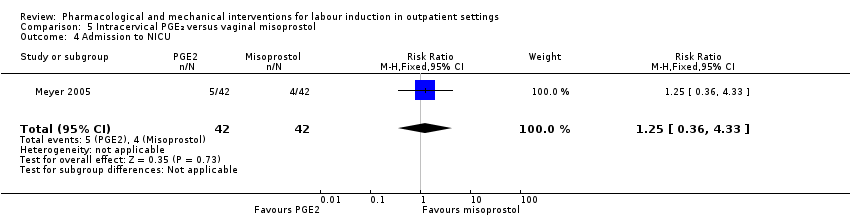
Comparison 5 Intracervical PGE₂ versus vaginal misoprostol, Outcome 4 Admission to NICU.
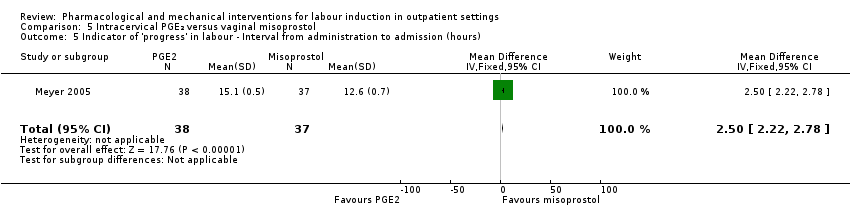
Comparison 5 Intracervical PGE₂ versus vaginal misoprostol, Outcome 5 Indicator of 'progress' in labour ‐ Interval from administration to admission (hours).

Comparison 5 Intracervical PGE₂ versus vaginal misoprostol, Outcome 6 Indicator of 'progress' in labour ‐ Labour or SROM during ripening.

Comparison 5 Intracervical PGE₂ versus vaginal misoprostol, Outcome 7 Time to birth ‐ Birth within 24 hours.

Comparison 5 Intracervical PGE₂ versus vaginal misoprostol, Outcome 8 Time to birth ‐ Birth within 48 hours (cumulative).

Comparison 6 Oral misoprostol versus placebo, Outcome 1 Vaginal delivery not achieved within 24 hours.

Comparison 6 Oral misoprostol versus placebo, Outcome 2 Additional induction agents required.

Comparison 6 Oral misoprostol versus placebo, Outcome 3 Oxytocin augmentation.

Comparison 6 Oral misoprostol versus placebo, Outcome 4 Uterine hyperstimulation (with FHR changes).

Comparison 6 Oral misoprostol versus placebo, Outcome 5 Uterine hyperstimulation (FHR changes unclear).

Comparison 6 Oral misoprostol versus placebo, Outcome 6 Instrumental vaginal birth.

Comparison 6 Oral misoprostol versus placebo, Outcome 7 Caesarean section.
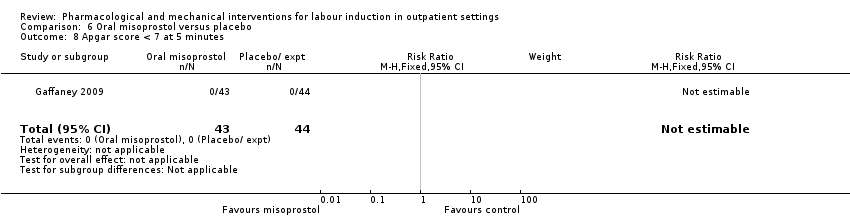
Comparison 6 Oral misoprostol versus placebo, Outcome 8 Apgar score < 7 at 5 minutes.
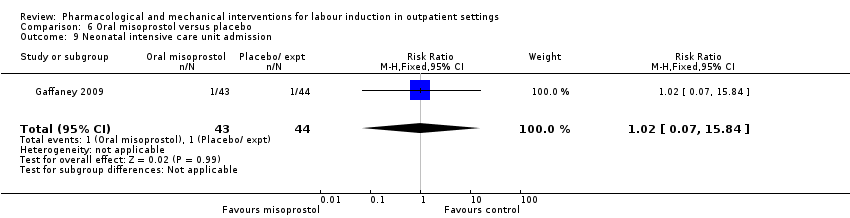
Comparison 6 Oral misoprostol versus placebo, Outcome 9 Neonatal intensive care unit admission.
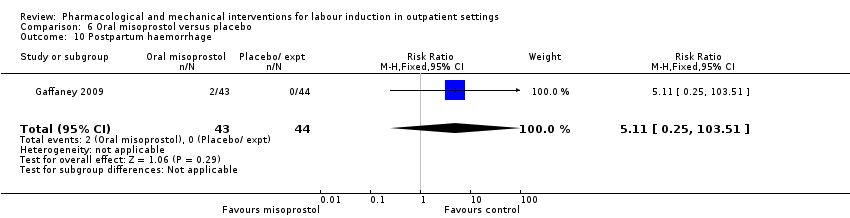
Comparison 6 Oral misoprostol versus placebo, Outcome 10 Postpartum haemorrhage.
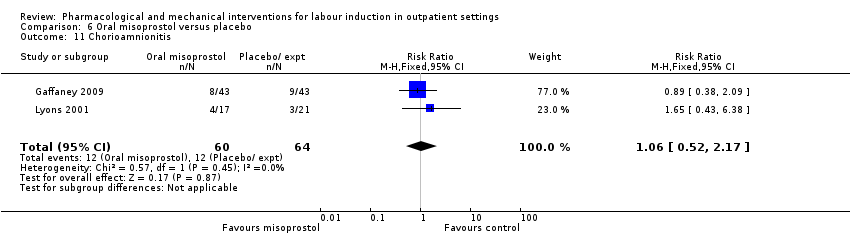
Comparison 6 Oral misoprostol versus placebo, Outcome 11 Chorioamnionitis.

Comparison 6 Oral misoprostol versus placebo, Outcome 12 Endometritis.

Comparison 6 Oral misoprostol versus placebo, Outcome 13 Indicator of 'progress' in labour ‐ Time from first dose to active labor (hours).

Comparison 6 Oral misoprostol versus placebo, Outcome 14 Time to birth ‐ First dose to birth (hours).
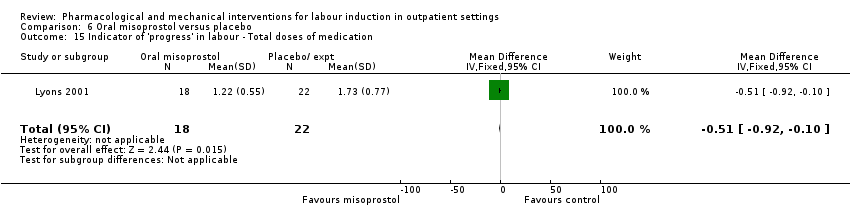
Comparison 6 Oral misoprostol versus placebo, Outcome 15 Indicator of 'progress' in labour ‐ Total doses of medication.
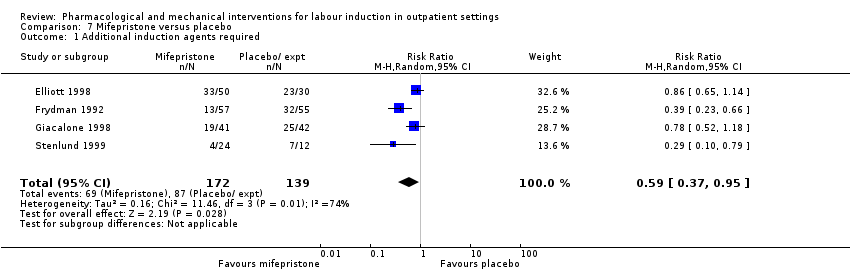
Comparison 7 Mifepristone versus placebo, Outcome 1 Additional induction agents required.

Comparison 7 Mifepristone versus placebo, Outcome 2 Serious neonatal morbidity or death.

Comparison 7 Mifepristone versus placebo, Outcome 3 Oxytocin augmentation.

Comparison 7 Mifepristone versus placebo, Outcome 4 Epidural.

Comparison 7 Mifepristone versus placebo, Outcome 5 Assisted (instrumental) vaginal birth.
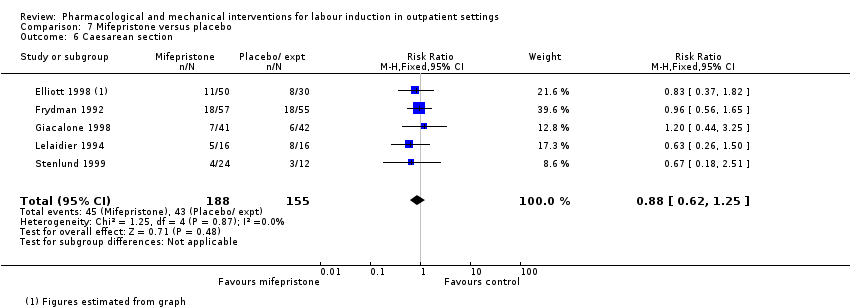
Comparison 7 Mifepristone versus placebo, Outcome 6 Caesarean section.

Comparison 7 Mifepristone versus placebo, Outcome 7 Apgar score < 7 at 5 minutes.
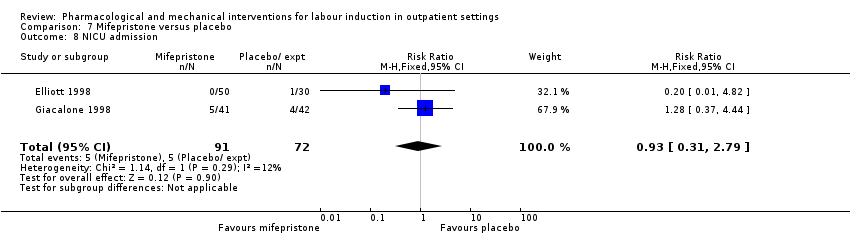
Comparison 7 Mifepristone versus placebo, Outcome 8 NICU admission.

Comparison 7 Mifepristone versus placebo, Outcome 9 Perinatal death.
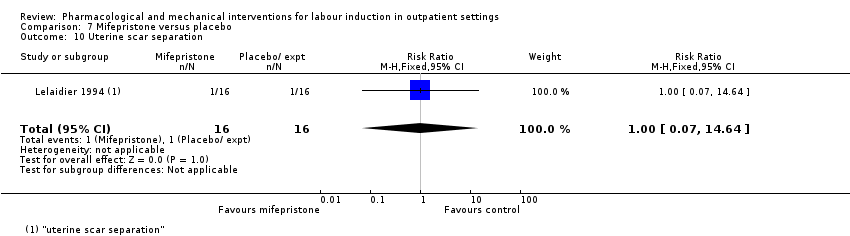
Comparison 7 Mifepristone versus placebo, Outcome 10 Uterine scar separation.
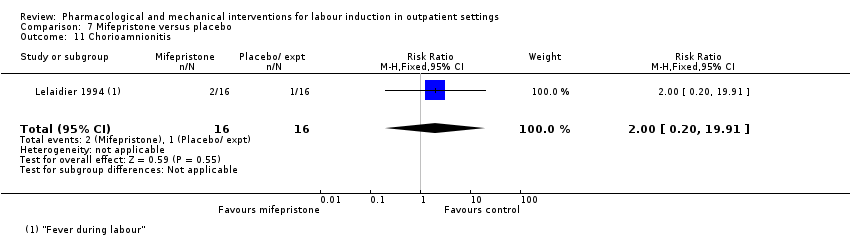
Comparison 7 Mifepristone versus placebo, Outcome 11 Chorioamnionitis.

Comparison 7 Mifepristone versus placebo, Outcome 12 Indicator of 'progress' in labour ‐ Labour or ripe cervix in 48 hours.

Comparison 7 Mifepristone versus placebo, Outcome 13 Indicator of 'progress' in labour ‐ Cervix unchanged after 24/48 hours.
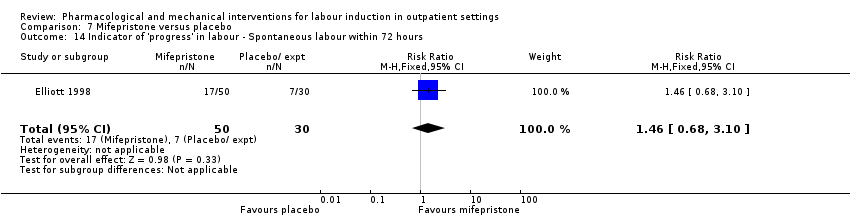
Comparison 7 Mifepristone versus placebo, Outcome 14 Indicator of 'progress' in labour ‐ Spontaneous labour within 72 hours.
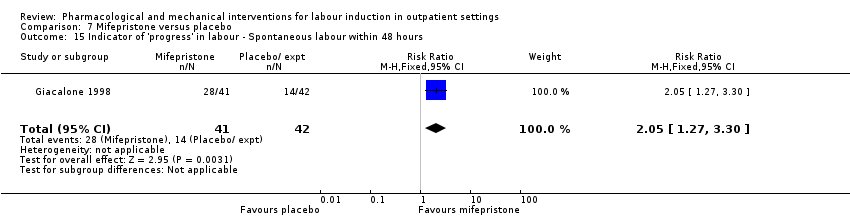
Comparison 7 Mifepristone versus placebo, Outcome 15 Indicator of 'progress' in labour ‐ Spontaneous labour within 48 hours.

Comparison 7 Mifepristone versus placebo, Outcome 16 Indicator of 'progress' in labour ‐ Oxytocin requirements (IU).
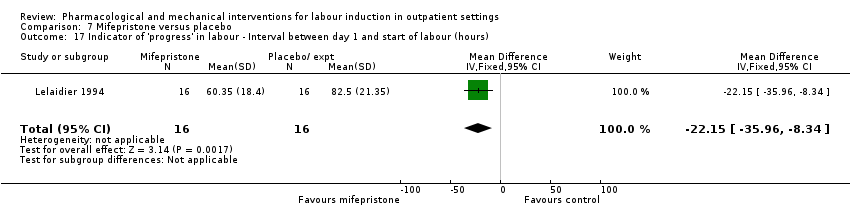
Comparison 7 Mifepristone versus placebo, Outcome 17 Indicator of 'progress' in labour ‐ Interval between day 1 and start of labour (hours).

Comparison 8 Oestrogens versus placebo, Outcome 1 Oxytocin augmentation.

Comparison 8 Oestrogens versus placebo, Outcome 2 Assisted (instrumental) vaginal birth.

Comparison 8 Oestrogens versus placebo, Outcome 3 Caesarean section.

Comparison 8 Oestrogens versus placebo, Outcome 4 NICU admission.

Comparison 8 Oestrogens versus placebo, Outcome 5 Chorioamnionitis.

Comparison 8 Oestrogens versus placebo, Outcome 6 Endometritis.

Comparison 9 Vaginal isosorbide mononitrate (IMN) versus placebo, Outcome 1 Vaginal birth not achieved in 24/48 hours.

Comparison 9 Vaginal isosorbide mononitrate (IMN) versus placebo, Outcome 2 Additional induction agents required.

Comparison 9 Vaginal isosorbide mononitrate (IMN) versus placebo, Outcome 3 Maternal satisfaction.
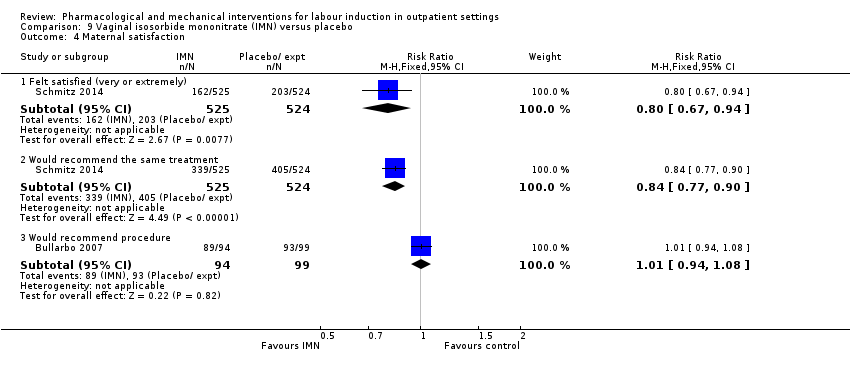
Comparison 9 Vaginal isosorbide mononitrate (IMN) versus placebo, Outcome 4 Maternal satisfaction.
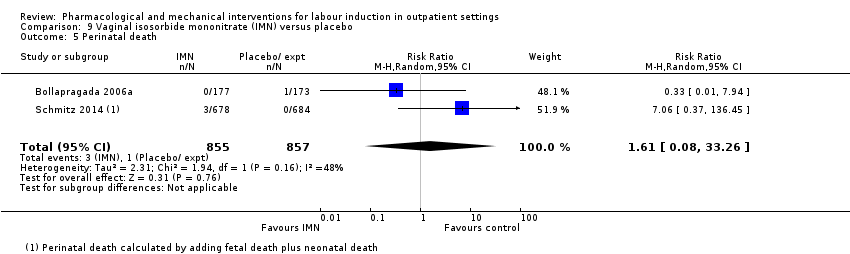
Comparison 9 Vaginal isosorbide mononitrate (IMN) versus placebo, Outcome 5 Perinatal death.
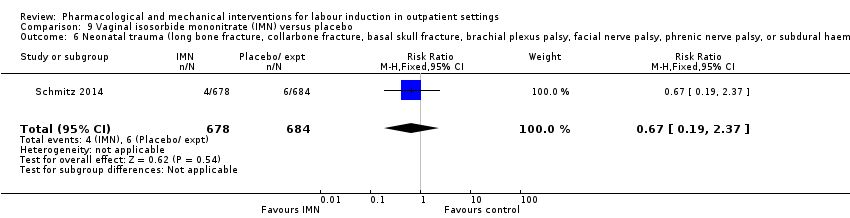
Comparison 9 Vaginal isosorbide mononitrate (IMN) versus placebo, Outcome 6 Neonatal trauma (long bone fracture, collarbone fracture, basal skull fracture, brachial plexus palsy, facial nerve palsy, phrenic nerve palsy, or subdural haemorrhage).
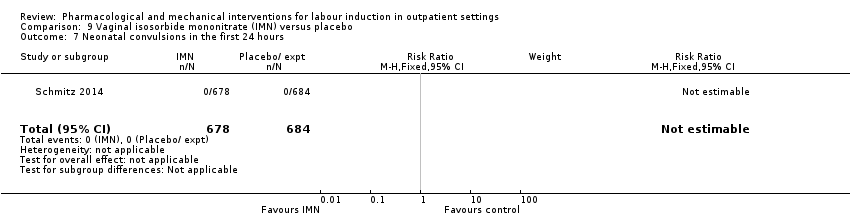
Comparison 9 Vaginal isosorbide mononitrate (IMN) versus placebo, Outcome 7 Neonatal convulsions in the first 24 hours.

Comparison 9 Vaginal isosorbide mononitrate (IMN) versus placebo, Outcome 8 Tracheal ventilation > 24 hours.
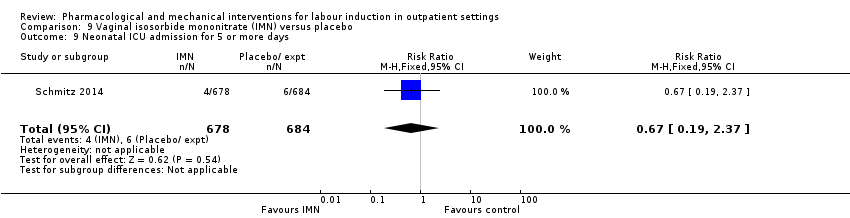
Comparison 9 Vaginal isosorbide mononitrate (IMN) versus placebo, Outcome 9 Neonatal ICU admission for 5 or more days.
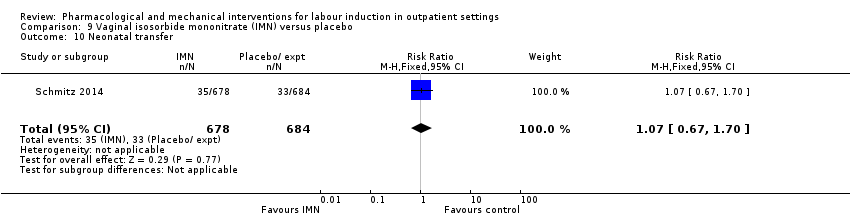
Comparison 9 Vaginal isosorbide mononitrate (IMN) versus placebo, Outcome 10 Neonatal transfer.

Comparison 9 Vaginal isosorbide mononitrate (IMN) versus placebo, Outcome 11 Maternal death.

Comparison 9 Vaginal isosorbide mononitrate (IMN) versus placebo, Outcome 12 Severe postpartum haemorrhage.

Comparison 9 Vaginal isosorbide mononitrate (IMN) versus placebo, Outcome 13 Deep vein thrombosis.

Comparison 9 Vaginal isosorbide mononitrate (IMN) versus placebo, Outcome 14 Oxytocin augmentation.

Comparison 9 Vaginal isosorbide mononitrate (IMN) versus placebo, Outcome 15 Epidural.

Comparison 9 Vaginal isosorbide mononitrate (IMN) versus placebo, Outcome 16 Uterine hyperstimulation (with FHR changes).

Comparison 9 Vaginal isosorbide mononitrate (IMN) versus placebo, Outcome 17 Uterine hyperstimulation (FHR changes unclear).
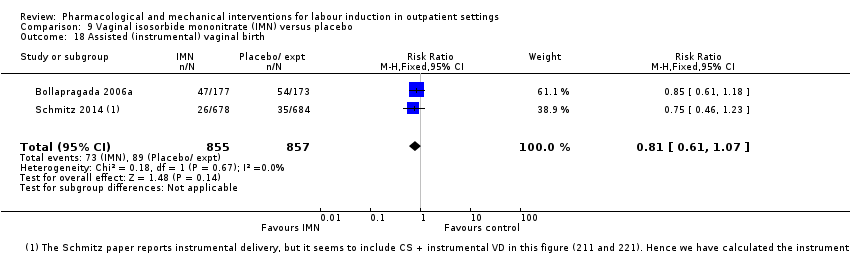
Comparison 9 Vaginal isosorbide mononitrate (IMN) versus placebo, Outcome 18 Assisted (instrumental) vaginal birth.
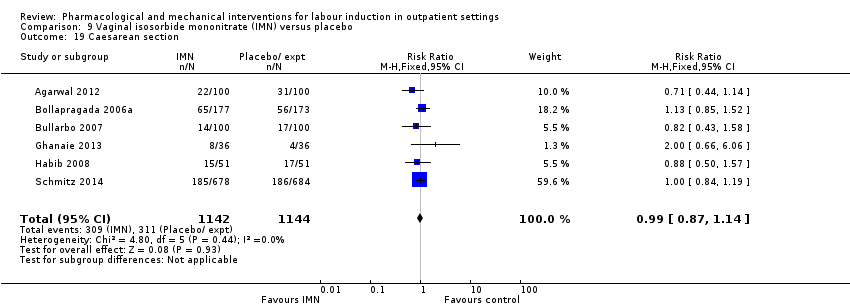
Comparison 9 Vaginal isosorbide mononitrate (IMN) versus placebo, Outcome 19 Caesarean section.
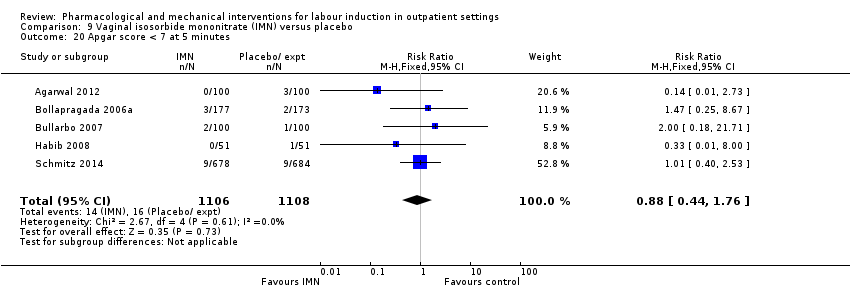
Comparison 9 Vaginal isosorbide mononitrate (IMN) versus placebo, Outcome 20 Apgar score < 7 at 5 minutes.

Comparison 9 Vaginal isosorbide mononitrate (IMN) versus placebo, Outcome 21 NICU (or SCBU) admission.

Comparison 9 Vaginal isosorbide mononitrate (IMN) versus placebo, Outcome 22 Postpartum haemorrhage (> 500 mL).

Comparison 9 Vaginal isosorbide mononitrate (IMN) versus placebo, Outcome 23 Neonatal infection.

Comparison 9 Vaginal isosorbide mononitrate (IMN) versus placebo, Outcome 24 Side effects ‐ Maternal side effect ‐ nausea.

Comparison 9 Vaginal isosorbide mononitrate (IMN) versus placebo, Outcome 25 Side effects ‐ Maternal side effect ‐ headache.

Comparison 9 Vaginal isosorbide mononitrate (IMN) versus placebo, Outcome 26 Side effects ‐ Maternal side effects ‐ severe headache.
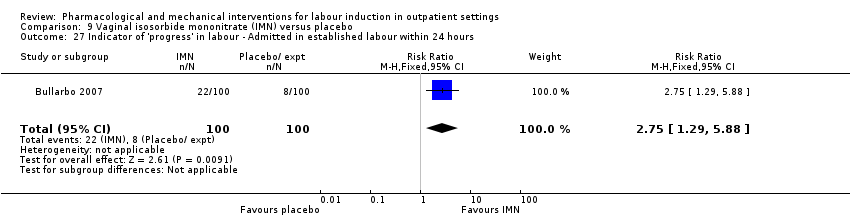
Comparison 9 Vaginal isosorbide mononitrate (IMN) versus placebo, Outcome 27 Indicator of 'progress' in labour ‐ Admitted in established labour within 24 hours.
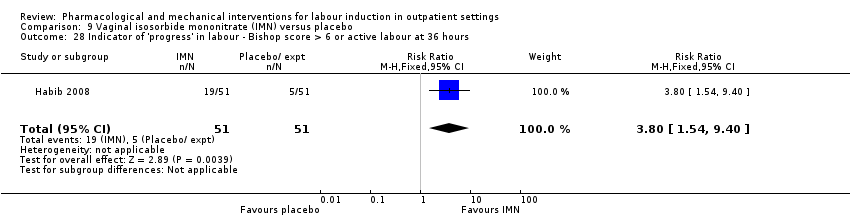
Comparison 9 Vaginal isosorbide mononitrate (IMN) versus placebo, Outcome 28 Indicator of 'progress' in labour ‐ Bishop score > 6 or active labour at 36 hours.

Comparison 9 Vaginal isosorbide mononitrate (IMN) versus placebo, Outcome 29 Time to birth ‐ Time in hours from admission to birth (all women).

Comparison 9 Vaginal isosorbide mononitrate (IMN) versus placebo, Outcome 30 Indicator of 'progress' in labour ‐ Bishop score on admission after treatment.
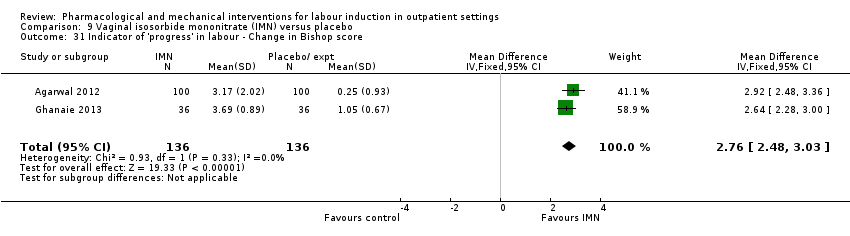
Comparison 9 Vaginal isosorbide mononitrate (IMN) versus placebo, Outcome 31 Indicator of 'progress' in labour ‐ Change in Bishop score.

Comparison 9 Vaginal isosorbide mononitrate (IMN) versus placebo, Outcome 32 Time to birth ‐ Interval from onset of labour to birth (hours).
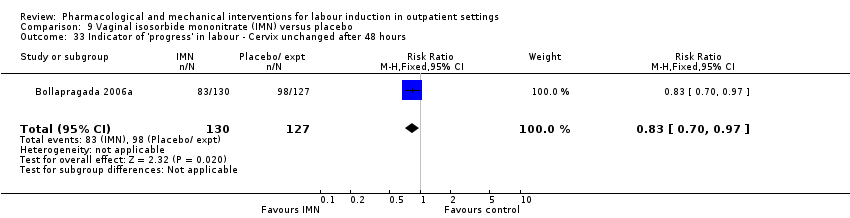
Comparison 9 Vaginal isosorbide mononitrate (IMN) versus placebo, Outcome 33 Indicator of 'progress' in labour ‐ Cervix unchanged after 48 hours.

Comparison 9 Vaginal isosorbide mononitrate (IMN) versus placebo, Outcome 34 Time to birth ‐ Interval from admission to vaginal birth (hours).
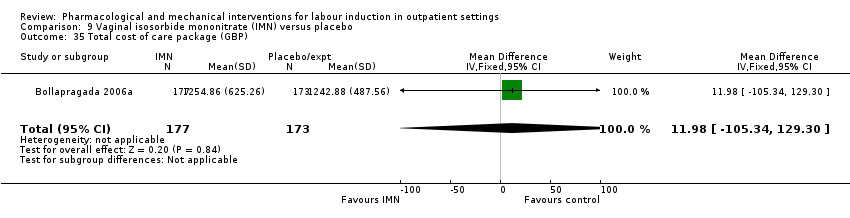
Comparison 9 Vaginal isosorbide mononitrate (IMN) versus placebo, Outcome 35 Total cost of care package (GBP).

Comparison 10 Acupuncture versus routine care, Outcome 1 Additional induction agents required.

Comparison 10 Acupuncture versus routine care, Outcome 2 Caesarean section.

Comparison 11 Outpatient amniotomy for induction versus routine care, Outcome 1 Maternal satisfaction ‐ I look back positively on the treatment I received.
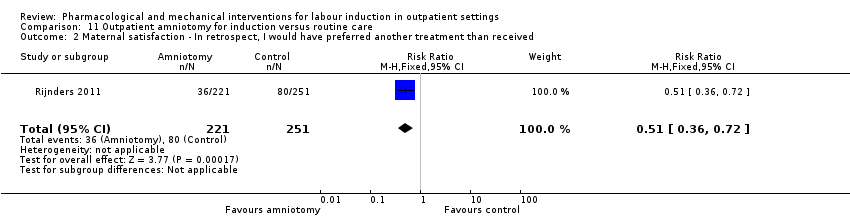
Comparison 11 Outpatient amniotomy for induction versus routine care, Outcome 2 Maternal satisfaction ‐ In retrospect, I would have preferred another treatment than received.

Comparison 11 Outpatient amniotomy for induction versus routine care, Outcome 3 Augmentation, induction or both.

Comparison 11 Outpatient amniotomy for induction versus routine care, Outcome 4 Epidural, opioids or both for pain relief.

Comparison 11 Outpatient amniotomy for induction versus routine care, Outcome 5 Instrumental vaginal birth.
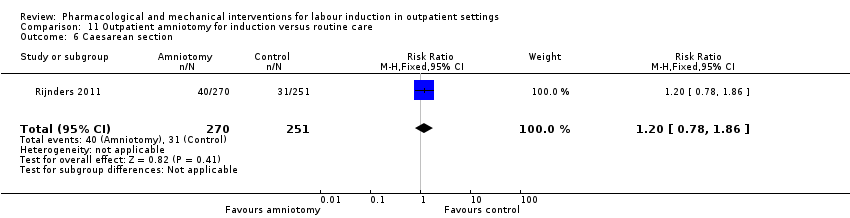
Comparison 11 Outpatient amniotomy for induction versus routine care, Outcome 6 Caesarean section.

Comparison 11 Outpatient amniotomy for induction versus routine care, Outcome 7 Apgar < 7 at 5 minutes.
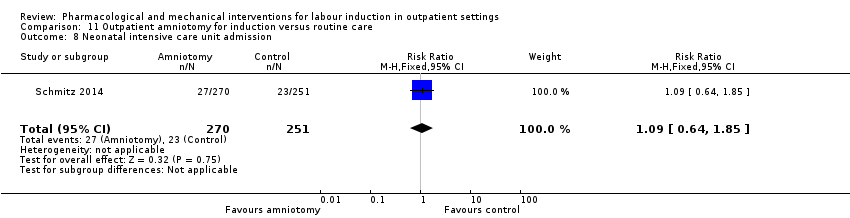
Comparison 11 Outpatient amniotomy for induction versus routine care, Outcome 8 Neonatal intensive care unit admission.
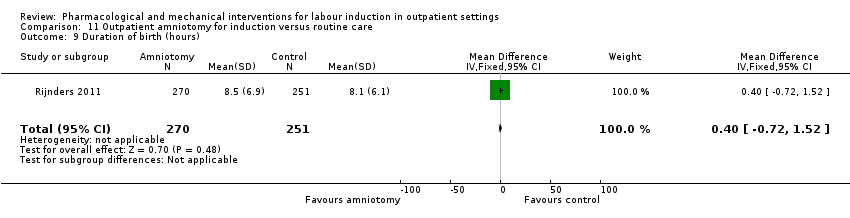
Comparison 11 Outpatient amniotomy for induction versus routine care, Outcome 9 Duration of birth (hours).
| Vaginal PGE₂ compared to placebo or expectant management for the induction of labour in outpatient settings | ||||||
| Patient or population: women requiring term labour induction | ||||||
| Outcomes | Anticipated absolute effects* (95% CI) | Relative effect | № of participants | Quality of the evidence | Comments | |
| Risk with placebo or expectant management | Risk with intravaginal PGE₂ gel | |||||
| Vaginal birth not achieved within 24 h | Study population | ‐ | (0 study) | ‐ | No included trial reported this outcome. | |
| see comment | see comment | |||||
| Vaginal birth not achieved in 48 to 72 h | Study population | ‐ | (0 study) | ‐ | No included trial reported this outcome. | |
| see comment | see comment | |||||
| Uterine hyperstimulation (fetal heart rate changes unclear) | Study population | RR 3.76 | 244 | ⊕⊕⊝⊝ | There were no events in the control group and so it was not possible to calculate the anticipated absolute effects. | |
| see comment | see comment | |||||
| Caesarean section | Study population | RR 0.80 | 288 | ⊕⊕⊝⊝ | ||
| 196 per 1000 | 157 per 1000 | |||||
| Serious neonatal morbidity or death | Study population | ‐ | (0 study) | ‐ | No included trial reported this outcome. | |
| see comment | see comment | |||||
| Serious maternal morbidity or death | Study population | ‐ | (0 studies) | ‐ | No included trial reported this outcome. | |
| see comment | see comment | |||||
| Neonatal intensive care unit admission | Study population | RR 0.32 | 230 | ⊕⊕⊝⊝ | ||
| 93 per 1000 | 30 per 1000 | |||||
| *The risk in the intervention group (and its 95% confidence interval) is based on the assumed risk in the comparison group and the relative effect of the intervention (and its 95% CI). | ||||||
| GRADE Working Group grades of evidence | ||||||
| 1 Wide confidence interval crossing the line of no effect, few events and small sample size (‐2). 2 Wide confidence interval crossing the line of no effect and small sample size (‐2). | ||||||
| Intracervical PGE₂ compared to placebo for the induction of labour in outpatient settings | ||||||
| Patient or population: women requiring induction of labour | ||||||
| Outcomes | Anticipated absolute effects* (95% CI) | Relative effect | № of participants | Quality of the evidence | Comments | |
| Risk with placebo | Risk with intracervical PGE₂ | |||||
| Vaginal birth not achieved within 24 h | Study population | ‐ | (0 study) | ‐ | No included trial reported this outcome. | |
| see comment | see comment | |||||
| Vaginal birth not achieved in 48 to 72 h | Study population | RR 0.83 | 43 | ⊕⊕⊝⊝ | ||
| 1000 per 1000 | 830 per 1000 | |||||
| Uterine hyperstimulation (with fetal heart rate changes) | Study population | RR 2.66 | 488 | ⊕⊕⊝⊝ | ||
| 4 per 1000 | 11 per 1000 | |||||
| Caesarean section | Study population | RR 0.90 | 674 | ⊕⊕⊕⊝ | ||
| 310 per 1000 | 279 per 1000 | |||||
| Serious neonatal morbidity or death | Study population | ‐ | (0 study) | ‐ | ||
| see comment | see comment | |||||
| Serious maternal morbidity or death | Study population | ‐ | (0 study) | ‐ | ||
| see comment | see comment | |||||
| Neonatal intensive care unit admission | Study population | RR 1.61 | 215 | ⊕⊕⊝⊝ | ||
| 28 per 1000 | 44 per 1000 | |||||
| *The risk in the intervention group (and its 95% confidence interval) is based on the assumed risk in the comparison group and the relative effect of the intervention (and its 95% CI). | ||||||
| GRADE Working Group grades of evidence | ||||||
| 1 Wide confidence interval crossing the line of no effect, few events and small sample size (‐2). 2 Wide confidence interval crossing the line of no effect (‐1). | ||||||
| Vaginal misoprostol compared to placebo for the induction of labour in outpatient settings | ||||||
| Patient or population: women requiring induction of labour | ||||||
| Outcomes | Anticipated absolute effects* (95% CI) | Relative effect | № of participants | Quality of the evidence | Comments | |
| Risk with placebo | Risk with vaginal misoprostol | |||||
| Vaginal birth not achieved within 24 h | Study population | ‐ | (0 study) | ‐ | No included trial reported this outcome. | |
| see comment | see comment | |||||
| Vaginal birth not achieved within 48 and 72 h | Study population | ‐ | (0 study) | ‐ | No included trial reported this outcome. | |
| see comment | see comment | |||||
| Uterine hyperstimulation (with fetal heart rate changes) | Study population | RR 1.97 | 265 | ⊕⊕⊝⊝ | ||
| 15 per 1000 | 29 per 1000 | |||||
| Caesarean section | Study population | RR 0.94 | 325 | ⊕⊕⊝⊝ | ||
| 206 per 1000 | 194 per 1000 | |||||
| Serious neonatal morbidity or death | Study population | RR 0.34 | 77 | ⊕⊕⊝⊝ | Study reported perinatal deaths. | |
| 26 per 1000 | 9 per 1000 | |||||
| Serious maternal morbidity or death | Study population | ‐ | (0 study) | ‐ | No included trial reported this outcome. | |
| see comment | see comment | |||||
| Neonatal intensive care unit admission | Study population | RR 0.89 | 325 | ⊕⊕⊝⊝ | ||
| 147 per 1000 | 131 per 1000 | |||||
| *The risk in the intervention group (and its 95% confidence interval) is based on the assumed risk in the comparison group and the relative effect of the intervention (and its 95% CI). | ||||||
| GRADE Working Group grades of evidence | ||||||
| 1 Wide confidence interval crossing the line of no effect, few events and small sample size (‐2). 2 Wide confidence interval crossing the line of no effect and small sample size (‐2). | ||||||
| Uterine hyperstimulation | |
| PGE₂(vaginal) | |
| 1/18 PGE group (FHR status unknown), 0/18 in placebo group | |
| 2/28 PGE group (FHR status unknown), 0/30 in control group (no treatment) | |
| 1/50 PGE group (normal FHR), 0/50 in placebo group | |
| Total | 4/96 PGE, 0/98 in control group |
| PGE₂(intracervical) | |
| 1/23 PGE group (with FHR decelerations), 0/20 in placebo group | |
| 2/43 PGE group, 1/47 placebo group with FHR deceleration in both | |
| 1/30 PGE group (fetal bradycardia), 0/31 placebo group | |
| 1/143 PGE group, 0/151 control (no treatment) with hyperstimulation 11/143 FHR decelerations in PGE group, 12/151 in control | |
| Total | 5/239 PGE, 1/249 control with hyperstimulation |
| Intravaginal misoprostol | |
| 2/27 misoprostol group with FHR deceleration, 2/33 placebo group 1/27 misoprostol with tachysystole without FHR changes, 0/33 placebo group | |
| 3/57 misoprostol with hyperstimulation (FHR unknown), 2/63 placebo group 2/57 misoprostol with hypertonus, 5/57 misoprostol with tachysystole, none control | |
| 1/33 misoprostol (FHR deceleration), 0/35 placebo group | |
| Oral misoprostol | |
| 1/18 misoprostol, 2/22 placebo group (FHR unknown) with hyperstimulation | |
| 8/43 misoprostol, 4/44 placebo group hyperstimulation syndrome (tachysystole or hypertonus, with FHR changes) | |
| Total | 9/61 misoprostol, 6/66 placebo group |
| Mifepristone | |
| 4/41 mifepristone group, 0/42 placebo group with hypertonia (FHR unknown) | |
| 0/16 in both groups | |
| Total | 4/57 mifepristone, 0/58 placebo with hypertonia |
| IMN | |
| 0/51 IMN group, 2/51 placebo group with hyperstimulation (abnormal FHR) 1/51 IMN, 8/51 placebo group with tachysystolia (FHR normal) | |
| 0/100 IMN group, 5/100 placebo group with hyperstimulation (FHR changes unclear) | |
| Total | 1/151 IMN group, 15/151 placebo group (hyperstimulation or tachysystolia, ±FHR changes) |
| IMN: isosorbide mononitrate; FHR: fetal heart rate | |
| Neonatal complications | |
| PGE₂vaginal | |
| 0/24 in PGE₂ group; 2/26 in placebo group to NICU | |
| 2/38 in PGE₂; 4/42 in placebo group to NICU | |
| 1/50 in PGE₂; 5/50 in placebo group to NICU | |
| Total | 3/112 PGE, 11/118 control to NICU |
| PGE₂intracervical | |
| 6/41 PGE group, 8/43 placebo group with complication such as tachypnoea, meconium aspiration, meconium or admission to NICU | |
| 3/35 PGE₂ versus 0/35 control NICU admission | |
| 1/30 PGE, 2/31 placebo group with complication | |
| Total | 10/106 PGE, 10/109 controls with neonatal complications/admitted to NICU |
| Vaginal misoprostol | |
| 1/27 misoprostol, 3/33 placebo group to NICU | |
| 18/57 misoprostol, 20/63 placebo group to NICU | |
| 0/33 misoprostol, 1/35 placebo group to NICU | |
| 1/38 misoprostol, 1/39 control (no treatment) to NICU | |
| 1/43 misoprostol, 1/44 placebo group to NICU | |
| Total | 21/198 misoprostol, 26/214 control to NICU |
| Misoprostol 25 µg versus 50 µg | |
| 1/23 25 µg, 2/26 50 µg misoprostol to NICU | |
| Intracervical PGE₂versus intravaginal misoprostol | |
| 5/42 PGE, 4/42 misoprostol to NICU | |
| Mifepristone | |
| 0/50 mifepristone, 1/30 placebo group to NICU | |
| 5/41 mifepristone, 4/42 control to NICU | |
| Total | 5/91 mifepristone, 5/72 control to NICU |
| IMN | |
| 18/177 IMN, 16/173 placebo group to NICU | |
| 13/100 IMN, 9/100 placebo group to NICU | |
| 0/51 IMN, 1/51 placebo group to NICU | |
| 5/100 IMN, 14/100 placebo group to nursery admission | |
| 0/36 IMN, 0/36 placebo group to NICU | |
| 1/72 IMN, 1/72 placebo group to NICU | |
| Total | 37/536 IMN, 41/532 placebo group to NICU |
| Outpatient amniotomy for induction versus routine care | |
| 27/270 IMN, 23/251 placebo group to NICU | |
| NICU: neonatal intensive‐care unit | |
| Maternal complications | |
| Intracervical PGE₂ | |
| 4/41 PGE, 10/43 placebo group with complication such as endometritis, chorioamnionitis and pre‐eclampsia | |
| 6/43 PGE, 3/47 placebo group with complication such as endometritis and chorioamnionitis | |
| 1/30 PGE with PPH, 0/31 placebo group 2/30 PGE, 2/31 placebo group with infection | |
| 8/143 PGE, 7/151 control (no treatment) with endometritis | |
| Total | 21/257 PGE₂, 22/272 control with maternal complications |
| Oral misoprostol | |
| 8/43 misoprostol group, 9/44 placebo group with chorioamnionitis 1/43 misoprostol group, 2/44 placebo group with endometritis 2/43 misoprostol group, 0/44 placebo group with PPH | |
| Total | 11/43 misoprostol group, 11/44 placebo group with maternal complications |
| IMN | |
| Blood loss > 500 mL: 59/177 IMN, 47/173 placebo group | |
| Blood loss > 1000 mL: 14/100 IMN, 12/100 placebo group | |
| PPH: 2/51 IMN, 3/51 placebo group | |
| 2/100 IMN group, 3/100 placebo group with PPH | |
| 0/36 IMN group, 0/36 placebo group with need for blood transfusion | |
| 0/678 IMN group, 0/684 placebo group for maternal death 124/678 IMN group, 112/684 placebo group for PPH 20/678 IMN group, 13/684 placebo group for severe PPH 1/678 IMN group, 0/684 placebo group for deep vein thrombosis | |
| Total | 202/1142 IMN group, 204/1148 placebo group with maternal complications |
| Outpatient amniotomy | |
| 26/270 amniotomy group, 29/251 routine care group ‐ mother treated with antibiotics | |
| PPH: postpartum haemorrhage | |
| Outcome or subgroup title | No. of studies | No. of participants | Statistical method | Effect size |
| 1 Additional induction agents required Show forest plot | 2 | 150 | Risk Ratio (M‐H, Fixed, 95% CI) | 0.52 [0.27, 0.99] |
| 2 Epidural Show forest plot | 1 | 100 | Risk Ratio (M‐H, Fixed, 95% CI) | 0.83 [0.62, 1.12] |
| 3 Uterine hyperstimulation (FHR changes unclear) Show forest plot | 4 | 244 | Risk Ratio (M‐H, Fixed, 95% CI) | 3.76 [0.64, 22.24] |
| 4 Caesarean section Show forest plot | 4 | 288 | Risk Ratio (M‐H, Fixed, 95% CI) | 0.80 [0.49, 1.31] |
| 5 Apgar score < 7 at 5 minutes Show forest plot | 2 | 180 | Risk Ratio (M‐H, Fixed, 95% CI) | 0.45 [0.07, 2.93] |
| 6 NICU admission Show forest plot | 3 | 230 | Risk Ratio (M‐H, Fixed, 95% CI) | 0.32 [0.10, 1.03] |
| 7 Chorioamnionitis Show forest plot | 2 | 180 | Risk Ratio (M‐H, Fixed, 95% CI) | 0.37 [0.15, 0.90] |
| 8 Indicator of 'progress' in labour ‐ Cervix unchanged at follow up (not pre‐specified) Show forest plot | 1 | 36 | Risk Ratio (M‐H, Fixed, 95% CI) | 0.13 [0.03, 0.47] |
| 9 'Spontaneous labour' within 48 hours Show forest plot | 1 | 58 | Risk Ratio (M‐H, Fixed, 95% CI) | 6.43 [2.12, 19.48] |
| 10 Indicator of 'progress' in labour ‐ Admitted to hospital for labour Show forest plot | 1 | 100 | Risk Ratio (M‐H, Fixed, 95% CI) | 2.7 [1.47, 4.97] |
| 11 Time to birth ‐ Gestational age at birth (weeks) Show forest plot | 1 | 100 | Mean Difference (IV, Fixed, 95% CI) | ‐0.60 [‐0.99, ‐0.21] |
| 12 Time to birth ‐ Gestational age on admission (days) Show forest plot | 1 | 80 | Mean Difference (IV, Fixed, 95% CI) | ‐2.0 [‐4.17, 0.17] |
| Outcome or subgroup title | No. of studies | No. of participants | Statistical method | Effect size |
| 1 Additional induction agent required (induction with oxytocin or other means) Show forest plot | 3 | 445 | Risk Ratio (M‐H, Fixed, 95% CI) | 0.98 [0.74, 1.32] |
| 2 Additional induction agents required (further prostaglandin required) Show forest plot | 1 | 90 | Risk Ratio (M‐H, Fixed, 95% CI) | 0.61 [0.22, 1.67] |
| 3 Uterine rupture Show forest plot | 1 | 294 | Risk Ratio (M‐H, Fixed, 95% CI) | 0.0 [0.0, 0.0] |
| 4 Birth not achieved in 48 to 72 hours Show forest plot | 1 | 43 | Risk Ratio (M‐H, Fixed, 95% CI) | 0.83 [0.68, 1.02] |
| 5 Oxytocin augmentation Show forest plot | 1 | 84 | Risk Ratio (M‐H, Fixed, 95% CI) | 0.67 [0.40, 1.12] |
| 6 Uterine hyperstimulation (with FHR changes) Show forest plot | 4 | 488 | Risk Ratio (M‐H, Fixed, 95% CI) | 2.66 [0.63, 11.25] |
| 7 Assisted (instrumental) vaginal birth Show forest plot | 4 | 538 | Risk Ratio (M‐H, Fixed, 95% CI) | 1.29 [0.85, 1.96] |
| 8 Caesarean section Show forest plot | 7 | 674 | Risk Ratio (M‐H, Fixed, 95% CI) | 0.90 [0.72, 1.12] |
| 9 Apgar score < 7 at 5 minutes Show forest plot | 4 | 515 | Risk Ratio (M‐H, Fixed, 95% CI) | 0.82 [0.42, 1.60] |
| 10 NICU admission Show forest plot | 3 | 215 | Risk Ratio (M‐H, Fixed, 95% CI) | 1.61 [0.43, 6.05] |
| 11 Postpartum haemorrhage (> 500 mL) Show forest plot | 1 | 61 | Risk Ratio (M‐H, Fixed, 95% CI) | 3.10 [0.13, 73.16] |
| 12 Chorioamnionitis Show forest plot | 3 | 468 | Risk Ratio (M‐H, Fixed, 95% CI) | 2.03 [0.66, 6.18] |
| 13 Endometritis Show forest plot | 2 | 174 | Risk Ratio (M‐H, Fixed, 95% CI) | 1.60 [0.27, 9.37] |
| 14 Side effects ‐ Maternal side effects Show forest plot | 2 | 384 | Risk Ratio (M‐H, Fixed, 95% CI) | 0.59 [0.13, 2.77] |
| 15 Time to birth ‐ Interval from intervention to birth (days) Show forest plot | 2 | 133 | Std. Mean Difference (IV, Fixed, 95% CI) | ‐0.20 [‐0.55, 0.14] |
| 16 Time to birth ‐ Gestational age at birth (weeks) Show forest plot | 2 | 156 | Mean Difference (IV, Random, 95% CI) | ‐0.06 [‐0.35, 0.23] |
| 17 Indicator of 'progress' in labour ‐ Induction for gestational age > 42 weeks Show forest plot | 2 | Risk Ratio (M‐H, Fixed, 95% CI) | Totals not selected | |
| 18 Time to birth ‐ Birth within 48 hours of treatment (all births) Show forest plot | 1 | 61 | Risk Ratio (M‐H, Fixed, 95% CI) | 3.1 [1.29, 7.47] |
| Outcome or subgroup title | No. of studies | No. of participants | Statistical method | Effect size |
| 1 Serious neonatal morbidity or death Show forest plot | 1 | 77 | Risk Ratio (M‐H, Fixed, 95% CI) | 0.34 [0.01, 8.14] |
| 2 Epidural Show forest plot | 1 | 50 | Risk Ratio (M‐H, Fixed, 95% CI) | 0.98 [0.77, 1.26] |
| 3 Uterine hyperstimulation (with FHR changes) Show forest plot | 3 | 265 | Risk Ratio (M‐H, Fixed, 95% CI) | 1.97 [0.43, 9.00] |
| 4 Uterine hyperstimulation (without FHR changes) Show forest plot | 2 | 137 | Risk Ratio (M‐H, Fixed, 95% CI) | 3.64 [0.15, 85.97] |
| 5 Assisted (instrumental) vaginal birth Show forest plot | 2 | 145 | Risk Ratio (M‐H, Fixed, 95% CI) | 0.91 [0.50, 1.67] |
| 6 Caesarean section Show forest plot | 4 | 325 | Risk Ratio (M‐H, Fixed, 95% CI) | 0.94 [0.61, 1.46] |
| 7 Apgar score < 7 at 5 minutes Show forest plot | 3 | 248 | Risk Ratio (M‐H, Fixed, 95% CI) | 0.21 [0.01, 4.25] |
| 8 NICU admission Show forest plot | 4 | 325 | Risk Ratio (M‐H, Fixed, 95% CI) | 0.89 [0.54, 1.47] |
| 9 Perinatal death Show forest plot | 1 | 77 | Risk Ratio (M‐H, Fixed, 95% CI) | 0.34 [0.01, 8.14] |
| 10 Neonatal infection Show forest plot | 1 | 68 | Risk Ratio (M‐H, Fixed, 95% CI) | 0.30 [0.07, 1.36] |
| 11 Indicator of 'progress' in labour ‐ Oxytocin dose used (mU) Show forest plot | 1 | 72 | Mean Difference (IV, Fixed, 95% CI) | 1508.70 [‐2357.55, 5374.95] |
| 12 Indicator of 'progress' in labour ‐ Number of medication dose Show forest plot | 1 | 60 | Mean Difference (IV, Fixed, 95% CI) | ‐0.44 [‐0.49, ‐0.39] |
| 13 Indicator of 'progress' in labour ‐ Number of women requiring dosing on day 2 Show forest plot | 1 | 60 | Risk Ratio (M‐H, Fixed, 95% CI) | 0.61 [0.43, 0.87] |
| 14 Indicator of 'progress' in labour ‐ Number of women requiring induction on day 3 Show forest plot | 1 | 60 | Risk Ratio (M‐H, Fixed, 95% CI) | 0.13 [0.04, 0.38] |
| 15 Indicator of 'progress' in labour ‐ Days to admission (all) (days) Show forest plot | 1 | 77 | Mean Difference (IV, Fixed, 95% CI) | ‐2.90 [‐4.99, ‐0.81] |
| 16 Indicator of 'progress' in labour ‐ Days to admission (subgroups by parity) (days) Show forest plot | 1 | 77 | Mean Difference (IV, Fixed, 95% CI) | ‐3.15 [‐5.40, ‐0.89] |
| 16.1 Nulliparous women | 1 | 41 | Mean Difference (IV, Fixed, 95% CI) | ‐3.20 [‐6.44, 0.04] |
| 16.2 Parous women | 1 | 36 | Mean Difference (IV, Fixed, 95% CI) | ‐3.10 [‐6.24, 0.04] |
| 17 Indicator of 'progress' in labour ‐ Gestational age at labour (weeks) Show forest plot | 1 | 77 | Mean Difference (IV, Fixed, 95% CI) | ‐0.80 [‐1.05, ‐0.55] |
| 18 Indicator of 'progress' in labour ‐ Days to admission (parous) (weeks) Show forest plot | 1 | 36 | Mean Difference (IV, Fixed, 95% CI) | ‐3.10 [‐6.24, 0.04] |
| 19 Indicator of 'progress' in labour ‐ Days to PROM (days) Show forest plot | 1 | 77 | Mean Difference (IV, Fixed, 95% CI) | ‐2.5 [‐4.14, ‐0.86] |
| 20 Time to birth ‐ Interval from intervention to vaginal birth (days) Show forest plot | 1 | 50 | Mean Difference (IV, Fixed, 95% CI) | ‐1.4 [‐3.51, 0.71] |
| 21 Time to birth ‐ Days to birth (all) (days) Show forest plot | 1 | 68 | Mean Difference (IV, Fixed, 95% CI) | ‐1.90 [‐3.74, ‐0.06] |
| 22 Time to birth ‐ Days to birth (subgroups by parity) (days) Show forest plot | 1 | Mean Difference (IV, Fixed, 95% CI) | Subtotals only | |
| 22.1 Nulliparous women | 1 | 39 | Mean Difference (IV, Fixed, 95% CI) | ‐3.0 [‐5.42, ‐0.58] |
| 22.2 Parous women | 1 | 29 | Mean Difference (IV, Fixed, 95% CI) | ‐0.60 [‐3.51, 2.31] |
| Outcome or subgroup title | No. of studies | No. of participants | Statistical method | Effect size |
| 1 Additional induction agents required (oxytocin) Show forest plot | 1 | 49 | Risk Ratio (M‐H, Fixed, 95% CI) | 2.26 [0.22, 23.33] |
| 2 Uterine hyperstimulation Show forest plot | 1 | 49 | Risk Ratio (M‐H, Fixed, 95% CI) | 0.0 [0.0, 0.0] |
| 3 Caesarean section Show forest plot | 1 | 49 | Risk Ratio (M‐H, Fixed, 95% CI) | 0.94 [0.33, 2.68] |
| 4 NICU admission Show forest plot | 1 | 49 | Risk Ratio (M‐H, Fixed, 95% CI) | 0.57 [0.05, 5.83] |
| 5 Interval from treatment to birth (in days, all births) Show forest plot | 1 | 49 | Mean Difference (IV, Fixed, 95% CI) | 1.5 [1.19, 1.81] |
| Outcome or subgroup title | No. of studies | No. of participants | Statistical method | Effect size |
| 1 Uterine hyperstimulation (with or without FHR changes) Show forest plot | 1 | 64 | Risk Ratio (M‐H, Fixed, 95% CI) | 0.26 [0.03, 2.73] |
| 2 Caesarean section Show forest plot | 1 | 84 | Risk Ratio (M‐H, Fixed, 95% CI) | 0.89 [0.38, 2.08] |
| 3 Apgar score < 7 after 5 minutes Show forest plot | 1 | 84 | Risk Ratio (M‐H, Fixed, 95% CI) | 0.33 [0.01, 7.96] |
| 4 Admission to NICU Show forest plot | 1 | 84 | Risk Ratio (M‐H, Fixed, 95% CI) | 1.25 [0.36, 4.33] |
| 5 Indicator of 'progress' in labour ‐ Interval from administration to admission (hours) Show forest plot | 1 | 75 | Mean Difference (IV, Fixed, 95% CI) | 2.5 [2.22, 2.78] |
| 6 Indicator of 'progress' in labour ‐ Labour or SROM during ripening Show forest plot | 1 | 83 | Risk Ratio (M‐H, Fixed, 95% CI) | 0.31 [0.14, 0.69] |
| 7 Time to birth ‐ Birth within 24 hours Show forest plot | 1 | 83 | Risk Ratio (M‐H, Fixed, 95% CI) | 0.90 [0.75, 1.07] |
| 8 Time to birth ‐ Birth within 48 hours (cumulative) Show forest plot | 1 | 83 | Risk Ratio (M‐H, Fixed, 95% CI) | 0.93 [0.81, 1.06] |
| Outcome or subgroup title | No. of studies | No. of participants | Statistical method | Effect size |
| 1 Vaginal delivery not achieved within 24 hours Show forest plot | 1 | 87 | Risk Ratio (M‐H, Fixed, 95% CI) | 0.65 [0.48, 0.86] |
| 2 Additional induction agents required Show forest plot | 2 | 127 | Risk Ratio (M‐H, Fixed, 95% CI) | 0.60 [0.37, 0.97] |
| 3 Oxytocin augmentation Show forest plot | 1 | 87 | Risk Ratio (M‐H, Fixed, 95% CI) | 0.81 [0.61, 1.08] |
| 4 Uterine hyperstimulation (with FHR changes) Show forest plot | 1 | 87 | Risk Ratio (M‐H, Fixed, 95% CI) | 1.53 [0.47, 5.06] |
| 5 Uterine hyperstimulation (FHR changes unclear) Show forest plot | 1 | 40 | Risk Ratio (M‐H, Fixed, 95% CI) | 0.61 [0.06, 6.21] |
| 6 Instrumental vaginal birth Show forest plot | 1 | 87 | Risk Ratio (M‐H, Fixed, 95% CI) | 0.51 [0.17, 1.57] |
| 7 Caesarean section Show forest plot | 1 | 86 | Risk Ratio (M‐H, Fixed, 95% CI) | 0.62 [0.28, 1.33] |
| 8 Apgar score < 7 at 5 minutes Show forest plot | 1 | 87 | Risk Ratio (M‐H, Fixed, 95% CI) | 0.0 [0.0, 0.0] |
| 9 Neonatal intensive care unit admission Show forest plot | 1 | 87 | Risk Ratio (M‐H, Fixed, 95% CI) | 1.02 [0.07, 15.84] |
| 10 Postpartum haemorrhage Show forest plot | 1 | 87 | Risk Ratio (M‐H, Fixed, 95% CI) | 5.11 [0.25, 103.51] |
| 11 Chorioamnionitis Show forest plot | 2 | 124 | Risk Ratio (M‐H, Fixed, 95% CI) | 1.06 [0.52, 2.17] |
| 12 Endometritis Show forest plot | 1 | 87 | Risk Ratio (M‐H, Fixed, 95% CI) | 0.51 [0.05, 5.44] |
| 13 Indicator of 'progress' in labour ‐ Time from first dose to active labor (hours) Show forest plot | 2 | 127 | Mean Difference (IV, Fixed, 95% CI) | ‐37.08 [‐52.44, ‐21.72] |
| 14 Time to birth ‐ First dose to birth (hours) Show forest plot | 1 | 87 | Mean Difference (IV, Fixed, 95% CI) | ‐37.94 [‐57.97, ‐17.91] |
| 15 Indicator of 'progress' in labour ‐ Total doses of medication Show forest plot | 1 | 40 | Mean Difference (IV, Fixed, 95% CI) | ‐0.51 [‐0.92, ‐0.10] |
| Outcome or subgroup title | No. of studies | No. of participants | Statistical method | Effect size |
| 1 Additional induction agents required Show forest plot | 4 | 311 | Risk Ratio (M‐H, Random, 95% CI) | 0.59 [0.37, 0.95] |
| 2 Serious neonatal morbidity or death Show forest plot | 1 | 36 | Risk Ratio (M‐H, Fixed, 95% CI) | 1.56 [0.07, 35.67] |
| 3 Oxytocin augmentation Show forest plot | 2 | 116 | Risk Ratio (M‐H, Fixed, 95% CI) | 0.89 [0.63, 1.26] |
| 4 Epidural Show forest plot | 1 | 112 | Risk Ratio (M‐H, Fixed, 95% CI) | 0.87 [0.73, 1.03] |
| 5 Assisted (instrumental) vaginal birth Show forest plot | 5 | 343 | Risk Ratio (M‐H, Fixed, 95% CI) | 1.35 [0.93, 1.97] |
| 6 Caesarean section Show forest plot | 5 | 343 | Risk Ratio (M‐H, Fixed, 95% CI) | 0.88 [0.62, 1.25] |
| 7 Apgar score < 7 at 5 minutes Show forest plot | 2 | 119 | Risk Ratio (M‐H, Fixed, 95% CI) | 1.56 [0.07, 35.67] |
| 8 NICU admission Show forest plot | 2 | 163 | Risk Ratio (M‐H, Fixed, 95% CI) | 0.93 [0.31, 2.79] |
| 9 Perinatal death Show forest plot | 1 | 32 | Risk Ratio (M‐H, Fixed, 95% CI) | 0.0 [0.0, 0.0] |
| 10 Uterine scar separation Show forest plot | 1 | 32 | Risk Ratio (M‐H, Fixed, 95% CI) | 1.0 [0.07, 14.64] |
| 11 Chorioamnionitis Show forest plot | 1 | 32 | Risk Ratio (M‐H, Fixed, 95% CI) | 2.0 [0.20, 19.91] |
| 12 Indicator of 'progress' in labour ‐ Labour or ripe cervix in 48 hours Show forest plot | 1 | 36 | Risk Ratio (M‐H, Fixed, 95% CI) | 2.0 [1.00, 4.00] |
| 13 Indicator of 'progress' in labour ‐ Cervix unchanged after 24/48 hours Show forest plot | 2 | 119 | Risk Ratio (M‐H, Fixed, 95% CI) | 0.36 [0.20, 0.63] |
| 14 Indicator of 'progress' in labour ‐ Spontaneous labour within 72 hours Show forest plot | 1 | 80 | Risk Ratio (M‐H, Fixed, 95% CI) | 1.46 [0.68, 3.10] |
| 15 Indicator of 'progress' in labour ‐ Spontaneous labour within 48 hours Show forest plot | 1 | 83 | Risk Ratio (M‐H, Fixed, 95% CI) | 2.05 [1.27, 3.30] |
| 16 Indicator of 'progress' in labour ‐ Oxytocin requirements (IU) Show forest plot | 1 | 32 | Mean Difference (IV, Fixed, 95% CI) | ‐2.56 [‐4.01, ‐1.11] |
| 17 Indicator of 'progress' in labour ‐ Interval between day 1 and start of labour (hours) Show forest plot | 1 | 32 | Mean Difference (IV, Fixed, 95% CI) | ‐22.15 [‐35.96, ‐8.34] |
| Outcome or subgroup title | No. of studies | No. of participants | Statistical method | Effect size |
| 1 Oxytocin augmentation Show forest plot | 1 | 87 | Risk Ratio (M‐H, Fixed, 95% CI) | 0.93 [0.61, 1.43] |
| 2 Assisted (instrumental) vaginal birth Show forest plot | 1 | 87 | Risk Ratio (M‐H, Fixed, 95% CI) | 0.84 [0.44, 1.60] |
| 3 Caesarean section Show forest plot | 1 | 87 | Risk Ratio (M‐H, Fixed, 95% CI) | 1.27 [0.63, 2.58] |
| 4 NICU admission Show forest plot | 1 | 87 | Risk Ratio (M‐H, Fixed, 95% CI) | 0.98 [0.06, 15.13] |
| 5 Chorioamnionitis Show forest plot | 1 | 87 | Risk Ratio (M‐H, Fixed, 95% CI) | 1.95 [0.38, 10.12] |
| 6 Endometritis Show forest plot | 1 | 87 | Risk Ratio (M‐H, Fixed, 95% CI) | 2.93 [0.32, 27.10] |
| Outcome or subgroup title | No. of studies | No. of participants | Statistical method | Effect size |
| 1 Vaginal birth not achieved in 24/48 hours Show forest plot | 1 | 238 | Risk Ratio (M‐H, Fixed, 95% CI) | 0.97 [0.83, 1.15] |
| 2 Additional induction agents required Show forest plot | 4 | 1921 | Risk Ratio (M‐H, Random, 95% CI) | 0.87 [0.75, 1.00] |
| 3 Maternal satisfaction Show forest plot | 1 | Mean Difference (IV, Fixed, 95% CI) | Subtotals only | |
| 3.1 How do you think your labour went? (easy/very difficult) | 1 | 227 | Mean Difference (IV, Fixed, 95% CI) | ‐0.34 [‐0.94, 0.26] |
| 3.2 What do you think about home treatment? (extremely good/not at all good) | 1 | 227 | Mean Difference (IV, Fixed, 95% CI) | 0.61 [0.03, 1.19] |
| 3.3 How painful was the treatment at home? (not at all/very) | 1 | 227 | Mean Difference (IV, Fixed, 95% CI) | 0.58 [‐0.00, 1.16] |
| 3.4 How anxious were you being at home taking the treatment? (not at all/very) | 1 | 227 | Mean Difference (IV, Fixed, 95% CI) | 0.11 [‐0.39, 0.61] |
| 3.5 Would you have the same treatment at home again? (definitely/definitely not) | 1 | 227 | Mean Difference (IV, Fixed, 95% CI) | 0.62 [‐0.02, 1.26] |
| 3.6 Would you advise a friend to have the same treatment at home? (definitely/definitely not) | 1 | 227 | Mean Difference (IV, Fixed, 95% CI) | 0.41 [‐0.17, 0.99] |
| 4 Maternal satisfaction Show forest plot | 2 | Risk Ratio (M‐H, Fixed, 95% CI) | Subtotals only | |
| 4.1 Felt satisfied (very or extremely) | 1 | 1049 | Risk Ratio (M‐H, Fixed, 95% CI) | 0.80 [0.67, 0.94] |
| 4.2 Would recommend the same treatment | 1 | 1049 | Risk Ratio (M‐H, Fixed, 95% CI) | 0.84 [0.77, 0.90] |
| 4.3 Would recommend procedure | 1 | 193 | Risk Ratio (M‐H, Fixed, 95% CI) | 1.01 [0.94, 1.08] |
| 5 Perinatal death Show forest plot | 2 | 1712 | Risk Ratio (M‐H, Random, 95% CI) | 1.61 [0.08, 33.26] |
| 6 Neonatal trauma (long bone fracture, collarbone fracture, basal skull fracture, brachial plexus palsy, facial nerve palsy, phrenic nerve palsy, or subdural haemorrhage) Show forest plot | 1 | 1362 | Risk Ratio (M‐H, Fixed, 95% CI) | 0.67 [0.19, 2.37] |
| 7 Neonatal convulsions in the first 24 hours Show forest plot | 1 | 1362 | Risk Ratio (M‐H, Fixed, 95% CI) | 0.0 [0.0, 0.0] |
| 8 Tracheal ventilation > 24 hours Show forest plot | 1 | 1362 | Risk Ratio (M‐H, Fixed, 95% CI) | 1.01 [0.14, 7.14] |
| 9 Neonatal ICU admission for 5 or more days Show forest plot | 1 | 1362 | Risk Ratio (M‐H, Fixed, 95% CI) | 0.67 [0.19, 2.37] |
| 10 Neonatal transfer Show forest plot | 1 | 1362 | Risk Ratio (M‐H, Fixed, 95% CI) | 1.07 [0.67, 1.70] |
| 11 Maternal death Show forest plot | 1 | 1362 | Risk Ratio (M‐H, Fixed, 95% CI) | 0.0 [0.0, 0.0] |
| 12 Severe postpartum haemorrhage Show forest plot | 1 | 1362 | Risk Ratio (M‐H, Fixed, 95% CI) | 1.55 [0.78, 3.09] |
| 13 Deep vein thrombosis Show forest plot | 1 | 1362 | Risk Ratio (M‐H, Fixed, 95% CI) | 3.03 [0.12, 74.16] |
| 14 Oxytocin augmentation Show forest plot | 3 | 1816 | Risk Ratio (M‐H, Random, 95% CI) | 0.95 [0.78, 1.14] |
| 15 Epidural Show forest plot | 1 | 350 | Risk Ratio (M‐H, Fixed, 95% CI) | 0.94 [0.82, 1.09] |
| 16 Uterine hyperstimulation (with FHR changes) Show forest plot | 1 | 102 | Risk Ratio (M‐H, Fixed, 95% CI) | 0.2 [0.01, 4.07] |
| 17 Uterine hyperstimulation (FHR changes unclear) Show forest plot | 1 | 200 | Risk Ratio (M‐H, Fixed, 95% CI) | 0.09 [0.01, 1.62] |
| 18 Assisted (instrumental) vaginal birth Show forest plot | 2 | 1712 | Risk Ratio (M‐H, Fixed, 95% CI) | 0.81 [0.61, 1.07] |
| 19 Caesarean section Show forest plot | 6 | 2286 | Risk Ratio (M‐H, Fixed, 95% CI) | 0.99 [0.87, 1.14] |
| 20 Apgar score < 7 at 5 minutes Show forest plot | 5 | 2214 | Risk Ratio (M‐H, Fixed, 95% CI) | 0.88 [0.44, 1.76] |
| 21 NICU (or SCBU) admission Show forest plot | 6 | 1068 | Risk Ratio (M‐H, Fixed, 95% CI) | 0.89 [0.59, 1.36] |
| 22 Postpartum haemorrhage (> 500 mL) Show forest plot | 5 | 2214 | Risk Ratio (M‐H, Fixed, 95% CI) | 1.13 [0.95, 1.36] |
| 23 Neonatal infection Show forest plot | 1 | 200 | Risk Ratio (M‐H, Fixed, 95% CI) | 1.0 [0.26, 3.89] |
| 24 Side effects ‐ Maternal side effect ‐ nausea Show forest plot | 4 | 1926 | Risk Ratio (M‐H, Random, 95% CI) | 2.39 [1.54, 3.70] |
| 25 Side effects ‐ Maternal side effect ‐ headache Show forest plot | 7 | 2300 | Risk Ratio (M‐H, Random, 95% CI) | 5.45 [3.38, 8.81] |
| 26 Side effects ‐ Maternal side effects ‐ severe headache Show forest plot | 1 | 220 | Risk Ratio (M‐H, Fixed, 95% CI) | 21.21 [2.91, 154.65] |
| 27 Indicator of 'progress' in labour ‐ Admitted in established labour within 24 hours Show forest plot | 1 | 200 | Risk Ratio (M‐H, Fixed, 95% CI) | 2.75 [1.29, 5.88] |
| 28 Indicator of 'progress' in labour ‐ Bishop score > 6 or active labour at 36 hours Show forest plot | 1 | 102 | Risk Ratio (M‐H, Fixed, 95% CI) | 3.8 [1.54, 9.40] |
| 29 Time to birth ‐ Time in hours from admission to birth (all women) Show forest plot | 3 | 374 | Mean Difference (IV, Random, 95% CI) | ‐4.70 [‐6.08, ‐3.31] |
| 30 Indicator of 'progress' in labour ‐ Bishop score on admission after treatment Show forest plot | 1 | 200 | Mean Difference (IV, Fixed, 95% CI) | 2.73 [2.17, 3.29] |
| 31 Indicator of 'progress' in labour ‐ Change in Bishop score Show forest plot | 2 | 272 | Mean Difference (IV, Fixed, 95% CI) | 2.76 [2.48, 3.03] |
| 32 Time to birth ‐ Interval from onset of labour to birth (hours) Show forest plot | 1 | 200 | Mean Difference (IV, Fixed, 95% CI) | ‐1.24 [‐1.82, ‐0.66] |
| 33 Indicator of 'progress' in labour ‐ Cervix unchanged after 48 hours Show forest plot | 1 | 257 | Risk Ratio (M‐H, Fixed, 95% CI) | 0.83 [0.70, 0.97] |
| 34 Time to birth ‐ Interval from admission to vaginal birth (hours) Show forest plot | 1 | 128 | Mean Difference (IV, Fixed, 95% CI) | ‐0.70 [‐6.11, 4.71] |
| 35 Total cost of care package (GBP) Show forest plot | 1 | 350 | Mean Difference (IV, Fixed, 95% CI) | 11.98 [‐105.34, 129.30] |
| Outcome or subgroup title | No. of studies | No. of participants | Statistical method | Effect size |
| 1 Additional induction agents required Show forest plot | 1 | 56 | Risk Ratio (M‐H, Fixed, 95% CI) | 0.6 [0.31, 1.17] |
| 2 Caesarean section Show forest plot | 1 | 56 | Risk Ratio (M‐H, Fixed, 95% CI) | 0.43 [0.17, 1.11] |
| Outcome or subgroup title | No. of studies | No. of participants | Statistical method | Effect size |
| 1 Maternal satisfaction ‐ I look back positively on the treatment I received Show forest plot | 1 | 404 | Risk Ratio (M‐H, Fixed, 95% CI) | 1.04 [0.97, 1.10] |
| 2 Maternal satisfaction ‐ In retrospect, I would have preferred another treatment than received Show forest plot | 1 | 472 | Risk Ratio (M‐H, Fixed, 95% CI) | 0.51 [0.36, 0.72] |
| 3 Augmentation, induction or both Show forest plot | 1 | 521 | Risk Ratio (M‐H, Fixed, 95% CI) | 0.83 [0.71, 0.97] |
| 4 Epidural, opioids or both for pain relief Show forest plot | 1 | 521 | Risk Ratio (M‐H, Fixed, 95% CI) | 0.99 [0.76, 1.30] |
| 5 Instrumental vaginal birth Show forest plot | 1 | 521 | Risk Ratio (M‐H, Fixed, 95% CI) | 0.70 [0.46, 1.08] |
| 6 Caesarean section Show forest plot | 1 | 521 | Risk Ratio (M‐H, Fixed, 95% CI) | 1.20 [0.78, 1.86] |
| 7 Apgar < 7 at 5 minutes Show forest plot | 1 | 521 | Risk Ratio (M‐H, Fixed, 95% CI) | 1.86 [0.34, 10.06] |
| 8 Neonatal intensive care unit admission Show forest plot | 1 | 521 | Risk Ratio (M‐H, Fixed, 95% CI) | 1.09 [0.64, 1.85] |
| 9 Duration of birth (hours) Show forest plot | 1 | 521 | Mean Difference (IV, Fixed, 95% CI) | 0.40 [‐0.72, 1.52] |