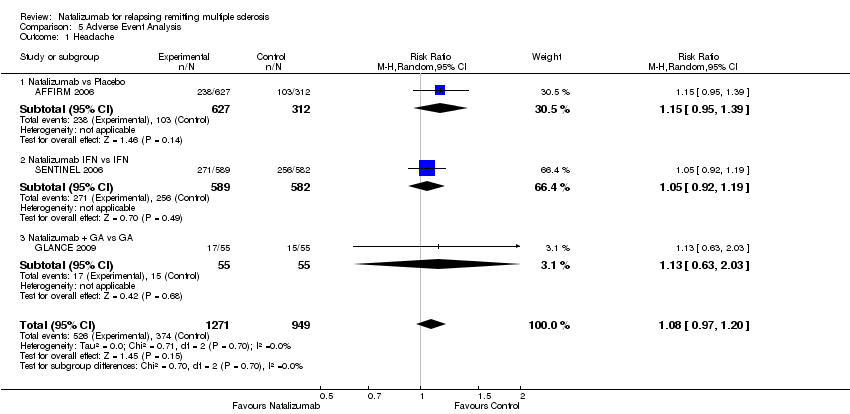
| 1 Headache Show forest plot | 3 | 2220 | Risk Ratio (M‐H, Random, 95% CI) | 1.08 [0.97, 1.20] |
|
| 1.1 Natalizumab vs Placebo | 1 | 939 | Risk Ratio (M‐H, Random, 95% CI) | 1.15 [0.95, 1.39] |
| 1.2 Natalizumab IFN vs IFN | 1 | 1171 | Risk Ratio (M‐H, Random, 95% CI) | 1.05 [0.92, 1.19] |
| 1.3 Natalizumab + GA vs GA | 1 | 110 | Risk Ratio (M‐H, Random, 95% CI) | 1.13 [0.63, 2.03] |
| 2 Pain in arms or legs ‐ Arthralgia Show forest plot | 3 | 2220 | Risk Ratio (M‐H, Fixed, 95% CI) | 1.17 [0.98, 1.40] |
|
| 2.1 Natalizumab vs Placebo | 1 | 939 | Risk Ratio (M‐H, Fixed, 95% CI) | 1.35 [0.98, 1.85] |
| 2.2 Natalizumab + IFN vs IFN | 1 | 1171 | Risk Ratio (M‐H, Fixed, 95% CI) | 1.05 [0.85, 1.31] |
| 2.3 Natalizumab + GA vs GA | 1 | 110 | Risk Ratio (M‐H, Fixed, 95% CI) | 5.0 [0.60, 41.42] |
| 3 Depression Show forest plot | 3 | 2220 | Risk Ratio (M‐H, Random, 95% CI) | 1.18 [0.98, 1.41] |
|
| 3.1 Natalizumab vs Placebo | 1 | 939 | Risk Ratio (M‐H, Random, 95% CI) | 1.18 [0.88, 1.60] |
| 3.2 Natalizumab + IFN vs IFN | 1 | 1171 | Risk Ratio (M‐H, Random, 95% CI) | 1.17 [0.92, 1.47] |
| 3.3 Natalizumab + GA vs GA | 1 | 110 | Risk Ratio (M‐H, Random, 95% CI) | 1.5 [0.26, 8.63] |
| 4 Anxiety Show forest plot | 1 | 1171 | Risk Ratio (M‐H, Random, 95% CI) | 1.49 [1.05, 2.12] |
|
| 4.1 Natalizumab + IFN vs IFN | 1 | 1171 | Risk Ratio (M‐H, Random, 95% CI) | 1.49 [1.05, 2.12] |
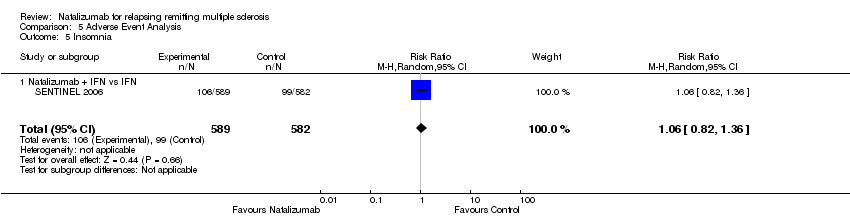
| 5 Insomnia Show forest plot | 1 | 1171 | Risk Ratio (M‐H, Random, 95% CI) | 1.06 [0.82, 1.36] |
|
| 5.1 Natalizumab + IFN vs IFN | 1 | 1171 | Risk Ratio (M‐H, Random, 95% CI) | 1.06 [0.82, 1.36] |
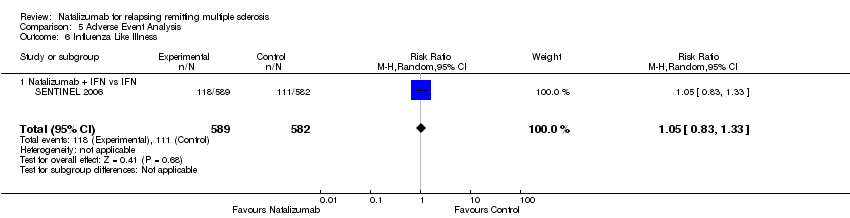
| 6 Influenza Like Illness Show forest plot | 1 | 1171 | Risk Ratio (M‐H, Random, 95% CI) | 1.05 [0.83, 1.33] |
|
| 6.1 Natalizumab + IFN vs IFN | 1 | 1171 | Risk Ratio (M‐H, Random, 95% CI) | 1.05 [0.83, 1.33] |
| 7 Nasopharyngitis Show forest plot | 2 | 1281 | Risk Ratio (M‐H, Fixed, 95% CI) | 1.09 [0.94, 1.26] |
|
| 7.1 Natalizumab + IFN vs IFN | 1 | 1171 | Risk Ratio (M‐H, Fixed, 95% CI) | 1.11 [0.96, 1.29] |
| 7.2 Natalizumab + GA vs GA | 1 | 110 | Risk Ratio (M‐H, Fixed, 95% CI) | 0.64 [0.27, 1.52] |
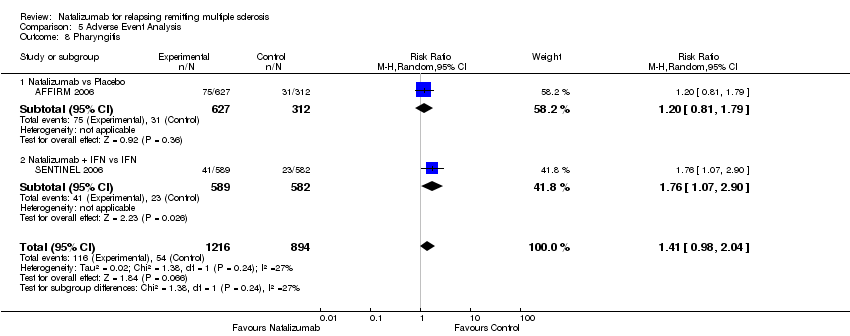
| 8 Pharyngitis Show forest plot | 2 | 2110 | Risk Ratio (M‐H, Random, 95% CI) | 1.41 [0.98, 2.04] |
|
| 8.1 Natalizumab vs Placebo | 1 | 939 | Risk Ratio (M‐H, Random, 95% CI) | 1.20 [0.81, 1.79] |
| 8.2 Natalizumab + IFN vs IFN | 1 | 1171 | Risk Ratio (M‐H, Random, 95% CI) | 1.76 [1.07, 2.90] |
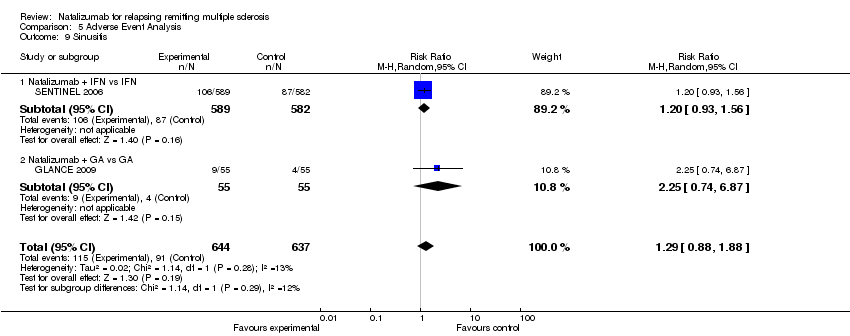
| 9 Sinusitis Show forest plot | 2 | 1281 | Risk Ratio (M‐H, Random, 95% CI) | 1.29 [0.88, 1.88] |
|
| 9.1 Natalizumab + IFN vs IFN | 1 | 1171 | Risk Ratio (M‐H, Random, 95% CI) | 1.20 [0.93, 1.56] |
| 9.2 Natalizumab + GA vs GA | 1 | 110 | Risk Ratio (M‐H, Random, 95% CI) | 2.25 [0.74, 6.87] |
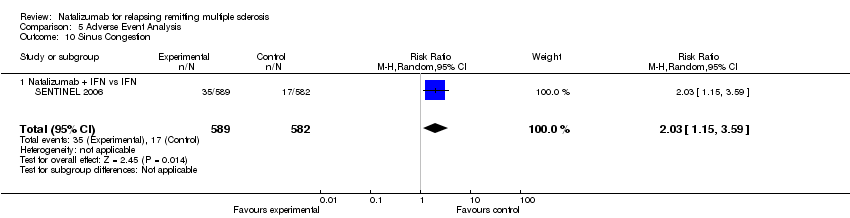
| 10 Sinus Congestion Show forest plot | 1 | 1171 | Risk Ratio (M‐H, Random, 95% CI) | 2.03 [1.15, 3.59] |
|
| 10.1 Natalizumab + IFN vs IFN | 1 | 1171 | Risk Ratio (M‐H, Random, 95% CI) | 2.03 [1.15, 3.59] |
| 11 Sinus Headache Show forest plot | 1 | 1171 | Risk Ratio (M‐H, Random, 95% CI) | 1.69 [0.94, 3.03] |
|
| 11.1 Natalizumab + IFN vs IFN | 1 | 1171 | Risk Ratio (M‐H, Random, 95% CI) | 1.69 [0.94, 3.03] |
| 12 Upper Respiratory Infection Show forest plot | 3 | 2220 | Risk Ratio (M‐H, Random, 95% CI) | 1.05 [0.87, 1.28] |
|
| 12.1 Natalizumab vs Placebo | 1 | 939 | Risk Ratio (M‐H, Random, 95% CI) | 1.00 [0.80, 1.26] |
| 12.2 Natalizumab + IFN vs IFN | 1 | 1171 | Risk Ratio (M‐H, Random, 95% CI) | 1.13 [0.76, 1.69] |
| 12.3 Natalizumab + GA vs GA | 1 | 110 | Risk Ratio (M‐H, Random, 95% CI) | 1.8 [0.64, 5.03] |
| 13 Influenza Show forest plot | 1 | 1171 | Risk Ratio (M‐H, Random, 95% CI) | 1.14 [0.87, 1.48] |
|
| 13.1 Natalizumab + IFN vs IFN | 1 | 1171 | Risk Ratio (M‐H, Random, 95% CI) | 1.14 [0.87, 1.48] |
| 14 Cough Show forest plot | 1 | 1171 | Risk Ratio (M‐H, Random, 95% CI) | 1.24 [0.87, 1.75] |
|
| 14.1 Natalizumab + IFN vs IFN | 1 | 1171 | Risk Ratio (M‐H, Random, 95% CI) | 1.24 [0.87, 1.75] |
| 15 Diarrhea Show forest plot | 1 | 1171 | Risk Ratio (M‐H, Random, 95% CI) | 1.19 [0.93, 1.53] |
|
| 15.1 Natalizumab + IFN vs IFN | 1 | 1171 | Risk Ratio (M‐H, Random, 95% CI) | 1.19 [0.93, 1.53] |
| 16 Nausea Show forest plot | 2 | 1281 | Risk Ratio (M‐H, Random, 95% CI) | 1.13 [0.88, 1.46] |
|
| 16.1 Natalizumab + IFN vs IFN | 1 | 1171 | Risk Ratio (M‐H, Random, 95% CI) | 1.14 [0.87, 1.48] |
| 16.2 Natalizumab + GA vs GA | 1 | 110 | Risk Ratio (M‐H, Random, 95% CI) | 1.13 [0.47, 2.70] |
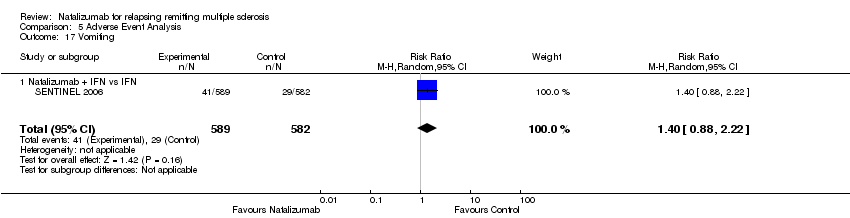
| 17 Vomiting Show forest plot | 1 | 1171 | Risk Ratio (M‐H, Random, 95% CI) | 1.40 [0.88, 2.22] |
|
| 17.1 Natalizumab + IFN vs IFN | 1 | 1171 | Risk Ratio (M‐H, Random, 95% CI) | 1.40 [0.88, 2.22] |
| 18 Abdominal Pain or Discomfort Show forest plot | 2 | 2110 | Risk Ratio (M‐H, Random, 95% CI) | 1.14 [0.84, 1.55] |
|
| 18.1 Natalizumab vs Placebo | 1 | 939 | Risk Ratio (M‐H, Random, 95% CI) | 1.11 [0.74, 1.65] |
| 18.2 Natalizumab + IFN vs IFN | 1 | 1171 | Risk Ratio (M‐H, Random, 95% CI) | 1.19 [0.74, 1.92] |
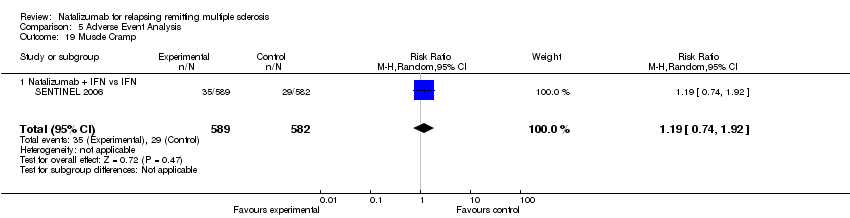
| 19 Muscle Cramp Show forest plot | 1 | 1171 | Risk Ratio (M‐H, Random, 95% CI) | 1.19 [0.74, 1.92] |
|
| 19.1 Natalizumab + IFN vs IFN | 1 | 1171 | Risk Ratio (M‐H, Random, 95% CI) | 1.19 [0.74, 1.92] |
| 20 Myalgia Show forest plot | 1 | 1171 | Risk Ratio (M‐H, Random, 95% CI) | 1.31 [0.95, 1.81] |
|
| 20.1 Natalizumab + IFN vs IFN | 1 | 1171 | Risk Ratio (M‐H, Random, 95% CI) | 1.31 [0.95, 1.81] |
| 21 Seasonal Allergy Show forest plot | 1 | 1171 | Risk Ratio (M‐H, Random, 95% CI) | 1.50 [0.90, 2.51] |
|
| 21.1 Natalizumab + IFN vs IFN | 1 | 1171 | Risk Ratio (M‐H, Random, 95% CI) | 1.50 [0.90, 2.51] |
| 22 Peripheral Edema Show forest plot | 1 | 1171 | Risk Ratio (M‐H, Random, 95% CI) | 4.78 [2.00, 11.42] |
|
| 22.1 Natalizumab + IFN vs IFN | 1 | 1171 | Risk Ratio (M‐H, Random, 95% CI) | 4.78 [2.00, 11.42] |
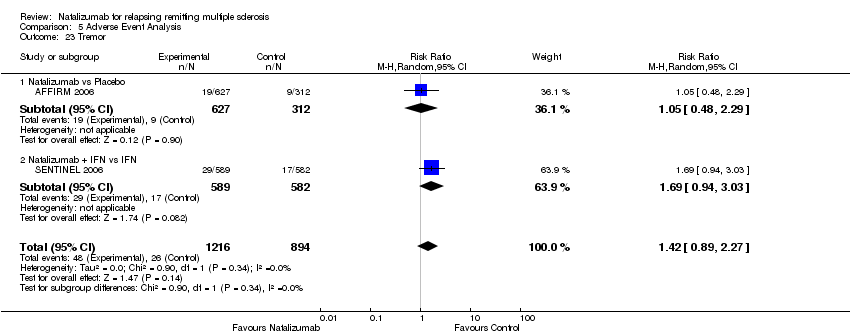
| 23 Tremor Show forest plot | 2 | 2110 | Risk Ratio (M‐H, Random, 95% CI) | 1.42 [0.89, 2.27] |
|
| 23.1 Natalizumab vs Placebo | 1 | 939 | Risk Ratio (M‐H, Random, 95% CI) | 1.05 [0.48, 2.29] |
| 23.2 Natalizumab + IFN vs IFN | 1 | 1171 | Risk Ratio (M‐H, Random, 95% CI) | 1.69 [0.94, 3.03] |
| 24 Flushing Show forest plot | 1 | 110 | Risk Ratio (M‐H, Random, 95% CI) | 6.00 [0.75, 48.21] |
|
| 24.1 Natalizumab GA vs GA | 1 | 110 | Risk Ratio (M‐H, Random, 95% CI) | 6.00 [0.75, 48.21] |
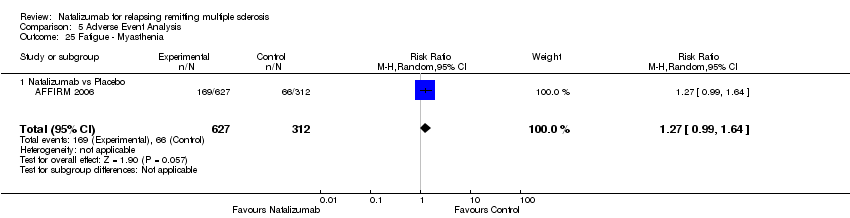
| 25 Fatigue ‐ Myasthenia Show forest plot | 1 | 939 | Risk Ratio (M‐H, Random, 95% CI) | 1.27 [0.99, 1.64] |
|
| 25.1 Natalizumab vs Placebo | 1 | 939 | Risk Ratio (M‐H, Random, 95% CI) | 1.27 [0.99, 1.64] |
| 26 Urinary Urgency / Frequency Show forest plot | 1 | 939 | Risk Ratio (M‐H, Random, 95% CI) | 1.27 [0.79, 2.03] |
|
| 26.1 Natalizumab vs Placebo | 1 | 939 | Risk Ratio (M‐H, Random, 95% CI) | 1.27 [0.79, 2.03] |
| 27 Hypersensitivity reactions Show forest plot | 3 | 2220 | Risk Ratio (M‐H, Random, 95% CI) | 3.43 [0.33, 36.07] |
|
| 27.1 Natalizumab vs Placebo | 1 | 939 | Risk Ratio (M‐H, Random, 95% CI) | 25.42 [1.55, 416.15] |
| 27.2 Natalizumab + IFN vs IFN | 1 | 1171 | Risk Ratio (M‐H, Random, 95% CI) | 5.43 [1.21, 24.41] |
| 27.3 Natalizumab GA vs GA | 1 | 110 | Risk Ratio (M‐H, Random, 95% CI) | 0.2 [0.01, 4.07] |
| 28 Chest Discomfort Show forest plot | 1 | 939 | Risk Ratio (M‐H, Random, 95% CI) | 1.71 [0.83, 3.56] |
|
| 28.1 Natalizumab vs Placebo | 1 | 939 | Risk Ratio (M‐H, Random, 95% CI) | 1.71 [0.83, 3.56] |
| 29 Local Bleeding Show forest plot | 1 | 939 | Risk Ratio (M‐H, Random, 95% CI) | 1.58 [0.64, 3.91] |
|
| 29.1 Natalizumab vs Placebo | 1 | 939 | Risk Ratio (M‐H, Random, 95% CI) | 1.58 [0.64, 3.91] |
| 30 Rigors Show forest plot | 2 | 1049 | Risk Ratio (M‐H, Random, 95% CI) | 3.54 [1.16, 10.83] |
|
| 30.1 Natalizumab vs Placebo | 1 | 939 | Risk Ratio (M‐H, Random, 95% CI) | 3.15 [0.94, 10.57] |
| 30.2 Natalizumab GA vs GA | 1 | 110 | Risk Ratio (M‐H, Random, 95% CI) | 7.0 [0.37, 132.40] |
| 31 Syncope Show forest plot | 1 | 939 | Risk Ratio (M‐H, Random, 95% CI) | 1.05 [0.48, 2.29] |
|
| 31.1 Natalizumab vs Placebo | 1 | 939 | Risk Ratio (M‐H, Random, 95% CI) | 1.05 [0.48, 2.29] |
| 32 Urinary Infection Show forest plot | 2 | 1049 | Risk Ratio (M‐H, Random, 95% CI) | 0.99 [0.51, 1.93] |
|
| 32.1 Natalizumab vs Placebo | 1 | 939 | Risk Ratio (M‐H, Random, 95% CI) | 1.17 [0.88, 1.57] |
| 32.2 Natalizumab GA vs GA | 1 | 110 | Risk Ratio (M‐H, Random, 95% CI) | 0.5 [0.13, 1.90] |
| 33 Lower Respiratory Infection Show forest plot | 1 | 939 | Risk Ratio (M‐H, Random, 95% CI) | 1.06 [0.78, 1.45] |
|
| 33.1 Natalizumab vs Placebo | 1 | 939 | Risk Ratio (M‐H, Random, 95% CI) | 1.06 [0.78, 1.45] |
| 34 Tonsillitis Show forest plot | 1 | 939 | Risk Ratio (M‐H, Random, 95% CI) | 1.37 [0.78, 2.39] |
|
| 34.1 Natalizumab vs Placebo | 1 | 939 | Risk Ratio (M‐H, Random, 95% CI) | 1.37 [0.78, 2.39] |
| 35 Gastroenteritis Show forest plot | 1 | 939 | Risk Ratio (M‐H, Random, 95% CI) | 1.23 [0.81, 1.86] |
|
| 35.1 Natalizumab vs Placebo | 1 | 939 | Risk Ratio (M‐H, Random, 95% CI) | 1.23 [0.81, 1.86] |
| 36 Vaginitis Show forest plot | 1 | 939 | Risk Ratio (M‐H, Random, 95% CI) | 1.65 [1.01, 2.71] |
|
| 36.1 Natalizumab vs Placebo | 1 | 939 | Risk Ratio (M‐H, Random, 95% CI) | 1.65 [1.01, 2.71] |
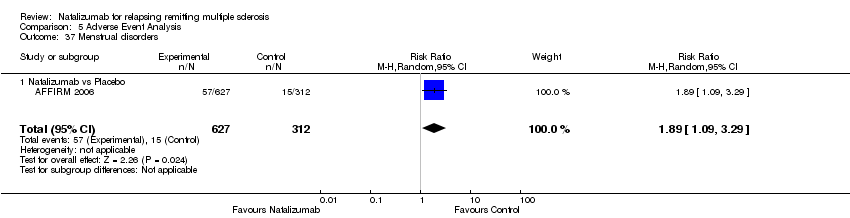
| 37 Menstrual disorders Show forest plot | 1 | 939 | Risk Ratio (M‐H, Random, 95% CI) | 1.89 [1.09, 3.29] |
|
| 37.1 Natalizumab vs Placebo | 1 | 939 | Risk Ratio (M‐H, Random, 95% CI) | 1.89 [1.09, 3.29] |
| 38 Skin Rash Show forest plot | 2 | 1049 | Risk Ratio (M‐H, Random, 95% CI) | 1.94 [0.47, 7.99] |
|
| 38.1 Natalizumab vs Placebo | 1 | 939 | Risk Ratio (M‐H, Random, 95% CI) | 1.23 [0.81, 1.86] |
| 38.2 Natalizumab + GA vs GA | 1 | 110 | Risk Ratio (M‐H, Random, 95% CI) | 6.00 [0.75, 48.21] |
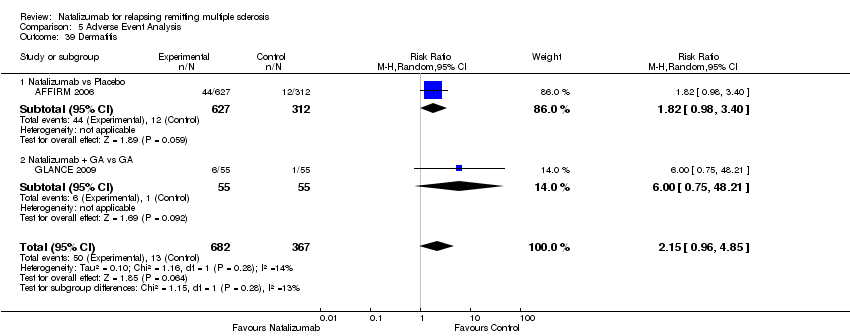
| 39 Dermatitis Show forest plot | 2 | 1049 | Risk Ratio (M‐H, Random, 95% CI) | 2.15 [0.96, 4.85] |
|
| 39.1 Natalizumab vs Placebo | 1 | 939 | Risk Ratio (M‐H, Random, 95% CI) | 1.82 [0.98, 3.40] |
| 39.2 Natalizumab + GA vs GA | 1 | 110 | Risk Ratio (M‐H, Random, 95% CI) | 6.00 [0.75, 48.21] |
| 40 Pruritus Show forest plot | 1 | 939 | Risk Ratio (M‐H, Random, 95% CI) | 2.07 [0.86, 5.00] |
|
| 40.1 Natalizumab vs Placebo | 1 | 939 | Risk Ratio (M‐H, Random, 95% CI) | 2.07 [0.86, 5.00] |
| 41 Vertigo Show forest plot | 1 | 939 | Risk Ratio (M‐H, Random, 95% CI) | 1.18 [0.67, 2.09] |
|
| 41.1 Natalizumab vs Placebo | 1 | 939 | Risk Ratio (M‐H, Random, 95% CI) | 1.18 [0.67, 2.09] |
| 42 Infection Show forest plot | 3 | 2220 | Risk Ratio (M‐H, Random, 95% CI) | 1.01 [0.97, 1.06] |
|
| 42.1 Natalizumab vs Placebo | 1 | 939 | Risk Ratio (M‐H, Random, 95% CI) | 1.00 [0.93, 1.07] |
| 42.2 Natalizumab + IFN vs IFN | 1 | 1171 | Risk Ratio (M‐H, Random, 95% CI) | 1.03 [0.97, 1.08] |
| 42.3 Natalizumab + GA vs GA | 1 | 110 | Risk Ratio (M‐H, Random, 95% CI) | 0.92 [0.69, 1.22] |
| 43 Infusion reactions Show forest plot | 3 | 2220 | Risk Ratio (M‐H, Random, 95% CI) | 1.24 [1.05, 1.47] |
|
| 43.1 Natalizumab vs Placebo | 1 | 939 | Risk Ratio (M‐H, Random, 95% CI) | 1.34 [1.01, 1.77] |
| 43.2 Natalizumab + IFN vs IFN | 1 | 1171 | Risk Ratio (M‐H, Random, 95% CI) | 1.20 [0.97, 1.49] |
| 43.3 Natalizumab + GA vs GA | 1 | 110 | Risk Ratio (M‐H, Random, 95% CI) | 0.86 [0.31, 2.39] |
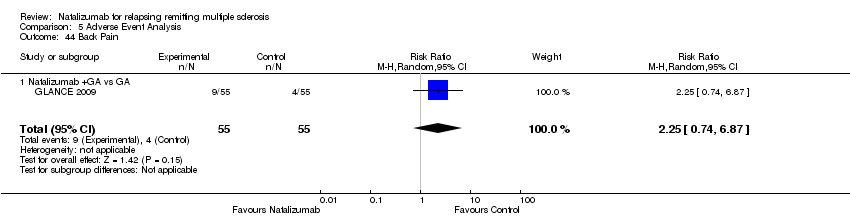
| 44 Back Pain Show forest plot | 1 | 110 | Risk Ratio (M‐H, Random, 95% CI) | 2.25 [0.74, 6.87] |
|
| 44.1 Natalizumab +GA vs GA | 1 | 110 | Risk Ratio (M‐H, Random, 95% CI) | 2.25 [0.74, 6.87] |
| 45 Fall Show forest plot | 2 | 2110 | Risk Ratio (M‐H, Random, 95% CI) | 2.69 [0.32, 22.39] |
|
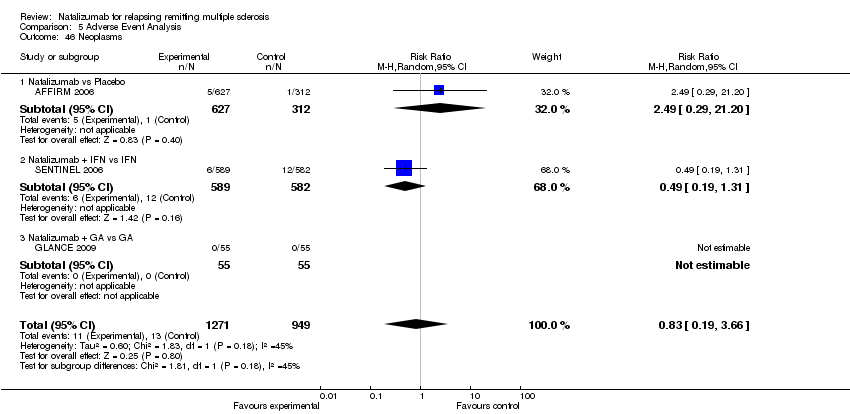
| 46 Neoplasms Show forest plot | 3 | 2220 | Risk Ratio (M‐H, Random, 95% CI) | 0.83 [0.19, 3.66] |
|
| 46.1 Natalizumab vs Placebo | 1 | 939 | Risk Ratio (M‐H, Random, 95% CI) | 2.49 [0.29, 21.20] |
| 46.2 Natalizumab + IFN vs IFN | 1 | 1171 | Risk Ratio (M‐H, Random, 95% CI) | 0.49 [0.19, 1.31] |
| 46.3 Natalizumab + GA vs GA | 1 | 110 | Risk Ratio (M‐H, Random, 95% CI) | 0.0 [0.0, 0.0] |
| 47 Abnormal liver function tests Show forest plot | 1 | 939 | Risk Ratio (M‐H, Random, 95% CI) | 1.29 [0.67, 2.47] |
|
| 47.1 Natalizumab vs Placebo | 1 | 939 | Risk Ratio (M‐H, Random, 95% CI) | 1.29 [0.67, 2.47] |
| 48 Death Show forest plot | 3 | 2220 | Risk Ratio (M‐H, Random, 95% CI) | 0.92 [0.14, 6.04] |
|
| 48.1 Natalizumab vs Placebo | 1 | 939 | Risk Ratio (M‐H, Random, 95% CI) | 2.49 [0.12, 51.75] |
| 48.2 Natalizumab + GA vs GA | 1 | 110 | Risk Ratio (M‐H, Random, 95% CI) | 0.0 [0.0, 0.0] |
| 48.3 Natalizumab + IFN vs IFN | 1 | 1171 | Risk Ratio (M‐H, Random, 95% CI) | 0.49 [0.04, 5.43] |
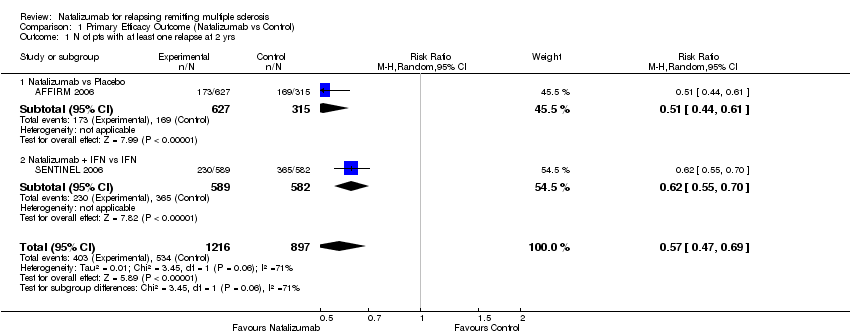
| 49 MS relapse as a serious AE Show forest plot | 3 | 2220 | Risk Ratio (M‐H, Random, 95% CI) | 0.50 [0.37, 0.68] |
|
| 49.1 Natalizumab vs Placebo | 1 | 939 | Risk Ratio (M‐H, Random, 95% CI) | 0.46 [0.30, 0.70] |
| 49.2 Natalizumab + IFN vs IFN | 1 | 1171 | Risk Ratio (M‐H, Random, 95% CI) | 0.55 [0.36, 0.86] |
| 49.3 Natalizumab + GA vs GA | 1 | 110 | Risk Ratio (M‐H, Random, 95% CI) | 0.33 [0.01, 8.01] |