Natalizumab para la esclerosis múltiple recurrente remitente
Referencias
Referencias de los estudios incluidos en esta revisión
Referencias de los estudios excluidos de esta revisión
Referencias de los estudios en espera de evaluación
Referencias adicionales
Characteristics of studies
Characteristics of included studies [ordered by study ID]
| Methods | Phase 3, multicentre, randomised, double‐blind, placebo controlled trial | |
| Participants | 99 centers in Europe, North America, Australia, and New Zealand enrolled 942 patients recruited from November 6, 2001 to January 31, 2005. Inclusion criteria: age=18‐50 years, diagnosis of RRMS (McDonald criteria), EDSS=0‐5.0; at least one medically documented relapse within the 12 months before the study began. Exclusion criteria: a relapse within 50 days before the administration of the first dose of the study drug; treatment with cyclophosphamide or mitoxantrone within the previous year, or treatment with IFNß, GA, cyclosporine, azathioprine, methotrexate, or intravenous immune globulin within the previous 6 months; treatment with IFNß, GA, or both for more than six months. | |
| Interventions | Patients were randomly assigned in a 2:1 ratio to receive either NTZ (at a dose of 300 mg) or placebo by intravenous infusion every 4 weeks for up to 116 weeks. | |
| Outcomes | Primary endpoints: rate of clinical relapse at 1 year; rate of sustained progression of disability at 2 years, as measured by EDSS, defined as an increase of 1.0 or more on the EDSS from a baseline score of 1.0 or more or an increase of 1.5 or more from a baseline score of 0, that was sustained for 12 weeks (progression could not be confirmed during a relapse). Secondary endpoints: different MRI parameters at 1 and 2 years; the proportion of relapse free patients at 1 year; rate of clinical relapse at 2 years; progression of disability at 2 years, as measured by MSFC. Tertiary endpoints: Visual function testing (Sloan charts) ; Physical Component Summary (PCS) and Mental Component Summary (MCS) from SF‐36; Subject Global Assessment Visual Analog Scale. | |
| Notes | 3 patients who were assigned to receive placebo were never treated; these patients were included in the intention‐to‐treat efficacy analyses but were excluded from the safety analyses. Binding antibodies against NTZ were assessed. | |
| Risk of bias | ||
| Bias | Authors' judgement | Support for judgement |
| Random sequence generation (selection bias) | Low risk | quote "Patients were randomly assigned in a 2:1 ratio to treatment that was stratified according to study site in blocks of three (two active, one placebo) with the use of a computer‐generated block randomisation schedule" |
| Allocation concealment (selection bias) | Low risk | quote: "a multi digit identification number, implemented by an interactive voice‐response system was used " |
| Blinding (performance bias and detection bias) | Low risk | quote: "All study personnel, patients, sponsor personnel involved in the conduct of the study, and the investigator advisory committee were unaware of treatment assignments throughout the study" |
| Blinding (performance bias and detection bias) | Low risk | quote: "All study personnel, patients, sponsor personnel involved in the conduct of the study, and the investigator advisory committee were unaware of treatment assignments throughout the study" |
| Incomplete outcome data (attrition bias) | Unclear risk | quote: "8 percent of patients in the NTZ group and 10 percent of those in the placebo group) withdrew from the study. Thirty‐nine patients discontinued the study drug but completed follow‐up (a total of 4 percent, including 4 percent of patients in the NTZ group and 5 percent of those in the placebo group)". "All analyses followed the intention‐to‐treat principle." A CONSORT flowchart is shown. However, the AFFIRM Authors did not report how the outcomes for patient withdrawals were assigned in the ITT analysis. |
| Selective reporting (reporting bias) | Low risk | No selective reporting was identified. |
| Independent Funding Source | High risk | Supported by Biogen Idec and Elan Pharmaceuticals. Data were |
| Methods | Phase 2, multicentre, randomised, double‐blind, add‐on, placebo‐controlled, parallel‐group study | |
| Participants | 110 patients from 25 centres in US and Canada (between June 17, 2003 and March 23, 2004. Eligible patients: aged 18–55 years, diagnosis of RRMS (McDonald criteria), EDSS = 0‐5.0, treatment with GA for at least 12 months before randomisation, one or more relapses during that time. Exclusion criteria: diagnosis of progressive MS, MS relapse within 50 days before randomisation, clinically significant infectious illness within 30 days of randomisation, abnormal laboratory results (or history thereof) indicative of any major organ system disease precluding administration of NTZ or GA, history of severe allergic or anaphylactic reactions, known drug hypersensitivity, or history of malignancy (excluding nonmetastatic basal cell carcinoma). Women who were pregnant, at risk of or planning to become pregnant, or breast‐feeding were excluded. | |
| Interventions | IV NTZ 300 mg or placebo once every 4 weeks plus GA 20 mg subcutaneously once daily for 24 weeks. | |
| Outcomes | Primary endpoint: rate of development of new active lesions on cranial MRI. Secondary endpoints: AEs. | |
| Notes | Aims: safety and tolerability data. The main hypothesis was that, because the proposed mechanism of action of GA requires cellular entry into the brain, NTZ might impair rather than enhance the efficacy of GA. Binding antibodies against NTZ were assessed. | |
| Risk of bias | ||
| Bias | Authors' judgement | Support for judgement |
| Random sequence generation (selection bias) | Unclear risk | quote:"Patients were randomly assigned 1:1 to receive IV NTZ 300 mg or placebo" However, the investigators did not describe a random component in the sequence generation process. |
| Allocation concealment (selection bias) | Unclear risk | unclear |
| Blinding (performance bias and detection bias) | Low risk | quote:"All study personnel, patients, and sponsor personnel involved in study conduct were blinded to treatment assignments" |
| Blinding (performance bias and detection bias) | Low risk | quote: "All study personnel, patients, and sponsor personnel involved in study conduct were blinded to treatment assignments" |
| Incomplete outcome data (attrition bias) | Unclear risk | A CONSORT flowchart is shown. However, the GLANCE Authors did not report how the outcomes for patient withdrawals were assigned in the ITT analysis. |
| Selective reporting (reporting bias) | Low risk | No selective reporting was identified. |
| Independent Funding Source | High risk | This study was supported by Biogen Idec, Inc. and Elan Pharmaceuticals, Inc. |
| Methods | Phase 3, multicentre, randomised, double‐blind, add‐on, placebo controlled trial. | |
| Participants | 124 centers in Europe and US enrolled 1196 patients beginning on January 14, 2002 up to February 28, 2005 (planned May 31, 2005). Inclusion criteria: age=18‐55 years; diagnosis of RRMS (McDonald criteria), EDSS=0‐5.0; at least one relapse within the 12 months before randomisation; treatment with IFNß‐1a im for at least 12 months before randomisation. Exclusion criteria: a relapse within 50 days before randomisation; treatment with an approved disease‐modifying therapy other than IFNß‐1a im once weekly within the 12‐month period before randomisation. | |
| Interventions | Patients were randomly assigned, in a 1:1 ratio, to receive 300 mg of NTZ (589 patients) or placebo (582 patients) intravenously every 4 weeks in addition to IFNß‐1a (Avonex, Biogen Idec) at a dose of 30 μg intramuscularly once weekly for up to 116 weeks. | |
| Outcomes | Primary endpoints: rate of clinical relapse at 1 year; rate of sustained progression of disability at 2 years, as measured by EDSS, defined as an increase of 1.0 or more on the EDSS from a baseline score of 1.0 or more or an increase of 1.5 or more from a baseline score of 0, that was sustained for 12 weeks (progression could not be confirmed during a relapse). Secondary endpoints: different MRI parameters at 1 and 2 years; the proportion of relapse free patients at 1 year; rate of clinical relapse at 2 years; progression of disability at 2 years, as measured by MSFC. Tertiary endpoints: Visual function testing (Sloan charts) ; Physical Component Summary (PCS) and Mental Component Summary (MCS) from SF‐36. | |
| Notes | One center with 25 patients was excluded before unblinding owing to irregularities in data. Thus, the number of patients included in data analysis was 1171. Following the recognition of two cases of PML in patients who had been receiving NTZ in combination with IFNß‐1a (Avonex®) for over 2 years, Biogen Idec and Elan Pharmaceuticals, in discussions with FDA, suspended commercialisation and clinical trials on 28 February 2005. Binding antibodies against NTZ were assessed. | |
| Risk of bias | ||
| Bias | Authors' judgement | Support for judgement |
| Random sequence generation (selection bias) | Low risk | quote: "Randomization was stratified according to study site in blocks of four (two active and two placebo) with the use of a computer‐generated schedule" |
| Allocation concealment (selection bias) | Low risk | quote: "a multidigit identification number, implemented by an interactive voice‐response system was used " |
| Blinding (performance bias and detection bias) | Low risk | quote: "All study personnel, patients, sponsor personnel involved in the conduct of the study, and members of the investigator advisory committee were blinded to the treatment assignments throughout the study". |
| Blinding (performance bias and detection bias) | Low risk | quote: "All study personnel, patients, sponsor personnel involved in the conduct of the study, and members of the investigator advisory committee were blinded to the treatment assignments throughout the study". |
| Incomplete outcome data (attrition bias) | Unclear risk | quote: "12 percent of the group assigned to IFNß‐1a plus NTZ and 16 percent of the group assigned to IFNß‐1a alone) withdrew from the study". "5 percent of the combination‐therapy group and 6 percent of the group assigned to IFNß‐1a alone discontinued the study drug but completed follow‐up ". " All analyses followed the intention‐to‐treat principle." A CONSORT flowchart is shown. However, the SENTINEL authors did not report how the outcomes for patient withdrawals were assigned in the ITT analysis. |
| Selective reporting (reporting bias) | Low risk | No selective reporting was identified. |
| Independent Funding Source | High risk | Supported by Biogen Idec and Elan Pharmaceuticals. |
Characteristics of excluded studies [ordered by study ID]
| Study | Reason for exclusion |
| Dosage: 3 mg/kg. |
Characteristics of studies awaiting assessment [ordered by study ID]
| Methods | Randomized, double‐blind trial, placebo‐controlled. |
| Participants | 213 patients with RRMS or relapsing SPMS. |
| Interventions | Three arms: (i) 3 mg of intravenous NTZ per kilogram of body weight (N=68), (ii) 6 mg per kilogram (N=74), (iii) placebo (N=71) every 28 days for 6 months. |
| Outcomes | The primary end point was the number of new brain lesions on monthly gadolinium‐enhanced MRI during the six‐month treatment period. Other MRI outcomes included the number of persistent enhancing lesions; the volume of enhancing lesions; the number of new active lesions (the number of new enhancing lesions plus the number of new or newly enlarging, nonenhancing lesions on T2‐weighted MRI); and the number of scans showing one or more new enhancing lesions. Secondary and tertiary clinical end points included |
| Notes | Since the trial duration was 6 months, this study was included with the sole aim of assessing tolerability/safety data. Data on RRMS only in the 6 mg per |
Data and analyses
| Outcome or subgroup title | No. of studies | No. of participants | Statistical method | Effect size |
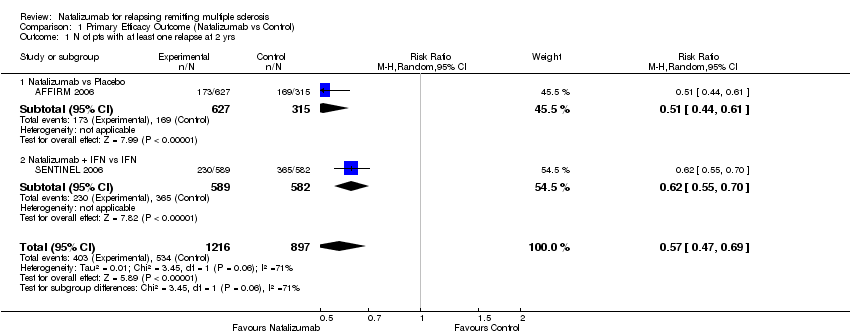
| 1 N of pts with at least one relapse at 2 yrs Show forest plot | 2 | 2113 | Risk Ratio (M‐H, Random, 95% CI) | 0.57 [0.47, 0.69] |
| Analysis 1.1  Comparison 1 Primary Efficacy Outcome (Natalizumab vs Control), Outcome 1 N of pts with at least one relapse at 2 yrs. | ||||
| 1.1 Natalizumab vs Placebo | 1 | 942 | Risk Ratio (M‐H, Random, 95% CI) | 0.51 [0.44, 0.61] |
| 1.2 Natalizumab + IFN vs IFN | 1 | 1171 | Risk Ratio (M‐H, Random, 95% CI) | 0.62 [0.55, 0.70] |
| 2 N of pts who progressed at 2 yrs Show forest plot | 2 | 2113 | Risk Ratio (M‐H, Random, 95% CI) | 0.74 [0.62, 0.89] |
| Analysis 1.2  Comparison 1 Primary Efficacy Outcome (Natalizumab vs Control), Outcome 2 N of pts who progressed at 2 yrs. | ||||
| 2.1 Natalizumab vs Placebo | 1 | 942 | Risk Ratio (M‐H, Random, 95% CI) | 0.67 [0.55, 0.81] |
| 2.2 Natalizumab + IFN vs IFN | 1 | 1171 | Risk Ratio (M‐H, Random, 95% CI) | 0.80 [0.69, 0.93] |
| 3 PCS Change in Short Form (SF‐36) follow up 2 years Show forest plot | 2 | 2113 | Mean Difference (IV, Random, 95% CI) | 1.98 [1.05, 2.91] |
| Analysis 1.3  Comparison 1 Primary Efficacy Outcome (Natalizumab vs Control), Outcome 3 PCS Change in Short Form (SF‐36) follow up 2 years. | ||||
| 3.1 Natalizumab vs Placebo | 1 | 942 | Mean Difference (IV, Random, 95% CI) | 2.01 [0.48, 3.54] |
| 3.2 Natalizumab + IFN vs IFN | 1 | 1171 | Mean Difference (IV, Random, 95% CI) | 1.96 [0.79, 3.13] |
| 4 MCS Change in Short Form (SF‐36) follow up 2 years Show forest plot | 2 | 2113 | Mean Difference (IV, Random, 95% CI) | 1.38 [0.33, 2.42] |
| Analysis 1.4  Comparison 1 Primary Efficacy Outcome (Natalizumab vs Control), Outcome 4 MCS Change in Short Form (SF‐36) follow up 2 years. | ||||
| 4.1 Natalizumab vs Placebo | 1 | 942 | Mean Difference (IV, Random, 95% CI) | 2.53 [0.00, 5.06] |
| 4.2 Natalizumab + IFN vs IFN | 1 | 1171 | Mean Difference (IV, Random, 95% CI) | 1.14 [‐0.00, 2.28] |
| Outcome or subgroup title | No. of studies | No. of participants | Statistical method | Effect size |
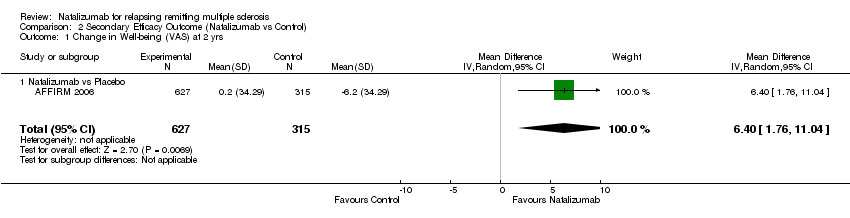
| 1 Change in Well‐being (VAS) at 2 yrs Show forest plot | 1 | 942 | Mean Difference (IV, Random, 95% CI) | 6.4 [1.76, 11.04] |
| Analysis 2.1  Comparison 2 Secondary Efficacy Outcome (Natalizumab vs Control), Outcome 1 Change in Well‐being (VAS) at 2 yrs. | ||||
| 1.1 Natalizumab vs Placebo | 1 | 942 | Mean Difference (IV, Random, 95% CI) | 6.4 [1.76, 11.04] |
| 2 Gd‐enhacing lesion (at least one) at 2 yrs Show forest plot | 2 | 2113 | Risk Ratio (M‐H, Random, 95% CI) | 0.12 [0.09, 0.17] |
| Analysis 2.2  Comparison 2 Secondary Efficacy Outcome (Natalizumab vs Control), Outcome 2 Gd‐enhacing lesion (at least one) at 2 yrs. | ||||
| 2.1 Natalizumab vs Placebo | 1 | 942 | Risk Ratio (M‐H, Random, 95% CI) | 0.11 [0.07, 0.17] |
| 2.2 Natalizumab + IFN vs IFN | 1 | 1171 | Risk Ratio (M‐H, Random, 95% CI) | 0.14 [0.09, 0.22] |
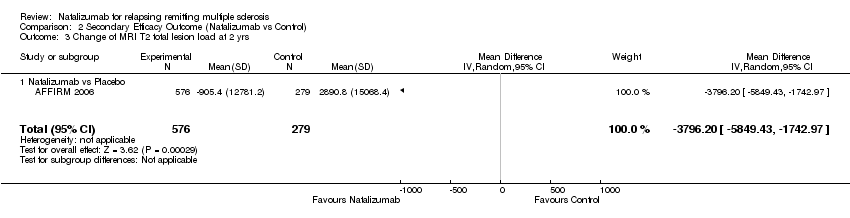
| 3 Change of MRI T2 total lesion load at 2 yrs Show forest plot | 1 | 855 | Mean Difference (IV, Random, 95% CI) | ‐3796.20 [‐5849.43, ‐1742.97] |
| Analysis 2.3  Comparison 2 Secondary Efficacy Outcome (Natalizumab vs Control), Outcome 3 Change of MRI T2 total lesion load at 2 yrs. | ||||
| 3.1 Natalizumab vs Placebo | 1 | 855 | Mean Difference (IV, Random, 95% CI) | ‐3796.20 [‐5849.43, ‐1742.97] |
| Outcome or subgroup title | No. of studies | No. of participants | Statistical method | Effect size |
| 1 N of pts with Severe AE over 2 yrs Show forest plot | 2 | 2110 | Risk Ratio (M‐H, Random, 95% CI) | 0.92 [0.81, 1.04] |
| Analysis 3.1  Comparison 3 Primary Safety Outcome (Natalizumab vs Control), Outcome 1 N of pts with Severe AE over 2 yrs. | ||||
| 1.1 Natalizumab vs Placebo | 1 | 939 | Risk Ratio (M‐H, Random, 95% CI) | 0.85 [0.68, 1.08] |
| 1.2 Natalizumab + IFN vs IFN | 1 | 1171 | Risk Ratio (M‐H, Random, 95% CI) | 0.95 [0.81, 1.10] |
| 2 N of pts with Serious AE (irrespective of treatment duration) Show forest plot | 3 | 2220 | Risk Ratio (M‐H, Random, 95% CI) | 0.83 [0.70, 0.98] |
| Analysis 3.2  Comparison 3 Primary Safety Outcome (Natalizumab vs Control), Outcome 2 N of pts with Serious AE (irrespective of treatment duration). | ||||
| 2.1 Natalizumab vs Placebo | 1 | 939 | Risk Ratio (M‐H, Random, 95% CI) | 0.79 [0.61, 1.02] |
| 2.2 Natalizumab + IFN vs IFN | 1 | 1171 | Risk Ratio (M‐H, Random, 95% CI) | 0.87 [0.69, 1.09] |
| 2.3 Natalizumab + GA vs GA | 1 | 110 | Risk Ratio (M‐H, Random, 95% CI) | 0.5 [0.05, 5.36] |
| 3 N of pts with serious AE (irrespective of treatment duration ‐ MS relapses excluded) Show forest plot | 3 | 2220 | Risk Ratio (M‐H, Random, 95% CI) | 1.13 [0.90, 1.43] |
| Analysis 3.3  Comparison 3 Primary Safety Outcome (Natalizumab vs Control), Outcome 3 N of pts with serious AE (irrespective of treatment duration ‐ MS relapses excluded). | ||||
| 3.1 Natalizumab vs Placebo | 1 | 939 | Risk Ratio (M‐H, Random, 95% CI) | 1.19 [0.81, 1.73] |
| 3.2 Natalizumab + IFN vs IFN | 1 | 1171 | Risk Ratio (M‐H, Random, 95% CI) | 1.10 [0.81, 1.49] |
| 3.3 Natalizumab + GA vs GA | 1 | 110 | Risk Ratio (M‐H, Random, 95% CI) | 1.0 [0.06, 15.59] |
| Outcome or subgroup title | No. of studies | No. of participants | Statistical method | Effect size |
| 1 N of pts with at least one AE (irrespective of treatment duration) Show forest plot | 3 | 2220 | Risk Ratio (M‐H, Random, 95% CI) | 1.00 [0.99, 1.01] |
| Analysis 4.1  Comparison 4 Secondary Safety Outcome (Natalizumab vs Control), Outcome 1 N of pts with at least one AE (irrespective of treatment duration). | ||||
| 1.1 Natalizumab vs Placebo | 1 | 939 | Risk Ratio (M‐H, Random, 95% CI) | 0.99 [0.96, 1.02] |
| 1.2 Natalizumab + IFN vs IFN | 1 | 1171 | Risk Ratio (M‐H, Random, 95% CI) | 1.00 [0.99, 1.01] |
| 1.3 Natalizumab + GA vs GA | 1 | 110 | Risk Ratio (M‐H, Random, 95% CI) | 0.98 [0.88, 1.10] |
| 2 Treatment Discontinuation caused by AE (irrespective of treatment duration) Show forest plot | 3 | 2220 | Risk Ratio (M‐H, Random, 95% CI) | 1.14 [0.82, 1.59] |
| Analysis 4.2  Comparison 4 Secondary Safety Outcome (Natalizumab vs Control), Outcome 2 Treatment Discontinuation caused by AE (irrespective of treatment duration). | ||||
| 2.1 Natalizumab vs Placebo | 1 | 939 | Risk Ratio (M‐H, Random, 95% CI) | 1.58 [0.84, 2.97] |
| 2.2 Natalizumab + IFN vs IFN | 1 | 1171 | Risk Ratio (M‐H, Random, 95% CI) | 1.01 [0.68, 1.50] |
| 2.3 Natalizumab + GA vs GA | 1 | 110 | Risk Ratio (M‐H, Random, 95% CI) | 1.0 [0.06, 15.59] |
| Outcome or subgroup title | No. of studies | No. of participants | Statistical method | Effect size |
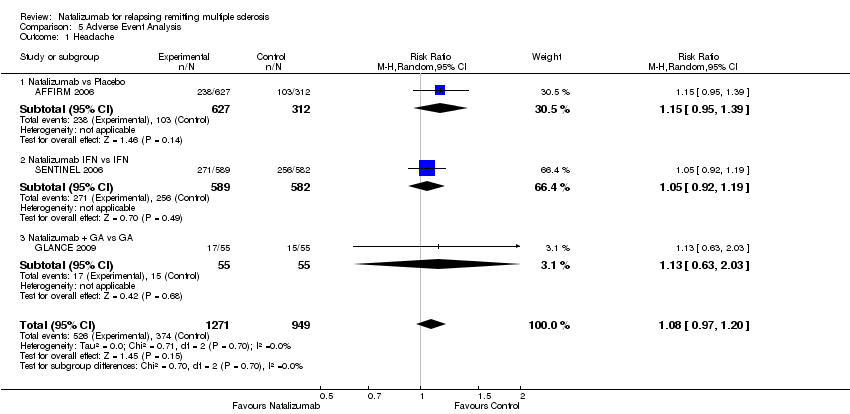
| 1 Headache Show forest plot | 3 | 2220 | Risk Ratio (M‐H, Random, 95% CI) | 1.08 [0.97, 1.20] |
| Analysis 5.1  Comparison 5 Adverse Event Analysis, Outcome 1 Headache. | ||||
| 1.1 Natalizumab vs Placebo | 1 | 939 | Risk Ratio (M‐H, Random, 95% CI) | 1.15 [0.95, 1.39] |
| 1.2 Natalizumab IFN vs IFN | 1 | 1171 | Risk Ratio (M‐H, Random, 95% CI) | 1.05 [0.92, 1.19] |
| 1.3 Natalizumab + GA vs GA | 1 | 110 | Risk Ratio (M‐H, Random, 95% CI) | 1.13 [0.63, 2.03] |
| 2 Pain in arms or legs ‐ Arthralgia Show forest plot | 3 | 2220 | Risk Ratio (M‐H, Fixed, 95% CI) | 1.17 [0.98, 1.40] |
| Analysis 5.2  Comparison 5 Adverse Event Analysis, Outcome 2 Pain in arms or legs ‐ Arthralgia. | ||||
| 2.1 Natalizumab vs Placebo | 1 | 939 | Risk Ratio (M‐H, Fixed, 95% CI) | 1.35 [0.98, 1.85] |
| 2.2 Natalizumab + IFN vs IFN | 1 | 1171 | Risk Ratio (M‐H, Fixed, 95% CI) | 1.05 [0.85, 1.31] |
| 2.3 Natalizumab + GA vs GA | 1 | 110 | Risk Ratio (M‐H, Fixed, 95% CI) | 5.0 [0.60, 41.42] |
| 3 Depression Show forest plot | 3 | 2220 | Risk Ratio (M‐H, Random, 95% CI) | 1.18 [0.98, 1.41] |
| Analysis 5.3  Comparison 5 Adverse Event Analysis, Outcome 3 Depression. | ||||
| 3.1 Natalizumab vs Placebo | 1 | 939 | Risk Ratio (M‐H, Random, 95% CI) | 1.18 [0.88, 1.60] |
| 3.2 Natalizumab + IFN vs IFN | 1 | 1171 | Risk Ratio (M‐H, Random, 95% CI) | 1.17 [0.92, 1.47] |
| 3.3 Natalizumab + GA vs GA | 1 | 110 | Risk Ratio (M‐H, Random, 95% CI) | 1.5 [0.26, 8.63] |
| 4 Anxiety Show forest plot | 1 | 1171 | Risk Ratio (M‐H, Random, 95% CI) | 1.49 [1.05, 2.12] |
| Analysis 5.4  Comparison 5 Adverse Event Analysis, Outcome 4 Anxiety. | ||||
| 4.1 Natalizumab + IFN vs IFN | 1 | 1171 | Risk Ratio (M‐H, Random, 95% CI) | 1.49 [1.05, 2.12] |
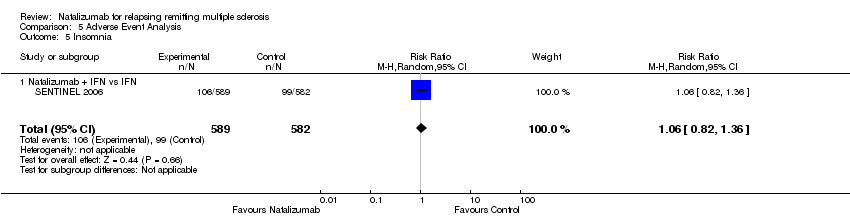
| 5 Insomnia Show forest plot | 1 | 1171 | Risk Ratio (M‐H, Random, 95% CI) | 1.06 [0.82, 1.36] |
| Analysis 5.5  Comparison 5 Adverse Event Analysis, Outcome 5 Insomnia. | ||||
| 5.1 Natalizumab + IFN vs IFN | 1 | 1171 | Risk Ratio (M‐H, Random, 95% CI) | 1.06 [0.82, 1.36] |
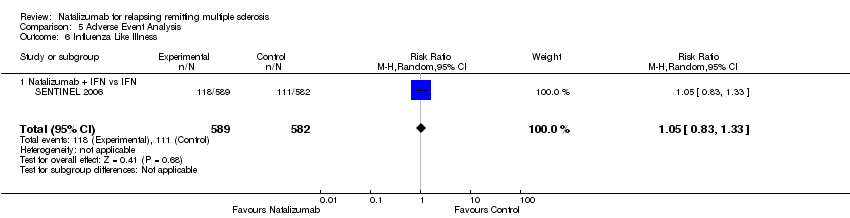
| 6 Influenza Like Illness Show forest plot | 1 | 1171 | Risk Ratio (M‐H, Random, 95% CI) | 1.05 [0.83, 1.33] |
| Analysis 5.6  Comparison 5 Adverse Event Analysis, Outcome 6 Influenza Like Illness. | ||||
| 6.1 Natalizumab + IFN vs IFN | 1 | 1171 | Risk Ratio (M‐H, Random, 95% CI) | 1.05 [0.83, 1.33] |
| 7 Nasopharyngitis Show forest plot | 2 | 1281 | Risk Ratio (M‐H, Fixed, 95% CI) | 1.09 [0.94, 1.26] |
| Analysis 5.7  Comparison 5 Adverse Event Analysis, Outcome 7 Nasopharyngitis. | ||||
| 7.1 Natalizumab + IFN vs IFN | 1 | 1171 | Risk Ratio (M‐H, Fixed, 95% CI) | 1.11 [0.96, 1.29] |
| 7.2 Natalizumab + GA vs GA | 1 | 110 | Risk Ratio (M‐H, Fixed, 95% CI) | 0.64 [0.27, 1.52] |
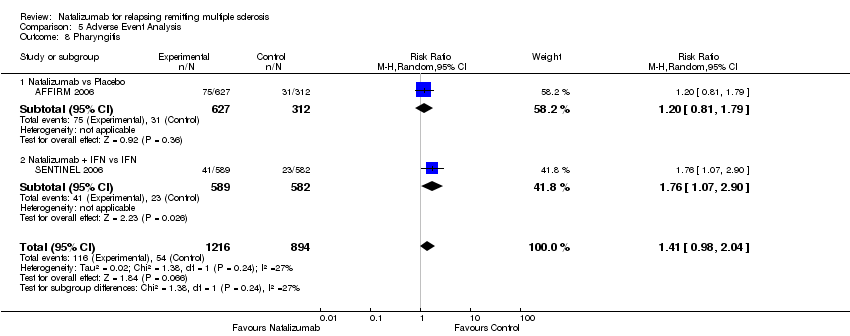
| 8 Pharyngitis Show forest plot | 2 | 2110 | Risk Ratio (M‐H, Random, 95% CI) | 1.41 [0.98, 2.04] |
| Analysis 5.8  Comparison 5 Adverse Event Analysis, Outcome 8 Pharyngitis. | ||||
| 8.1 Natalizumab vs Placebo | 1 | 939 | Risk Ratio (M‐H, Random, 95% CI) | 1.20 [0.81, 1.79] |
| 8.2 Natalizumab + IFN vs IFN | 1 | 1171 | Risk Ratio (M‐H, Random, 95% CI) | 1.76 [1.07, 2.90] |
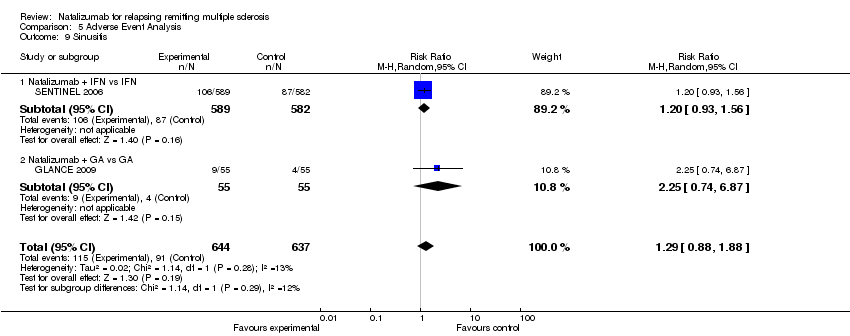
| 9 Sinusitis Show forest plot | 2 | 1281 | Risk Ratio (M‐H, Random, 95% CI) | 1.29 [0.88, 1.88] |
| Analysis 5.9  Comparison 5 Adverse Event Analysis, Outcome 9 Sinusitis. | ||||
| 9.1 Natalizumab + IFN vs IFN | 1 | 1171 | Risk Ratio (M‐H, Random, 95% CI) | 1.20 [0.93, 1.56] |
| 9.2 Natalizumab + GA vs GA | 1 | 110 | Risk Ratio (M‐H, Random, 95% CI) | 2.25 [0.74, 6.87] |
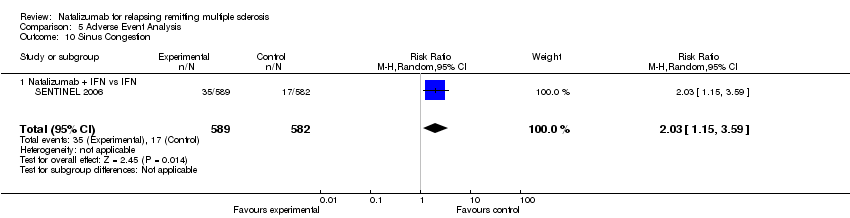
| 10 Sinus Congestion Show forest plot | 1 | 1171 | Risk Ratio (M‐H, Random, 95% CI) | 2.03 [1.15, 3.59] |
| Analysis 5.10  Comparison 5 Adverse Event Analysis, Outcome 10 Sinus Congestion. | ||||
| 10.1 Natalizumab + IFN vs IFN | 1 | 1171 | Risk Ratio (M‐H, Random, 95% CI) | 2.03 [1.15, 3.59] |
| 11 Sinus Headache Show forest plot | 1 | 1171 | Risk Ratio (M‐H, Random, 95% CI) | 1.69 [0.94, 3.03] |
| Analysis 5.11  Comparison 5 Adverse Event Analysis, Outcome 11 Sinus Headache. | ||||
| 11.1 Natalizumab + IFN vs IFN | 1 | 1171 | Risk Ratio (M‐H, Random, 95% CI) | 1.69 [0.94, 3.03] |
| 12 Upper Respiratory Infection Show forest plot | 3 | 2220 | Risk Ratio (M‐H, Random, 95% CI) | 1.05 [0.87, 1.28] |
| Analysis 5.12  Comparison 5 Adverse Event Analysis, Outcome 12 Upper Respiratory Infection. | ||||
| 12.1 Natalizumab vs Placebo | 1 | 939 | Risk Ratio (M‐H, Random, 95% CI) | 1.00 [0.80, 1.26] |
| 12.2 Natalizumab + IFN vs IFN | 1 | 1171 | Risk Ratio (M‐H, Random, 95% CI) | 1.13 [0.76, 1.69] |
| 12.3 Natalizumab + GA vs GA | 1 | 110 | Risk Ratio (M‐H, Random, 95% CI) | 1.8 [0.64, 5.03] |
| 13 Influenza Show forest plot | 1 | 1171 | Risk Ratio (M‐H, Random, 95% CI) | 1.14 [0.87, 1.48] |
| Analysis 5.13  Comparison 5 Adverse Event Analysis, Outcome 13 Influenza. | ||||
| 13.1 Natalizumab + IFN vs IFN | 1 | 1171 | Risk Ratio (M‐H, Random, 95% CI) | 1.14 [0.87, 1.48] |
| 14 Cough Show forest plot | 1 | 1171 | Risk Ratio (M‐H, Random, 95% CI) | 1.24 [0.87, 1.75] |
| Analysis 5.14  Comparison 5 Adverse Event Analysis, Outcome 14 Cough. | ||||
| 14.1 Natalizumab + IFN vs IFN | 1 | 1171 | Risk Ratio (M‐H, Random, 95% CI) | 1.24 [0.87, 1.75] |
| 15 Diarrhea Show forest plot | 1 | 1171 | Risk Ratio (M‐H, Random, 95% CI) | 1.19 [0.93, 1.53] |
| Analysis 5.15  Comparison 5 Adverse Event Analysis, Outcome 15 Diarrhea. | ||||
| 15.1 Natalizumab + IFN vs IFN | 1 | 1171 | Risk Ratio (M‐H, Random, 95% CI) | 1.19 [0.93, 1.53] |
| 16 Nausea Show forest plot | 2 | 1281 | Risk Ratio (M‐H, Random, 95% CI) | 1.13 [0.88, 1.46] |
| Analysis 5.16  Comparison 5 Adverse Event Analysis, Outcome 16 Nausea. | ||||
| 16.1 Natalizumab + IFN vs IFN | 1 | 1171 | Risk Ratio (M‐H, Random, 95% CI) | 1.14 [0.87, 1.48] |
| 16.2 Natalizumab + GA vs GA | 1 | 110 | Risk Ratio (M‐H, Random, 95% CI) | 1.13 [0.47, 2.70] |
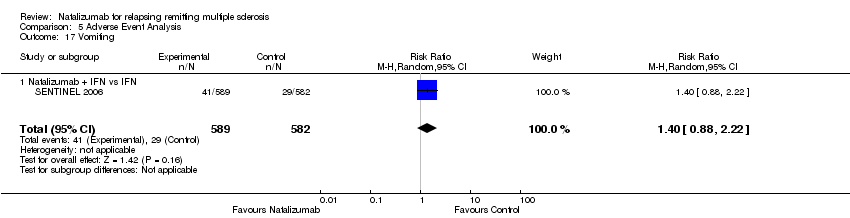
| 17 Vomiting Show forest plot | 1 | 1171 | Risk Ratio (M‐H, Random, 95% CI) | 1.40 [0.88, 2.22] |
| Analysis 5.17  Comparison 5 Adverse Event Analysis, Outcome 17 Vomiting. | ||||
| 17.1 Natalizumab + IFN vs IFN | 1 | 1171 | Risk Ratio (M‐H, Random, 95% CI) | 1.40 [0.88, 2.22] |
| 18 Abdominal Pain or Discomfort Show forest plot | 2 | 2110 | Risk Ratio (M‐H, Random, 95% CI) | 1.14 [0.84, 1.55] |
| Analysis 5.18  Comparison 5 Adverse Event Analysis, Outcome 18 Abdominal Pain or Discomfort. | ||||
| 18.1 Natalizumab vs Placebo | 1 | 939 | Risk Ratio (M‐H, Random, 95% CI) | 1.11 [0.74, 1.65] |
| 18.2 Natalizumab + IFN vs IFN | 1 | 1171 | Risk Ratio (M‐H, Random, 95% CI) | 1.19 [0.74, 1.92] |
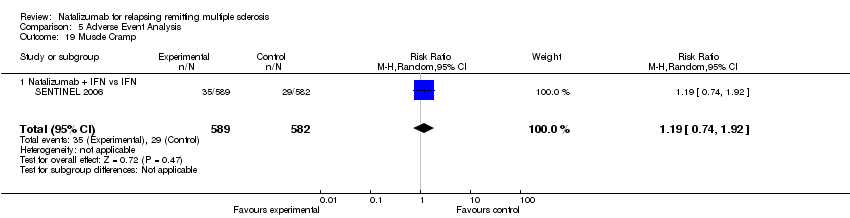
| 19 Muscle Cramp Show forest plot | 1 | 1171 | Risk Ratio (M‐H, Random, 95% CI) | 1.19 [0.74, 1.92] |
| Analysis 5.19  Comparison 5 Adverse Event Analysis, Outcome 19 Muscle Cramp. | ||||
| 19.1 Natalizumab + IFN vs IFN | 1 | 1171 | Risk Ratio (M‐H, Random, 95% CI) | 1.19 [0.74, 1.92] |
| 20 Myalgia Show forest plot | 1 | 1171 | Risk Ratio (M‐H, Random, 95% CI) | 1.31 [0.95, 1.81] |
| Analysis 5.20  Comparison 5 Adverse Event Analysis, Outcome 20 Myalgia. | ||||
| 20.1 Natalizumab + IFN vs IFN | 1 | 1171 | Risk Ratio (M‐H, Random, 95% CI) | 1.31 [0.95, 1.81] |
| 21 Seasonal Allergy Show forest plot | 1 | 1171 | Risk Ratio (M‐H, Random, 95% CI) | 1.50 [0.90, 2.51] |
| Analysis 5.21  Comparison 5 Adverse Event Analysis, Outcome 21 Seasonal Allergy. | ||||
| 21.1 Natalizumab + IFN vs IFN | 1 | 1171 | Risk Ratio (M‐H, Random, 95% CI) | 1.50 [0.90, 2.51] |
| 22 Peripheral Edema Show forest plot | 1 | 1171 | Risk Ratio (M‐H, Random, 95% CI) | 4.78 [2.00, 11.42] |
| Analysis 5.22  Comparison 5 Adverse Event Analysis, Outcome 22 Peripheral Edema. | ||||
| 22.1 Natalizumab + IFN vs IFN | 1 | 1171 | Risk Ratio (M‐H, Random, 95% CI) | 4.78 [2.00, 11.42] |
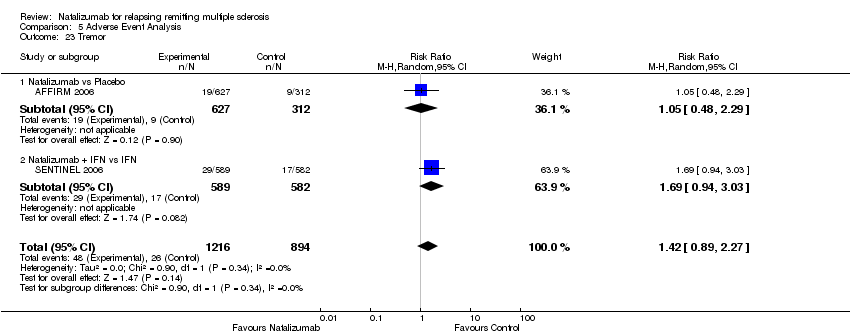
| 23 Tremor Show forest plot | 2 | 2110 | Risk Ratio (M‐H, Random, 95% CI) | 1.42 [0.89, 2.27] |
| Analysis 5.23  Comparison 5 Adverse Event Analysis, Outcome 23 Tremor. | ||||
| 23.1 Natalizumab vs Placebo | 1 | 939 | Risk Ratio (M‐H, Random, 95% CI) | 1.05 [0.48, 2.29] |
| 23.2 Natalizumab + IFN vs IFN | 1 | 1171 | Risk Ratio (M‐H, Random, 95% CI) | 1.69 [0.94, 3.03] |
| 24 Flushing Show forest plot | 1 | 110 | Risk Ratio (M‐H, Random, 95% CI) | 6.00 [0.75, 48.21] |
| Analysis 5.24  Comparison 5 Adverse Event Analysis, Outcome 24 Flushing. | ||||
| 24.1 Natalizumab GA vs GA | 1 | 110 | Risk Ratio (M‐H, Random, 95% CI) | 6.00 [0.75, 48.21] |
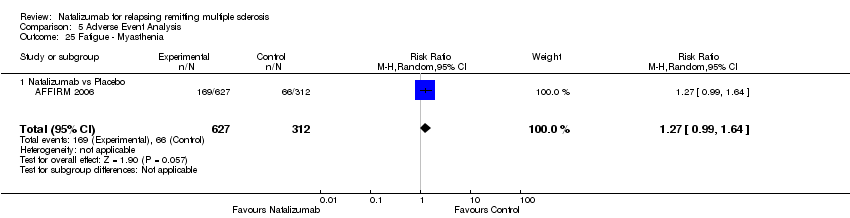
| 25 Fatigue ‐ Myasthenia Show forest plot | 1 | 939 | Risk Ratio (M‐H, Random, 95% CI) | 1.27 [0.99, 1.64] |
| Analysis 5.25  Comparison 5 Adverse Event Analysis, Outcome 25 Fatigue ‐ Myasthenia. | ||||
| 25.1 Natalizumab vs Placebo | 1 | 939 | Risk Ratio (M‐H, Random, 95% CI) | 1.27 [0.99, 1.64] |
| 26 Urinary Urgency / Frequency Show forest plot | 1 | 939 | Risk Ratio (M‐H, Random, 95% CI) | 1.27 [0.79, 2.03] |
| Analysis 5.26  Comparison 5 Adverse Event Analysis, Outcome 26 Urinary Urgency / Frequency. | ||||
| 26.1 Natalizumab vs Placebo | 1 | 939 | Risk Ratio (M‐H, Random, 95% CI) | 1.27 [0.79, 2.03] |
| 27 Hypersensitivity reactions Show forest plot | 3 | 2220 | Risk Ratio (M‐H, Random, 95% CI) | 3.43 [0.33, 36.07] |
| Analysis 5.27  Comparison 5 Adverse Event Analysis, Outcome 27 Hypersensitivity reactions. | ||||
| 27.1 Natalizumab vs Placebo | 1 | 939 | Risk Ratio (M‐H, Random, 95% CI) | 25.42 [1.55, 416.15] |
| 27.2 Natalizumab + IFN vs IFN | 1 | 1171 | Risk Ratio (M‐H, Random, 95% CI) | 5.43 [1.21, 24.41] |
| 27.3 Natalizumab GA vs GA | 1 | 110 | Risk Ratio (M‐H, Random, 95% CI) | 0.2 [0.01, 4.07] |
| 28 Chest Discomfort Show forest plot | 1 | 939 | Risk Ratio (M‐H, Random, 95% CI) | 1.71 [0.83, 3.56] |
| Analysis 5.28  Comparison 5 Adverse Event Analysis, Outcome 28 Chest Discomfort. | ||||
| 28.1 Natalizumab vs Placebo | 1 | 939 | Risk Ratio (M‐H, Random, 95% CI) | 1.71 [0.83, 3.56] |
| 29 Local Bleeding Show forest plot | 1 | 939 | Risk Ratio (M‐H, Random, 95% CI) | 1.58 [0.64, 3.91] |
| Analysis 5.29  Comparison 5 Adverse Event Analysis, Outcome 29 Local Bleeding. | ||||
| 29.1 Natalizumab vs Placebo | 1 | 939 | Risk Ratio (M‐H, Random, 95% CI) | 1.58 [0.64, 3.91] |
| 30 Rigors Show forest plot | 2 | 1049 | Risk Ratio (M‐H, Random, 95% CI) | 3.54 [1.16, 10.83] |
| Analysis 5.30  Comparison 5 Adverse Event Analysis, Outcome 30 Rigors. | ||||
| 30.1 Natalizumab vs Placebo | 1 | 939 | Risk Ratio (M‐H, Random, 95% CI) | 3.15 [0.94, 10.57] |
| 30.2 Natalizumab GA vs GA | 1 | 110 | Risk Ratio (M‐H, Random, 95% CI) | 7.0 [0.37, 132.40] |
| 31 Syncope Show forest plot | 1 | 939 | Risk Ratio (M‐H, Random, 95% CI) | 1.05 [0.48, 2.29] |
| Analysis 5.31  Comparison 5 Adverse Event Analysis, Outcome 31 Syncope. | ||||
| 31.1 Natalizumab vs Placebo | 1 | 939 | Risk Ratio (M‐H, Random, 95% CI) | 1.05 [0.48, 2.29] |
| 32 Urinary Infection Show forest plot | 2 | 1049 | Risk Ratio (M‐H, Random, 95% CI) | 0.99 [0.51, 1.93] |
| Analysis 5.32  Comparison 5 Adverse Event Analysis, Outcome 32 Urinary Infection. | ||||
| 32.1 Natalizumab vs Placebo | 1 | 939 | Risk Ratio (M‐H, Random, 95% CI) | 1.17 [0.88, 1.57] |
| 32.2 Natalizumab GA vs GA | 1 | 110 | Risk Ratio (M‐H, Random, 95% CI) | 0.5 [0.13, 1.90] |
| 33 Lower Respiratory Infection Show forest plot | 1 | 939 | Risk Ratio (M‐H, Random, 95% CI) | 1.06 [0.78, 1.45] |
| Analysis 5.33  Comparison 5 Adverse Event Analysis, Outcome 33 Lower Respiratory Infection. | ||||
| 33.1 Natalizumab vs Placebo | 1 | 939 | Risk Ratio (M‐H, Random, 95% CI) | 1.06 [0.78, 1.45] |
| 34 Tonsillitis Show forest plot | 1 | 939 | Risk Ratio (M‐H, Random, 95% CI) | 1.37 [0.78, 2.39] |
| Analysis 5.34  Comparison 5 Adverse Event Analysis, Outcome 34 Tonsillitis. | ||||
| 34.1 Natalizumab vs Placebo | 1 | 939 | Risk Ratio (M‐H, Random, 95% CI) | 1.37 [0.78, 2.39] |
| 35 Gastroenteritis Show forest plot | 1 | 939 | Risk Ratio (M‐H, Random, 95% CI) | 1.23 [0.81, 1.86] |
| Analysis 5.35  Comparison 5 Adverse Event Analysis, Outcome 35 Gastroenteritis. | ||||
| 35.1 Natalizumab vs Placebo | 1 | 939 | Risk Ratio (M‐H, Random, 95% CI) | 1.23 [0.81, 1.86] |
| 36 Vaginitis Show forest plot | 1 | 939 | Risk Ratio (M‐H, Random, 95% CI) | 1.65 [1.01, 2.71] |
| Analysis 5.36  Comparison 5 Adverse Event Analysis, Outcome 36 Vaginitis. | ||||
| 36.1 Natalizumab vs Placebo | 1 | 939 | Risk Ratio (M‐H, Random, 95% CI) | 1.65 [1.01, 2.71] |
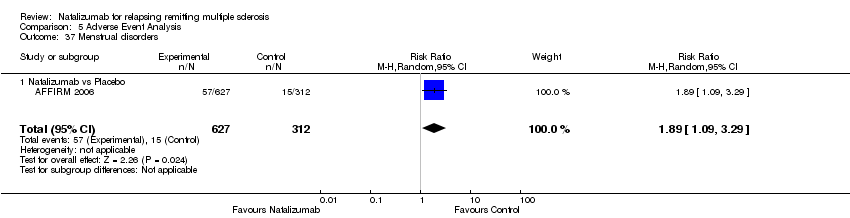
| 37 Menstrual disorders Show forest plot | 1 | 939 | Risk Ratio (M‐H, Random, 95% CI) | 1.89 [1.09, 3.29] |
| Analysis 5.37  Comparison 5 Adverse Event Analysis, Outcome 37 Menstrual disorders. | ||||
| 37.1 Natalizumab vs Placebo | 1 | 939 | Risk Ratio (M‐H, Random, 95% CI) | 1.89 [1.09, 3.29] |
| 38 Skin Rash Show forest plot | 2 | 1049 | Risk Ratio (M‐H, Random, 95% CI) | 1.94 [0.47, 7.99] |
| Analysis 5.38  Comparison 5 Adverse Event Analysis, Outcome 38 Skin Rash. | ||||
| 38.1 Natalizumab vs Placebo | 1 | 939 | Risk Ratio (M‐H, Random, 95% CI) | 1.23 [0.81, 1.86] |
| 38.2 Natalizumab + GA vs GA | 1 | 110 | Risk Ratio (M‐H, Random, 95% CI) | 6.00 [0.75, 48.21] |
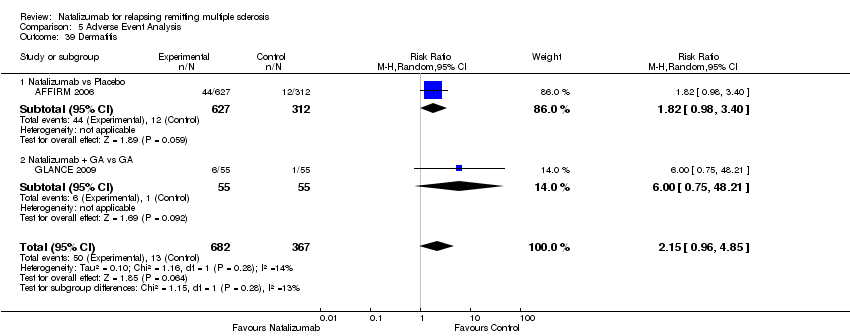
| 39 Dermatitis Show forest plot | 2 | 1049 | Risk Ratio (M‐H, Random, 95% CI) | 2.15 [0.96, 4.85] |
| Analysis 5.39  Comparison 5 Adverse Event Analysis, Outcome 39 Dermatitis. | ||||
| 39.1 Natalizumab vs Placebo | 1 | 939 | Risk Ratio (M‐H, Random, 95% CI) | 1.82 [0.98, 3.40] |
| 39.2 Natalizumab + GA vs GA | 1 | 110 | Risk Ratio (M‐H, Random, 95% CI) | 6.00 [0.75, 48.21] |
| 40 Pruritus Show forest plot | 1 | 939 | Risk Ratio (M‐H, Random, 95% CI) | 2.07 [0.86, 5.00] |
| Analysis 5.40  Comparison 5 Adverse Event Analysis, Outcome 40 Pruritus. | ||||
| 40.1 Natalizumab vs Placebo | 1 | 939 | Risk Ratio (M‐H, Random, 95% CI) | 2.07 [0.86, 5.00] |
| 41 Vertigo Show forest plot | 1 | 939 | Risk Ratio (M‐H, Random, 95% CI) | 1.18 [0.67, 2.09] |
| Analysis 5.41  Comparison 5 Adverse Event Analysis, Outcome 41 Vertigo. | ||||
| 41.1 Natalizumab vs Placebo | 1 | 939 | Risk Ratio (M‐H, Random, 95% CI) | 1.18 [0.67, 2.09] |
| 42 Infection Show forest plot | 3 | 2220 | Risk Ratio (M‐H, Random, 95% CI) | 1.01 [0.97, 1.06] |
| Analysis 5.42  Comparison 5 Adverse Event Analysis, Outcome 42 Infection. | ||||
| 42.1 Natalizumab vs Placebo | 1 | 939 | Risk Ratio (M‐H, Random, 95% CI) | 1.00 [0.93, 1.07] |
| 42.2 Natalizumab + IFN vs IFN | 1 | 1171 | Risk Ratio (M‐H, Random, 95% CI) | 1.03 [0.97, 1.08] |
| 42.3 Natalizumab + GA vs GA | 1 | 110 | Risk Ratio (M‐H, Random, 95% CI) | 0.92 [0.69, 1.22] |
| 43 Infusion reactions Show forest plot | 3 | 2220 | Risk Ratio (M‐H, Random, 95% CI) | 1.24 [1.05, 1.47] |
| Analysis 5.43  Comparison 5 Adverse Event Analysis, Outcome 43 Infusion reactions. | ||||
| 43.1 Natalizumab vs Placebo | 1 | 939 | Risk Ratio (M‐H, Random, 95% CI) | 1.34 [1.01, 1.77] |
| 43.2 Natalizumab + IFN vs IFN | 1 | 1171 | Risk Ratio (M‐H, Random, 95% CI) | 1.20 [0.97, 1.49] |
| 43.3 Natalizumab + GA vs GA | 1 | 110 | Risk Ratio (M‐H, Random, 95% CI) | 0.86 [0.31, 2.39] |
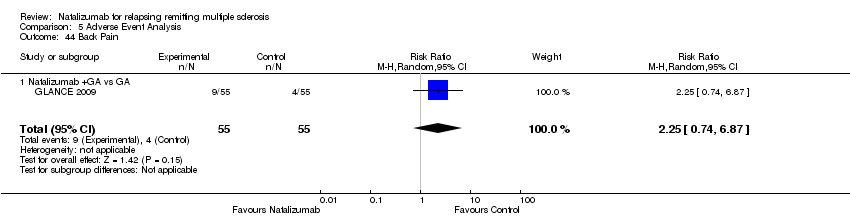
| 44 Back Pain Show forest plot | 1 | 110 | Risk Ratio (M‐H, Random, 95% CI) | 2.25 [0.74, 6.87] |
| Analysis 5.44  Comparison 5 Adverse Event Analysis, Outcome 44 Back Pain. | ||||
| 44.1 Natalizumab +GA vs GA | 1 | 110 | Risk Ratio (M‐H, Random, 95% CI) | 2.25 [0.74, 6.87] |
| 45 Fall Show forest plot | 2 | 2110 | Risk Ratio (M‐H, Random, 95% CI) | 2.69 [0.32, 22.39] |
| Analysis 5.45  Comparison 5 Adverse Event Analysis, Outcome 45 Fall. | ||||
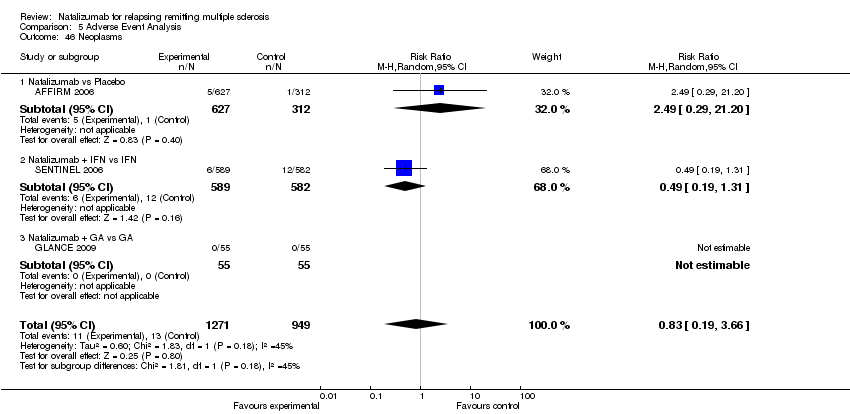
| 46 Neoplasms Show forest plot | 3 | 2220 | Risk Ratio (M‐H, Random, 95% CI) | 0.83 [0.19, 3.66] |
| Analysis 5.46  Comparison 5 Adverse Event Analysis, Outcome 46 Neoplasms. | ||||
| 46.1 Natalizumab vs Placebo | 1 | 939 | Risk Ratio (M‐H, Random, 95% CI) | 2.49 [0.29, 21.20] |
| 46.2 Natalizumab + IFN vs IFN | 1 | 1171 | Risk Ratio (M‐H, Random, 95% CI) | 0.49 [0.19, 1.31] |
| 46.3 Natalizumab + GA vs GA | 1 | 110 | Risk Ratio (M‐H, Random, 95% CI) | 0.0 [0.0, 0.0] |
| 47 Abnormal liver function tests Show forest plot | 1 | 939 | Risk Ratio (M‐H, Random, 95% CI) | 1.29 [0.67, 2.47] |
| Analysis 5.47  Comparison 5 Adverse Event Analysis, Outcome 47 Abnormal liver function tests. | ||||
| 47.1 Natalizumab vs Placebo | 1 | 939 | Risk Ratio (M‐H, Random, 95% CI) | 1.29 [0.67, 2.47] |
| 48 Death Show forest plot | 3 | 2220 | Risk Ratio (M‐H, Random, 95% CI) | 0.92 [0.14, 6.04] |
| Analysis 5.48  Comparison 5 Adverse Event Analysis, Outcome 48 Death. | ||||
| 48.1 Natalizumab vs Placebo | 1 | 939 | Risk Ratio (M‐H, Random, 95% CI) | 2.49 [0.12, 51.75] |
| 48.2 Natalizumab + GA vs GA | 1 | 110 | Risk Ratio (M‐H, Random, 95% CI) | 0.0 [0.0, 0.0] |
| 48.3 Natalizumab + IFN vs IFN | 1 | 1171 | Risk Ratio (M‐H, Random, 95% CI) | 0.49 [0.04, 5.43] |
| 49 MS relapse as a serious AE Show forest plot | 3 | 2220 | Risk Ratio (M‐H, Random, 95% CI) | 0.50 [0.37, 0.68] |
| Analysis 5.49  Comparison 5 Adverse Event Analysis, Outcome 49 MS relapse as a serious AE. | ||||
| 49.1 Natalizumab vs Placebo | 1 | 939 | Risk Ratio (M‐H, Random, 95% CI) | 0.46 [0.30, 0.70] |
| 49.2 Natalizumab + IFN vs IFN | 1 | 1171 | Risk Ratio (M‐H, Random, 95% CI) | 0.55 [0.36, 0.86] |
| 49.3 Natalizumab + GA vs GA | 1 | 110 | Risk Ratio (M‐H, Random, 95% CI) | 0.33 [0.01, 8.01] |

Methodological quality graph: review authors' judgements on each methodological quality item presented as percentages across all included studies.

Methodological quality summary: review authors' judgements on each methodological quality item for each included study.
Comparison 1 Primary Efficacy Outcome (Natalizumab vs Control), Outcome 1 N of pts with at least one relapse at 2 yrs.

Comparison 1 Primary Efficacy Outcome (Natalizumab vs Control), Outcome 2 N of pts who progressed at 2 yrs.

Comparison 1 Primary Efficacy Outcome (Natalizumab vs Control), Outcome 3 PCS Change in Short Form (SF‐36) follow up 2 years.

Comparison 1 Primary Efficacy Outcome (Natalizumab vs Control), Outcome 4 MCS Change in Short Form (SF‐36) follow up 2 years.
Comparison 2 Secondary Efficacy Outcome (Natalizumab vs Control), Outcome 1 Change in Well‐being (VAS) at 2 yrs.

Comparison 2 Secondary Efficacy Outcome (Natalizumab vs Control), Outcome 2 Gd‐enhacing lesion (at least one) at 2 yrs.
Comparison 2 Secondary Efficacy Outcome (Natalizumab vs Control), Outcome 3 Change of MRI T2 total lesion load at 2 yrs.

Comparison 3 Primary Safety Outcome (Natalizumab vs Control), Outcome 1 N of pts with Severe AE over 2 yrs.

Comparison 3 Primary Safety Outcome (Natalizumab vs Control), Outcome 2 N of pts with Serious AE (irrespective of treatment duration).

Comparison 3 Primary Safety Outcome (Natalizumab vs Control), Outcome 3 N of pts with serious AE (irrespective of treatment duration ‐ MS relapses excluded).

Comparison 4 Secondary Safety Outcome (Natalizumab vs Control), Outcome 1 N of pts with at least one AE (irrespective of treatment duration).

Comparison 4 Secondary Safety Outcome (Natalizumab vs Control), Outcome 2 Treatment Discontinuation caused by AE (irrespective of treatment duration).
Comparison 5 Adverse Event Analysis, Outcome 1 Headache.

Comparison 5 Adverse Event Analysis, Outcome 2 Pain in arms or legs ‐ Arthralgia.

Comparison 5 Adverse Event Analysis, Outcome 3 Depression.

Comparison 5 Adverse Event Analysis, Outcome 4 Anxiety.
Comparison 5 Adverse Event Analysis, Outcome 5 Insomnia.
Comparison 5 Adverse Event Analysis, Outcome 6 Influenza Like Illness.

Comparison 5 Adverse Event Analysis, Outcome 7 Nasopharyngitis.
Comparison 5 Adverse Event Analysis, Outcome 8 Pharyngitis.
Comparison 5 Adverse Event Analysis, Outcome 9 Sinusitis.
Comparison 5 Adverse Event Analysis, Outcome 10 Sinus Congestion.

Comparison 5 Adverse Event Analysis, Outcome 11 Sinus Headache.

Comparison 5 Adverse Event Analysis, Outcome 12 Upper Respiratory Infection.

Comparison 5 Adverse Event Analysis, Outcome 13 Influenza.

Comparison 5 Adverse Event Analysis, Outcome 14 Cough.

Comparison 5 Adverse Event Analysis, Outcome 15 Diarrhea.

Comparison 5 Adverse Event Analysis, Outcome 16 Nausea.
Comparison 5 Adverse Event Analysis, Outcome 17 Vomiting.

Comparison 5 Adverse Event Analysis, Outcome 18 Abdominal Pain or Discomfort.
Comparison 5 Adverse Event Analysis, Outcome 19 Muscle Cramp.

Comparison 5 Adverse Event Analysis, Outcome 20 Myalgia.

Comparison 5 Adverse Event Analysis, Outcome 21 Seasonal Allergy.

Comparison 5 Adverse Event Analysis, Outcome 22 Peripheral Edema.
Comparison 5 Adverse Event Analysis, Outcome 23 Tremor.

Comparison 5 Adverse Event Analysis, Outcome 24 Flushing.
Comparison 5 Adverse Event Analysis, Outcome 25 Fatigue ‐ Myasthenia.

Comparison 5 Adverse Event Analysis, Outcome 26 Urinary Urgency / Frequency.

Comparison 5 Adverse Event Analysis, Outcome 27 Hypersensitivity reactions.

Comparison 5 Adverse Event Analysis, Outcome 28 Chest Discomfort.

Comparison 5 Adverse Event Analysis, Outcome 29 Local Bleeding.

Comparison 5 Adverse Event Analysis, Outcome 30 Rigors.

Comparison 5 Adverse Event Analysis, Outcome 31 Syncope.

Comparison 5 Adverse Event Analysis, Outcome 32 Urinary Infection.

Comparison 5 Adverse Event Analysis, Outcome 33 Lower Respiratory Infection.

Comparison 5 Adverse Event Analysis, Outcome 34 Tonsillitis.

Comparison 5 Adverse Event Analysis, Outcome 35 Gastroenteritis.

Comparison 5 Adverse Event Analysis, Outcome 36 Vaginitis.
Comparison 5 Adverse Event Analysis, Outcome 37 Menstrual disorders.

Comparison 5 Adverse Event Analysis, Outcome 38 Skin Rash.
Comparison 5 Adverse Event Analysis, Outcome 39 Dermatitis.

Comparison 5 Adverse Event Analysis, Outcome 40 Pruritus.

Comparison 5 Adverse Event Analysis, Outcome 41 Vertigo.

Comparison 5 Adverse Event Analysis, Outcome 42 Infection.

Comparison 5 Adverse Event Analysis, Outcome 43 Infusion reactions.
Comparison 5 Adverse Event Analysis, Outcome 44 Back Pain.

Comparison 5 Adverse Event Analysis, Outcome 45 Fall.
Comparison 5 Adverse Event Analysis, Outcome 46 Neoplasms.

Comparison 5 Adverse Event Analysis, Outcome 47 Abnormal liver function tests.

Comparison 5 Adverse Event Analysis, Outcome 48 Death.

Comparison 5 Adverse Event Analysis, Outcome 49 MS relapse as a serious AE.
| ABBREVIATION | TERM |
| AIFA | Agenzia Italiana Farmaco |
| CD | Crohn Disease |
| CDER | Center for drug evaluation and research (FDA) |
| CI | Confidence Interval |
| CNS | Central Nervous System |
| CIS | Clinically Isolated Syndrome |
| DMDs | Disease‐Modifying Drugs |
| EDSS | Expanded Disability Status Scale |
| EMA | European Medicines Agency |
| FDA | Food and Drug Administration |
| GA | Glatiramer Acetate (Copaxone®) |
| Gd+ | Gadolinium enhancing lesion in MRI |
| HRQoL | Health Related Quality of Life |
| HSRs | hypersensitivity reactions |
| IFNß | Interferon beta |
| IFNß‐1a | Interferon beta‐1a |
| IgG | Immunoglobulin G |
| IRIS | Immune reconstitution inflammatory syndrome |
| ITT | intention‐to‐treat |
| IV | intravenous |
| MCS | Mental Component Summary (composite scores of SF‐36) |
| MD | mean difference |
| MFIS | Modified Fatigue Impact Scale |
| MSFC | Multiple Sclerosis Functional Composite |
| MRI | Magnetic resonance imaging |
| MS | Multiple Sclerosis |
| N | number |
| n.a. | not available |
| NICE | National Institute for Clinical Excellence |
| NNB | Number Needed to Benefit |
| NNH | Number Needed to Harm |
| NNT | Number Needed to Treat |
| NTZ | natalizumab |
| PASAT | Paced Auditory Serial Addition Task (one of the components of MSFC) |
| PCS | Physical Component Summary (composite scores of SF‐36) |
| PML | Progressive Multifocal Leukoencephalopathy |
| QoL | Quality of Life |
| SF‐36 | Short Form 36 |
| VAS | Visual Analog Scale |
| Characteristic | Patients randomised to NTZ (with or without IFNß‐1a) (n=1216) | Patients randomised to placebo or IFNß‐1a alone (n=897) | Total (n= 2113) |
| Age range | 18–55 | 19–55 | 18–55 |
| Sex N of male: N of female | 325:891 | 266:631 | 591:1522 |
| Disease duration* ‐ years (range) | 1‐41 | 1‐34 | |
| N of patients with 1 relapse in previous 1 yr (% of total) | 758 | 537 | 1295 (61) |
| N of patients with ≥ 2 relapse in previous 1 yr (% of total) | 450 | 353 | 803 (38) |
| N of patients with EDSS ≤ 3.5 (% of total) | 1056 | 769 | 1825 |
| N of patients with EDSS > 3.5 (% of total) | 160 | 128 | 288 |
| N of patients with 0 Gd+ (% of total) | 699 | 544 | 1243 |
| N of patients with ≥ 1 Gd+ (% of total) | 511 | 348 | 859 (41) |
| Duration ≥ 10 months of previous IFNß‐1a therapy (% of total) | 589 | 582 | 1171 (55) |
| *Definition of disease duration (from the onset? form the diagnosis?) was not available for AFFIRM and SENTINEL trials. We used time since first MS symptoms for participants in GLANCE trial. | |||
| Type of protocol violation | N of violations in NTZ group | N of patients with at least one protocol violation in NTZ group | N of violations in control group | N of patients with at least one protocol violation in control group | Total N of violations in all randomised patients | Total N of patients with at least one protocol violation in all randomised patients | Details | Reference |
| Inclusion criteria: diagnosis of relapsing multiple sclerosis according to McDonald criteria | 9 | 9 | 4 | 4 | 13 | 13 (1.4%) | These patients only satisfied CIS criteria | Polman 2006 AFFIRM 2006 |
| Inclusion criteria: at least one medically documented relapse within 12 months before randomisation | 6 | 6 (1%) | 6 | 6 (2%) | 12 | 12 (1.3%) | No relapse in previous year | Polman 2006 AFFIRM 2006 |
| Prohibited concomitant medication | 29 | 22 (3.5%) | 17 | 11 (3.5%) | 46 | 33 (3.5%) | Only data from the first year of study is reported. Data for all the duration of the trial is not available. Medications prohibited: cyclophosphamide, mitoxantrone IFNß, | Center for drug evaluation and research. Medical Review. November 23, 2004‐ Drug Approval Package ‐ http://www.accessdata.fda.gov/drugsatfda_docs/nda/2004/125104s000_Natalizumab.cfm |
| Other eligibility criteria | 58 | 46 (7.3%) | 27 | 21 (6.7%) | 85 | 67 (7.1%) | Only data from the first year of study is reported. Data for all the duration of the trial is not available. No other detail is available. | Center for drug evaluation and research. Medical Review November 23, 2004 ‐ Drug Approval Package ‐ http://www.accessdata.fda.gov/drugsatfda_docs/nda/2004/125104s000_Natalizumab.cfm |
| Missed, partial or incorrect dosing | 323 | 144 (23.0%) | 145 | 77 (24.4%) | 468 | 221 (23.4%) | Only data from the first year of study is reported. Data for all the duration of the trial is not available. No other detail is available. | Center for drug evaluation and research. Medical Review. November 23, 2004 ‐ Drug Approval Package ‐ http://www.accessdata.fda.gov/drugsatfda_docs/nda/2004/125104s000_Natalizumab.cfm |
| Efficacy evaluation not performed or not valid | 104 | 73 (11.6%) | 60 | 45 (14.3%) | 164 | 118 (12.5%) | Only data from the first year of study is reported. Data for all the duration of the trial is not available. No other detail is available. | Center for drug evaluation and research. Medical Review. November 23, 2004 ‐ Drug Approval Package ‐ http://www.accessdata.fda.gov/drugsatfda_docs/nda/2004/125104s000_Natalizumab.cfm |
| Safety evaluation not performed or not valid | 162 | 103 (16.4%) | 95 | 53 (16.8%) | 257 | 156 (16.6%) | Only data from the first year of study is reported. Data for all the duration of the trial is not available. No other detail is available. | Center for drug evaluation and research. Medical Review. November 23, 2004 ‐ Drug Approval Package ‐ http://www.accessdata.fda.gov/drugsatfda_docs/nda/2004/125104s000_Natalizumab.cfm |
| Outside acceptable visit window | 1239 | 406 (64.8%) | 692 | 218 (69.2) | 1931 | 624 (66.2%) | Only data from the first year of study are reported. Data for all the duration of the trial are not available. No other detail is available. | Center for drug evaluation and research. Medical Review. November 23, 2004 ‐ Drug Approval Package ‐ http://www.accessdata.fda.gov/drugsatfda_docs/nda/2004/125104s000_Natalizumab.cfm |
| Missed study visit | 38 | 25 (4.0%) | 22 | 13 (4.1%) | 60 | 38 (4.0%) | Only data from the first year of study is reported. Data for all the duration of the trial is not available. No other detail is available. | Center for drug evaluation and research. Medical Review. November 23, 2004 ‐ Drug Approval Package ‐ http://www.accessdata.fda.gov/drugsatfda_docs/nda/2004/125104s000_Natalizumab.cfm |
| Discontinuation of study treatment in patients who had HSRs | 2 | 2 | 0 | 0 | 2 | 2 (≺1%) | Two NTZ patients were redosed after experiencing a hypersensitivity reaction (per protocol, study drug was | Phillips 2006 AFFIRM 2006 |
| Missed MRI scan | n.a. | n.a. | n.a. | n.a. | n.a. | 87 (9.0%) | According to Miller and collaborators the main reason for missing data (>80%) was the scan not being performed because the patient withdrew from the study; in the remainder (<20%), although the patient was still in the study, the scan was either not performed, had not been received at the Central MRI Analysis Center, or had been received but was of inadequate quality for analysis. | Miller 2007 AFFIRM 2006 |
| Other (according to the Center for drug evaluation and research) | 996 | 401 (63.9%) | 529 | 208 (66.0%) | 1525 | 609 (64.6%) | Only data from the first year of study is reported. Data for all the duration of the trial is not available. No other detail is available. | Center for drug evaluation and research. Medical Review. November 23, 2004 ‐ Drug Approval Package ‐ http://www.accessdata.fda.gov/drugsatfda_docs/nda/2004/125104s000_Natalizumab.cfm |
| All violations according to the Center for drug evaluation and research | 2955 | 554 (88.4%) | 1593 | 291 (92.4%) | 4548 | 845 | Only data from the first year of study is reported. Data for all the duration of the trial is not available. | Center for drug evaluation and research. Medical Review. November 23, 2004 ‐ Drug Approval Package ‐ http://www.accessdata.fda.gov/drugsatfda_docs/nda/2004/125104s000_Natalizumab.cfm |
| Type of protocol violation | N of violations in NTZ group | N of patients with at least one protocol violation in NTZ group | N of violations in control group | N of patients with at least one protocol violation in control group | Total N of violations in all randomised patients | Total N of patients with at least one protocol violation in all randomised patients | Details | Reference |
| Incusion criteria: at least one medically documented relapse within 12 months before randomisation. | n.a. | n.a. | n.a. | n.a. | n.a. | n.a. | the minimum of N of relapses in previous 12 mo is 0 In the baseline characteristics of NTZ + GA group (i.e. at least one patient was included with no relapse in previous 12 mo) | Goodman 2009 GLANCE 2009 |
| Other | n.a. | n.a. | n.a. | n.a. | n.a. | n.a. | n.a. |
| Type of protocol violation | N of violations in NTZ group | N of patients with at least one protocol violation in NTZ group | N of violations in control group | N of patients with at least one protocol violation in control group | Total N of violations in all randomised patients | Total N of patients with at least one protocol violation in all randomised patients | Details | Reference |
| Inclusion criteria: at least one medically documented relapse within 12 months before randomisation | 0 | 0 | 1 | 1 (≺1%) | 1 | 1 (≺1%) | no relapse in past 12 mo. | Rudick 2006 SENTINEL 2006 |
| Prohibited concomitant medication | 69 | 55 (9.3%) | 72 | 53 (9.1%) | 141 | 108 (9.2%) | Only data from the first year of study is reported. Data for all the duration of the trial is not available. Medications prohibited: any approved disease modifying therapy other than IFNß‐1a im once a week, experimental drugs. | Center for drug evaluation and research. Medical Review. November 23, 2004 ‐ Drug Approval Package ‐ http://www.accessdata.fda.gov/drugsatfda_docs/nda/2004/125104s000_Natalizumab.cfm |
| Other eligibility criteria | 88 | 70 (11.9%) | 87 | 66 (11.3%) | 175 | 136 (11.6%) | Only data from the first year of study is reported. Data for all the duration of the trial is not available. No other detail is available. | Center for drug evaluation and research. Medical Review. November 23, 2004 ‐ Drug Approval Package ‐ http://www.accessdata.fda.gov/drugsatfda_docs/nda/2004/125104s000_Natalizumab.cfm |
| Missed, partial or incorrect dosing | 868 | 306 (52.0%) | 918 | 310 (53.3%) | 1786 | 616 (52.6%) | Only data from the first year of study is reported. Data for all the duration of the trial is not available. No other detail is available. | Center for drug evaluation and research. Medical Review. November 23, 2004 ‐ Drug Approval Package ‐ http://www.accessdata.fda.gov/drugsatfda_docs/nda/2004/125104s000_Natalizumab.cfm |
| Efficay evaluation not performed or not valid | 189 | 113 (19.2%) | 197 | 107 (18.4%) | 386 | 220 (18.8%) | Only data from the first year of study is reported. Data for all the duration of the trial is not available. No other detail is available. | Center for drug evaluation and research. Medical Review. November 23, 2004 ‐ Drug Approval Package ‐ http://www.accessdata.fda.gov/drugsatfda_docs/nda/2004/125104s000_Natalizumab.cfm |
| Safety evaluation not performed or not valid | 185 | 101 (17.1%) | 213 | 120 (20.6%) | 398 | 221 (18.9%) | Only data from the first year of study is reported. Data for all the duration of the trial is not available. No other detail is available. | Center for drug evaluation and research. Medical Review. November 23, 2004 ‐ Drug Approval Package ‐ http://www.accessdata.fda.gov/drugsatfda_docs/nda/2004/125104s000_Natalizumab.cfm |
| Outside acceptable visit window | 1423 | 418 (71.0%) | 1504 | 430 (73.9%) | 2927 | 848 (72.4%) | Only data from the first year of study is reported. Data for all the duration of the trial is not available. No other detail is available. | Center for drug evaluation and research. Medical Review. November 23, 2004 ‐ Drug Approval Package ‐ http://www.accessdata.fda.gov/drugsatfda_docs/nda/2004/125104s000_Natalizumab.cfm |
| Missed study visit | 39 | 29 (4.9%) | 54 | 39 (6.7%) | 93 | 68 (5.8%) | Only data from the first year of study is reported. Data for all the duration of the trial is not available. No other detail is available. | Center for drug evaluation and research. Medical Review. November 23, 2004 ‐ Drug Approval Package ‐ http://www.accessdata.fda.gov/drugsatfda_docs/nda/2004/125104s000_Natalizumab.cfm |
| Other (according to the Center for drug evaluation and research) | 1639 | 411 (69.8%) | 1799 | 425 (73.0%) | 3438 | 836 (71.4%) | Only data from the first year of study is reported. Data for all the duration of the trial is not available. No other detail is available. | Center for drug evaluation and research. Medical Review. November 23, 2004 ‐ Drug Approval Package ‐ http://www.accessdata.fda.gov/drugsatfda_docs/nda/2004/125104s000_Natalizumab.cfm |
| All violations according to the Center for drug evaluation and research | 4500 | 569 (96.6%) | 4855 | 568 (97.6%) | 9355 | 1137 (97.1%) | Center for drug evaluation and research. Medical Review. November 23, 2004 ‐ Drug Approval Package ‐ http://www.accessdata.fda.gov/drugsatfda_docs/nda/2004/125104s000_Natalizumab.cfm |
| Study label | Phase | Aims | Population | Design | Dose regimen | N of participants | Duration | Planned N of doses | Outcome measures | Main references |
| 200 | 1 | Safety Tolerability | RRMS and SPMS subjects | Randomised, Double‐blind, Placebo‐controlled, Dose‐escalation | 0.03 (n=3) ‐ 0.1 (n=3) 0.3 (n=3) 1.0 (n=6) 3.0 (n=6) mg/Kg; (placebo n=7) | 28 | n.a. | 1 | Safety Tolerability | |
| 221 | 1 | Safety Pharmacokinetics Pharmacodynamics | RRMS and SPMS subjects | Randomised, Placebo‐controlled | 1‐3‐6 mg/Kg | 39 | n.a. | 1 | Safety Pharmacodynamics | Center for drug evaluation and research. Medical Review ‐ Drug Approval Package ‐ http://www.accessdata.fda.gov/drugsatfda_docs/nda/2004/125104s000_Natalizumab.cfm study quoted by Rudick 2004 |
| 224 | 1 | Safety Pharmacokinetics Interaction with IFNß‐1a | RRMS subjects treated with intramuscular IFNß‐1a | Open label | 3 (n=15) ‐ 6 (n=23) mg/Kg | 38 | n.a. | 1 | Safety Pharmacokinetics | Center for drug evaluation and research. Medical Review ‐ Drug Approval Package ‐ http://www.accessdata.fda.gov/drugsatfda_docs/nda/2004/125104s000_Natalizumab.cfm |
| 201 UK Antegren Study | 2 | Preliminary efficacy | RRMS and SPMS subjects | Randomised, Double‐blind, Placebo‐controlled | 3 mg/Kg | 72 (placebo n=35) | 24 wks | 2 | MRI parameters | |
| 202 Natalizumab Multiple Sclerosis Trial | 2 | Preliminary efficacy (on relapse) | RRMS and SPMS subjects in relapse | Randomised, Double‐blind, Placebo‐controlled | 1‐3 mg/Kg | 180 | 14 wks | 1 | MRI parameters EDSS Scripp Patient’s own |
| Outcome or subgroup title | No. of studies | No. of participants | Statistical method | Effect size |
| 1 N of pts with at least one relapse at 2 yrs Show forest plot | 2 | 2113 | Risk Ratio (M‐H, Random, 95% CI) | 0.57 [0.47, 0.69] |
| 1.1 Natalizumab vs Placebo | 1 | 942 | Risk Ratio (M‐H, Random, 95% CI) | 0.51 [0.44, 0.61] |
| 1.2 Natalizumab + IFN vs IFN | 1 | 1171 | Risk Ratio (M‐H, Random, 95% CI) | 0.62 [0.55, 0.70] |
| 2 N of pts who progressed at 2 yrs Show forest plot | 2 | 2113 | Risk Ratio (M‐H, Random, 95% CI) | 0.74 [0.62, 0.89] |
| 2.1 Natalizumab vs Placebo | 1 | 942 | Risk Ratio (M‐H, Random, 95% CI) | 0.67 [0.55, 0.81] |
| 2.2 Natalizumab + IFN vs IFN | 1 | 1171 | Risk Ratio (M‐H, Random, 95% CI) | 0.80 [0.69, 0.93] |
| 3 PCS Change in Short Form (SF‐36) follow up 2 years Show forest plot | 2 | 2113 | Mean Difference (IV, Random, 95% CI) | 1.98 [1.05, 2.91] |
| 3.1 Natalizumab vs Placebo | 1 | 942 | Mean Difference (IV, Random, 95% CI) | 2.01 [0.48, 3.54] |
| 3.2 Natalizumab + IFN vs IFN | 1 | 1171 | Mean Difference (IV, Random, 95% CI) | 1.96 [0.79, 3.13] |
| 4 MCS Change in Short Form (SF‐36) follow up 2 years Show forest plot | 2 | 2113 | Mean Difference (IV, Random, 95% CI) | 1.38 [0.33, 2.42] |
| 4.1 Natalizumab vs Placebo | 1 | 942 | Mean Difference (IV, Random, 95% CI) | 2.53 [0.00, 5.06] |
| 4.2 Natalizumab + IFN vs IFN | 1 | 1171 | Mean Difference (IV, Random, 95% CI) | 1.14 [‐0.00, 2.28] |
| Outcome or subgroup title | No. of studies | No. of participants | Statistical method | Effect size |
| 1 Change in Well‐being (VAS) at 2 yrs Show forest plot | 1 | 942 | Mean Difference (IV, Random, 95% CI) | 6.4 [1.76, 11.04] |
| 1.1 Natalizumab vs Placebo | 1 | 942 | Mean Difference (IV, Random, 95% CI) | 6.4 [1.76, 11.04] |
| 2 Gd‐enhacing lesion (at least one) at 2 yrs Show forest plot | 2 | 2113 | Risk Ratio (M‐H, Random, 95% CI) | 0.12 [0.09, 0.17] |
| 2.1 Natalizumab vs Placebo | 1 | 942 | Risk Ratio (M‐H, Random, 95% CI) | 0.11 [0.07, 0.17] |
| 2.2 Natalizumab + IFN vs IFN | 1 | 1171 | Risk Ratio (M‐H, Random, 95% CI) | 0.14 [0.09, 0.22] |
| 3 Change of MRI T2 total lesion load at 2 yrs Show forest plot | 1 | 855 | Mean Difference (IV, Random, 95% CI) | ‐3796.20 [‐5849.43, ‐1742.97] |
| 3.1 Natalizumab vs Placebo | 1 | 855 | Mean Difference (IV, Random, 95% CI) | ‐3796.20 [‐5849.43, ‐1742.97] |
| Outcome or subgroup title | No. of studies | No. of participants | Statistical method | Effect size |
| 1 N of pts with Severe AE over 2 yrs Show forest plot | 2 | 2110 | Risk Ratio (M‐H, Random, 95% CI) | 0.92 [0.81, 1.04] |
| 1.1 Natalizumab vs Placebo | 1 | 939 | Risk Ratio (M‐H, Random, 95% CI) | 0.85 [0.68, 1.08] |
| 1.2 Natalizumab + IFN vs IFN | 1 | 1171 | Risk Ratio (M‐H, Random, 95% CI) | 0.95 [0.81, 1.10] |
| 2 N of pts with Serious AE (irrespective of treatment duration) Show forest plot | 3 | 2220 | Risk Ratio (M‐H, Random, 95% CI) | 0.83 [0.70, 0.98] |
| 2.1 Natalizumab vs Placebo | 1 | 939 | Risk Ratio (M‐H, Random, 95% CI) | 0.79 [0.61, 1.02] |
| 2.2 Natalizumab + IFN vs IFN | 1 | 1171 | Risk Ratio (M‐H, Random, 95% CI) | 0.87 [0.69, 1.09] |
| 2.3 Natalizumab + GA vs GA | 1 | 110 | Risk Ratio (M‐H, Random, 95% CI) | 0.5 [0.05, 5.36] |
| 3 N of pts with serious AE (irrespective of treatment duration ‐ MS relapses excluded) Show forest plot | 3 | 2220 | Risk Ratio (M‐H, Random, 95% CI) | 1.13 [0.90, 1.43] |
| 3.1 Natalizumab vs Placebo | 1 | 939 | Risk Ratio (M‐H, Random, 95% CI) | 1.19 [0.81, 1.73] |
| 3.2 Natalizumab + IFN vs IFN | 1 | 1171 | Risk Ratio (M‐H, Random, 95% CI) | 1.10 [0.81, 1.49] |
| 3.3 Natalizumab + GA vs GA | 1 | 110 | Risk Ratio (M‐H, Random, 95% CI) | 1.0 [0.06, 15.59] |
| Outcome or subgroup title | No. of studies | No. of participants | Statistical method | Effect size |
| 1 N of pts with at least one AE (irrespective of treatment duration) Show forest plot | 3 | 2220 | Risk Ratio (M‐H, Random, 95% CI) | 1.00 [0.99, 1.01] |
| 1.1 Natalizumab vs Placebo | 1 | 939 | Risk Ratio (M‐H, Random, 95% CI) | 0.99 [0.96, 1.02] |
| 1.2 Natalizumab + IFN vs IFN | 1 | 1171 | Risk Ratio (M‐H, Random, 95% CI) | 1.00 [0.99, 1.01] |
| 1.3 Natalizumab + GA vs GA | 1 | 110 | Risk Ratio (M‐H, Random, 95% CI) | 0.98 [0.88, 1.10] |
| 2 Treatment Discontinuation caused by AE (irrespective of treatment duration) Show forest plot | 3 | 2220 | Risk Ratio (M‐H, Random, 95% CI) | 1.14 [0.82, 1.59] |
| 2.1 Natalizumab vs Placebo | 1 | 939 | Risk Ratio (M‐H, Random, 95% CI) | 1.58 [0.84, 2.97] |
| 2.2 Natalizumab + IFN vs IFN | 1 | 1171 | Risk Ratio (M‐H, Random, 95% CI) | 1.01 [0.68, 1.50] |
| 2.3 Natalizumab + GA vs GA | 1 | 110 | Risk Ratio (M‐H, Random, 95% CI) | 1.0 [0.06, 15.59] |
| Outcome or subgroup title | No. of studies | No. of participants | Statistical method | Effect size |
| 1 Headache Show forest plot | 3 | 2220 | Risk Ratio (M‐H, Random, 95% CI) | 1.08 [0.97, 1.20] |
| 1.1 Natalizumab vs Placebo | 1 | 939 | Risk Ratio (M‐H, Random, 95% CI) | 1.15 [0.95, 1.39] |
| 1.2 Natalizumab IFN vs IFN | 1 | 1171 | Risk Ratio (M‐H, Random, 95% CI) | 1.05 [0.92, 1.19] |
| 1.3 Natalizumab + GA vs GA | 1 | 110 | Risk Ratio (M‐H, Random, 95% CI) | 1.13 [0.63, 2.03] |
| 2 Pain in arms or legs ‐ Arthralgia Show forest plot | 3 | 2220 | Risk Ratio (M‐H, Fixed, 95% CI) | 1.17 [0.98, 1.40] |
| 2.1 Natalizumab vs Placebo | 1 | 939 | Risk Ratio (M‐H, Fixed, 95% CI) | 1.35 [0.98, 1.85] |
| 2.2 Natalizumab + IFN vs IFN | 1 | 1171 | Risk Ratio (M‐H, Fixed, 95% CI) | 1.05 [0.85, 1.31] |
| 2.3 Natalizumab + GA vs GA | 1 | 110 | Risk Ratio (M‐H, Fixed, 95% CI) | 5.0 [0.60, 41.42] |
| 3 Depression Show forest plot | 3 | 2220 | Risk Ratio (M‐H, Random, 95% CI) | 1.18 [0.98, 1.41] |
| 3.1 Natalizumab vs Placebo | 1 | 939 | Risk Ratio (M‐H, Random, 95% CI) | 1.18 [0.88, 1.60] |
| 3.2 Natalizumab + IFN vs IFN | 1 | 1171 | Risk Ratio (M‐H, Random, 95% CI) | 1.17 [0.92, 1.47] |
| 3.3 Natalizumab + GA vs GA | 1 | 110 | Risk Ratio (M‐H, Random, 95% CI) | 1.5 [0.26, 8.63] |
| 4 Anxiety Show forest plot | 1 | 1171 | Risk Ratio (M‐H, Random, 95% CI) | 1.49 [1.05, 2.12] |
| 4.1 Natalizumab + IFN vs IFN | 1 | 1171 | Risk Ratio (M‐H, Random, 95% CI) | 1.49 [1.05, 2.12] |
| 5 Insomnia Show forest plot | 1 | 1171 | Risk Ratio (M‐H, Random, 95% CI) | 1.06 [0.82, 1.36] |
| 5.1 Natalizumab + IFN vs IFN | 1 | 1171 | Risk Ratio (M‐H, Random, 95% CI) | 1.06 [0.82, 1.36] |
| 6 Influenza Like Illness Show forest plot | 1 | 1171 | Risk Ratio (M‐H, Random, 95% CI) | 1.05 [0.83, 1.33] |
| 6.1 Natalizumab + IFN vs IFN | 1 | 1171 | Risk Ratio (M‐H, Random, 95% CI) | 1.05 [0.83, 1.33] |
| 7 Nasopharyngitis Show forest plot | 2 | 1281 | Risk Ratio (M‐H, Fixed, 95% CI) | 1.09 [0.94, 1.26] |
| 7.1 Natalizumab + IFN vs IFN | 1 | 1171 | Risk Ratio (M‐H, Fixed, 95% CI) | 1.11 [0.96, 1.29] |
| 7.2 Natalizumab + GA vs GA | 1 | 110 | Risk Ratio (M‐H, Fixed, 95% CI) | 0.64 [0.27, 1.52] |
| 8 Pharyngitis Show forest plot | 2 | 2110 | Risk Ratio (M‐H, Random, 95% CI) | 1.41 [0.98, 2.04] |
| 8.1 Natalizumab vs Placebo | 1 | 939 | Risk Ratio (M‐H, Random, 95% CI) | 1.20 [0.81, 1.79] |
| 8.2 Natalizumab + IFN vs IFN | 1 | 1171 | Risk Ratio (M‐H, Random, 95% CI) | 1.76 [1.07, 2.90] |
| 9 Sinusitis Show forest plot | 2 | 1281 | Risk Ratio (M‐H, Random, 95% CI) | 1.29 [0.88, 1.88] |
| 9.1 Natalizumab + IFN vs IFN | 1 | 1171 | Risk Ratio (M‐H, Random, 95% CI) | 1.20 [0.93, 1.56] |
| 9.2 Natalizumab + GA vs GA | 1 | 110 | Risk Ratio (M‐H, Random, 95% CI) | 2.25 [0.74, 6.87] |
| 10 Sinus Congestion Show forest plot | 1 | 1171 | Risk Ratio (M‐H, Random, 95% CI) | 2.03 [1.15, 3.59] |
| 10.1 Natalizumab + IFN vs IFN | 1 | 1171 | Risk Ratio (M‐H, Random, 95% CI) | 2.03 [1.15, 3.59] |
| 11 Sinus Headache Show forest plot | 1 | 1171 | Risk Ratio (M‐H, Random, 95% CI) | 1.69 [0.94, 3.03] |
| 11.1 Natalizumab + IFN vs IFN | 1 | 1171 | Risk Ratio (M‐H, Random, 95% CI) | 1.69 [0.94, 3.03] |
| 12 Upper Respiratory Infection Show forest plot | 3 | 2220 | Risk Ratio (M‐H, Random, 95% CI) | 1.05 [0.87, 1.28] |
| 12.1 Natalizumab vs Placebo | 1 | 939 | Risk Ratio (M‐H, Random, 95% CI) | 1.00 [0.80, 1.26] |
| 12.2 Natalizumab + IFN vs IFN | 1 | 1171 | Risk Ratio (M‐H, Random, 95% CI) | 1.13 [0.76, 1.69] |
| 12.3 Natalizumab + GA vs GA | 1 | 110 | Risk Ratio (M‐H, Random, 95% CI) | 1.8 [0.64, 5.03] |
| 13 Influenza Show forest plot | 1 | 1171 | Risk Ratio (M‐H, Random, 95% CI) | 1.14 [0.87, 1.48] |
| 13.1 Natalizumab + IFN vs IFN | 1 | 1171 | Risk Ratio (M‐H, Random, 95% CI) | 1.14 [0.87, 1.48] |
| 14 Cough Show forest plot | 1 | 1171 | Risk Ratio (M‐H, Random, 95% CI) | 1.24 [0.87, 1.75] |
| 14.1 Natalizumab + IFN vs IFN | 1 | 1171 | Risk Ratio (M‐H, Random, 95% CI) | 1.24 [0.87, 1.75] |
| 15 Diarrhea Show forest plot | 1 | 1171 | Risk Ratio (M‐H, Random, 95% CI) | 1.19 [0.93, 1.53] |
| 15.1 Natalizumab + IFN vs IFN | 1 | 1171 | Risk Ratio (M‐H, Random, 95% CI) | 1.19 [0.93, 1.53] |
| 16 Nausea Show forest plot | 2 | 1281 | Risk Ratio (M‐H, Random, 95% CI) | 1.13 [0.88, 1.46] |
| 16.1 Natalizumab + IFN vs IFN | 1 | 1171 | Risk Ratio (M‐H, Random, 95% CI) | 1.14 [0.87, 1.48] |
| 16.2 Natalizumab + GA vs GA | 1 | 110 | Risk Ratio (M‐H, Random, 95% CI) | 1.13 [0.47, 2.70] |
| 17 Vomiting Show forest plot | 1 | 1171 | Risk Ratio (M‐H, Random, 95% CI) | 1.40 [0.88, 2.22] |
| 17.1 Natalizumab + IFN vs IFN | 1 | 1171 | Risk Ratio (M‐H, Random, 95% CI) | 1.40 [0.88, 2.22] |
| 18 Abdominal Pain or Discomfort Show forest plot | 2 | 2110 | Risk Ratio (M‐H, Random, 95% CI) | 1.14 [0.84, 1.55] |
| 18.1 Natalizumab vs Placebo | 1 | 939 | Risk Ratio (M‐H, Random, 95% CI) | 1.11 [0.74, 1.65] |
| 18.2 Natalizumab + IFN vs IFN | 1 | 1171 | Risk Ratio (M‐H, Random, 95% CI) | 1.19 [0.74, 1.92] |
| 19 Muscle Cramp Show forest plot | 1 | 1171 | Risk Ratio (M‐H, Random, 95% CI) | 1.19 [0.74, 1.92] |
| 19.1 Natalizumab + IFN vs IFN | 1 | 1171 | Risk Ratio (M‐H, Random, 95% CI) | 1.19 [0.74, 1.92] |
| 20 Myalgia Show forest plot | 1 | 1171 | Risk Ratio (M‐H, Random, 95% CI) | 1.31 [0.95, 1.81] |
| 20.1 Natalizumab + IFN vs IFN | 1 | 1171 | Risk Ratio (M‐H, Random, 95% CI) | 1.31 [0.95, 1.81] |
| 21 Seasonal Allergy Show forest plot | 1 | 1171 | Risk Ratio (M‐H, Random, 95% CI) | 1.50 [0.90, 2.51] |
| 21.1 Natalizumab + IFN vs IFN | 1 | 1171 | Risk Ratio (M‐H, Random, 95% CI) | 1.50 [0.90, 2.51] |
| 22 Peripheral Edema Show forest plot | 1 | 1171 | Risk Ratio (M‐H, Random, 95% CI) | 4.78 [2.00, 11.42] |
| 22.1 Natalizumab + IFN vs IFN | 1 | 1171 | Risk Ratio (M‐H, Random, 95% CI) | 4.78 [2.00, 11.42] |
| 23 Tremor Show forest plot | 2 | 2110 | Risk Ratio (M‐H, Random, 95% CI) | 1.42 [0.89, 2.27] |
| 23.1 Natalizumab vs Placebo | 1 | 939 | Risk Ratio (M‐H, Random, 95% CI) | 1.05 [0.48, 2.29] |
| 23.2 Natalizumab + IFN vs IFN | 1 | 1171 | Risk Ratio (M‐H, Random, 95% CI) | 1.69 [0.94, 3.03] |
| 24 Flushing Show forest plot | 1 | 110 | Risk Ratio (M‐H, Random, 95% CI) | 6.00 [0.75, 48.21] |
| 24.1 Natalizumab GA vs GA | 1 | 110 | Risk Ratio (M‐H, Random, 95% CI) | 6.00 [0.75, 48.21] |
| 25 Fatigue ‐ Myasthenia Show forest plot | 1 | 939 | Risk Ratio (M‐H, Random, 95% CI) | 1.27 [0.99, 1.64] |
| 25.1 Natalizumab vs Placebo | 1 | 939 | Risk Ratio (M‐H, Random, 95% CI) | 1.27 [0.99, 1.64] |
| 26 Urinary Urgency / Frequency Show forest plot | 1 | 939 | Risk Ratio (M‐H, Random, 95% CI) | 1.27 [0.79, 2.03] |
| 26.1 Natalizumab vs Placebo | 1 | 939 | Risk Ratio (M‐H, Random, 95% CI) | 1.27 [0.79, 2.03] |
| 27 Hypersensitivity reactions Show forest plot | 3 | 2220 | Risk Ratio (M‐H, Random, 95% CI) | 3.43 [0.33, 36.07] |
| 27.1 Natalizumab vs Placebo | 1 | 939 | Risk Ratio (M‐H, Random, 95% CI) | 25.42 [1.55, 416.15] |
| 27.2 Natalizumab + IFN vs IFN | 1 | 1171 | Risk Ratio (M‐H, Random, 95% CI) | 5.43 [1.21, 24.41] |
| 27.3 Natalizumab GA vs GA | 1 | 110 | Risk Ratio (M‐H, Random, 95% CI) | 0.2 [0.01, 4.07] |
| 28 Chest Discomfort Show forest plot | 1 | 939 | Risk Ratio (M‐H, Random, 95% CI) | 1.71 [0.83, 3.56] |
| 28.1 Natalizumab vs Placebo | 1 | 939 | Risk Ratio (M‐H, Random, 95% CI) | 1.71 [0.83, 3.56] |
| 29 Local Bleeding Show forest plot | 1 | 939 | Risk Ratio (M‐H, Random, 95% CI) | 1.58 [0.64, 3.91] |
| 29.1 Natalizumab vs Placebo | 1 | 939 | Risk Ratio (M‐H, Random, 95% CI) | 1.58 [0.64, 3.91] |
| 30 Rigors Show forest plot | 2 | 1049 | Risk Ratio (M‐H, Random, 95% CI) | 3.54 [1.16, 10.83] |
| 30.1 Natalizumab vs Placebo | 1 | 939 | Risk Ratio (M‐H, Random, 95% CI) | 3.15 [0.94, 10.57] |
| 30.2 Natalizumab GA vs GA | 1 | 110 | Risk Ratio (M‐H, Random, 95% CI) | 7.0 [0.37, 132.40] |
| 31 Syncope Show forest plot | 1 | 939 | Risk Ratio (M‐H, Random, 95% CI) | 1.05 [0.48, 2.29] |
| 31.1 Natalizumab vs Placebo | 1 | 939 | Risk Ratio (M‐H, Random, 95% CI) | 1.05 [0.48, 2.29] |
| 32 Urinary Infection Show forest plot | 2 | 1049 | Risk Ratio (M‐H, Random, 95% CI) | 0.99 [0.51, 1.93] |
| 32.1 Natalizumab vs Placebo | 1 | 939 | Risk Ratio (M‐H, Random, 95% CI) | 1.17 [0.88, 1.57] |
| 32.2 Natalizumab GA vs GA | 1 | 110 | Risk Ratio (M‐H, Random, 95% CI) | 0.5 [0.13, 1.90] |
| 33 Lower Respiratory Infection Show forest plot | 1 | 939 | Risk Ratio (M‐H, Random, 95% CI) | 1.06 [0.78, 1.45] |
| 33.1 Natalizumab vs Placebo | 1 | 939 | Risk Ratio (M‐H, Random, 95% CI) | 1.06 [0.78, 1.45] |
| 34 Tonsillitis Show forest plot | 1 | 939 | Risk Ratio (M‐H, Random, 95% CI) | 1.37 [0.78, 2.39] |
| 34.1 Natalizumab vs Placebo | 1 | 939 | Risk Ratio (M‐H, Random, 95% CI) | 1.37 [0.78, 2.39] |
| 35 Gastroenteritis Show forest plot | 1 | 939 | Risk Ratio (M‐H, Random, 95% CI) | 1.23 [0.81, 1.86] |
| 35.1 Natalizumab vs Placebo | 1 | 939 | Risk Ratio (M‐H, Random, 95% CI) | 1.23 [0.81, 1.86] |
| 36 Vaginitis Show forest plot | 1 | 939 | Risk Ratio (M‐H, Random, 95% CI) | 1.65 [1.01, 2.71] |
| 36.1 Natalizumab vs Placebo | 1 | 939 | Risk Ratio (M‐H, Random, 95% CI) | 1.65 [1.01, 2.71] |
| 37 Menstrual disorders Show forest plot | 1 | 939 | Risk Ratio (M‐H, Random, 95% CI) | 1.89 [1.09, 3.29] |
| 37.1 Natalizumab vs Placebo | 1 | 939 | Risk Ratio (M‐H, Random, 95% CI) | 1.89 [1.09, 3.29] |
| 38 Skin Rash Show forest plot | 2 | 1049 | Risk Ratio (M‐H, Random, 95% CI) | 1.94 [0.47, 7.99] |
| 38.1 Natalizumab vs Placebo | 1 | 939 | Risk Ratio (M‐H, Random, 95% CI) | 1.23 [0.81, 1.86] |
| 38.2 Natalizumab + GA vs GA | 1 | 110 | Risk Ratio (M‐H, Random, 95% CI) | 6.00 [0.75, 48.21] |
| 39 Dermatitis Show forest plot | 2 | 1049 | Risk Ratio (M‐H, Random, 95% CI) | 2.15 [0.96, 4.85] |
| 39.1 Natalizumab vs Placebo | 1 | 939 | Risk Ratio (M‐H, Random, 95% CI) | 1.82 [0.98, 3.40] |
| 39.2 Natalizumab + GA vs GA | 1 | 110 | Risk Ratio (M‐H, Random, 95% CI) | 6.00 [0.75, 48.21] |
| 40 Pruritus Show forest plot | 1 | 939 | Risk Ratio (M‐H, Random, 95% CI) | 2.07 [0.86, 5.00] |
| 40.1 Natalizumab vs Placebo | 1 | 939 | Risk Ratio (M‐H, Random, 95% CI) | 2.07 [0.86, 5.00] |
| 41 Vertigo Show forest plot | 1 | 939 | Risk Ratio (M‐H, Random, 95% CI) | 1.18 [0.67, 2.09] |
| 41.1 Natalizumab vs Placebo | 1 | 939 | Risk Ratio (M‐H, Random, 95% CI) | 1.18 [0.67, 2.09] |
| 42 Infection Show forest plot | 3 | 2220 | Risk Ratio (M‐H, Random, 95% CI) | 1.01 [0.97, 1.06] |
| 42.1 Natalizumab vs Placebo | 1 | 939 | Risk Ratio (M‐H, Random, 95% CI) | 1.00 [0.93, 1.07] |
| 42.2 Natalizumab + IFN vs IFN | 1 | 1171 | Risk Ratio (M‐H, Random, 95% CI) | 1.03 [0.97, 1.08] |
| 42.3 Natalizumab + GA vs GA | 1 | 110 | Risk Ratio (M‐H, Random, 95% CI) | 0.92 [0.69, 1.22] |
| 43 Infusion reactions Show forest plot | 3 | 2220 | Risk Ratio (M‐H, Random, 95% CI) | 1.24 [1.05, 1.47] |
| 43.1 Natalizumab vs Placebo | 1 | 939 | Risk Ratio (M‐H, Random, 95% CI) | 1.34 [1.01, 1.77] |
| 43.2 Natalizumab + IFN vs IFN | 1 | 1171 | Risk Ratio (M‐H, Random, 95% CI) | 1.20 [0.97, 1.49] |
| 43.3 Natalizumab + GA vs GA | 1 | 110 | Risk Ratio (M‐H, Random, 95% CI) | 0.86 [0.31, 2.39] |
| 44 Back Pain Show forest plot | 1 | 110 | Risk Ratio (M‐H, Random, 95% CI) | 2.25 [0.74, 6.87] |
| 44.1 Natalizumab +GA vs GA | 1 | 110 | Risk Ratio (M‐H, Random, 95% CI) | 2.25 [0.74, 6.87] |
| 45 Fall Show forest plot | 2 | 2110 | Risk Ratio (M‐H, Random, 95% CI) | 2.69 [0.32, 22.39] |
| 46 Neoplasms Show forest plot | 3 | 2220 | Risk Ratio (M‐H, Random, 95% CI) | 0.83 [0.19, 3.66] |
| 46.1 Natalizumab vs Placebo | 1 | 939 | Risk Ratio (M‐H, Random, 95% CI) | 2.49 [0.29, 21.20] |
| 46.2 Natalizumab + IFN vs IFN | 1 | 1171 | Risk Ratio (M‐H, Random, 95% CI) | 0.49 [0.19, 1.31] |
| 46.3 Natalizumab + GA vs GA | 1 | 110 | Risk Ratio (M‐H, Random, 95% CI) | 0.0 [0.0, 0.0] |
| 47 Abnormal liver function tests Show forest plot | 1 | 939 | Risk Ratio (M‐H, Random, 95% CI) | 1.29 [0.67, 2.47] |
| 47.1 Natalizumab vs Placebo | 1 | 939 | Risk Ratio (M‐H, Random, 95% CI) | 1.29 [0.67, 2.47] |
| 48 Death Show forest plot | 3 | 2220 | Risk Ratio (M‐H, Random, 95% CI) | 0.92 [0.14, 6.04] |
| 48.1 Natalizumab vs Placebo | 1 | 939 | Risk Ratio (M‐H, Random, 95% CI) | 2.49 [0.12, 51.75] |
| 48.2 Natalizumab + GA vs GA | 1 | 110 | Risk Ratio (M‐H, Random, 95% CI) | 0.0 [0.0, 0.0] |
| 48.3 Natalizumab + IFN vs IFN | 1 | 1171 | Risk Ratio (M‐H, Random, 95% CI) | 0.49 [0.04, 5.43] |
| 49 MS relapse as a serious AE Show forest plot | 3 | 2220 | Risk Ratio (M‐H, Random, 95% CI) | 0.50 [0.37, 0.68] |
| 49.1 Natalizumab vs Placebo | 1 | 939 | Risk Ratio (M‐H, Random, 95% CI) | 0.46 [0.30, 0.70] |
| 49.2 Natalizumab + IFN vs IFN | 1 | 1171 | Risk Ratio (M‐H, Random, 95% CI) | 0.55 [0.36, 0.86] |
| 49.3 Natalizumab + GA vs GA | 1 | 110 | Risk Ratio (M‐H, Random, 95% CI) | 0.33 [0.01, 8.01] |