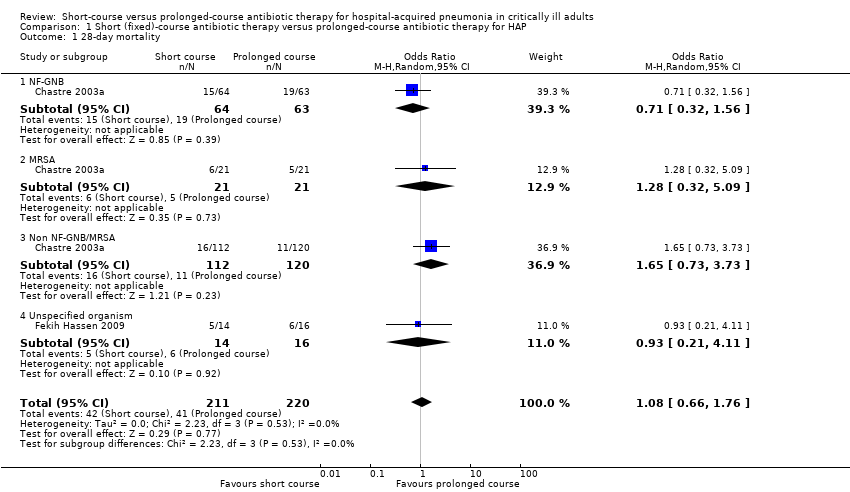
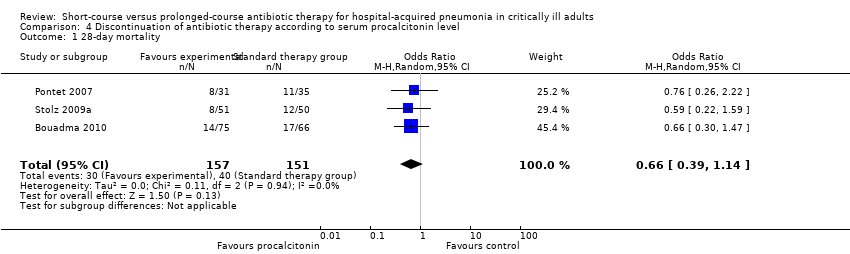
| 1 28‐day mortality Show forest plot | 2 | 431 | Odds Ratio (M‐H, Random, 95% CI) | 1.08 [0.66, 1.76] |
|
| 1.1 NF‐GNB | 1 | 127 | Odds Ratio (M‐H, Random, 95% CI) | 0.71 [0.32, 1.56] |
| 1.2 MRSA | 1 | 42 | Odds Ratio (M‐H, Random, 95% CI) | 1.28 [0.32, 5.09] |
| 1.3 Non NF‐GNB/MRSA | 1 | 232 | Odds Ratio (M‐H, Random, 95% CI) | 1.65 [0.73, 3.73] |
| 1.4 Unspecified organism | 1 | 30 | Odds Ratio (M‐H, Random, 95% CI) | 0.93 [0.21, 4.11] |
| 2 Recurrence of pneumonia Show forest plot | 3 | 508 | Odds Ratio (M‐H, Random, 95% CI) | 1.37 [0.87, 2.17] |
|
| 2.1 NF‐GNB | 2 | 176 | Odds Ratio (M‐H, Random, 95% CI) | 2.18 [1.14, 4.16] |
| 2.2 MRSA | 2 | 49 | Odds Ratio (M‐H, Random, 95% CI) | 1.56 [0.12, 19.61] |
| 2.3 Non NF‐GNB/MRSA | 2 | 253 | Odds Ratio (M‐H, Random, 95% CI) | 0.98 [0.55, 1.78] |
| 2.4 Unspecified organism | 1 | 30 | Odds Ratio (M‐H, Random, 95% CI) | 1.17 [0.14, 9.59] |
| 3 28‐day antibiotic‐free days Show forest plot | 2 | 431 | Mean Difference (IV, Random, 95% CI) | 4.02 [2.26, 5.78] |
|
| 3.1 NF‐GNB | 1 | 127 | Mean Difference (IV, Random, 95% CI) | 4.5 [2.25, 6.75] |
| 3.2 MRSA | 1 | 42 | Mean Difference (IV, Random, 95% CI) | 8.0 [4.14, 11.86] |
| 3.3 Non NF‐GNB/ MRSA | 1 | 232 | Mean Difference (IV, Random, 95% CI) | 3.70 [2.09, 5.31] |
| 3.4 Unspecified organism | 1 | 30 | Mean Difference (IV, Random, 95% CI) | 2.3 [1.03, 3.57] |
| 4 ITU mortality Show forest plot | 2 | 107 | Odds Ratio (M‐H, Random, 95% CI) | 0.85 [0.37, 1.91] |
|
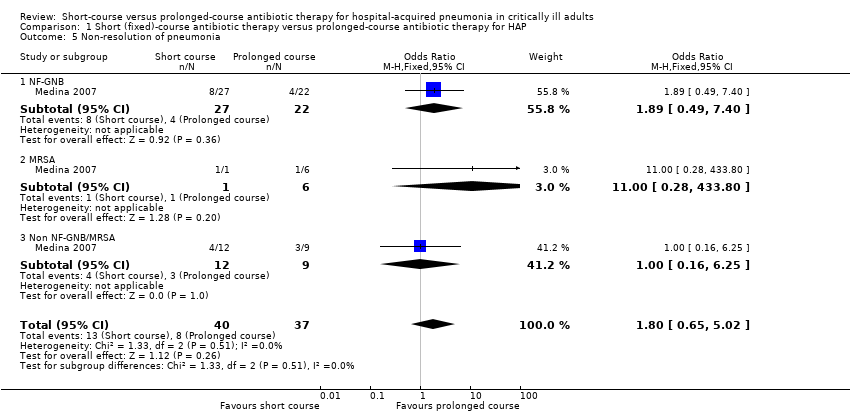
| 5 Non‐resolution of pneumonia Show forest plot | 1 | 77 | Odds Ratio (M‐H, Fixed, 95% CI) | 1.80 [0.65, 5.02] |
|
| 5.1 NF‐GNB | 1 | 49 | Odds Ratio (M‐H, Fixed, 95% CI) | 1.89 [0.49, 7.40] |
| 5.2 MRSA | 1 | 7 | Odds Ratio (M‐H, Fixed, 95% CI) | 11.0 [0.28, 433.80] |
| 5.3 Non NF‐GNB/MRSA | 1 | 21 | Odds Ratio (M‐H, Fixed, 95% CI) | 1.0 [0.16, 6.25] |
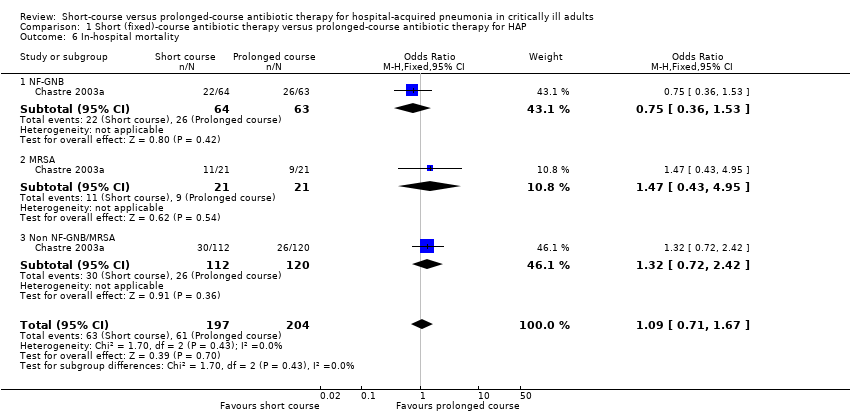
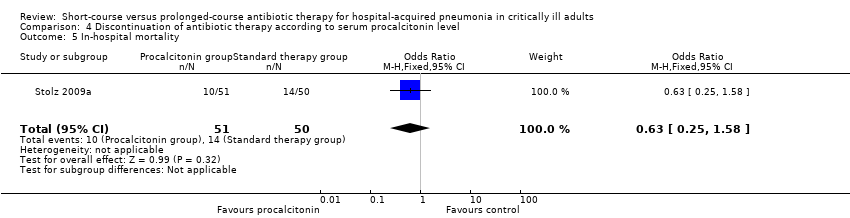
| 6 In‐hospital mortality Show forest plot | 1 | 401 | Odds Ratio (M‐H, Fixed, 95% CI) | 1.09 [0.71, 1.67] |
|
| 6.1 NF‐GNB | 1 | 127 | Odds Ratio (M‐H, Fixed, 95% CI) | 0.75 [0.36, 1.53] |
| 6.2 MRSA | 1 | 42 | Odds Ratio (M‐H, Fixed, 95% CI) | 1.47 [0.43, 4.95] |
| 6.3 Non NF‐GNB/MRSA | 1 | 232 | Odds Ratio (M‐H, Fixed, 95% CI) | 1.32 [0.72, 2.42] |
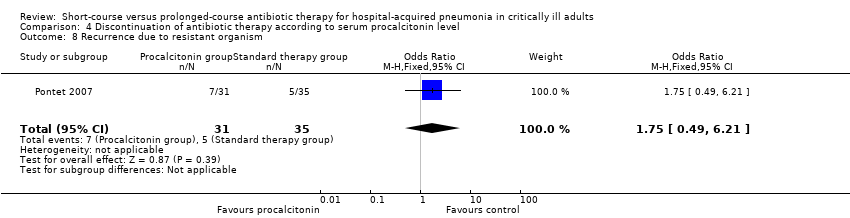
| 7 Recurrence due to multi‐resistant organism Show forest plot | 1 | 110 | Odds Ratio (M‐H, Fixed, 95% CI) | 0.44 [0.21, 0.95] |
|
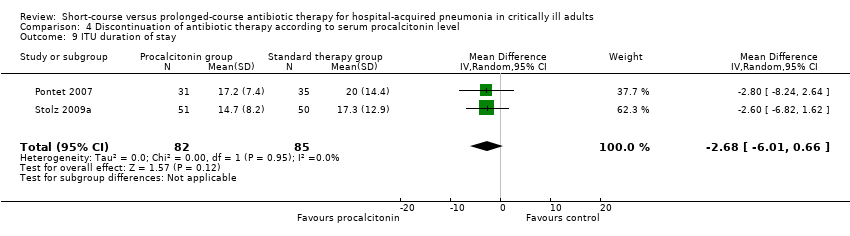
| 8 Duration of ITU stay Show forest plot | 2 | 431 | Mean Difference (IV, Random, 95% CI) | ‐0.01 [‐2.30, 2.27] |
|
| 8.1 NF‐GNB | 1 | 127 | Mean Difference (IV, Random, 95% CI) | 0.90 [‐5.40, 7.20] |
| 8.2 MRSA | 1 | 42 | Mean Difference (IV, Random, 95% CI) | 2.90 [‐8.39, 14.19] |
| 8.3 Non NF‐GNB/MRSA | 1 | 232 | Mean Difference (IV, Random, 95% CI) | 2.70 [‐1.88, 7.28] |
| 8.4 Unspecified organism | 1 | 30 | Mean Difference (IV, Random, 95% CI) | ‐1.60 [‐4.61, 1.41] |
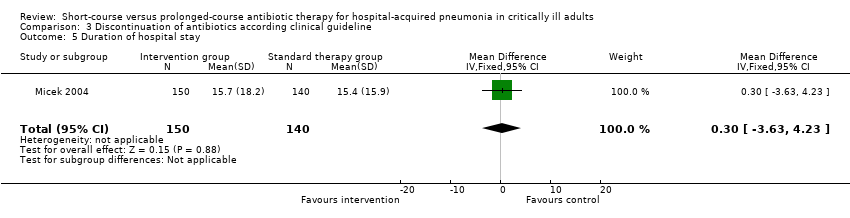
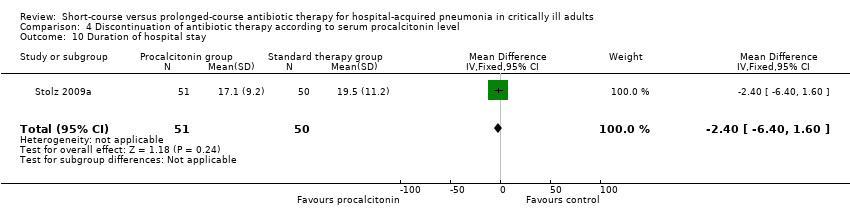
| 9 Duration of hospital stay Show forest plot | 1 | 30 | Mean Difference (IV, Fixed, 95% CI) | ‐1.0 [‐4.11, 2.11] |
|
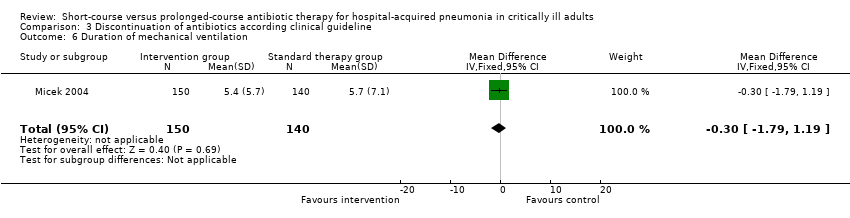
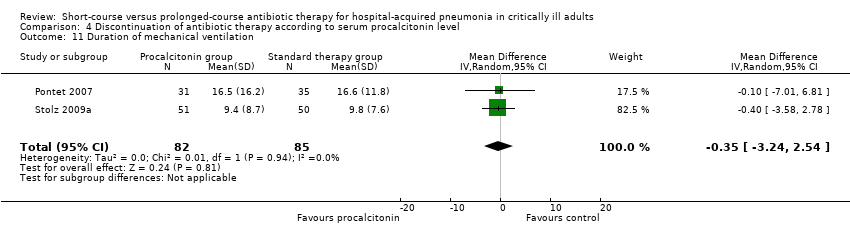
| 10 Duration of mechanical ventilation Show forest plot | 2 | 107 | Mean Difference (IV, Random, 95% CI) | ‐0.01 [‐0.57, 0.55] |
|
| 11 28‐day mechanical ventilation‐free days Show forest plot | 2 | 431 | Mean Difference (IV, Random, 95% CI) | 0.47 [‐0.97, 1.92] |
|
| 11.1 NF‐GNB | 1 | 127 | Mean Difference (IV, Random, 95% CI) | 1.50 [‐1.77, 4.77] |
| 11.2 MRSA | 1 | 42 | Mean Difference (IV, Random, 95% CI) | ‐1.30 [‐6.37, 3.77] |
| 11.3 Non NF‐GNB/MRSA | 1 | 232 | Mean Difference (IV, Random, 95% CI) | ‐1.20 [‐3.54, 1.14] |
| 11.4 Unspecified organism | 1 | 30 | Mean Difference (IV, Random, 95% CI) | 1.30 [‐0.03, 2.63] |
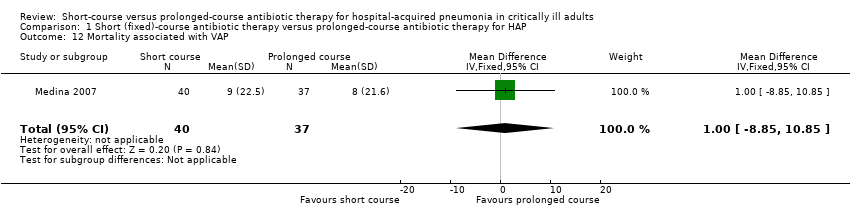
| 12 Mortality associated with VAP Show forest plot | 1 | 77 | Mean Difference (IV, Fixed, 95% CI) | 1.0 [‐8.85, 10.85] |
|