| Study ID | What (CCT content) | Who | How (timing, number and duration of sessions) | Where |
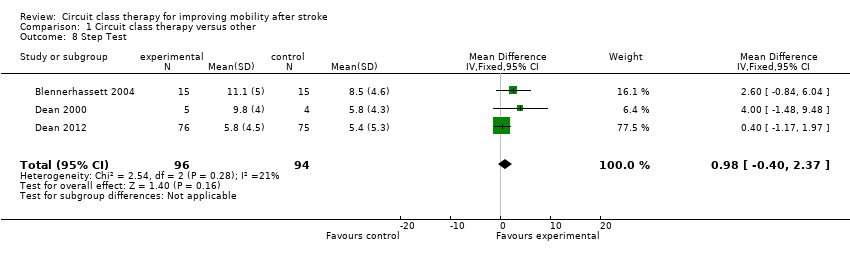
| Blennerhassett 2004 | Mobility CCT in addition to usual care; functional tasks, strengthening exercises | Physiotherapist | 1‐hour sessions 5 days per week for 4 weeks | Inpatient rehabilitation unit |
| Dean 2000 | Multiple task‐specific training strengthening LL; practice locomotor‐related tasks | Physiotherapists | 1‐hour sessions, 3 days per week for 4 weeks | Community setting |
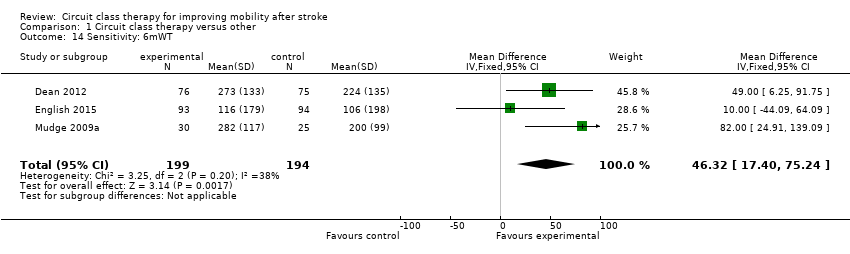
| Dean 2012 | Progressive balance and strengthening exercises; walking and stair climbing. Home exercise programme and advice to increase walking | Physiotherapist | 45 to 60 minutes per week for 40 weeks over a one‐year period | Community setting |
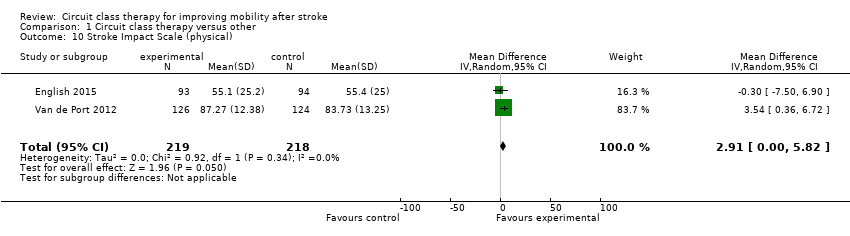
| English 2015 | Task‐specific, part‐ as well as whole‐practice of tasks; emphasis on repetition and feedback | Physiotherapists, assistants, and physiotherapy students | 90‐minute sessions, 5 times per week for 4 weeks | Inpatient rehabilitation |
| Harrington 2010 | Individual, easily progressed; balance, endurance, strength, flexibility, function and well‐being. Home exercise manuals and encouraged for on‐going exercise | Instructor and physiotherapist with support from volunteers (partners, carers, family members) | 2 sessions per week for 8 weeks. (1 hour exercise plus 1 hour interactive education | Community setting |
| Holmgren 2010 | Individualised physical activity, functional performance; educational group discussions about fall risk and security | Physiotherapist and occupational therapist | 7 sessions per week divided over 3 days for 5 weeks | Community setting |
| Kim 2016a | Progressive, focused on mobility and gait training as well as physical fitness | Physiotherapist | 90‐minute sessions, 5 days per week for 4 weeks | Inpatient rehabilitation |
| Marigold 2005 | Focused on walking, standing, balance, and sit‐to‐stand tasks | Physical therapist, kinesiologist, and recreation therapist | 1‐hour sessions, 3 times per week for 10 weeks | Community setting |
| Marsden 2010 | Education and exercises for LL function: functional tasks, strength training and balance training | Multidisciplinary team including a physiotherapist, social worker, dietician, clinical nurse consultant, speech pathologist and occupational therapist | 2‐hour sessions (1 hour education + 1 hour exercise) weekly for 7 weeks | Community setting |
| Moore 2015 | Functional movement including stretching, functional strengthening, balance, agility and fitness | Physiotherapist and physical activity instructor | 3 x 45‐ to 60‐minute sessions per week for 19 weeks | Community setting |
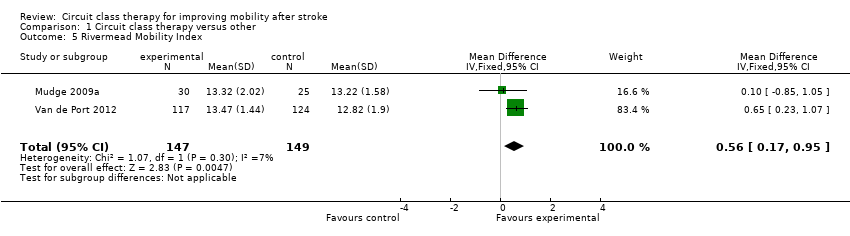
| Mudge 2009a | Task‐oriented gait or standing balance activity, strengthening LL | Physiotherapist and 2 physiotherapy students | 50‐ to 60‐minute sessions, 3 times a week for 4 weeks | Community setting |
| Outermans 2010 | Postural control and gait‐related activities: stair climbing, walking and turning | Therapists | 45‐minute sessions, 3 times per week for 4 weeks | Inpatient and outpatient settings |
| Pang 2005 | Fitness and mobility exercise: cardiorespiratory fitness, mobility, leg muscle strength, balance, and hip bone mineral density | Physical therapist, occupational therapist, and exercise instructor | 1‐hour sessions, 3 times per week for 19 weeks | Community setting |
| Song 2015 | Functional training tasks | Physiotherapists | 30‐minute sessions, 3 times per week for 4 weeks | Inpatient rehabilitation |
| Tang 2014 | Brisk level and inclined overground walking, upright and recumbent cycle ergometry, functional movements | 3 instructors | 60‐minute classes, 3 times per week for 6 months | Community setting |
| Van de Port 2012 | Meaningful tasks related to walking competency | Physiotherapist and sports therapists | 90‐minute sessions, 2 times per week for 12 weeks | Community setting |
| Verma 2011 | Meaningful tasks related to walking competency: balance control, stair walking, turning, transfers, and speed walking | Physiotherapist or occupational therapist 1 caretaker to ensure safety | 40‐minute sessions, 7 days per week for 2 weeks | Inpatient and outpatient settings |