| Author, Year | Main results | Summary |
| Allen,
1998 | I1 vs I2 Short term stays: mean (SD): pre = 142.5 (42.0); post = 124.7 (20.7) change: 17.8 less admission/year for I2
change in level: ‐3.3 (P = 0.94)
change in slope: ‐14.6 (P 0.49) Long term stays: mean (SD): pre = 16 (4.5); post = 9.0 (2.1) change: 7 less admissions/year for I2
change in level: ‐43.5 (P = 0.07)
change in slope: 11.7 (P = 0.26) I2 vs I3
Short term stays: mean (SD): pre = 124.7 (20.7); post = 30.7 (30.7) change: 94.0 less admissions/year for I3
change in level : ‐6.1 (P = 0.21)
change in slope: ‐0.6 (P = 0.57) Long term stays: mean (SD): pre = 9 (2.1); post = 3.5 (2.4) change: 5.5 less admissions/year for I3
change in level: 2.5 (P = 0.62)
change in slope: ‐0.3 (P = 0.90) | Reanalysis of results showed no evidence that community support teams alone or in combination with specialist services decreases short stay admissions Reanalysis of results showed no evidence that community support teams alone or in combination with specialist services decreases long term stay admissions. |
| Coelho, 1993 | Intervention with time shows significantly better results in all behaviour measures:
AMD‐ABS: mean (SD) for I: pre = 199.4 (28.5); post = 211.9 (30.9) mean (SD) for C: pre = 206.0 (30.0); post = 201.3 (29.0)
Adaptive behaviour increases more for I (P = 0.001) AAMD‐ABS: mean (SD) for I: pre = 53.7 (22.5); post = 40.1 (20.3) mean (SD) for C: pre = 53.4 (27.5); post = 53.0 (29.0) Maladaptive behaviour decreases more for I (P = 0.001) MMBS: mean (SD) for I: pre = 12.7 (7.0); post = 6.5 (4.6) mean (SD) for C: pre = 12.0 (7.6); post = 11.5 (6.4) Maladaptive behaviour decreases more for I (P = 0.001) | Supports the use of decreased caseloads by professionals in a team and greater frequency of episodes of direct care with persons with dual diagnosis in their natural environment |
| Dowling, 2006 | Improvements in behaviour for standard practice control group ONLY. Significant difference in change in all measures except speech: 1) ABC irritability: mean change (SD) for I = ‐0.9 (5.8); for C = 6.1 (4.4); Greater improvement for C (P > 0.001) 2) ABC lethargy: mean change (SD) for I = ‐1.8 (4.5); for C = 5.7 (6.4); Greater improvement for C (P = 0.001)
3) ABC stereotypy: mean change (SD) for I = ‐0.8 (3.4); for C = 1.5 (2.0); Greater improvement for C (P = 0.020)
4) ABC hyperactivity: mean change (SD) for I = ‐0.3 (4.5); for C 6.2 (6.5); Greater improvement for C (P = 0.005)
5) ABC inappropriate speech: mean change (SD) for I = 0.4 (2.1); for C = ‐0.1 (5.5); NS difference (P = 0.781)
HoNOS‐LD: mean change (SD) for I = 0.4 (6.7); for C = 7.4 (7.0); Greater improvement for C (P = 0.009) | Supports mainstream bereavement counselling over grief work provided by carers at home and during day activities |
| Hassiotis, 2001 | Persons with IQ of 85 or lower in intervention group were hospitalised for shorter lengths than those in control: mean days in hospital (SD): I = 47.2 (98.0); C = 104.8 (159.5) difference = 57.5 days; CI 110.9 to 4.2 Study reports no significant difference for quality of life scores for persons with IQ of 85 or less (results NR) | Supports intensive case management to decrease hospital length of stays for persons with a borderline or mild intellectual disability and psychotic illness |
| Lowe, 1996 | DAS shows I group has significantly more behaviour problems (P < 0.05), but shows no difference in percentage rated severe + frequent (SD and P‐value NR) ABC shows no difference in average score and no difference for number of problem behaviours (SD and P‐values NR) No difference in ICI score (SD and P‐value NR) MBI not used for this comparison | No evidence that specialist support services team is better than standard community treatment alone for persons with intellectual disability and challenging behaviour |
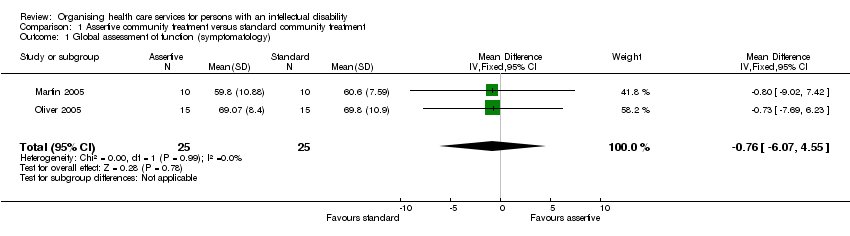
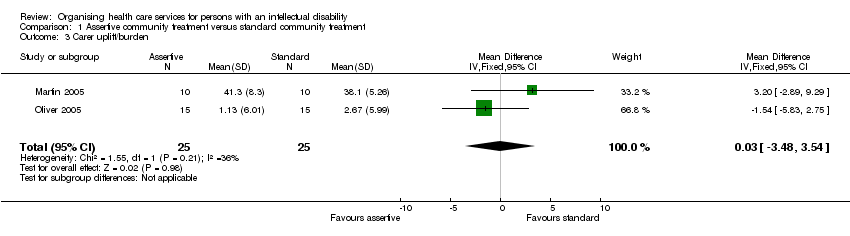
| Martin, 2005 | No difference in GAF scores:
Symptoms (P = 0.263)
Disability (P = 0.209) No difference in ABC score (P = 0.447) Difference in QOLQ score favours C (P < 0.023) No difference in Uplift/Burden score (P = 0.151) (See figures 2‐5 for details) | No evidence that assertive community treatment is better than standard community treatment for persons with ID and mental health disorders |
| Oliver, 2005 | No difference in GAF scores: Symptomalogy (P = 0.080), Social function and performance (P = 0.79) No difference in any dimension of WHOQOL‐Bref or of Uplift/Burden Scale (See figures 2‐5 for details) | No evidence that assertive community treatment is better than standard community treatment for persons with ID and mental health disorders |
| VanMinnen, 1997 | No difference in psychiatric symptoms at endpoint: PIMRA‐I mean: I = 15.6 (SD NR); C = 14.4 (SD NR)
difference = ‐1.2 (CI ‐4.9 to 2.6) (P = 0.53) PIMRA‐SR mean: I = 16.7 (SD NR); C = 16.8 (SD NR); difference = 0.1 (CI ‐3.7 to 3.9) (P = 0.96) Reiss mean: I = 12.7 (SD NR); C = 13.7 (SD NR)
difference = 1.0 (CI ‐4.4 to 6.4) (P = 0.71) Carer burden not measured at endpoint for C group | Home based treatment of patients with dual diagnosis is as effective as hospital based treatment |