| 1 Functional ability Show forest plot | | | Other data | No numeric data |
|
| 1.1 Admission avoidance patients recovering from a stroke functional ability | | | Other data | No numeric data |
| 1.2 Admission avoidance patients with a medical condition ‐ functional ability | | | Other data | No numeric data |
| 2 Quality of life Show forest plot | | | Other data | No numeric data |
|
| 2.1 Admission avoidance quality of life | | | Other data | No numeric data |
| 3 Cognitive function Show forest plot | | | Other data | No numeric data |
|
| 3.1 admission avoidance ‐ cognitive function/psychological well being | | | Other data | No numeric data |
| 4 Patient satisfaction Show forest plot | | | Other data | No numeric data |
|
| 5 Clinical outcomes Show forest plot | | | Other data | No numeric data |
|
| 5.1 clinical outcomes | | | Other data | No numeric data |
| 5.2 Use of antipsychotic drugs | | | Other data | No numeric data |
| 6 Cost Show forest plot | | | Other data | No numeric data |
|
| 6.1 health service costs | | | Other data | No numeric data |
| 6.2 informal care inputs | | | Other data | No numeric data |
| 6.3 use of other health services | | | Other data | No numeric data |
| 7 Length of stay Show forest plot | | | Other data | No numeric data |
|
| 7.1 Trials reporting length of stay | | | Other data | No numeric data |
| 8 Treatment inputs Show forest plot | | | Other data | No numeric data |
|
| 9 Carer outcomes Show forest plot | | | Other data | No numeric data |
|
| 9.1 Carer satisfaction | | | Other data | No numeric data |
| 10 GPs views Show forest plot | | | Other data | No numeric data |
|
| 11 Anxiety and depression Show forest plot | | | Other data | No numeric data |
|
| 12 Readmission for hospital at home group within 2 weeks of randomisation Show forest plot | | | Other data | No numeric data |
|
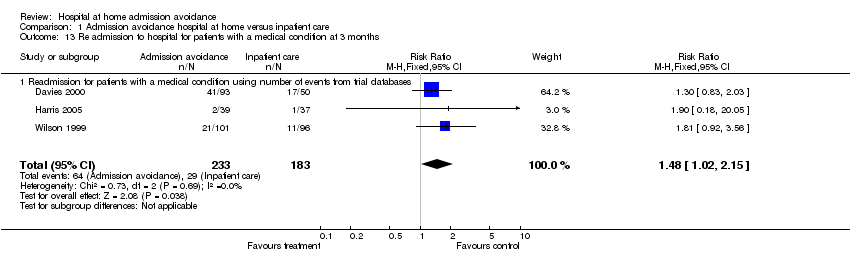
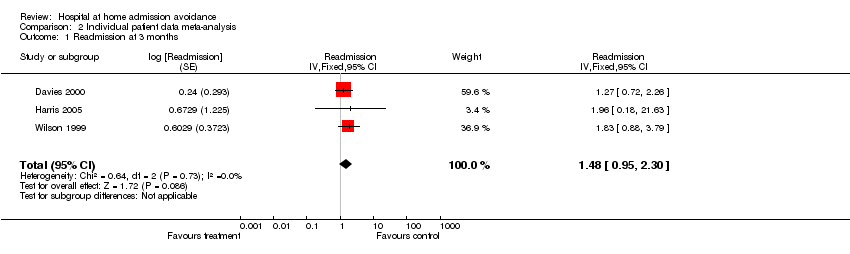
| 13 Re admission to hospital for patients with a medical condition at 3 months Show forest plot | 3 | 416 | Risk Ratio (M‐H, Fixed, 95% CI) | 1.48 [1.02, 2.15] |
|
| 13.1 Readmission for patients with a medical condition using number of events from trial databases | 3 | 416 | Risk Ratio (M‐H, Fixed, 95% CI) | 1.48 [1.02, 2.15] |
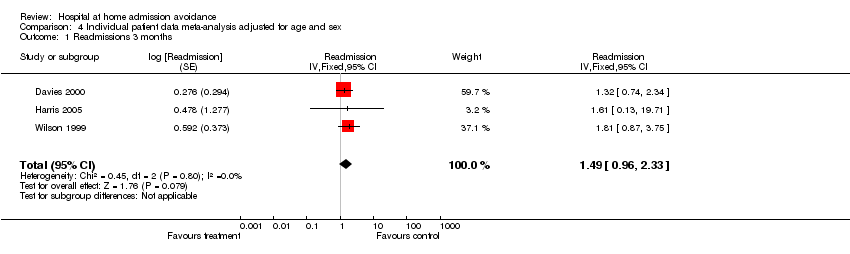
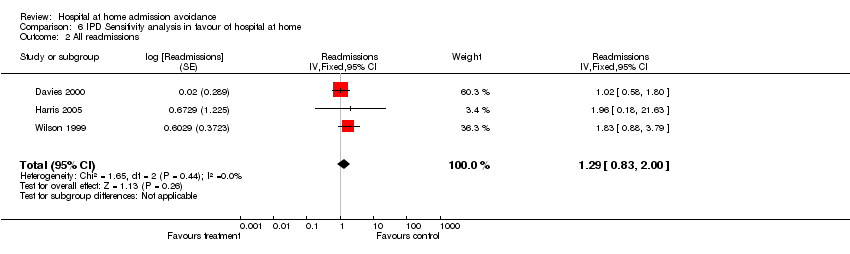
| 14 Readmissions at 3 months using published data Show forest plot | 5 | 690 | Risk Ratio (M‐H, Fixed, 95% CI) | 1.35 [0.97, 1.87] |
|
| 14.1 Elderly medical patients readmission using published data (Caplan follow‐up at 28 days) | 3 | 447 | Risk Ratio (M‐H, Fixed, 95% CI) | 1.18 [0.83, 1.67] |
| 14.2 Patients with cellulitis or pneumonia ‐ published data | 2 | 243 | Risk Ratio (M‐H, Fixed, 95% CI) | 3.22 [1.08, 9.63] |
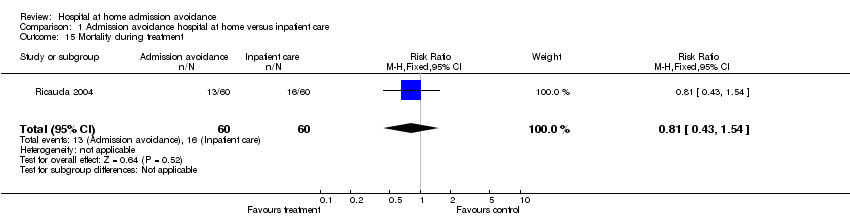
| 15 Mortality during treatment Show forest plot | 1 | 120 | Risk Ratio (M‐H, Fixed, 95% CI) | 0.81 [0.43, 1.54] |
|
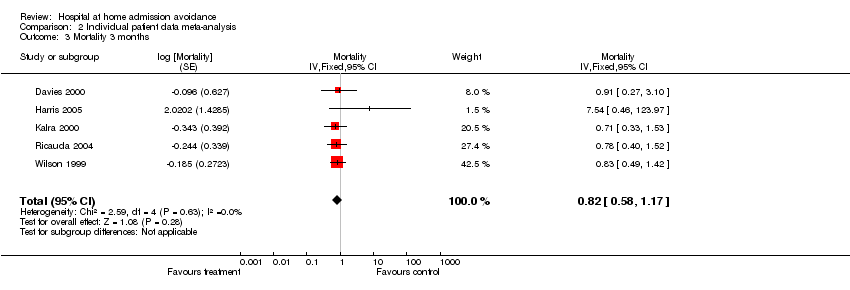
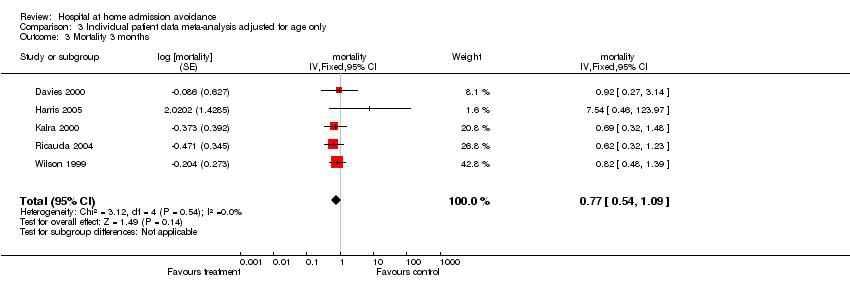
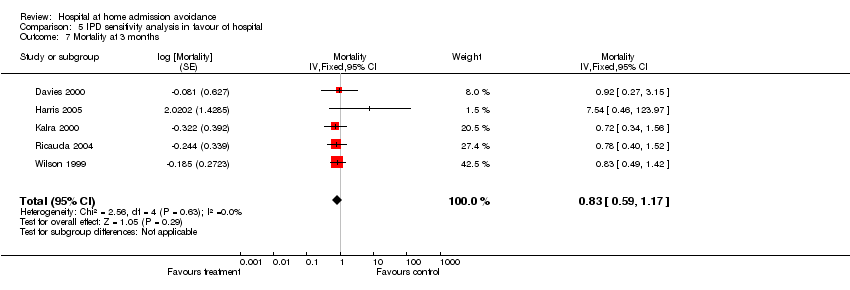
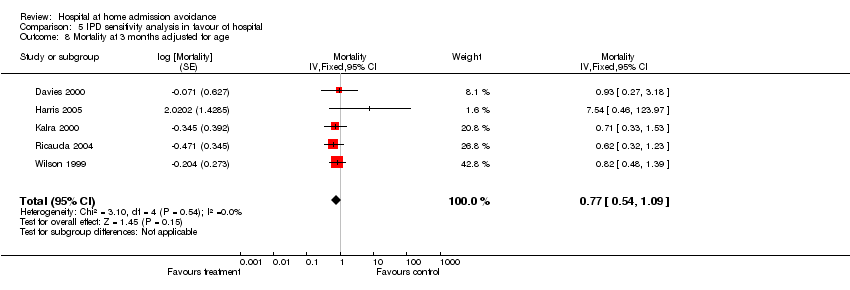
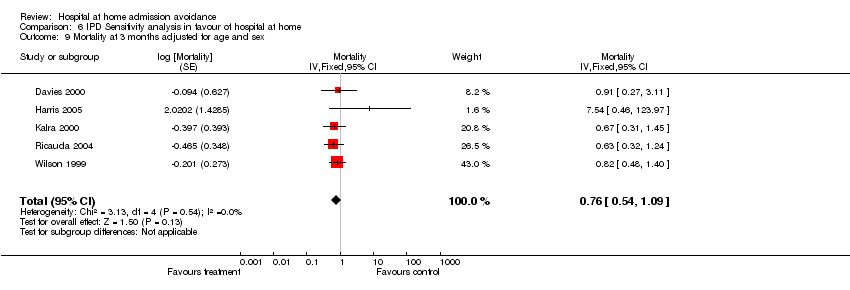
| 16 Mortality at 3 months elderly patients with a medical condition (using data from trialists) Show forest plot | 5 | 833 | Odds Ratio (M‐H, Fixed, 95% CI) | 0.83 [0.56, 1.23] |
|
| 17 Mortality at 3 months using published data Show forest plot | 3 | 644 | Risk Ratio (M‐H, Fixed, 95% CI) | 0.85 [0.60, 1.21] |
|
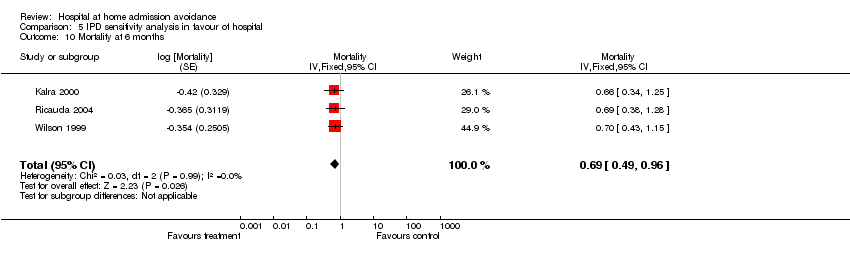
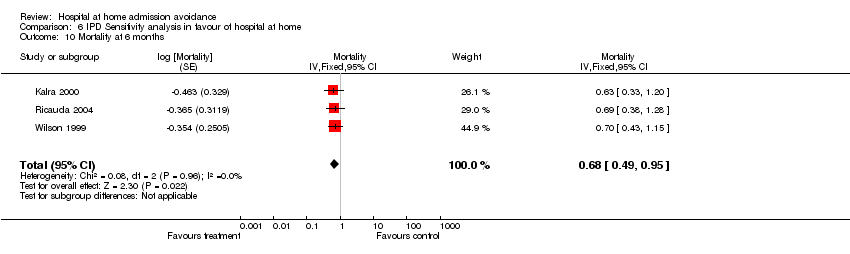
| 18 Mortality at 6 months follow up (using data from trialists, apart from Caplan) Show forest plot | 4 | 707 | Risk Ratio (M‐H, Fixed, 95% CI) | 0.76 [0.58, 0.99] |
|
| 19 Mortality at 6 months using published data Show forest plot | 2 | 413 | Risk Ratio (M‐H, Fixed, 95% CI) | 0.83 [0.58, 1.19] |
|
| 20 Mortality at 1 year follow up Show forest plot | 1 | 293 | Risk Ratio (M‐H, Fixed, 95% CI) | 0.64 [0.39, 1.05] |
|
| 21 Total length of stay to include hospital transfers for the hospital at home group Show forest plot | 1 | 171 | Mean Difference (IV, Fixed, 95% CI) | ‐14.13 [‐21.11, ‐7.15] |
|
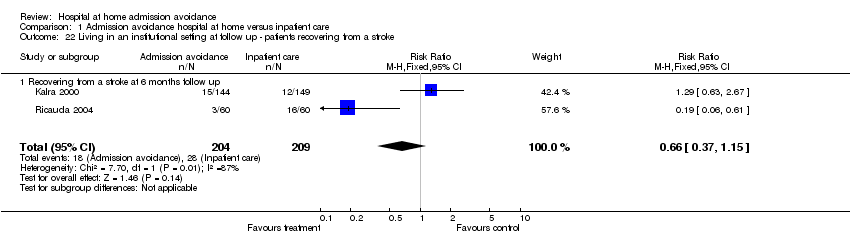
| 22 Living in an institutional setting at follow up ‐ patients recovering from a stroke Show forest plot | 2 | 413 | Risk Ratio (M‐H, Fixed, 95% CI) | 0.66 [0.37, 1.15] |
|
| 22.1 Recovering from a stroke at 6 months follow up | 2 | 413 | Risk Ratio (M‐H, Fixed, 95% CI) | 0.66 [0.37, 1.15] |
| 23 Living in a nursing home at follow up ‐ patients with dementia Show forest plot | 1 | 109 | Risk Ratio (M‐H, Fixed, 95% CI) | 0.11 [0.03, 0.46] |
|