Hospital at home admission avoidance
Referencias
References to studies included in this review
References to studies excluded from this review
References to studies awaiting assessment
Additional references
References to other published versions of this review
Characteristics of studies
Characteristics of included studies [ordered by study ID]
Ir a:
| Methods | RCT | |
| Participants | Setting: Australia Variety of acute conditions requiring admission to hospital ‐ patients recruited from casualty. Treatment = 51 | |
| Interventions | Hospital community outreach team Type of service: Hospital community outreach team. Clinical responsibility by GP or hospital doctor if GP declined | |
| Outcomes | Functional status | |
| Notes | Follow‐up: | |
| Risk of bias | ||
| Bias | Authors' judgement | Support for judgement |
| Allocation concealment (selection bias) | Low risk | A ‐ Adequate Computer generated random numbers, sealed envelope |
| Methods | RCT | |
| Participants | Setting: New Zealand Patients with cellulitis Ages Mean (sd) European | |
| Interventions | Hospital at home admission avoidance from the emergency department. Run by Pegasus Health, an independent practitioner's association for 230 GPs in Christchurch, New Zealand. | |
| Outcomes | Advancement of cellulitis Patient satisfaction | |
| Notes | Follow up: 3 and 6 days | |
| Risk of bias | ||
| Bias | Authors' judgement | Support for judgement |
| Allocation concealment (selection bias) | Low risk | A ‐ Adequate Telephone randomisation service |
| Methods | RCT | |
| Participants | Setting: UK Patients with chronic obstructive airways disease Treatment = 100 | |
| Interventions | Hospital at home Type of service: | |
| Outcomes | Respiratory function Readmission Quality of life | |
| Notes | Few details on measure of quality of life | |
| Risk of bias | ||
| Bias | Authors' judgement | Support for judgement |
| Allocation concealment (selection bias) | Unclear risk | B ‐ Unclear |
| Methods | RCT | |
| Participants | Setting: New Zealand | |
| Interventions | Operated as a hospital outreach programme under the management of Auckland Hospital from the Emergency Department or Acute Assessment Ward. A nurse led multi‐disciplinary team (physiotherapy, occupational therapy, social work) co‐ordinated care and rehabilitation for the patient within the patient's own home. There was a daily nursing review. Clinical responsibility was held by a dedicated hospital at home registrar, a consultant geriatrician and in some cases the patient's GP, with 24 hour on call medical cover. The service provided care 7 days a week with 10 hours nursing care a day available, and a 24 hour live in home carer if required. There was a daily nursing review, and a discharge hand over to ongoing support services. | |
| Outcomes | ||
| Notes | ||
| Risk of bias | ||
| Bias | Authors' judgement | Support for judgement |
| Allocation concealment (selection bias) | Low risk | A ‐ Adequate Telephone randomisation service |
| Methods | RCT | |
| Participants | Setting: UK Patients recovering from a moderately severe stroke Median (IQR) Living alone | |
| Interventions | Hospital outreach admission avoidance multi‐disciplinary with joint care from community services | |
| Outcomes | Mortality | |
| Notes | Follow up: 3, 6 and 12 months | |
| Risk of bias | ||
| Bias | Authors' judgement | Support for judgement |
| Allocation concealment (selection bias) | Low risk | A ‐ Adequate Block randomisation, telephone randomisation |
| Methods | RCT | |
| Participants | Setting: Australia Patients with chronic obstructive pulmonary disease Inclusion criteria: treatment = 13 | |
| Interventions | Hospital at home (discharge from Emergency Department) Patients retained in patient status and received clinical supervision from hospital specialist, and hospital had legal and financial responsibility; also received care from GP, community nursing and domiciliary care. Hospital medical staff provided 24 hour telephone support. | |
| Outcomes | Cost to the health service | |
| Notes | Follow up: duration of care in hospital at home or inpatient care | |
| Risk of bias | ||
| Bias | Authors' judgement | Support for judgement |
| Allocation concealment (selection bias) | Unclear risk | B ‐ Unclear |
| Methods | RCT | |
| Participants | Setting: San Giovanni Battista Hospital, Turin, Italy. A teaching & tertiary care hospital. Patients recovering from a stroke | |
| Interventions | Hospital outreach admission avoidance. 24 hour care available multi‐disciplinary team: physiotherapist, occupational therapist, nursing, hospital geriatrician, social worker, speech therapist, psychologist. | |
| Outcomes | Length of treatment | |
| Notes | Follow up: 6 months | |
| Risk of bias | ||
| Bias | Authors' judgement | Support for judgement |
| Allocation concealment (selection bias) | Unclear risk | B ‐ Unclear |
| Methods | RCT | |
| Participants | Setting: Christchurch, New Zealand Patients with community acquired pneumonia T=50.1 years Number recruited: T=24 | |
| Interventions | Hospital at home: admission avoidance from emergency room. Run by Pegasus Health, an independent practitioner's association for 230 GPs in Christchurch, New Zealand. | |
| Outcomes | Median number of days to discharge | |
| Notes | Follow up: 2 and 6 weeks | |
| Risk of bias | ||
| Bias | Authors' judgement | Support for judgement |
| Allocation concealment (selection bias) | Low risk | A ‐ Adequate Telephone randomisation |
| Methods | RCT | |
| Participants | Setting: San Giovanni Battista Hospital, Turin, Italy. Patients: elderly with advanced dementia Mean age (sd) Number recruited T=56 | |
| Interventions | Hospital at home run by S. Giovanni Battista Hospital, Turin, Italy: Geriatric Home Hospitalisation Service (GHHS), patients referred from emergency department. 24 hour a day care available, home nursing multi‐disciplinary care, rapid access to equipment | |
| Outcomes | Behavioural disturbances | |
| Notes | Follow up: to discharge from service | |
| Risk of bias | ||
| Bias | Authors' judgement | Support for judgement |
| Allocation concealment (selection bias) | Unclear risk | B ‐ Unclear |
| Methods | RCT | |
| Participants | Setting: Leicester, UK. treatment = 102 | |
| Interventions | Hospital at home (admission avoidance) Type of service: Maximum of 5 patients at a time Control group: in patient hospital care | |
| Outcomes | Mortality | |
| Notes | Follow‐up: | |
| Risk of bias | ||
| Bias | Authors' judgement | Support for judgement |
| Allocation concealment (selection bias) | Low risk | A ‐ Adequate Block randomisation, consecutively numbered sealed envelopes |
RCT: Randomised controlled trial
GP: General practicioner
sd: standard deviation
T: Treatment
C: Control
IV: Intra‐venous
SF 12: the SF 12 health survey
IQR: Inter‐quartile range
GHHS: Geriatric home hospitalisation service
ED: Emergency department
FEV1: Forced expiratory volume at 1 second
COPD: Chronic obstructive pulmonary disease
Characteristics of excluded studies [ordered by study ID]
Ir a:
| Study | Reason for exclusion |
| CCT | |
| Intervention does not substitute for inpatient care |
CCT: Clinical controlled trial
Data and analyses
| Outcome or subgroup title | No. of studies | No. of participants | Statistical method | Effect size | ||||||||||||||||||||||||||||||||||||||||||||||||||||
| 1 Functional ability Show forest plot | Other data | No numeric data | ||||||||||||||||||||||||||||||||||||||||||||||||||||||
| Analysis 1.1
Comparison 1 Admission avoidance hospital at home versus inpatient care, Outcome 1 Functional ability. | ||||||||||||||||||||||||||||||||||||||||||||||||||||||||
| 1.1 Admission avoidance patients recovering from a stroke functional ability | Other data | No numeric data | ||||||||||||||||||||||||||||||||||||||||||||||||||||||
| 1.2 Admission avoidance patients with a medical condition ‐ functional ability | Other data | No numeric data | ||||||||||||||||||||||||||||||||||||||||||||||||||||||
| 2 Quality of life Show forest plot | Other data | No numeric data | ||||||||||||||||||||||||||||||||||||||||||||||||||||||
| Analysis 1.2
Comparison 1 Admission avoidance hospital at home versus inpatient care, Outcome 2 Quality of life. | ||||||||||||||||||||||||||||||||||||||||||||||||||||||||
| 2.1 Admission avoidance quality of life | Other data | No numeric data | ||||||||||||||||||||||||||||||||||||||||||||||||||||||
| 3 Cognitive function Show forest plot | Other data | No numeric data | ||||||||||||||||||||||||||||||||||||||||||||||||||||||
| Analysis 1.3
Comparison 1 Admission avoidance hospital at home versus inpatient care, Outcome 3 Cognitive function. | ||||||||||||||||||||||||||||||||||||||||||||||||||||||||
| 3.1 admission avoidance ‐ cognitive function/psychological well being | Other data | No numeric data | ||||||||||||||||||||||||||||||||||||||||||||||||||||||
| 4 Patient satisfaction Show forest plot | Other data | No numeric data | ||||||||||||||||||||||||||||||||||||||||||||||||||||||
| Analysis 1.4
Comparison 1 Admission avoidance hospital at home versus inpatient care, Outcome 4 Patient satisfaction. | ||||||||||||||||||||||||||||||||||||||||||||||||||||||||
| 5 Clinical outcomes Show forest plot | Other data | No numeric data | ||||||||||||||||||||||||||||||||||||||||||||||||||||||
| Analysis 1.5
Comparison 1 Admission avoidance hospital at home versus inpatient care, Outcome 5 Clinical outcomes. | ||||||||||||||||||||||||||||||||||||||||||||||||||||||||
| 5.1 clinical outcomes | Other data | No numeric data | ||||||||||||||||||||||||||||||||||||||||||||||||||||||
| 5.2 Use of antipsychotic drugs | Other data | No numeric data | ||||||||||||||||||||||||||||||||||||||||||||||||||||||
| 6 Cost Show forest plot | Other data | No numeric data | ||||||||||||||||||||||||||||||||||||||||||||||||||||||
| Analysis 1.6
Comparison 1 Admission avoidance hospital at home versus inpatient care, Outcome 6 Cost. | ||||||||||||||||||||||||||||||||||||||||||||||||||||||||
| 6.1 health service costs | Other data | No numeric data | ||||||||||||||||||||||||||||||||||||||||||||||||||||||
| 6.2 informal care inputs | Other data | No numeric data | ||||||||||||||||||||||||||||||||||||||||||||||||||||||
| 6.3 use of other health services | Other data | No numeric data | ||||||||||||||||||||||||||||||||||||||||||||||||||||||
| 7 Length of stay Show forest plot | Other data | No numeric data | ||||||||||||||||||||||||||||||||||||||||||||||||||||||
| Analysis 1.7
Comparison 1 Admission avoidance hospital at home versus inpatient care, Outcome 7 Length of stay. | ||||||||||||||||||||||||||||||||||||||||||||||||||||||||
| 7.1 Trials reporting length of stay | Other data | No numeric data | ||||||||||||||||||||||||||||||||||||||||||||||||||||||
| 8 Treatment inputs Show forest plot | Other data | No numeric data | ||||||||||||||||||||||||||||||||||||||||||||||||||||||
| Analysis 1.8
Comparison 1 Admission avoidance hospital at home versus inpatient care, Outcome 8 Treatment inputs. | ||||||||||||||||||||||||||||||||||||||||||||||||||||||||
| 9 Carer outcomes Show forest plot | Other data | No numeric data | ||||||||||||||||||||||||||||||||||||||||||||||||||||||
| Analysis 1.9
Comparison 1 Admission avoidance hospital at home versus inpatient care, Outcome 9 Carer outcomes. | ||||||||||||||||||||||||||||||||||||||||||||||||||||||||
| 9.1 Carer satisfaction | Other data | No numeric data | ||||||||||||||||||||||||||||||||||||||||||||||||||||||
| 10 GPs views Show forest plot | Other data | No numeric data | ||||||||||||||||||||||||||||||||||||||||||||||||||||||
| Analysis 1.10
Comparison 1 Admission avoidance hospital at home versus inpatient care, Outcome 10 GPs views. | ||||||||||||||||||||||||||||||||||||||||||||||||||||||||
| 11 Anxiety and depression Show forest plot | Other data | No numeric data | ||||||||||||||||||||||||||||||||||||||||||||||||||||||
| Analysis 1.11
Comparison 1 Admission avoidance hospital at home versus inpatient care, Outcome 11 Anxiety and depression. | ||||||||||||||||||||||||||||||||||||||||||||||||||||||||
| 12 Readmission for hospital at home group within 2 weeks of randomisation Show forest plot | Other data | No numeric data | ||||||||||||||||||||||||||||||||||||||||||||||||||||||
| Analysis 1.12
Comparison 1 Admission avoidance hospital at home versus inpatient care, Outcome 12 Readmission for hospital at home group within 2 weeks of randomisation. | ||||||||||||||||||||||||||||||||||||||||||||||||||||||||
| 13 Re admission to hospital for patients with a medical condition at 3 months Show forest plot | 3 | 416 | Risk Ratio (M‐H, Fixed, 95% CI) | 1.48 [1.02, 2.15] | ||||||||||||||||||||||||||||||||||||||||||||||||||||
| Analysis 1.13  Comparison 1 Admission avoidance hospital at home versus inpatient care, Outcome 13 Re admission to hospital for patients with a medical condition at 3 months. | ||||||||||||||||||||||||||||||||||||||||||||||||||||||||
| 13.1 Readmission for patients with a medical condition using number of events from trial databases | 3 | 416 | Risk Ratio (M‐H, Fixed, 95% CI) | 1.48 [1.02, 2.15] | ||||||||||||||||||||||||||||||||||||||||||||||||||||
| 14 Readmissions at 3 months using published data Show forest plot | 5 | 690 | Risk Ratio (M‐H, Fixed, 95% CI) | 1.35 [0.97, 1.87] | ||||||||||||||||||||||||||||||||||||||||||||||||||||
| Analysis 1.14  Comparison 1 Admission avoidance hospital at home versus inpatient care, Outcome 14 Readmissions at 3 months using published data. | ||||||||||||||||||||||||||||||||||||||||||||||||||||||||
| 14.1 Elderly medical patients readmission using published data (Caplan follow‐up at 28 days) | 3 | 447 | Risk Ratio (M‐H, Fixed, 95% CI) | 1.18 [0.83, 1.67] | ||||||||||||||||||||||||||||||||||||||||||||||||||||
| 14.2 Patients with cellulitis or pneumonia ‐ published data | 2 | 243 | Risk Ratio (M‐H, Fixed, 95% CI) | 3.22 [1.08, 9.63] | ||||||||||||||||||||||||||||||||||||||||||||||||||||
| 15 Mortality during treatment Show forest plot | 1 | 120 | Risk Ratio (M‐H, Fixed, 95% CI) | 0.81 [0.43, 1.54] | ||||||||||||||||||||||||||||||||||||||||||||||||||||
| Analysis 1.15  Comparison 1 Admission avoidance hospital at home versus inpatient care, Outcome 15 Mortality during treatment. | ||||||||||||||||||||||||||||||||||||||||||||||||||||||||
| 16 Mortality at 3 months elderly patients with a medical condition (using data from trialists) Show forest plot | 5 | 833 | Odds Ratio (M‐H, Fixed, 95% CI) | 0.83 [0.56, 1.23] | ||||||||||||||||||||||||||||||||||||||||||||||||||||
| Analysis 1.16  Comparison 1 Admission avoidance hospital at home versus inpatient care, Outcome 16 Mortality at 3 months elderly patients with a medical condition (using data from trialists). | ||||||||||||||||||||||||||||||||||||||||||||||||||||||||
| 17 Mortality at 3 months using published data Show forest plot | 3 | 644 | Risk Ratio (M‐H, Fixed, 95% CI) | 0.85 [0.60, 1.21] | ||||||||||||||||||||||||||||||||||||||||||||||||||||
| Analysis 1.17  Comparison 1 Admission avoidance hospital at home versus inpatient care, Outcome 17 Mortality at 3 months using published data. | ||||||||||||||||||||||||||||||||||||||||||||||||||||||||
| 18 Mortality at 6 months follow up (using data from trialists, apart from Caplan) Show forest plot | 4 | 707 | Risk Ratio (M‐H, Fixed, 95% CI) | 0.76 [0.58, 0.99] | ||||||||||||||||||||||||||||||||||||||||||||||||||||
| Analysis 1.18  Comparison 1 Admission avoidance hospital at home versus inpatient care, Outcome 18 Mortality at 6 months follow up (using data from trialists, apart from Caplan). | ||||||||||||||||||||||||||||||||||||||||||||||||||||||||
| 19 Mortality at 6 months using published data Show forest plot | 2 | 413 | Risk Ratio (M‐H, Fixed, 95% CI) | 0.83 [0.58, 1.19] | ||||||||||||||||||||||||||||||||||||||||||||||||||||
| Analysis 1.19  Comparison 1 Admission avoidance hospital at home versus inpatient care, Outcome 19 Mortality at 6 months using published data. | ||||||||||||||||||||||||||||||||||||||||||||||||||||||||
| 20 Mortality at 1 year follow up Show forest plot | 1 | 293 | Risk Ratio (M‐H, Fixed, 95% CI) | 0.64 [0.39, 1.05] | ||||||||||||||||||||||||||||||||||||||||||||||||||||
| Analysis 1.20  Comparison 1 Admission avoidance hospital at home versus inpatient care, Outcome 20 Mortality at 1 year follow up. | ||||||||||||||||||||||||||||||||||||||||||||||||||||||||
| 21 Total length of stay to include hospital transfers for the hospital at home group Show forest plot | 1 | 171 | Mean Difference (IV, Fixed, 95% CI) | ‐14.13 [‐21.11, ‐7.15] | ||||||||||||||||||||||||||||||||||||||||||||||||||||
| Analysis 1.21  Comparison 1 Admission avoidance hospital at home versus inpatient care, Outcome 21 Total length of stay to include hospital transfers for the hospital at home group. | ||||||||||||||||||||||||||||||||||||||||||||||||||||||||
| 22 Living in an institutional setting at follow up ‐ patients recovering from a stroke Show forest plot | 2 | 413 | Risk Ratio (M‐H, Fixed, 95% CI) | 0.66 [0.37, 1.15] | ||||||||||||||||||||||||||||||||||||||||||||||||||||
| Analysis 1.22  Comparison 1 Admission avoidance hospital at home versus inpatient care, Outcome 22 Living in an institutional setting at follow up ‐ patients recovering from a stroke. | ||||||||||||||||||||||||||||||||||||||||||||||||||||||||
| 22.1 Recovering from a stroke at 6 months follow up | 2 | 413 | Risk Ratio (M‐H, Fixed, 95% CI) | 0.66 [0.37, 1.15] | ||||||||||||||||||||||||||||||||||||||||||||||||||||
| 23 Living in a nursing home at follow up ‐ patients with dementia Show forest plot | 1 | 109 | Risk Ratio (M‐H, Fixed, 95% CI) | 0.11 [0.03, 0.46] | ||||||||||||||||||||||||||||||||||||||||||||||||||||
| Analysis 1.23  Comparison 1 Admission avoidance hospital at home versus inpatient care, Outcome 23 Living in a nursing home at follow up ‐ patients with dementia. | ||||||||||||||||||||||||||||||||||||||||||||||||||||||||
| Outcome or subgroup title | No. of studies | No. of participants | Statistical method | Effect size |
| 1 Readmission at 3 months Show forest plot | 3 | Readmission (Fixed, 95% CI) | 1.48 [0.95, 2.30] | |
| Analysis 2.1  Comparison 2 Individual patient data meta‐analysis, Outcome 1 Readmission at 3 months. | ||||
| 2 Readmission 3 months (excluding readmissions in the first 14 days) Show forest plot | 3 | Readmission (Fixed, 95% CI) | 1.41 [0.87, 2.30] | |
| Analysis 2.2  Comparison 2 Individual patient data meta‐analysis, Outcome 2 Readmission 3 months (excluding readmissions in the first 14 days). | ||||
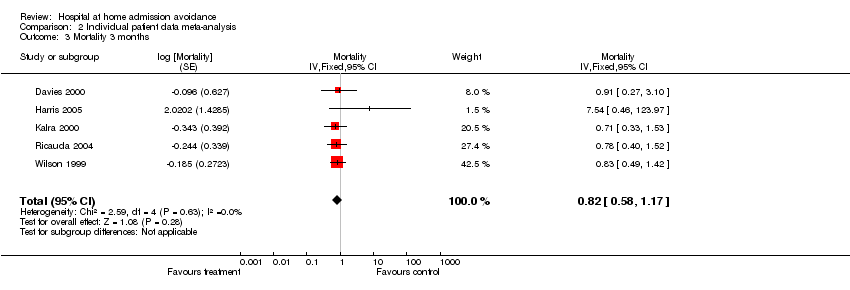
| 3 Mortality 3 months Show forest plot | 5 | Mortality (Fixed, 95% CI) | 0.82 [0.58, 1.17] | |
| Analysis 2.3  Comparison 2 Individual patient data meta‐analysis, Outcome 3 Mortality 3 months. | ||||
| 4 Mortality 6 months Show forest plot | 3 | Mortality (Fixed, 95% CI) | 0.68 [0.49, 0.95] | |
| Analysis 2.4  Comparison 2 Individual patient data meta‐analysis, Outcome 4 Mortality 6 months. | ||||
| Outcome or subgroup title | No. of studies | No. of participants | Statistical method | Effect size |
| 1 Readmission 3 months Show forest plot | 3 | Readmission (Fixed, 95% CI) | 1.49 [0.96, 2.32] | |
| Analysis 3.1  Comparison 3 Individual patient data meta‐analysis adjusted for age only, Outcome 1 Readmission 3 months. | ||||
| 2 Readmission 3 months (without readmission in the first 14 days) Show forest plot | 3 | Readmission (Fixed, 95% CI) | 1.42 [0.87, 2.30] | |
| Analysis 3.2  Comparison 3 Individual patient data meta‐analysis adjusted for age only, Outcome 2 Readmission 3 months (without readmission in the first 14 days). | ||||
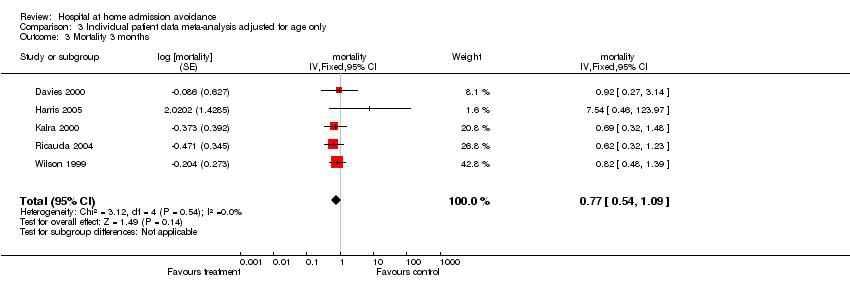
| 3 Mortality 3 months Show forest plot | 5 | mortality (Fixed, 95% CI) | 0.77 [0.54, 1.09] | |
| Analysis 3.3  Comparison 3 Individual patient data meta‐analysis adjusted for age only, Outcome 3 Mortality 3 months. | ||||
| 4 Mortality 6 months Show forest plot | 3 | mortality (Fixed, 95% CI) | 0.62 [0.44, 0.86] | |
| Analysis 3.4  Comparison 3 Individual patient data meta‐analysis adjusted for age only, Outcome 4 Mortality 6 months. | ||||
| Outcome or subgroup title | No. of studies | No. of participants | Statistical method | Effect size |
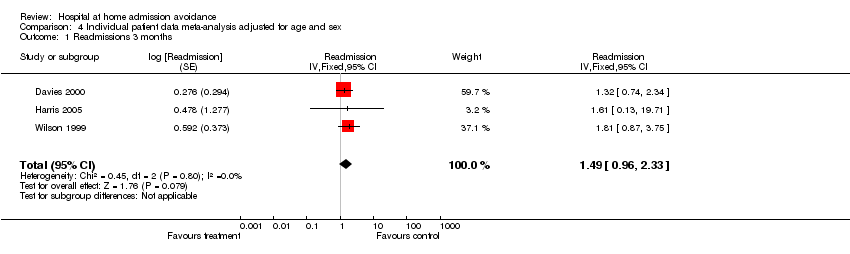
| 1 Readmissions 3 months Show forest plot | 3 | Readmission (Fixed, 95% CI) | 1.49 [0.96, 2.33] | |
| Analysis 4.1  Comparison 4 Individual patient data meta‐analysis adjusted for age and sex, Outcome 1 Readmissions 3 months. | ||||
| 2 Readmission 3 months (without readmission in the first 14 days) Show forest plot | 3 | Readmission (Fixed, 95% CI) | 1.42 [0.87, 2.30] | |
| Analysis 4.2  Comparison 4 Individual patient data meta‐analysis adjusted for age and sex, Outcome 2 Readmission 3 months (without readmission in the first 14 days). | ||||
| 3 Mortality at 3 months Show forest plot | 5 | mortality (Fixed, 95% CI) | 0.77 [0.54, 1.09] | |
| Analysis 4.3  Comparison 4 Individual patient data meta‐analysis adjusted for age and sex, Outcome 3 Mortality at 3 months. | ||||
| 4 Mortality at 6 months Show forest plot | 3 | Mortality (Fixed, 95% CI) | 0.62 [0.45, 0.87] | |
| Analysis 4.4  Comparison 4 Individual patient data meta‐analysis adjusted for age and sex, Outcome 4 Mortality at 6 months. | ||||
| Outcome or subgroup title | No. of studies | No. of participants | Statistical method | Effect size |
| 1 Excluding readmissions in the 1st 14 days Show forest plot | 3 | Readmission (Fixed, 95% CI) | 1.60 [0.99, 2.59] | |
| Analysis 5.1  Comparison 5 IPD sensitivity analysis in favour of hospital, Outcome 1 Excluding readmissions in the 1st 14 days. | ||||
| 1.1 Readmission excluding readmissions in the 1st 14 days | 3 | Readmission (Fixed, 95% CI) | 1.60 [0.99, 2.59] | |
| 2 All readmissions Show forest plot | 3 | Readmissions (Fixed, 95% CI) | 1.72 [1.11, 2.67] | |
| Analysis 5.2  Comparison 5 IPD sensitivity analysis in favour of hospital, Outcome 2 All readmissions. | ||||
| 3 Excluding readmissions in the 1st 14 days adjusted for age Show forest plot | 3 | Readmissions (Fixed, 95% CI) | 1.62 [1.00, 2.62] | |
| Analysis 5.3  Comparison 5 IPD sensitivity analysis in favour of hospital, Outcome 3 Excluding readmissions in the 1st 14 days adjusted for age. | ||||
| 4 All readmissions adjusted for age Show forest plot | 3 | Readmissions (Fixed, 95% CI) | 1.77 [1.14, 2.75] | |
| Analysis 5.4  Comparison 5 IPD sensitivity analysis in favour of hospital, Outcome 4 All readmissions adjusted for age. | ||||
| 5 Readmissions excluding readmissions in the 1st 14 days adjusted for age and sex Show forest plot | 3 | Readmissions (Fixed, 95% CI) | 1.62 [1.00, 2.63] | |
| Analysis 5.5  Comparison 5 IPD sensitivity analysis in favour of hospital, Outcome 5 Readmissions excluding readmissions in the 1st 14 days adjusted for age and sex. | ||||
| 6 All readmissions adjusted for age and sex Show forest plot | 3 | Readmissions (Fixed, 95% CI) | 1.77 [1.14, 2.76] | |
| Analysis 5.6  Comparison 5 IPD sensitivity analysis in favour of hospital, Outcome 6 All readmissions adjusted for age and sex. | ||||
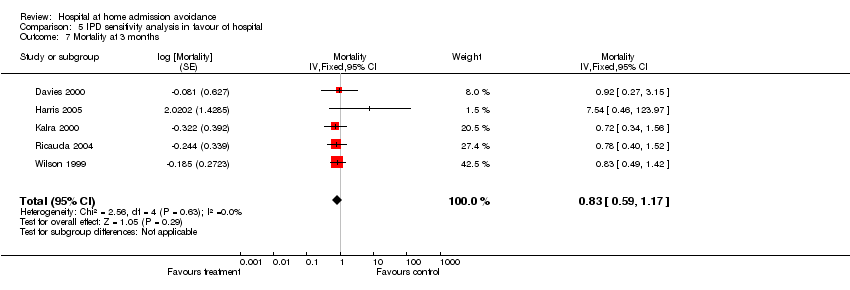
| 7 Mortality at 3 months Show forest plot | 5 | Mortality (Fixed, 95% CI) | 0.83 [0.59, 1.17] | |
| Analysis 5.7  Comparison 5 IPD sensitivity analysis in favour of hospital, Outcome 7 Mortality at 3 months. | ||||
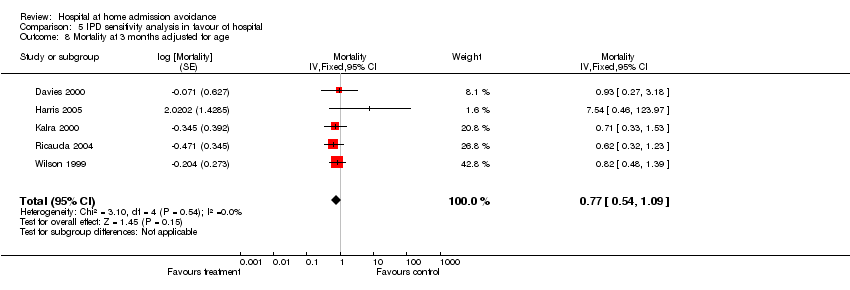
| 8 Mortality at 3 months adjusted for age Show forest plot | 5 | Mortality (Fixed, 95% CI) | 0.77 [0.54, 1.09] | |
| Analysis 5.8  Comparison 5 IPD sensitivity analysis in favour of hospital, Outcome 8 Mortality at 3 months adjusted for age. | ||||
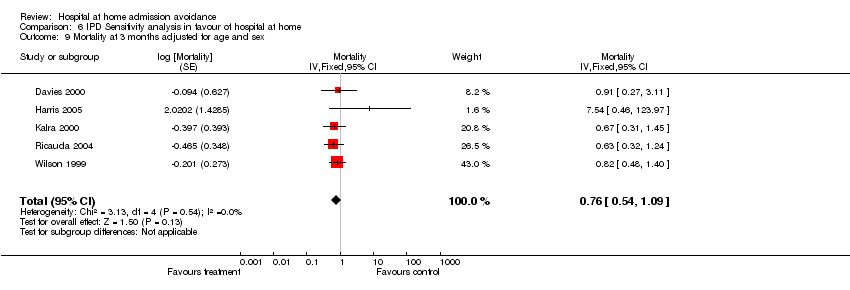
| 9 Mortality at 3 months adjusted for age and sex Show forest plot | 5 | Mortality (Fixed, 95% CI) | 0.78 [0.55, 1.10] | |
| Analysis 5.9  Comparison 5 IPD sensitivity analysis in favour of hospital, Outcome 9 Mortality at 3 months adjusted for age and sex. | ||||
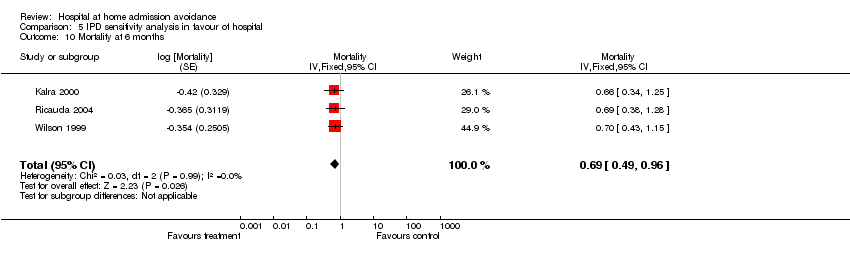
| 10 Mortality at 6 months Show forest plot | 3 | Mortality (Fixed, 95% CI) | 0.69 [0.49, 0.96] | |
| Analysis 5.10  Comparison 5 IPD sensitivity analysis in favour of hospital, Outcome 10 Mortality at 6 months. | ||||
| 11 Mortality at 6 months adjusted for age Show forest plot | 3 | Mortality (Fixed, 95% CI) | 0.62 [0.45, 0.87] | |
| Analysis 5.11  Comparison 5 IPD sensitivity analysis in favour of hospital, Outcome 11 Mortality at 6 months adjusted for age. | ||||
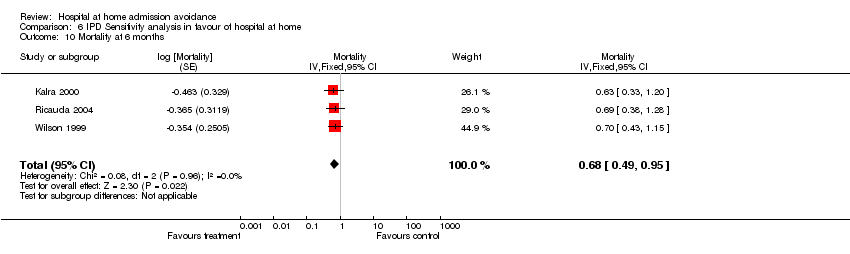
| 12 Mortality at 6 months adjusted for age and sex Show forest plot | 3 | Mortality (Fixed, 95% CI) | 0.63 [0.45, 0.87] | |
| Analysis 5.12  Comparison 5 IPD sensitivity analysis in favour of hospital, Outcome 12 Mortality at 6 months adjusted for age and sex. | ||||
| Outcome or subgroup title | No. of studies | No. of participants | Statistical method | Effect size |
| 1 Excluding readmissions in the 1st 14 days Show forest plot | 3 | Readmission (Fixed, 95% CI) | 1.26 [0.78, 2.04] | |
| Analysis 6.1  Comparison 6 IPD Sensitivity analysis in favour of hospital at home, Outcome 1 Excluding readmissions in the 1st 14 days. | ||||
| 1.1 Readmission excluding readmissions in the 1st 14 days | 3 | Readmission (Fixed, 95% CI) | 1.26 [0.78, 2.04] | |
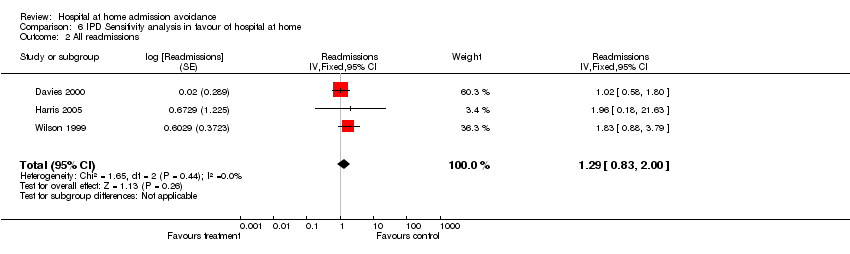
| 2 All readmissions Show forest plot | 3 | Readmissions (Fixed, 95% CI) | 1.29 [0.83, 2.00] | |
| Analysis 6.2  Comparison 6 IPD Sensitivity analysis in favour of hospital at home, Outcome 2 All readmissions. | ||||
| 3 Excluding readmissions in the 1st 14 days adjusted for age Show forest plot | 3 | Readmissions (Fixed, 95% CI) | 1.25 [0.77, 2.02] | |
| Analysis 6.3  Comparison 6 IPD Sensitivity analysis in favour of hospital at home, Outcome 3 Excluding readmissions in the 1st 14 days adjusted for age. | ||||
| 4 All readmissions adjusted for age Show forest plot | 3 | Readmissions (Fixed, 95% CI) | 1.29 [0.83, 2.00] | |
| Analysis 6.4  Comparison 6 IPD Sensitivity analysis in favour of hospital at home, Outcome 4 All readmissions adjusted for age. | ||||
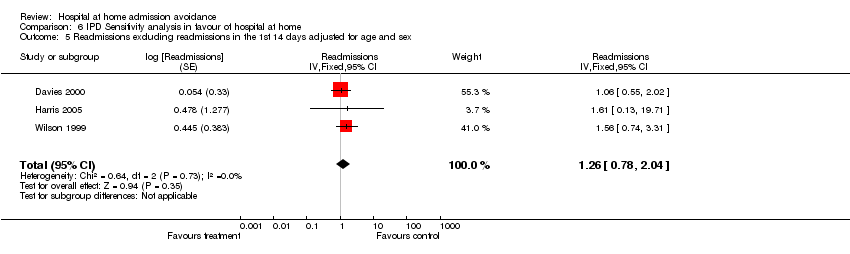
| 5 Readmissions excluding readmissions in the 1st 14 days adjusted for age and sex Show forest plot | 3 | Readmissions (Fixed, 95% CI) | 1.26 [0.78, 2.04] | |
| Analysis 6.5  Comparison 6 IPD Sensitivity analysis in favour of hospital at home, Outcome 5 Readmissions excluding readmissions in the 1st 14 days adjusted for age and sex. | ||||
| 6 All readmissions adjusted for age and sex Show forest plot | 3 | Readmissions (Fixed, 95% CI) | 1.30 [0.83, 2.01] | |
| Analysis 6.6  Comparison 6 IPD Sensitivity analysis in favour of hospital at home, Outcome 6 All readmissions adjusted for age and sex. | ||||
| 7 Mortality at 3 months Show forest plot | 5 | Mortality (Fixed, 95% CI) | 0.82 [0.58, 1.16] | |
| Analysis 6.7  Comparison 6 IPD Sensitivity analysis in favour of hospital at home, Outcome 7 Mortality at 3 months. | ||||
| 8 Mortality at 3 months adjusted for age Show forest plot | 5 | Mortality (Fixed, 95% CI) | 0.76 [0.54, 1.08] | |
| Analysis 6.8  Comparison 6 IPD Sensitivity analysis in favour of hospital at home, Outcome 8 Mortality at 3 months adjusted for age. | ||||
| 9 Mortality at 3 months adjusted for age and sex Show forest plot | 5 | Mortality (Fixed, 95% CI) | 0.76 [0.54, 1.09] | |
| Analysis 6.9  Comparison 6 IPD Sensitivity analysis in favour of hospital at home, Outcome 9 Mortality at 3 months adjusted for age and sex. | ||||
| 10 Mortality at 6 months Show forest plot | 3 | Mortality (Fixed, 95% CI) | 0.68 [0.49, 0.95] | |
| Analysis 6.10  Comparison 6 IPD Sensitivity analysis in favour of hospital at home, Outcome 10 Mortality at 6 months. | ||||
| 11 Mortality at 6 months adjusted for age Show forest plot | 3 | Mortality (Fixed, 95% CI) | 0.62 [0.44, 0.86] | |
| Analysis 6.11  Comparison 6 IPD Sensitivity analysis in favour of hospital at home, Outcome 11 Mortality at 6 months adjusted for age. | ||||
| 12 Mortality at 6 months adjusted for age and sex Show forest plot | 3 | Mortality (Fixed, 95% CI) | 0.62 [0.44, 0.86] | |
| Analysis 6.12  Comparison 6 IPD Sensitivity analysis in favour of hospital at home, Outcome 12 Mortality at 6 months adjusted for age and sex. | ||||
| Study | Functional ability | Results | Notes |
| Admission avoidance patients recovering from a stroke functional ability | |||
| Kalra 2000 | Modified Rankin scale 0‐3 (measure of dependence: 0=independent and 3=dependent). Number independent and require minor assistance for day to day activities. | Modified Rankin | |
| Ricauda 2004 | Activities of daily living (number of functions lost, score 0 to 6). | Activities of daily living (scale 0 to 6) | |
| Admission avoidance patients with a medical condition ‐ functional ability | |||
| Caplan 1999 | Change in Barthel score from admission to discharge (high score=greater independence) | Mean (SEM) | |
| Davies 2000 | St Georges' respiratory questionnaire: | Baseline scores | |
| Tibaldi 2004 | Behavioural disturbances | Sleeping disorders | |
| Wilson 1999 | Barthel Index:At 3 months, median (IQR)Treatment: 16 (13‐19)Control: 16 (12‐20)[0, ‐1.1 to 2.1]Sickness Impact Profile:At 3 months, median (IQR)Treatment: 24 (20‐31)Control: 26 (20‐31)[‐2, ‐4.1 to 4.0] | Barthel Index ‐ no (%) not assessed: treatment 21 (28%), control 18 (28%)Sickness Impact Profile ‐ no (%) not assessed: treatment 31 (41%), control 30 (46%) | |
Comparison 1 Admission avoidance hospital at home versus inpatient care, Outcome 1 Functional ability.
| Study | Outcomes | Results | Notes |
| Admission avoidance quality of life | |||
| Corwin 2005 | SF 36 | SF 36 | Differences calculated on absolute differences between day 0 & day 3, or day 0 & day 6. |
| Richards 2005 | Mean physical component score SF‐12, higher score=better health | At 2 weeks | |
| Wilson 1999 | Sickness Impact Profile | Median (IQR) at 2 weeks | |
Comparison 1 Admission avoidance hospital at home versus inpatient care, Outcome 2 Quality of life.
| Study | Outcomes | Results | Notes |
| admission avoidance ‐ cognitive function/psychological well being | |||
| Caplan 1999 | Mental status questionnaire score from admission to | Mean (SEM) | |
| Ricauda 2004 | Geriatric Depression Scale score (range 0‐30) | At 6 months | |
| Wilson 1999 | Philadelphia Geriatric Morale Scale: | At 3 months: median (IQR) | |
Comparison 1 Admission avoidance hospital at home versus inpatient care, Outcome 3 Cognitive function.
| Study | Outcomes | Results | Notes |
| Caplan 1999 | Patient satisfaction: | Mean score | Response rates were 78% for the treatment group, and 40% for the control. |
| Corwin 2005 | Overall satisfaction | Very satisfied or quite satisfied | Numbers for control group vary between 88 and 91 due to missing data |
| Richards 2005 | Reporting very happy with care | T=24/24 (100%) | |
| Wilson 1999 | Patient satisfaction, scale 0 to 18 | At 2 weeks, or discharge, median (IQR) | |
Comparison 1 Admission avoidance hospital at home versus inpatient care, Outcome 4 Patient satisfaction.
| Study | Outcomes | Results | Notes |
| clinical outcomes | |||
| Corwin 2005 | No advancement of cellulitis (indelible line drawn around peripheral margin of the cellulitis and dated) | Mean (sd) days | |
| Davies 2000 | |||
| Use of antipsychotic drugs | |||
| Tibaldi 2004 | Use of antipsychotic drugs | On admission | |
Comparison 1 Admission avoidance hospital at home versus inpatient care, Outcome 5 Clinical outcomes.
| Study | Outcomes | Results | Notes |
| health service costs | |||
| Caplan 1999 | Cost | Average cost per episode: | Cost data financial year 1995/1996 |
| Kalra 2000 | Resources and cost | Physiotherapy | |
| Nicholson 2001 | Costs | Treatment | Costs based on financial year 99/00; Used average DRG costs (Australian $), patient data for ED costs, and modeled costs for OPD clinic visits. |
| Ricauda 2004 | Mean total cost (EUR converted to US$ 1 Euro=$1.3) | T=$6 413.5 per patient | |
| Richards 2005 | CostCosts based on DRGs for control and actual cost for intervention | Mean cost per patient NZ$ | |
| Wilson 1999 | Cost | Cost of initial episode: | Cost data financial year 1995/1996 |
| informal care inputs | |||
| Kalra 2000 | Informal care inputs | Received informal care: | |
| use of other health services | |||
| Davies 2000 | Referred for increased social support: Treatment: 24/100 (24%)Control: 3/50 (6%)Difference 18%, 95%CI 7.3% to 28.6% | While receiving hospital at home care, or on discharge from hospital | 0 |
Comparison 1 Admission avoidance hospital at home versus inpatient care, Outcome 6 Cost.
| Study | Results | Outcomes | Notes |
| Trials reporting length of stay | |||
| Davies 2000 | Hospital length of stay | Control group: median 5 days (IQR 4 to 7 days) | |
| Richards 2005 | Median number of days to discharge | T=4 days (range 1‐14) | |
| Wilson 1999 | Length of stay | Hospital or hospital at home LOS | Hospital length of stay, and total days of care (hospital plus hospital at home) ‐ Mean (sd) unless stated otherwise |
Comparison 1 Admission avoidance hospital at home versus inpatient care, Outcome 7 Length of stay.
| Study | Outcomes | Results | Notes |
| Corwin 2005 | Days on oral antibiotics | HR 1.09 (0.82 to 1.45) p=0.56 | |
| Kalra 2000 | Physiotherapy (number treated) | ||
Comparison 1 Admission avoidance hospital at home versus inpatient care, Outcome 8 Treatment inputs.
| Study | Outcomes | Results | Notes |
| Carer satisfaction | |||
| Caplan 1999 | Carer satisfaction: | Mean score | Satisfaction rated on a 4 point scale: 1=excellent, 2=good, 3=fair, 4=poor |
Comparison 1 Admission avoidance hospital at home versus inpatient care, Outcome 9 Carer outcomes.
| Study | Outcomes | Results | Notes |
| Caplan 1999 | GP satisfaction: | Mean score | Satisfaction rated on a 4 point scale: 1=excellent, 2=good, 3=fair, 4=poor |
Comparison 1 Admission avoidance hospital at home versus inpatient care, Outcome 10 GPs views.
| Study | Outcomes | Results | Notes |
| Ricauda 2004 | Geriatric Depression Scale score | Geriatric Depression | |
Comparison 1 Admission avoidance hospital at home versus inpatient care, Outcome 11 Anxiety and depression.
| Study | Outcomes | Results | Notes |
| Kalra 2000 | Readmission within 2 weeks of randomisation | T=51/149 | |
Comparison 1 Admission avoidance hospital at home versus inpatient care, Outcome 12 Readmission for hospital at home group within 2 weeks of randomisation.
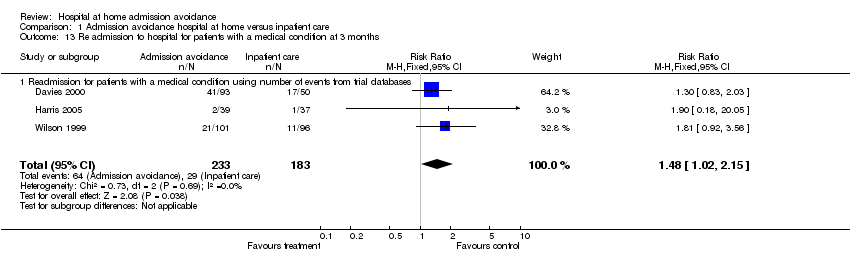
Comparison 1 Admission avoidance hospital at home versus inpatient care, Outcome 13 Re admission to hospital for patients with a medical condition at 3 months.

Comparison 1 Admission avoidance hospital at home versus inpatient care, Outcome 14 Readmissions at 3 months using published data.
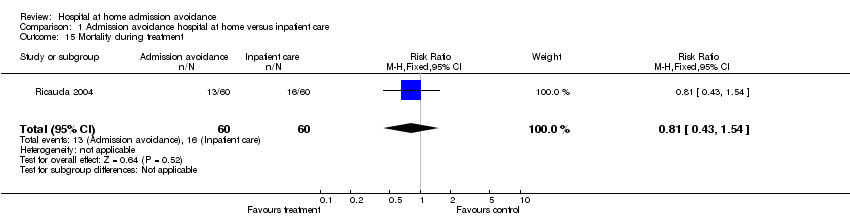
Comparison 1 Admission avoidance hospital at home versus inpatient care, Outcome 15 Mortality during treatment.

Comparison 1 Admission avoidance hospital at home versus inpatient care, Outcome 16 Mortality at 3 months elderly patients with a medical condition (using data from trialists).

Comparison 1 Admission avoidance hospital at home versus inpatient care, Outcome 17 Mortality at 3 months using published data.

Comparison 1 Admission avoidance hospital at home versus inpatient care, Outcome 18 Mortality at 6 months follow up (using data from trialists, apart from Caplan).

Comparison 1 Admission avoidance hospital at home versus inpatient care, Outcome 19 Mortality at 6 months using published data.

Comparison 1 Admission avoidance hospital at home versus inpatient care, Outcome 20 Mortality at 1 year follow up.

Comparison 1 Admission avoidance hospital at home versus inpatient care, Outcome 21 Total length of stay to include hospital transfers for the hospital at home group.
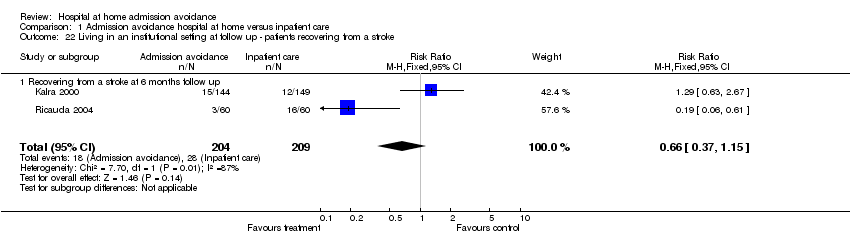
Comparison 1 Admission avoidance hospital at home versus inpatient care, Outcome 22 Living in an institutional setting at follow up ‐ patients recovering from a stroke.

Comparison 1 Admission avoidance hospital at home versus inpatient care, Outcome 23 Living in a nursing home at follow up ‐ patients with dementia.
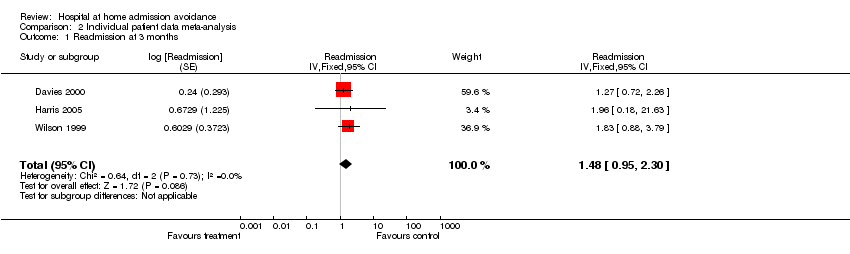
Comparison 2 Individual patient data meta‐analysis, Outcome 1 Readmission at 3 months.

Comparison 2 Individual patient data meta‐analysis, Outcome 2 Readmission 3 months (excluding readmissions in the first 14 days).
Comparison 2 Individual patient data meta‐analysis, Outcome 3 Mortality 3 months.

Comparison 2 Individual patient data meta‐analysis, Outcome 4 Mortality 6 months.

Comparison 3 Individual patient data meta‐analysis adjusted for age only, Outcome 1 Readmission 3 months.

Comparison 3 Individual patient data meta‐analysis adjusted for age only, Outcome 2 Readmission 3 months (without readmission in the first 14 days).
Comparison 3 Individual patient data meta‐analysis adjusted for age only, Outcome 3 Mortality 3 months.

Comparison 3 Individual patient data meta‐analysis adjusted for age only, Outcome 4 Mortality 6 months.
Comparison 4 Individual patient data meta‐analysis adjusted for age and sex, Outcome 1 Readmissions 3 months.

Comparison 4 Individual patient data meta‐analysis adjusted for age and sex, Outcome 2 Readmission 3 months (without readmission in the first 14 days).

Comparison 4 Individual patient data meta‐analysis adjusted for age and sex, Outcome 3 Mortality at 3 months.

Comparison 4 Individual patient data meta‐analysis adjusted for age and sex, Outcome 4 Mortality at 6 months.

Comparison 5 IPD sensitivity analysis in favour of hospital, Outcome 1 Excluding readmissions in the 1st 14 days.

Comparison 5 IPD sensitivity analysis in favour of hospital, Outcome 2 All readmissions.

Comparison 5 IPD sensitivity analysis in favour of hospital, Outcome 3 Excluding readmissions in the 1st 14 days adjusted for age.

Comparison 5 IPD sensitivity analysis in favour of hospital, Outcome 4 All readmissions adjusted for age.

Comparison 5 IPD sensitivity analysis in favour of hospital, Outcome 5 Readmissions excluding readmissions in the 1st 14 days adjusted for age and sex.

Comparison 5 IPD sensitivity analysis in favour of hospital, Outcome 6 All readmissions adjusted for age and sex.
Comparison 5 IPD sensitivity analysis in favour of hospital, Outcome 7 Mortality at 3 months.
Comparison 5 IPD sensitivity analysis in favour of hospital, Outcome 8 Mortality at 3 months adjusted for age.

Comparison 5 IPD sensitivity analysis in favour of hospital, Outcome 9 Mortality at 3 months adjusted for age and sex.
Comparison 5 IPD sensitivity analysis in favour of hospital, Outcome 10 Mortality at 6 months.

Comparison 5 IPD sensitivity analysis in favour of hospital, Outcome 11 Mortality at 6 months adjusted for age.

Comparison 5 IPD sensitivity analysis in favour of hospital, Outcome 12 Mortality at 6 months adjusted for age and sex.

Comparison 6 IPD Sensitivity analysis in favour of hospital at home, Outcome 1 Excluding readmissions in the 1st 14 days.
Comparison 6 IPD Sensitivity analysis in favour of hospital at home, Outcome 2 All readmissions.

Comparison 6 IPD Sensitivity analysis in favour of hospital at home, Outcome 3 Excluding readmissions in the 1st 14 days adjusted for age.

Comparison 6 IPD Sensitivity analysis in favour of hospital at home, Outcome 4 All readmissions adjusted for age.
Comparison 6 IPD Sensitivity analysis in favour of hospital at home, Outcome 5 Readmissions excluding readmissions in the 1st 14 days adjusted for age and sex.

Comparison 6 IPD Sensitivity analysis in favour of hospital at home, Outcome 6 All readmissions adjusted for age and sex.

Comparison 6 IPD Sensitivity analysis in favour of hospital at home, Outcome 7 Mortality at 3 months.

Comparison 6 IPD Sensitivity analysis in favour of hospital at home, Outcome 8 Mortality at 3 months adjusted for age.
Comparison 6 IPD Sensitivity analysis in favour of hospital at home, Outcome 9 Mortality at 3 months adjusted for age and sex.
Comparison 6 IPD Sensitivity analysis in favour of hospital at home, Outcome 10 Mortality at 6 months.

Comparison 6 IPD Sensitivity analysis in favour of hospital at home, Outcome 11 Mortality at 6 months adjusted for age.

Comparison 6 IPD Sensitivity analysis in favour of hospital at home, Outcome 12 Mortality at 6 months adjusted for age and sex.
| Outcome or subgroup title | No. of studies | No. of participants | Statistical method | Effect size |
| 1 Functional ability Show forest plot | Other data | No numeric data | ||
| 1.1 Admission avoidance patients recovering from a stroke functional ability | Other data | No numeric data | ||
| 1.2 Admission avoidance patients with a medical condition ‐ functional ability | Other data | No numeric data | ||
| 2 Quality of life Show forest plot | Other data | No numeric data | ||
| 2.1 Admission avoidance quality of life | Other data | No numeric data | ||
| 3 Cognitive function Show forest plot | Other data | No numeric data | ||
| 3.1 admission avoidance ‐ cognitive function/psychological well being | Other data | No numeric data | ||
| 4 Patient satisfaction Show forest plot | Other data | No numeric data | ||
| 5 Clinical outcomes Show forest plot | Other data | No numeric data | ||
| 5.1 clinical outcomes | Other data | No numeric data | ||
| 5.2 Use of antipsychotic drugs | Other data | No numeric data | ||
| 6 Cost Show forest plot | Other data | No numeric data | ||
| 6.1 health service costs | Other data | No numeric data | ||
| 6.2 informal care inputs | Other data | No numeric data | ||
| 6.3 use of other health services | Other data | No numeric data | ||
| 7 Length of stay Show forest plot | Other data | No numeric data | ||
| 7.1 Trials reporting length of stay | Other data | No numeric data | ||
| 8 Treatment inputs Show forest plot | Other data | No numeric data | ||
| 9 Carer outcomes Show forest plot | Other data | No numeric data | ||
| 9.1 Carer satisfaction | Other data | No numeric data | ||
| 10 GPs views Show forest plot | Other data | No numeric data | ||
| 11 Anxiety and depression Show forest plot | Other data | No numeric data | ||
| 12 Readmission for hospital at home group within 2 weeks of randomisation Show forest plot | Other data | No numeric data | ||
| 13 Re admission to hospital for patients with a medical condition at 3 months Show forest plot | 3 | 416 | Risk Ratio (M‐H, Fixed, 95% CI) | 1.48 [1.02, 2.15] |
| 13.1 Readmission for patients with a medical condition using number of events from trial databases | 3 | 416 | Risk Ratio (M‐H, Fixed, 95% CI) | 1.48 [1.02, 2.15] |
| 14 Readmissions at 3 months using published data Show forest plot | 5 | 690 | Risk Ratio (M‐H, Fixed, 95% CI) | 1.35 [0.97, 1.87] |
| 14.1 Elderly medical patients readmission using published data (Caplan follow‐up at 28 days) | 3 | 447 | Risk Ratio (M‐H, Fixed, 95% CI) | 1.18 [0.83, 1.67] |
| 14.2 Patients with cellulitis or pneumonia ‐ published data | 2 | 243 | Risk Ratio (M‐H, Fixed, 95% CI) | 3.22 [1.08, 9.63] |
| 15 Mortality during treatment Show forest plot | 1 | 120 | Risk Ratio (M‐H, Fixed, 95% CI) | 0.81 [0.43, 1.54] |
| 16 Mortality at 3 months elderly patients with a medical condition (using data from trialists) Show forest plot | 5 | 833 | Odds Ratio (M‐H, Fixed, 95% CI) | 0.83 [0.56, 1.23] |
| 17 Mortality at 3 months using published data Show forest plot | 3 | 644 | Risk Ratio (M‐H, Fixed, 95% CI) | 0.85 [0.60, 1.21] |
| 18 Mortality at 6 months follow up (using data from trialists, apart from Caplan) Show forest plot | 4 | 707 | Risk Ratio (M‐H, Fixed, 95% CI) | 0.76 [0.58, 0.99] |
| 19 Mortality at 6 months using published data Show forest plot | 2 | 413 | Risk Ratio (M‐H, Fixed, 95% CI) | 0.83 [0.58, 1.19] |
| 20 Mortality at 1 year follow up Show forest plot | 1 | 293 | Risk Ratio (M‐H, Fixed, 95% CI) | 0.64 [0.39, 1.05] |
| 21 Total length of stay to include hospital transfers for the hospital at home group Show forest plot | 1 | 171 | Mean Difference (IV, Fixed, 95% CI) | ‐14.13 [‐21.11, ‐7.15] |
| 22 Living in an institutional setting at follow up ‐ patients recovering from a stroke Show forest plot | 2 | 413 | Risk Ratio (M‐H, Fixed, 95% CI) | 0.66 [0.37, 1.15] |
| 22.1 Recovering from a stroke at 6 months follow up | 2 | 413 | Risk Ratio (M‐H, Fixed, 95% CI) | 0.66 [0.37, 1.15] |
| 23 Living in a nursing home at follow up ‐ patients with dementia Show forest plot | 1 | 109 | Risk Ratio (M‐H, Fixed, 95% CI) | 0.11 [0.03, 0.46] |
| Outcome or subgroup title | No. of studies | No. of participants | Statistical method | Effect size |
| 1 Readmission at 3 months Show forest plot | 3 | Readmission (Fixed, 95% CI) | 1.48 [0.95, 2.30] | |
| 2 Readmission 3 months (excluding readmissions in the first 14 days) Show forest plot | 3 | Readmission (Fixed, 95% CI) | 1.41 [0.87, 2.30] | |
| 3 Mortality 3 months Show forest plot | 5 | Mortality (Fixed, 95% CI) | 0.82 [0.58, 1.17] | |
| 4 Mortality 6 months Show forest plot | 3 | Mortality (Fixed, 95% CI) | 0.68 [0.49, 0.95] | |
| Outcome or subgroup title | No. of studies | No. of participants | Statistical method | Effect size |
| 1 Readmission 3 months Show forest plot | 3 | Readmission (Fixed, 95% CI) | 1.49 [0.96, 2.32] | |
| 2 Readmission 3 months (without readmission in the first 14 days) Show forest plot | 3 | Readmission (Fixed, 95% CI) | 1.42 [0.87, 2.30] | |
| 3 Mortality 3 months Show forest plot | 5 | mortality (Fixed, 95% CI) | 0.77 [0.54, 1.09] | |
| 4 Mortality 6 months Show forest plot | 3 | mortality (Fixed, 95% CI) | 0.62 [0.44, 0.86] | |
| Outcome or subgroup title | No. of studies | No. of participants | Statistical method | Effect size |
| 1 Readmissions 3 months Show forest plot | 3 | Readmission (Fixed, 95% CI) | 1.49 [0.96, 2.33] | |
| 2 Readmission 3 months (without readmission in the first 14 days) Show forest plot | 3 | Readmission (Fixed, 95% CI) | 1.42 [0.87, 2.30] | |
| 3 Mortality at 3 months Show forest plot | 5 | mortality (Fixed, 95% CI) | 0.77 [0.54, 1.09] | |
| 4 Mortality at 6 months Show forest plot | 3 | Mortality (Fixed, 95% CI) | 0.62 [0.45, 0.87] | |
| Outcome or subgroup title | No. of studies | No. of participants | Statistical method | Effect size |
| 1 Excluding readmissions in the 1st 14 days Show forest plot | 3 | Readmission (Fixed, 95% CI) | 1.60 [0.99, 2.59] | |
| 1.1 Readmission excluding readmissions in the 1st 14 days | 3 | Readmission (Fixed, 95% CI) | 1.60 [0.99, 2.59] | |
| 2 All readmissions Show forest plot | 3 | Readmissions (Fixed, 95% CI) | 1.72 [1.11, 2.67] | |
| 3 Excluding readmissions in the 1st 14 days adjusted for age Show forest plot | 3 | Readmissions (Fixed, 95% CI) | 1.62 [1.00, 2.62] | |
| 4 All readmissions adjusted for age Show forest plot | 3 | Readmissions (Fixed, 95% CI) | 1.77 [1.14, 2.75] | |
| 5 Readmissions excluding readmissions in the 1st 14 days adjusted for age and sex Show forest plot | 3 | Readmissions (Fixed, 95% CI) | 1.62 [1.00, 2.63] | |
| 6 All readmissions adjusted for age and sex Show forest plot | 3 | Readmissions (Fixed, 95% CI) | 1.77 [1.14, 2.76] | |
| 7 Mortality at 3 months Show forest plot | 5 | Mortality (Fixed, 95% CI) | 0.83 [0.59, 1.17] | |
| 8 Mortality at 3 months adjusted for age Show forest plot | 5 | Mortality (Fixed, 95% CI) | 0.77 [0.54, 1.09] | |
| 9 Mortality at 3 months adjusted for age and sex Show forest plot | 5 | Mortality (Fixed, 95% CI) | 0.78 [0.55, 1.10] | |
| 10 Mortality at 6 months Show forest plot | 3 | Mortality (Fixed, 95% CI) | 0.69 [0.49, 0.96] | |
| 11 Mortality at 6 months adjusted for age Show forest plot | 3 | Mortality (Fixed, 95% CI) | 0.62 [0.45, 0.87] | |
| 12 Mortality at 6 months adjusted for age and sex Show forest plot | 3 | Mortality (Fixed, 95% CI) | 0.63 [0.45, 0.87] | |
| Outcome or subgroup title | No. of studies | No. of participants | Statistical method | Effect size |
| 1 Excluding readmissions in the 1st 14 days Show forest plot | 3 | Readmission (Fixed, 95% CI) | 1.26 [0.78, 2.04] | |
| 1.1 Readmission excluding readmissions in the 1st 14 days | 3 | Readmission (Fixed, 95% CI) | 1.26 [0.78, 2.04] | |
| 2 All readmissions Show forest plot | 3 | Readmissions (Fixed, 95% CI) | 1.29 [0.83, 2.00] | |
| 3 Excluding readmissions in the 1st 14 days adjusted for age Show forest plot | 3 | Readmissions (Fixed, 95% CI) | 1.25 [0.77, 2.02] | |
| 4 All readmissions adjusted for age Show forest plot | 3 | Readmissions (Fixed, 95% CI) | 1.29 [0.83, 2.00] | |
| 5 Readmissions excluding readmissions in the 1st 14 days adjusted for age and sex Show forest plot | 3 | Readmissions (Fixed, 95% CI) | 1.26 [0.78, 2.04] | |
| 6 All readmissions adjusted for age and sex Show forest plot | 3 | Readmissions (Fixed, 95% CI) | 1.30 [0.83, 2.01] | |
| 7 Mortality at 3 months Show forest plot | 5 | Mortality (Fixed, 95% CI) | 0.82 [0.58, 1.16] | |
| 8 Mortality at 3 months adjusted for age Show forest plot | 5 | Mortality (Fixed, 95% CI) | 0.76 [0.54, 1.08] | |
| 9 Mortality at 3 months adjusted for age and sex Show forest plot | 5 | Mortality (Fixed, 95% CI) | 0.76 [0.54, 1.09] | |
| 10 Mortality at 6 months Show forest plot | 3 | Mortality (Fixed, 95% CI) | 0.68 [0.49, 0.95] | |
| 11 Mortality at 6 months adjusted for age Show forest plot | 3 | Mortality (Fixed, 95% CI) | 0.62 [0.44, 0.86] | |
| 12 Mortality at 6 months adjusted for age and sex Show forest plot | 3 | Mortality (Fixed, 95% CI) | 0.62 [0.44, 0.86] | |