Entrenamiento muscular del piso pelviano para la prevención y tratamiento de la incontinencia fecal y urinaria en pacientes antes y después del parto
Resumen
Antecedentes
Cerca de un tercio de las mujeres presentan incontinencia urinaria y hasta una décima parte presenta incontinencia fecal después del parto. Con frecuencia se recomienda el entrenamiento muscular del piso pelviano durante el embarazo y después del parto para la prevención y el tratamiento de la incontinencia.
Ésta es una actualización de una revisión publicada previamente en 2012.
Objetivos
Determinar la efectividad del entrenamiento muscular del piso pelviano (EMPP) en la prevención y el tratamiento de la incontinencia urinaria y fecal en pacientes embarazadas o después del parto.
Métodos de búsqueda
Se hicieron búsquedas en el registro especializado del Grupo Cochrane de Incontinencia (Cochrane Incontinence Specialised Register) (16 febrero 2017) y en las listas de referencias de los estudios recuperados.
Criterios de selección
Ensayos con asignación al azar o cuasialeatorios en mujeres embarazadas o después del parto. Un brazo del ensayo que incluyera EMPP. Otro brazo que fuera ningún EMPP, atención prenatal o posnatal habitual, otra condición control o una intervención alternativa de EMPP.
Obtención y análisis de los datos
Dos autores de la revisión evaluaron de forma independiente los ensayos para la inclusión y el riesgo de sesgo. Se extrajeron los datos y se comprobó su exactitud. Poblaciones incluidas: mujeres sin incontinencia (EMPP para la prevención), pacientes con incontinencia (EMPP para el tratamiento) al momento de la asignación al azar y una población mixta de mujeres con o sin incontinencia (EMPP para la prevención o el tratamiento). Se evaluó la calidad de la evidencia mediante el enfoque GRADE.
Resultados principales
La revisión incluyó 38 ensayos (17 de los cuales fueron nuevos para esta actualización) en los que participaron 9892 mujeres de 20 países. En general, los ensayos fueron de tamaño pequeño a moderado, y los programas de EMPP y las condiciones control variaron considerablemente y a menudo se describieron de manera deficiente. Muchos ensayos presentaron un riesgo de sesgo moderado a alto. Excepto dos informes de dolor del piso pelviano, los ensayos no informaron efectos perjudiciales del EMPP.
Prevención de la incontinencia urinaria: en comparación con la atención habitual, las embarazadas sin incontinencia que realizaron EMPP prenatal pueden haber tenido un riesgo menor de informar incontinencia urinaria en la última etapa del embarazo (62% menos; cociente de riesgos [CR] de incontinencia 0,38; intervalo de confianza [IC] del 95%: 0,20 a 0,72; seis ensayos, 624 mujeres; evidencia de baja calidad). De igual manera, el EMPP prenatal disminuyó el riesgo de incontinencia urinaria en el período posnatal medio (más de tres a seis meses después del parto) (29% menos; CR 0,71; IC del 95%: 0,54 a 0,95; cinco ensayos, 673 mujeres; evidencia de calidad moderada). No hubo información suficiente disponible del período posnatal tardío (más de seis a 12 meses) para determinar los efectos en este punto temporal.
Tratamiento de la incontinencia urinaria: no está claro si el EMPP prenatal en pacientes con incontinencia disminuye la incontinencia en la última etapa del embarazo en comparación con la atención habitual (CR 0,70; IC del 95%: 0,44 a 1,13; tres ensayos, 345 mujeres; evidencia de muy baja calidad). Esta incertidumbre se extiende a los períodos posnatales medio (CR 0,94; IC del 95%: 0,70 a 1,24; un ensayo, 187 mujeres; evidencia de muy baja calidad) y tardío (CR 0,50; IC del 95%: 0,13 a 1,93; dos ensayos, 869 mujeres; evidencia de muy baja calidad). En las pacientes en el período posnatal con incontinencia urinaria persistente, no estuvo claro si el EMPP redujo la incontinencia urinaria más de seis a 12 meses después del parto (CR 0,55; IC del 95%: 0,29 a 1,07; tres ensayos; 696 mujeres; evidencia de muy baja calidad).
Enfoque mixto de prevención y tratamiento de la incontinencia urinaria: El EMPP prenatal en pacientes con o sin incontinencia urinaria (población mixta) puede disminuir el riesgo de incontinencia urinaria en la última etapa del embarazo (26% menos; CR 0,74; IC del 95%: 0,61 a 0,90; nueve ensayos, 3164 mujeres; evidencia de baja calidad) y en el período posnatal medio (CR 0,73; IC del 95%: 0,55 a 0,97; cinco ensayos, 1921 mujeres; evidencia de muy baja calidad). No está claro si el EMPP prenatal reduce el riesgo de incontinencia urinaria tardía después del parto (CR 0,85; IC del 95%: 0,63 a 1,14; dos ensayos, 244 mujeres; evidencia de baja calidad). En el caso del EMPP que comenzó después del parto, hubo incertidumbre considerable acerca del efecto sobre el riesgo de incontinencia urinaria en el período posnatal tardío (CR 0,88; IC del 95%: 0,71 a 1,09; tres ensayos, 826 mujeres; evidencia de muy baja calidad).
Incontinencia fecal: seis ensayos informaron resultados de incontinencia fecal. En las pacientes en el período posnatal con incontinencia fecal persistente, no estuvo claro si el EMPP redujo la incontinencia en el período posnatal tardío en comparación con la atención habitual (CR 0,68; IC del 95%: 0,24 a 1,94; dos ensayos; 620 mujeres; evidencia de muy baja calidad). En las pacientes con o sin incontinencia fecal (población mixta), el EMPP prenatal dio lugar a poca o ninguna diferencia en la prevalencia de incontinencia fecal en la última etapa del embarazo (CR 0,61; IC del 95%: 0,30 a 1,25; dos ensayos, 867 mujeres; evidencia de calidad moderada). En el caso del EMPP posnatal en una población mixta, hubo incertidumbre considerable acerca del efecto sobre la incontinencia fecal en el período posnatal tardío (CR 0,73; IC del 95%: 0,13 a 4,21; un ensayo, 107 mujeres, evidencia de muy baja calidad).
Hubo poca evidencia acerca de los efectos sobre la incontinencia urinaria o fecal más allá de 12 meses después del parto. Hubo muy pocos datos sobre la calidad de vida asociada con la incontinencia y poco consenso acerca de cómo medirla. No se encontraron datos sobre resultados de economía sanitaria.
Conclusiones de los autores
El EMPP dirigido a las pacientes sin incontinencia en el período prenatal temprano y proporcionado en un programa estructurado puede prevenir la aparición de la incontinencia urinaria en la última etapa del embarazo y después del parto. Sin embargo, se desconoce el costo‐efectividad. Los enfoques poblacionales (que reclutan mujeres en el período prenatal independientemente del estado de continencia) pueden tener un efecto más pequeño sobre la incontinencia urinaria, aunque los motivos no están claros. No está claro si un enfoque poblacional para proporcionar el EMPP en el período posnatal es efectivo para reducir la incontinencia urinaria. No hay seguridad con respecto a los efectos del EMPP como tratamiento para la incontinencia urinaria en las pacientes antes y después del parto, lo que contrasta con la efectividad más establecida en las pacientes de mediana edad.
Es posible que los efectos del EMPP puedan ser mayores con enfoques dirigidos en lugar de enfoques mixtos de prevención y tratamiento, así como en ciertos grupos de pacientes. Hipotéticamente, por ejemplo, las pacientes con un índice alto de masa corporal tienen un factor de riesgo de incontinencia urinaria. Dichas incertidumbres requieren un estudio adicional y también se necesitan datos sobre la duración del efecto. Para aumentar el conocimiento sobre qué funciona y con quién, se deben describir los aspectos fisiológicos y conductuales de los programas de ejercicio para los grupos de EMPP y los grupos control, así como cuántas mujeres con EMPP deben incluirse en ambos grupos.
Existen pocos datos sobre la incontinencia fecal o los costos y es importante que ambos se incluyan en los ensayos futuros. Es fundamental que los ensayos futuros utilicen medidas válidas de la calidad de vida asociada con la incontinencia para la incontinencia urinaria y fecal.
PICO
Resumen en términos sencillos
¿Cuán efectivos son los ejercicios musculares del piso pelviano realizados durante el embarazo o después del parto para prevenir o tratar la incontinencia?
Pregunta de la revisión
Evaluar si hacer ejercicios musculares del piso pelviano (EMPP) durante el embarazo o después del parto reduce la incontinencia. Ésta es una actualización de una revisión publicada en 2012.
Antecedentes
Más de un tercio de las mujeres presenta pérdida no intencional (involuntaria) de orina (incontinencia urinaria) en el segundo y tercer trimestres del embarazo y cerca de un tercio presenta pérdida de orina en los tres primeros meses después del parto. Cerca de un cuarto de las mujeres tiene alguna pérdida involuntaria de flatos (gases) o heces (incontinencia anal) en la última etapa del embarazo y un quinto presenta pérdida de flatos o heces al año después del parto. Los profesionales sanitarios habitualmente recomiendan la realización de EMPP durante el embarazo y después del parto para prevenir y tratar la incontinencia. Con la realización regular de EMPP los músculos se fortalecen y se mantienen fuertes. Los músculos se contraen varias veces consecutivas, más de una vez al día, varios días a la semana y se continúa de forma indefinida.
¿Cuál es el grado de actualización de esta revisión?
La evidencia está actualizada hasta el 16 febrero 2017.
Características de los estudios
Se incluyeron 38 ensayos (17 nuevos en esta actualización) con 9892 mujeres de 20 países. Los estudios incluyeron a embarazadas o mujeres que ya habían tenido el parto en el transcurso de los últimos tres meses. Las pacientes informaron pérdida de orina, heces, orina y heces o ninguna pérdida. Se asignaron al azar a realizar EMPP (para tratar y prevenir la incontinencia o como un tratamiento para la incontinencia) o no y se compararon los efectos.
Fuentes de financiación de los estudios
Diecinueve estudios fueron financiados con fondos públicos. Uno recibió subvenciones de fuentes públicas y privadas. Tres estudios no recibieron financiamiento y 15 no declararon las fuentes de financiamiento.
Resultados clave
Embarazadas sin pérdida de orina que realizaron EMPP para prevenir la pérdida: las pacientes pueden informar menos pérdida de orina en la última etapa del embarazo y a los tres a seis meses después del parto. No hubo información suficiente para determinar si estos efectos persistieron más allá del primer año después del parto.
Pacientes con pérdida de orina, embarazadas o después del parto, que realizaron EMPP como tratamiento: no estuvo claro si hacer EMPP durante el embarazo redujo la pérdida en la última etapa del embarazo o en el año después del parto. No estuvo claro si hacer EMPP ayuda a las pacientes con pérdida después del parto.
Mujeres con o sin pérdida de orina (grupo mixto), embarazadas o después del parto, que realizaron EMPP para prevenir o tratar la pérdida: las mujeres que comenzaron a hacer ejercicio durante el embarazo tuvieron menores probabilidades de informar pérdida en la última etapa del embarazo y hasta seis meses después del parto, pero no estuvo claro si el efecto duró al menos un año después del parto. En las pacientes que comenzaron los EMPP después del parto, el efecto sobre la pérdida al año después del parto no estuvo claro.
Pérdida de heces: pocos estudios (solo seis) tuvieron evidencia acerca de la pérdida de heces. Al año después del parto no estuvo claro si los EMPP ayudaron a disminuir la pérdida de heces en las pacientes que comenzaron los ejercicios después del parto. Tampoco estuvo claro si las mujeres con o sin pérdida de heces (grupo mixto) que comenzaron los EMPP durante el embarazo tuvieron menores probabilidades de pérdida de heces en la última etapa del embarazo o hasta un año después del parto.
Hubo información escasa acerca de cómo los EMPP pueden afectar la calidad de vida asociada con la pérdida. Hubo dos informes de dolor del piso pelviano, pero no se observaron otros efectos perjudiciales de los EMPP. No se conoce si los EMPP tienen valor económico porque ningún estudio realizó un análisis de economía sanitaria. No se conoce el valor económico de ofrecer los EMPP ya que no se identificaron datos de economía sanitaria.
Calidad de la evidencia
En general, los estudios no fueron grandes y la mayoría tuvo problemas de diseño que incluyeron detalles limitados sobre cómo las pacientes se asignaron al azar a los grupos, así como informe deficiente de las mediciones. Algunos de los problemas eran de esperar porque fue imposible cegar a los profesionales sanitarios o las pacientes a si se ejercitaban o no. Los EMPP difirieron de forma considerable entre los estudios y a menudo se describieron de forma deficiente. La calidad de la evidencia en general fue baja a muy baja.
Conclusiones de los autores
Summary of findings
| Antenatal pelvic floor muscle training compared to control for prevention of urinary and faecal incontinence | ||||||
| Patient or population: pregnant women who were continent when randomised Setting: hospital or outpatient settings in Canada, Italy, Mexico, Norway, Spain, Thailand, Turkey, UK and USA Intervention: antenatal PFMT Comparison: control (no PFMT or usual care) | ||||||
| Outcomes | Anticipated absolute effects* (95% CI) | Relative effect | No of participants | Quality of the evidence | Comments | |
| Risk with control | Risk with antenatal PFMT | |||||
| Urinary incontinence in late pregnancy | Study population | RR 0.38 | 624 | ⊕⊕⊝⊝ | Upper and lower limits of the CI of summary statistic suggest clinical importance. | |
| 421 per 1000 | 160 per 1000 | |||||
| Urinary incontinence mid‐postnatal period (> 3‐6 months) | Study population | RR 0.71 | 673 | ⊕⊕⊕⊝ | Risk reduction is a clinically important effect but the upper limit of the CI is close to no effect. | |
| 251 per 1000 | 179 per 1000 | |||||
| Urinary incontinence late postnatal period (> 6‐12 months) | Study population | RR 1.20 | 44 | ⊕⊕⊝⊝ | Wide CI including no effect. | |
| 440 per 1000 | 528 per 1000 | |||||
| Faecal incontinence in late pregnancy | Study population | ‐ | (0 studies) | ‐ | Not reported. | |
| ‐ | ‐ | |||||
| Faecal incontinence mid‐postnatal period (> 3‐6 months) | Study population | ‐ | (0 studies) | ‐ | Not reported. | |
| ‐ | ‐ | |||||
| Faecal incontinence late postnatal period (> 6‐12 months) | Study population | ‐ | (0 studies) | ‐ | Not reported. | |
| ‐ | ‐ | |||||
| Incontinence‐specific quality of life | Mean 2.66, SD 4.1 | Mean 0.24, SD 1.2 | MD 2.42 lower | 152 | ⊕⊕⊕⊝ | Measured in late postnatal period. Upper and lower limits of the CI of summary statistic suggest clinical importance in ICIQ‐SF (Nyström 2015). |
| *The risk in the intervention group (and its 95% confidence interval) is based on the assumed risk in the comparison group and the relative effect of the intervention (and its 95% CI). CI: confidence interval; ICIQ‐SF: International Consultation on Incontinence ‐ Short Form; MD: mean difference; PFMT: pelvic floor muscle training; RCT: randomised controlled trial; RR: risk ratio; SD: standard deviation. | ||||||
| GRADE Working Group grades of evidence | ||||||
| 1Downgraded two levels for serious inconsistency and imprecision (multiple small RCTs, fewer than 300 events, heterogeneous intervention and control groups). 2Downgraded one level for serious imprecision (multiple small RCTs, fewer than 300 events). 3Downgraded two levels for very serious imprecision (single, small trial with wide confidence interval). 4Downgraded one level for serious imprecision (single trial, fewer than 300 events). The outcome measures relate to the presence of incontinence symptoms rather than absence. Symptoms of urinary and faecal incontinence were measured based on self‐report. | ||||||
| Antenatal pelvic floor muscle training compared to control for treatment of urinary and faecal incontinence | ||||||
| Patient or population: pregnant women who were incontinent when randomised Setting: health services or obstetric clinics in Brazil, Canada, the Netherlands and Turkey Intervention: antenatal PFMT Comparison: control (usual care) | ||||||
| Outcomes | Anticipated absolute effects* (95% CI) | Relative effect | No of participants | Quality of the evidence | Comments | |
| Risk with control | Risk with antenatal PFMT | |||||
| Urinary incontinence in late pregnancy | Study population | RR 0.70 | 345 | ⊕⊝⊝⊝ | Wide CI including no effect. | |
| 776 per 1000 | 543 per 1000 | |||||
| Urinary incontinence mid‐postnatal period (> 3‐6 months) | Study population | RR 0.94 | 187 | ⊕⊝⊝⊝ | Wide CL including no effect. | |
| 528 per 1000 | 496 per 1000 | |||||
| Urinary incontinence late postnatal period (> 6‐12 months) | Study population | RR 0.50 | 869 | ⊕⊝⊝⊝ | Wide CI including no effect. | |
| 232 per 1000 | 116 per 1000 | |||||
| Faecal incontinence in late pregnancy | Study population | ‐ | (0 studies) | ‐ | Not reported. | |
| ‐ | ‐ | |||||
| Faecal incontinence mid‐postnatal period (> 3‐6 months) | Study population | ‐ | (0 studies) | ‐ | Not reported. | |
| ‐ | ‐ | |||||
| Faecal incontinence late postnatal period (> 6‐12 months) | Study population | ‐ | (0 studies) | ‐ | Not reported. | |
| ‐ | ‐ | |||||
| Incontinence‐specific quality of life (ICIQ‐SF) | Mean 4.7, SD 5.6 | Mean 1.2, SD 2.5 | MD 3.5 lower | 41 | ⊕⊕⊝⊝ | MD suggests clinically important effect but the upper limit of the CI is close to no effect. |
| *The risk in the intervention group (and its 95% confidence interval) is based on the assumed risk in the comparison group and the relative effect of the intervention (and its 95% CI). CI: confidence interval; ICIQ‐SF: International Consultation on Incontinence ‐ Short Form; MD: mean difference; PFMT: pelvic floor muscle training; RCT: randomised controlled trial; RR: risk ratio; SD: standard deviation. | ||||||
| GRADE Working Group grades of evidence | ||||||
| 1Downgraded three levels due to serious risk of selection bias (one trial with heavy weighting in the pooled estimate at high risk), inconsistency and indirectness, and very serious imprecision (fewer than 300 events, wide confidence interval, two trials without any details about PFMT interventions). 2Downgraded three levels due to serious risk of selection bias, indirectness and imprecision (singe trial, fewer than 300 events, wide confidence interval, no details about PFMT interventions). 3Downgraded three levels due to very serious risk of selection bias, inconsistency and imprecision (fewer than 300 events, wide confidence interval) and serious indirectness (no details about the PFMT intervention in one trial with about half the weighting in the pooled estimate). 4Downgraded two levels due to serious indirectness and imprecision (single trial, fewer than 300 participants, wide confidence interval). The outcome measures relate to the presence of incontinence symptoms rather than absence. As this comparison addresses the effect of PFMT for treatment of existing continence symptoms, the data are "negative," that is continuing incontinence rather than cure. Symptoms of urinary and faecal incontinence were measured based on self‐report. | ||||||
| Antenatal pelvic floor muscle training compared to control for mixed prevention and treatment of urinary and faecal incontinence | ||||||
| Patient or population: pregnant women some of who were incontinent symptoms and some who were not when randomised Setting: health services, obstetric clinics or hospitals in Brazil, China, France, Italy, Norway, UK or USA Intervention: antenatal PFMT Comparison: control (no PFMT, usual care or unspecified control) | ||||||
| Outcomes | Anticipated absolute effects* (95% CI) | Relative effect | No of participants | Quality of the evidence | Comments | |
| Risk with control | Risk with antenatal PFMT | |||||
| Urinary incontinence in late pregnancy | Study population | RR 0.74 | 3164 | ⊕⊕⊝⊝ | RR suggests clinically important effect but the upper limit of the CI suggests lack of clinical importance. | |
| 575 per 1000 | 425 per 1000 | |||||
| Urinary incontinence mid‐postnatal period (> 3‐6 months) | Study population | RR 0.73 | 1921 | ⊕⊝⊝⊝ | RR suggests clinically important effect but the upper limit of the CI suggests lack of clinical importance. | |
| 363 per 1000 | 265 per 1000 | |||||
| Urinary incontinence late postnatal period (> 6‐12 months) | Study population | RR 0.85 | 244 | ⊕⊕⊝⊝ | RR suggests clinically important effect but the CI includes no effect. | |
| 448 per 1000 | 381 per 1000 | |||||
| Faecal incontinence in late pregnancy | Study population | RR 0.61 | 867 | ⊕⊕⊕⊝ | Wide CI including no effect. | |
| 43 per 1000 | 26 per 1000 | |||||
| Faecal incontinence mid‐postnatal period (> 3‐6 months) | Study population | ‐ | (0 studies) | ‐ | Not reported. | |
| ‐ | ‐ | |||||
| Faecal incontinence late postnatal period (> 6‐12 months) | Study population | ‐ | (0 studies) | ‐ | Not reported. | |
| ‐ | ‐ | |||||
| Incontinence‐specific quality of life late postnatal period (> 6‐12 months) (ICIQ‐SF) | Mean 2.1, SD 3.3 | Mean 1.9, SD 3.7 | MD 0.2 lower | 190 | ⊕⊕⊝⊝ | MD and CI suggest lack of clinically important effect. |
| *The risk in the intervention group (and its 95% confidence interval) is based on the assumed risk in the comparison group and the relative effect of the intervention (and its 95% CI). CI: confidence interval; ICIQ‐SF: International Consultation on Incontinence ‐ Short Form; MD: mean difference; PFMT: pelvic floor muscle training; RCT: randomised controlled trial; RR: risk ratio; SD: standard deviation. | ||||||
| GRADE Working Group grades of evidence | ||||||
| 1Downgraded two levels due to serious inconsistency (statistically significant heterogeneity) and indirectness (limited details about PFMT intervention in two trials with more than one‐quarter of the weighting in the pooled estimate). 2Downgraded three levels due to serious risk of selection bias (no information about random allocation concealment in three trials carrying more than 50% of weighting in the pooled estimate), serious imprecision (statistically significant heterogeneity) and serious indirectness (includes two trials carrying about 40% of the weighting in the pooled estimate with no information about PFMT intervention). 3Downgraded two levels due to serious indirectness (no information about PFMT in one trial with more than two‐thirds of the weighting in the pooled estimate) and serious imprecision (fewer than 300 event). 4Downgraded one level due to serious imprecision (single trial with fewer than 300 events). 5Downgraded two levels due to serious indirectness (single trial, no information about PFMT intervention) and serious imprecision (fewer than 300 events). The outcome measures relate to the presence of incontinence symptoms rather than absence. For those comparisons that addressed the effect of PFMT for treatment of existing continence symptoms, the data were "negative," that is continuing incontinence rather than cure. Symptoms of urinary and faecal incontinence were measured based on self‐report. | ||||||
| Postnatal pelvic floor muscle training compared to control for treatment of urinary and faecal incontinence | ||||||
| Patient or population: postnatal women who were incontinent when randomised Setting: health services or obstetric clinics in Canada, Republic of Korea, New Zealand and UK Intervention: postnatal PFMT Comparison: control (no PFMT or usual care) | ||||||
| Outcomes | Anticipated absolute effects* (95% CI) | Relative effect | No of participants | Quality of the evidence | Comments | |
| Risk with control | Risk with postnatal PFMT | |||||
| Urinary incontinence late postnatal period (> 6‐12 months) | Study population | RR 0.55 | 696 | ⊕⊝⊝⊝ | RR suggests clinically important effect but the CI includes no effect. | |
| 724 per 1000 | 398 per 1000 | |||||
| Faecal incontinence late postnatal period (> 6‐12 months) | Study population | RR 0.68 | 620 | ⊕⊝⊝⊝ | RR suggests clinically important effect but the CI includes no effect. | |
| 137 per 1000 | 93 per 1000 | |||||
| Incontinence‐specific quality of life | Mean 21.22, SD 2.11 | Mean 19.56, SD 1.88 | MD 1.66 lower | 18 | ⊕⊝⊝⊝ | Wide CI including no effect. |
| *The risk in the intervention group (and its 95% confidence interval) is based on the assumed risk in the comparison group and the relative effect of the intervention (and its 95% CI). BFLUTS: British Female Lower Urinary Tract Symptoms questionnaire; CI: confidence interval; MD: mean difference; PFMT: pelvic floor muscle training; RCT: randomised controlled trial; RR: risk ratio; SD: standard deviation. | ||||||
| GRADE Working Group grades of evidence | ||||||
| 1Downgraded three levels due to very serious risk of selection bias (two trials with 90% of weighting in pooled estimate at high risk) and inconsistency (statistically significant heterogeneity), and serious indirectness (two trials with 90% of weighting in pooled estimate provide insufficient information about the intervention). 2Downgraded three levels due to very serious risk of selection bias (two trials with 100% of weighting in pooled estimate at high risk), inconsistency (statistically significant heterogeneity) and imprecision (fewer than 300 events, wide confidence interval) and serious indirectness (neither trial provides sufficient information about the intervention). 3Downgraded three levels due to very serious risk of selection bias and imprecision (fewer than 300 events, wide confidence interval). The outcome measures relate to the presence of incontinence symptoms rather than absence. As this comparison addresses the effect of PFMT for treatment of existing continence symptoms, the data are "negative," that is continuing incontinence rather than cure. Symptoms of urinary and faecal incontinence were measured based on self‐report. | ||||||
| Postnatal pelvic floor muscle training compared to control for mixed prevention and treatment of urinary and faecal incontinence | ||||||
| Patient or population: postnatal women some of whom had incontinent symptoms and some of whom had not when randomised Setting: health services or hospitals in Australia, China and Switzerland Intervention: postnatal PFMT Comparison: control (no PFMT or usual care) | ||||||
| Outcomes | Anticipated absolute effects* (95% CI) | Relative effect | No of participants | Quality of the evidence | Comments | |
| Risk with control | Risk with postnatal PFMT | |||||
| Urinary incontinence late postnatal period (> 6‐12 months) | Study population | RR 0.88 | 826 | ⊕⊝⊝⊝ | Wide CI including no effect. | |
| 294 per 1000 | 212 per 1000 | |||||
| Faecal incontinence late postnatal period (> 6‐12 months) | Study population | RR 0.73 | 107 | ⊕⊝⊝⊝ | Wide CI including no effect. | |
| 54 per 1000 | 39 per 1000 | |||||
| Incontinence‐specific quality of life | Study population | ‐ | (0 studies) | ‐ | Not reported. | |
| ‐ | ‐ | |||||
| *The risk in the intervention group (and its 95% confidence interval) is based on the assumed risk in the comparison group and the relative effect of the intervention (and its 95% CI). CI: confidence interval; PFMT: pelvic floor muscle training; RCT: randomised controlled trial; RR: risk ratio. | ||||||
| GRADE Working Group grades of evidence | ||||||
| 1Downgraded three levels due to serious inconsistency (statistically significant heterogeneity) and imprecision (fewer than 300 events, wide confidence interval). 2Downgraded three levels due to very serious risk of selection bias and imprecision (fewer than 300 events, wide confidence interval) and serious indirectness (no information about the PFMT intervention). The outcome measures relate to the presence of incontinence symptoms rather than absence. For those comparisons that address the effect of PFMT for treatment of existing continence symptoms, the data are "negative," that is continuing incontinence rather than cure. Symptoms of urinary and faecal incontinence were measured based on self‐report. | ||||||
Antecedentes
La evidencia epidemiológica acumulada indica que las mujeres que han tenido un recién nacido tienen mayor riesgo de presentar incontinencia urinaria. Parece que tanto el embarazo como el parto son factores de riesgo (Foldspang 1999; Milsom 2017; Rortveit 2003a; Rortveit 2003b; Viktrup 2006). De igual manera, estas mujeres parecen estar en mayor riesgo de incontinencia fecal, en particular las que han tenido partos vaginales (Eason 2002; MacArthur 2001; Pollack 2004; Sultan 1999).
Descripción de la afección
Incontinencia urinaria
La incontinencia urinaria (pérdida involuntaria de orina) es un problema frecuente entre los adultos que viven en la comunidad (Milsom 2017). Es más frecuente en las mujeres y el embarazo o el período postnatal puede ser la primera vez en que muchas mujeres presenten incontinencia urinaria. La incontinencia urinaria de esfuerzo (pérdida de orina involuntaria durante el esfuerzo físico) y de urgencia (pérdida involuntaria asociada con, o inmediatamente después, de una necesidad imperiosa y súbita de orinar) son los dos tipos más frecuentes de pérdida involuntaria de orina en las mujeres. Muchas mujeres presentan incontinencia urinaria de esfuerzo y de urgencia. Es la llamada incontinencia urinaria mixta. De estos tipos, la incontinencia urinaria de esfuerzo es la que con más frecuencia se asocia con el embarazo y el período posnatal, aunque hay un aumento pequeño pero significativo del riesgo de incontinencia urinaria de urgencia (Milsom 2017).
Parece que la prevalencia de la incontinencia urinaria aumenta durante el embarazo (en particular en el segundo trimestre) y luego disminuye de forma gradual durante el primer año después del parto (Milsom 2017). En las estimaciones de la prevalencia de todos los tipos de incontinencia urinaria durante el embarazo la variación es evidente pero puede ser tan alta como del 58%, y la incontinencia urinaria de esfuerzo afecta a alrededor del 31% de las mujeres nulíparas y al 42% de las mujeres con hijos (Wesnes 2007). La prevalencia de la incontinencia urinaria persistente en los tres primeros meses después del parto es aproximadamente del 30% (Thom 2010).
Los resultados de las cohortes de tamaño moderado a grande de pacientes indican que los factores asociados con un riesgo mayor de incontinencia urinaria después del parto son:
-
número de partos (Milsom 2017);
-
índice de masa corporal (IMC) materno mayor (Durnea 2017; Gyhagen 2013; Pizzoferrato 2014; Quiboeuf 2016; Svare 2014);
-
edad (Quiboeuf 2016);
-
incontinencia urinaria antes o durante el embarazo (Durnea 2017; Gartland 2016; Pizzoferrato 2014; Svare 2014);
-
parto vaginal (Gartland 2016; Gyhagen 2013);
-
partos vaginales operatorios o traumatismo del esfínter perineal o anal (Durnea 2017; Gartland 2012; Svare 2014);
-
peso al nacer alto del recién nacido (Gyhagen 2013; Pizzoferrato 2014; Wesnes 2017).
Estas asociaciones se han observado en cualquier momento entre los cuatro a seis meses después del parto, en los 12 a 20 años después del primer parto (Gartland 2012; Gyhagen 2013; Pizzoferrato 2014; Wesnes 2017).
Incontinencia fecal
La incontinencia fecal (pérdida involuntaria de heces sólidas o líquidas) es menos frecuente que la incontinencia urinaria pero es particularmente angustiante psicológica y físicamente (Johanson 1996). Las mujeres también pueden presentar pérdida involuntaria de flatos (gases). El término incontinencia anal se utiliza para abarcar la pérdida involuntaria de heces o flatos.
La prevalencia de la incontinencia fecal es difícil de calcular ya que la definición de esta afección varía entre los estudios, se utilizan diferentes herramientas de evaluación y las pacientes pueden estar renuentes a admitir la incontinencia fecal (MacArthur 2013). Además, también es evidente la variación en los puntos temporales a los cuales se mide la incontinencia fecal durante el embarazo y después del parto, y en qué grupos de pacientes (p.ej. primíparas versus multíparas). Para esta revisión, la incontinencia fecal se consideró un término genérico que incluye la pérdida involuntaria de heces sólidas, heces líquidas, flatos o una combinación de estos.
Alguna forma de incontinencia fecal puede estar presente durante el embarazo en las mujeres primíparas, con una prevalencia entre el 12% y el 35% para la incontinencia de flatos y del 2,0% al 9,5% para la pérdida de heces formadas (Johannessen 2016; Svare 2016). Los síntomas persistentes a los tres meses después del parto pueden estar entre el 19% al 46% para los flatos y del 2,4% al 8,0% para la pérdida involuntaria de heces formadas (Brown 2012; Signorello 2000). A más largo plazo, estas tasas parecen persistir; alrededor del 31% de las pacientes primíparas informan pérdida involuntaria de flatos a los seis y 12 años después del parto y del 9% al 12% informan pérdida de heces formadas (MacArthur 2013). Una revisión sistemática (Bols 2010) indicó que el factor etiológico que con más frecuencia se asociada con la incontinencia fecal después del parto es una rotura de tercer o cuarto grado del esfínter anal externo.
Descripción de la intervención
Entrenamiento muscular del piso pelviano
El entrenamiento muscular del piso pelviano (EMPP) se refiere a la realización de contracciones voluntarias repetidas de los músculos del piso pelviano (MPP), según un protocolo que esboza la frecuencia, la intensidad y la progresión de los ejercicios, así como la duración del período de entrenamiento. Un programa de EMPP habitualmente incluye uno o más grupos de ejercicios por día, realizados al menos varios días de la semana, durante al menos ocho semanas. Se recomienda que el entrenamiento inicial esté seguido de ejercicios de mantenimiento de los MPP para asegurar la duración del efecto a más largo plazo (Bø 2004; Mørkved 2014).
En muchos países es frecuente que las mujeres reciban información y estímulo para realizar algunos ejercicios MPP durante el embarazo y después del parto. Durante el embarazo, la información sobre el EMPP se puede obtener de un profesional de la salud o de otras fuentes (p.ej. folletos y sitios web, pero este asesoramiento no puede dar lugar a un entrenamiento efectivo si los parámetros de ejercicio y el comportamiento con respecto al ejercicio no son suficientes. No obstante, se mantiene el uso del término EMPP para hacer la revisión más fácil de leer.
En las mujeres sin incontinencia durante el embarazo, el EMPP se realiza para prevenir la pérdida. Las pacientes que presentan síntomas de incontinencia durante el embarazo o después del parto se pueden derivar a un profesional sanitario específicamente para el tratamiento y la supervisión de los ejercicios.
Prevención de la incontinencia urinaria y fecal con EMPP
La prevención es primaria, secundaria o terciaria (Hensrud 2000). La prevención primaria procura eliminar las causas de una enfermedad. Por ejemplo, un ensayo que compare dos prácticas obstétricas (por ejemplo, políticas de episiotomía liberales versus restrictivas) y su efecto sobre la prevalencia de la incontinencia después del parto en pacientes previamente sin incontinencia, se considera un ensayo de prevención primaria. La prevención secundaria procura detectar la disfunción asintomática y tratarla precozmente, para interrumpir la progresión. Un ensayo que compare un tratamiento para mejorar el apoyo muscular de la vejiga con ningún tratamiento en pacientes en el período posnatal con debilidad muscular del piso de la pelvis, pero sin síntomas de incontinencia urinaria, se clasifica como ensayo de prevención secundaria. La prevención terciaria es el tratamiento de los síntomas existentes para prevenir la progresión de la enfermedad.
Clínicamente puede ser difícil detectar a todos los participantes potenciales de un ensayo para ver si la enfermedad está totalmente ausente o presente pero asintomática. Además, con un trastorno como la incontinencia puede haber más de un factor que puede contribuir al desarrollo del problema, por ejemplo la desnervación, las deficiencias de las fascias y de la función muscular. No es práctico someter a cribado todos los factores posibles y, en muchos casos, no existen pruebas clínicas fiables o validadas disponibles. En consecuencia, los ensayos de prevención pueden reclutar personas puramente sobre la base de la ausencia de síntomas. Esta conducta es frecuente en los estudios de incontinencia y sus resultados son probablemente una combinación de los efectos de prevención primaria y secundaria. Esta revisión no intenta distinguir entre los efectos primarios y secundarios, sino que los considera juntos.
Tratamiento de la incontinencia urinaria y fecal con EMPP
El EMPP para el tratamiento de la incontinencia urinaria fue popularizado por Arnold Kegel (Kegel 1948). Sin embargo, en una revisión de la bibliografía anterior a 1949, Bø 2004 identificó varios registros del uso del ejercicio MPP. El EMPP se ha recomendado principalmente en el tratamiento de la incontinencia urinaria de esfuerzo y mixta, pero cada vez más se ha incluido como parte del tratamiento ofrecido a las pacientes con incontinencia urinaria de urgencia. El uso del EMPP para el tratamiento de la incontinencia urinaria se basa en dos funciones de los músculos del piso de la pelvis: el apoyo de los órganos de la pelvis, y una contribución al mecanismo de cierre del esfínter de la uretra. Se pueden encontrar más detalles de cómo el EMPP puede actuar en el tratamiento de la incontinencia urinaria en los antecedentes de una revisión Cochrane previa sobre el EMPP (Dumoulin 2014).
El EMPP se ha utilizado en el tratamiento de la incontinencia fecal, aunque hay menos estudios de su efectividad que en la incontinencia urinaria. Teóricamente, el músculo del esfínter anal externo (que es una continuación del componente puborrectal de los músculos del piso pelviano) se puede entrenar de una manera similar a los otros músculos del piso pelviano, y no está claro si es posible que las personas noten la diferencia entre una contracción voluntaria del esfínter anal externo y una contracción voluntaria muscular del piso pelviano (Norton 2012).
El EMPP se recomienda como tratamiento de primera línea para la incontinencia urinaria (Abrams 2017; Dumoulin 2014). Sin embargo, hay una amplia variedad de opciones disponibles para tratar la incontinencia urinaria y fecal, que incluyen intervenciones conservadoras (rehabilitación del MPP con el uso de estimulación eléctrica y biorretroalimentación), intervenciones en el estilo de vida, entrenamiento vesical, dispositivos anti‐incontinencia, intervenciones farmacológicas y cirugía.
De qué manera podría funcionar la intervención
Hay una serie de razones convincentes de por qué el EMPP podría ayudar a prevenir la incontinencia urinaria. Por ejemplo, el músculo entrenado puede ser menos propenso a la lesión, y el músculo anteriormente entrenado puede ser más fácil de reentrenar después del daño, porque ya conoce los modelos motores apropiados. Puede ser que el músculo anteriormente entrenado posea una reserva de fuerza mayor, lo que hace que la lesión del músculo o de su inervación, no cause una pérdida de la función muscular suficiente para alcanzar el umbral en que la reducción de la presión uretral produzca la eliminación involuntaria de orina. Durante el embarazo, el entrenamiento de los MPP puede ayudar a contrarrestar el aumento de la presión intraabdominal causada por el crecimiento del feto, la reducción de la presión uretral mediada por hormonas y el aumento de la laxitud de las fascias y los ligamentos en el área pelviana. Se puede usar un razonamiento similar para apoyar el uso del EMPP para mejorar la función del esfínter anal externo y así prevenir la incontinencia fecal.
Esencialmente, se puede prescribir un programa de EMPP a las mujeres para:
-
aumentar la fuerza (la máxima tensión generada por un músculo en una sola contracción);
-
aumentar la resistencia (capacidad para contraer repetidamente o mantener una sola contracción en el transcurso del tiempo);
-
coordinar la actividad muscular (como la contracción previa de los MPP antes de una elevación de la presión intraabdominal, o para contener la urgencia);
-
tratar una combinación de los anteriores (Bø 2014).
Sin embargo, sobre la base de las razones convincentes anteriores, el entrenamiento de fuerza se tiende a recalcar en las pacientes embarazadas y después del parto. Los rasgos característicos del entrenamiento de fuerza incluyen números escasos de repeticiones con cargas altas, y una manera de aumentar la carga es aumentar la cantidad de esfuerzo voluntario con cada contracción voluntaria cercana al máximo (Bø 2014).
Existe un subgrupo de pacientes en las que hay incertidumbres particulares acerca de si la intervención podría funcionar y cómo podría hacerlo (Hilde 2013). Estas son las pacientes con avulsión (separación) de los MPP de la pared pelviana u otros defectos importantes en los MPP que se palpan o se observan con imagenología (p.ej. ecografía, imagenología de resonancia magnética). Es posible que estas mujeres se beneficien del EMPP después del parto, al ayudar a "sanar" la lesión (Hilde 2013). Sin embargo, también es posible que el EMPP no ayude al retorno de la función si el músculo ya no contiene las conexiones que le permiten anatómicamente comprimir y elevar la uretra con una contracción muscular.
Por qué es importante realizar esta revisión
Muchas mujeres durante el embarazo y después del parto presentan incontinencia urinaria y fecal que puede tener una repercusión significativa sobre la calidad de vida (Handa 2007; Rogers 2017). Con la alta prevalencia de incontinencia en las pacientes embarazadas y después del parto, posiblemente esta sea una afección "costosa". Hay costos directos sufragados por las pacientes, como la compra de productos para la incontinencia, los costos de lavandería y las visitas al médico general o al servicio para la atención de la incontinencia. Los costos menos directos pero no menos importantes para las pacientes pueden incluir las limitaciones en la actividad social o física que tienen que adoptar para evitar la vergüenza de la pérdida en público. Es probable que la prevención o el tratamiento de la afección con el EMPP tenga un costo considerable para los servicios sanitarios porque los tratamientos conservadores supervisados (p.ej. varios contactos directos con un profesional sanitario) como el EMPP son más costosos que la atención habitual (Wagner 2017). Sin embargo, el modelaje del costo‐efectividad de los tratamientos no quirúrgicos para la incontinencia urinaria de esfuerzo en las pacientes encontró que fue probable que formas más intensivas de EMPP valieran la pena (Imamura 2010). No está claro si tiene un mayor valor económico prevenir la afección que tratarla.
Aunque el EMPP se recomienda como la primera elección de tratamiento conservador para la incontinencia, todavía existen incertidumbres acerca de su efectividad en las pacientes antes y después del parto (Dumoulin 2017), como si el EMPP podría ser más efectivo si se dirige a grupos específicos, o más efectivo como una intervención de prevención o de tratamiento. Además, con la presión creciente sobre los presupuestos de asistencia sanitaria restringidos en todo el mundo, es importante aclarar si la intervención tiene un valor económico para garantizar la asignación eficiente de los recursos.
Esta revisión es una actualización importante de Boyle 2012, que examinó la efectividad del EMPP para la prevención, el tratamiento, o para el enfoque mixto de prevención y tratamiento de la incontinencia urinaria y fecal en pacientes antes y después del parto. La incertidumbres identificadas en las versiones anteriores de la revisión parecen haber contribuido a la finalización de algunos ensayos controlados aleatorios de tamaño moderado a grande en esta población (p.ej. Fritel 2015). Debido a que en la actualidad se han publicado varios ensayos nuevos con resultados que podrían cambiar los resultados de la revisión, se necesitaba una actualización que fuera rigurosa en cuanto a los métodos y los análisis.
Desde la última actualización de esta revisión en 2012, otros autores han publicado revisiones sistemáticas que abordan los efectos del EMPP durante el embarazo y después del parto para la prevención y el tratamiento de la incontinencia urinaria, así como los efectos del EMPP prenatal sobre los resultados del trabajo de parto y el parto (Du 2015; Mørkved 2014).
Objetivos
Determinar la efectividad del entrenamiento muscular del piso pelviano (EMPP) en la prevención y el tratamiento de la incontinencia urinaria y fecal en pacientes embarazadas o después del parto.
Se desearon probar las siguientes comparaciones.
-
EMPP prenatal versus ningún EMPP, atención habitual u otra condición control para la:
-
prevención primaria o secundaria de la incontinencia;
-
tratamiento de la incontinencia;
-
enfoque mixto de prevención o tratamiento de la incontinencia (es decir tratar una población mixta con EMPP).
-
-
EMPP posnatal versus ningún EMPP, atención habitual u otra condición control para el:
-
tratamiento de la incontinencia;
-
enfoque mixto de prevención o tratamiento de la incontinencia.
-
Métodos
Criterios de inclusión de estudios para esta revisión
Tipos de estudios
Fueron elegibles para inclusión los ensayos controlados aleatorios (incluidos los grupales y cruzados) y los estudios cuasialeatorios (p.ej. asignación por alternancia). Se excluyeron otras formas de ensayos clínicos controlados.
Tipos de participantes
Ensayos que reclutaron pacientes antes del parto (es decir, embarazadas) y después del parto (es decir, pacientes inmediatamente después de parto o pacientes con síntomas persistentes de incontinencia urinaria o fecal hasta tres meses después del parto más reciente). Las pacientes podrían tener síntomas de incontinencia urinaria, fecal, o urinaria y fecal al reclutamiento, o no.
Se compararon tres poblaciones de mujeres.
-
Ensayos de prevención en pacientes en el período prenatal que no presentaban incontinencia cuando se asignaron al azar.
-
Ensayos de tratamiento en pacientes antes y después del parto que no presentaban incontinencia cuando se asignaron al azar.
-
Ensayos de enfoque mixto de prevención y tratamiento en pacientes antes y después del parto, en los que algunas mujeres presentaban síntomas de incontinencia y otras no cuando se asignaron al azar.
Se prestó mucha atención a la distinción entre los ensayos de tratamiento y prevención porque el efecto del EMPP podría diferir para estos dos objetivos. En los ensayos que reclutaron pacientes antes y después del parto, presentaran síntomas de incontinencia o no, la intervención de EMPP fue una estrategia de prevención para las pacientes no sintomáticas y de tratamiento para las pacientes sintomáticas. No fue posible distinguir los dos efectos en estos ensayos.
Tipos de intervenciones
Un brazo de todos los ensayos elegibles incluyó un programa de EMPP para mejorar la función de los MPP, el esfínter anal externo o ambos. El EMPP fue un programa de contracciones voluntarias repetidas de los MPP, aunque la anterior fue una definición limitada en comparación con la definición ideal más completa (Dumoulin 2014). Se consideraron todos los tipos de EMPP, que incluyen las variaciones en el objetivo y el momento del EMPP (p.ej. EMPP para fortalecimiento, EMPP para contener la urgencia), las maneras de enseñar el EMPP, los tipos de contracciones (rápidas o mantenidas) y el número de contracciones.
Las intervenciones control aceptadas fueron atención prenatal y posnatal habitual, tratamiento placebo o ningún tratamiento. La atención prenatal o posnatal habitual en muchos países incluye asesoramiento sobre el EMPP. Se incluyeron los estudios en que el grupo control había recibido, o podía haber recibido, asesoramiento sobre el EMPP, que en el brazo con EMPP fue más intensivo de alguna manera que en el brazo control. Por ejemplo, en el brazo de EMPP un profesional sanitario les enseñó los ejercicios a las pacientes, mientras que la atención habitual incluyó la distribución de un folleto acerca del EMPP en las salas de atención posnatal.
Se incluyeron los ensayos en que el EMPP se combinó con otras modalidades de fisioterapia como la biorretroalimentación, la estimulación eléctrica o programas de ejercicio multimodal. También fueron elegibles para inclusión los estudios en que se proporcionó asesoramiento sobre estrategias para los síntomas de urgencia y frecuencia (pero sin un régimen de vaciamiento programado característico del entrenamiento vesical). Se excluyeron los ensayos en que el EMPP se combinó con otro tratamiento independiente como el entrenamiento vesical o la farmacoterapia (p.ej. un anticolinérgico). Se excluyeron los ensayos de estimulación eléctrica (sin EMPP).
Tipos de medida de resultado
En cuanto a la prevención, pareció que la medida de resultado más apropiada fue la ausencia de síntomas de incontinencia urinaria o fecal informada por la paciente. Para el tratamiento, se consideraron significativos un mayor número de resultados, aunque se pensó que el informe de la curación o de la mejoría de los síntomas de incontinencia urinaria o fecal por la paciente era lo más importante. Estos resultados se contraponen entre sí, y representan la presencia o ausencia de síntomas de incontinencia. Para lograr consistencia a través de toda la revisión, se decidió informar sobre la presencia de los síntomas de incontinencia, en lugar de la ausencia. Para las comparaciones que analizaron el efecto del EMPP para el tratamiento de los síntomas existentes de incontinencia, los lectores deben estar conscientes de que los datos fueron "negativos", es decir, continuación de la incontinencia en lugar de curación.
Resultados primarios
-
Incontinencia urinaria o fecal informada por la paciente.
-
Calidad de vida asociada con la incontinencia (p.ej. International Consultation on Incontinence Questionnaire (ICIQ; 4 ítems, puntuación mayor peor), Incontinence Impact Questionnaire (IIQ; 30 ítems, puntuación mayor peor), Urogenital Distress Inventory (UDI; 19 ítems, puntuación mayor peor) (Avery 2004; Avery 2007; Shumaker 1994).
Resultados secundarios
-
Observaciones de las pacientes:
-
gravedad de la incontinencia (p.ej. puntuación del Incontinence Index, leve, moderada o grave (Sandvik 1993)).
-
-
Cuantificación de los síntomas:
-
número de episodios de incontinencia urinaria o fecal.
-
-
Medidas del médico:
-
pérdida de orina bajo prueba de esfuerzo (p.ej. tos o prueba de la almohadilla).
-
-
Otras medidas del estado de salud y de la calidad de vida:
-
medidas psicológicas (p.ej. Hospital Anxiety and Depression Score (Zigmond 1983));
-
estado de salud general (p.ej. 36‐item Short Form [SF‐36] [Ware 1993]).
-
-
Economía sanitaria:
-
costos de la/s intervención/ones;
-
implicaciones de recursos de las diferencias en los resultados (p.ej. diferencias en el número de consultas al médico, o derivaciones);
-
análisis económico formal (costo‐efectividad, costo‐utilidad).
-
-
Efectos adversos:
-
malestar o dolor asociado con el EMPP.
-
-
Otros resultados:
-
resultado del trabajo de parto y el parto (p.ej. tipo de parto, traumatismo perineal, episiotomía, duración del período expulsivo) en pacientes que realizaron EMPP prenatal;
-
función sexual;
-
prolapso de órganos pelviano;
-
resultados no preespecificados considerados importantes al realizar la revisión.
-
Aunque no fueron resultados per se, también se extrajeron datos de dos variables particulares que podrían ayudar a explicar las variaciones en el efecto del EMPP:
-
Funcionalidad de los MPP (p.ej. electromiografía, presiones de contracción vaginal o anal);
-
Adherencia al tratamiento (p.ej. medidas alternativas como asistencia a clases y medidas más directas como frecuencia de los ejercicios en el domicilio).
Results
Description of studies
Results of the search
The flow of literature through the assessment process is shown in the PRISMA flowchart (Figure 1).
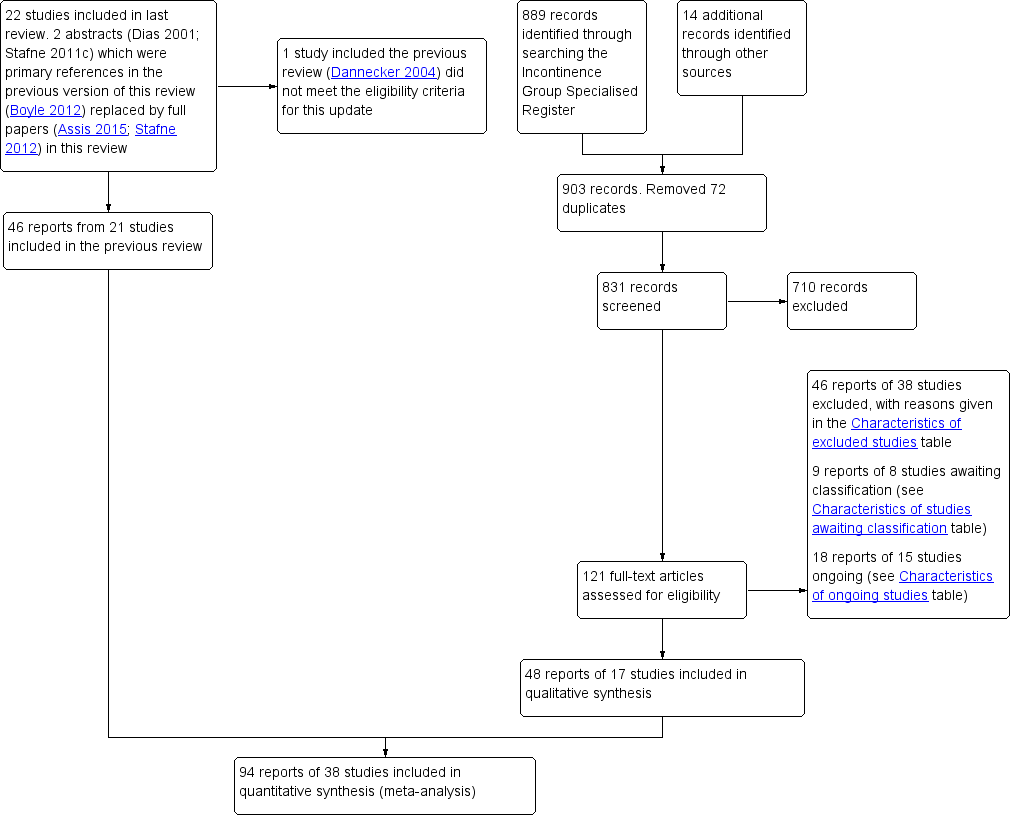
PRISMA study flow diagram.
The previous version of the review included 49 reports of 22 studies (Boyle 2012). The search update yielded 831 titles and abstracts and 121 records were obtained for further assessment. We included 48 reports from 17 new studies. The updated review now synthesises data from 94 reports of 38 studies that randomised 9892 women (4939 PFMT, 4953 controls) from 20 countries.
One trial included in the previous review did not meet the eligibility criteria for the intervention and was excluded from the update (Dannecker 2004; see Excluded studies). Forty‐six reports of 38 studies were excluded from the update and reasons are given in the Characteristics of excluded studies. In addition, 15 studies were classified as ongoing (see the Characteristics of ongoing studies) and eight require further assessment to determine eligibility (see the Characteristics of studies awaiting classification).
Three papers were published in Chinese and the data were extracted by translators for screening and further analysis (Kou 2013; Liu 2011; Wen 2010).
Included studies
The review includes 38 trials and further details are provided in the Characteristics of included studies.
-
Seven were primary or secondary prevention trials (i.e. none of the women had incontinence symptoms at the start of training) (Barakat 2011; Gaier 2010; Gorbea 2004; Kocaoz 2013; Pelaez 2014; Reilly 2002; Stothers 2002). Two trials provided subgroup data for women continent at randomisation (Mørkved 2003; Sampselle 1998). All nine investigated the effect of beginning PFMT antenatally.
-
Ten were treatment trials (i.e. all women had incontinence symptoms at the start of training). These investigated the effects of beginning PFMT antenatally and postnatally (Ahlund 2013; Cruz 2014; Dinc 2009; Dumoulin 2004; Glazener 2001; Kim 2012; Sangsawang 2016; Skelly 2004; Wilson 1998; Woldringh 2007).
-
Twenty‐one were mixed prevention or treatment trials as some women did, and others did not, have incontinence symptoms at the start of training. These trials investigated the effects of starting PFMT antenatally or postnatally (Assis 2015; Bø 2011; Chiarelli 2002; Dokmeci 2008; Ewings 2005; Fritel 2015; Frost 2014; Frumenzio 2012; Hilde 2013; Hughes 2001; Ko 2011; Kou 2013; Liu 2011; Meyer 2001; Miquelutti 2013; Mørkved 2003; Peirce 2013; Sampselle 1998; Sleep 1987; Stafne 2012; Wen 2010).
Twenty of the 38 studies were included in the previous version of this review (Assis 2015; Bø 2011; Chiarelli 2002; Dinc 2009; Dumoulin 2004; Ewings 2005; Glazener 2001; Gorbea 2004; Hughes 2001; Ko 2011; Meyer 2001; Mørkved 2003; Reilly 2002; Sampselle 1998; Skelly 2004; Sleep 1987; Stafne 2012; Stothers 2002; Wilson 1998; Woldringh 2007). Two trials were previously included in abstract form (Assis 2015; Stafne 2012).
The primary reference for eight trials was a conference abstract (Cruz 2014; Dokmeci 2008; Frost 2014; Frumenzio 2012; Gaier 2010; Hughes 2001; Skelly 2004; Stothers 2002). No further published reports were found for seven of these eight trials and one trialist kindly provided additional data from a thesis (Hughes 2001). One‐to‐one randomisation was assumed (the numbers in the intervention (139 women) and control (129 women) groups suggested this was likely) for one trial so that data could be used in the meta‐analysis (Skelly 2004).
Nineteen of the 38 included studies were publicly funded (university or national research funds or charitable trust) and one received grants from both public and private sources (Glazener 2001). Three studies did not receive any specific funding (Ahlund 2013; Barakat 2011; Kim 2012). Sixteen studies did not declare funding sources (Assis 2015; Bø 2011; Dokmeci 2008; Frost 2014; Frumenzio 2012; Gaier 2010; Gorbea 2004; Hughes 2001; Kim 2012; Kocaoz 2013; Kou 2013; Liu 2011; Pelaez 2014; Skelly 2004; Stothers 2002; Wen 2010). Fourteen trials declared no conflicts of interest (Ahlund 2013; Bø 2011; Chiarelli 2002; Dinc 2009; Dokmeci 2008; Fritel 2015; Glazener 2001; Hilde 2013; Ko 2011; Miquelutti 2013; Peirce 2013; Pelaez 2014; Sangsawang 2016; Stafne 2012). The remaining 14 trials did not report funding.
In all, 34 of the 38 trials contributed data to one or more meta‐analysis.
Settings
Women were recruited from various health services including antenatal and urology clinics, outpatient physiotherapy clinics, gynaecology and obstetric departments, and hospital settings in the following 20 countries: Australia (Chiarelli 2002), Brazil (Assis 2015; Cruz 2014; Miquelutti 2013), Canada (Dumoulin 2004; Skelly 2004; Stothers 2002), China (Ko 2011; Kou 2013; Liu 2011; Wen 2010), England (Ewings 2005; Glazener 2001; Reilly 2002; Sleep 1987), France (Fritel 2015), Ireland (Peirce 2013), Italy (Frumenzio 2012; Gaier 2010), Mexico (Gorbea 2004), Netherlands (Woldringh 2007), New Zealand (Glazener 2001; Wilson 1998), Norway (Bø 2011; Hilde 2013; Mørkved 2003; Stafne 2012), Republic of Korea (Kim 2012), Scotland (Glazener 2001), Spain (Barakat 2011; Pelaez 2014), Sweden (Ahlund 2013), Switzerland (Meyer 2001), Thailand (Sangsawang 2016), Turkey (Dinc 2009; Dokmeci 2008; Kocaoz 2013), and the US (Frost 2014; Sampselle 1998).
Sample characteristics
Parity (number of births)
Seven studies did not report parity or gravidity (Cruz 2014; Frost 2014; Frumenzio 2012; Kocaoz 2013; Skelly 2004; Stothers 2002; Wen 2010). Five of these were conference abstracts (Cruz 2014; Frost 2014; Frumenzio 2012; Skelly 2004; Stothers 2002). Trials that investigated the effects of antenatal PFMT for prevention of urinary incontinence recruited only continent women in their first pregnancy or having their first baby (or both), which trialists variously called nulliparous or primiparous women, or continent women regardless of parity (Barakat 2011; Gaier 2010; Gorbea 2004; Pelaez 2014; Reilly 2002). Trials testing antenatally for treatment of incontinence included women in their first pregnancy or nulliparae or multiparae women (Dinc 2009; Sangsawang 2016; Woldringh 2007). In trials of postnatal PFMT for treatment of urinary incontinence, all but one (Ahlund 2013, primiparous) recruited nulliparae or multiparae women (Dumoulin 2004; Glazener 2001; Kim 2012; Wilson 1998). In the mixed prevention and treatment studies investigating antenatal PFMT, most recruited women in their first pregnancy or who were having their first baby (Assis 2015; Bø 2011; Dokmeci 2008; Fritel 2015; Hughes 2001; Ko 2011; Miquelutti 2013; Mørkved 2003; Sampselle 1998). One included both nulliparae and multiparae (Stafne 2012). In the mixed prevention and treatment trials of postnatal PFMT, four included women who had just had their first baby (Hilde 2013; Liu 2011; Meyer 2001; Peirce 2013). The other three recruited mixed nulliparae and multiparae (Chiarelli 2002; Ewings 2005; Sleep 1987). In the trials with mixed parity samples, it is unknown if parity was comparable in six trials (Cruz 2014; Frumenzio 2012; Kocaoz 2013; Kou 2013; Skelly 2004; Stothers 2002). It was not comparable in one trial (Barakat 2011).
Age
Participant age was variously described, although five trials did not report this (Cruz 2014; Dokmeci 2008; Frost 2014; Peirce 2013; Skelly 2004). Three trials reported an age range, with women aged between their early 20s to early 40s (Kou 2013; Stothers 2002; Wen 2010). In two trials, about 50% to 60% of the women were aged 20 to 29 years (Chiarelli 2002; Ewings 2005). Median age was about 28 years in two trials (Hughes 2001; Reilly 2002) and 36 years in another trial (Dumoulin 2004). In the remaining 24 studies, the mean age was in the early 20s (Miquelutti 2013), mid to late 20s for 14 trials (Assis 2015; Dinc 2009; Fritel 2015; Gaier 2010; Gorbea 2004; Kocaoz 2013; Liu 2011; Meyer 2001; Mørkved 2003; Pelaez 2014; Sampselle 1998; Sangsawang 2016; Sleep 1987; Wilson 1998), and early 30s for 10 trials (Ahlund 2013; Barakat 2011; Bø 2011; Frumenzio 2012; Glazener 2001; Hilde 2013; Kim 2012; Ko 2011; Stafne 2012; Woldringh 2007). Age was comparable at baseline between groups in 29 trials but was unclear in the other nine (Cruz 2014; Dokmeci 2008; Frumenzio 2012; Kou 2013; Meyer 2001; Peirce 2013; Skelly 2004; Stothers 2002; Wen 2010).
Weight
Twenty‐two of the 38 trials reported bodyweight or BMI. For the women recruited antenatally, mean or median BMI was in the low to mid 20s (Barakat 2011; Bø 2011; Fritel 2015; Gaier 2010; Hughes 2001; Ko 2011; Miquelutti 2013; Mørkved 2003; Pelaez 2014; Reilly 2002; Sangsawang 2016; Stafne 2012; Woldringh 2007). Two trials reported that mean bodyweight in kilograms was in the mid 60s on average (Assis 2015, 67 kg; Gorbea 2004, 66 kg). About 30% of women had a BMI in the overweight or obese range in one trial that recruited women antenatally and in two that recruited women on postnatal wards (Chiarelli 2002; Ewings 2005; Kocaoz 2013). In three trials that recruited postnatal women with persistent incontinence symptoms, the mean or median BMI was in the normal range (Ahlund 2013; Dumoulin 2004; Kim 2012). BMI was about 26 kg/m² in one mixed treatment and prevention study which recruited women postnatally (Hilde 2013). BMI or bodyweight was comparable at baseline between groups for all of these trials, although two trials noted that weight gain in pregnancy differed significantly between the groups, being greater in either the PFMT group or in the control group (Barakat 2011; Gorbea 2004).
Type of delivery
Some details on delivery were given by 11 of 15 trials that began PFMT after delivery. In eight of these trials, all women delivered vaginally (Chiarelli 2002; Frost 2014; Hilde 2013; Kim 2012; Liu 2011; Peirce 2013; Sleep 1987; Wen 2010). In the study by Chiarelli 2002, all women had a forceps or ventouse delivery, while Peirce 2013 reported that about 39% of women had an instrumental delivery. The types of delivery appeared comparable across the PFMT and control groups in both trials. In the trials by Glazener 2001 and Wilson 1998, some women had a caesarean section (about 8% in Glazener 2001 and 18% in Wilson 1998) with the proportion of caesarean sections being similar in both the PFMT and control groups for both trials. Glazener 2001 also reported that about 14% of women in both the PFMT and control groups had assisted vaginal deliveries. In the remaining small trial by Meyer 2001, it was unclear if all 107 women delivered vaginally but it was reported that 30% of PFMT group and 16% of control group women had forceps delivery; this difference was not "statistically significant" (P = 0.10).
For the trials in which PFMT began antenatally, it is possible that the type of delivery was affected by PFMT. For these trials, the type of delivery was a possible confounder of the postnatal incontinence outcome but may itself be an outcome of importance. A short summary of the data is given here. The data are also reported in more detail in the analysis. Some details on the type of delivery, by group, were given by only 13 of the 23 trials in which PFMT began antenatally. In 11 trials, the delivery type was similar across both comparison groups (Barakat 2011; Fritel 2015; Frost 2014; Hughes 2001; Ko 2011; Miquelutti 2013; Mørkved 2003; Reilly 2002; Sampselle 1998; Stothers 2002; Woldringh 2007). However, in two trials, there seemed to be fewer vaginal deliveries in the PFMT group (Dinc 2009; Gorbea 2004). Miquelutti 2013 reported a "statistically significantly" longer duration of delivery in the PFMT group (MD 9.48, 95% CI 0.32 to 18.64; P < 0.05).
Exclusion criteria
The most common exclusion criterion (in 27 trials) was a comorbidity that contraindicated exercise in pregnancy or made PFMT difficult (or both), or might have altered the outcome of training, such as serious medical or neuromuscular conditions. Ten trials excluded women with high‐risk pregnancies (Bø 2011; Dokmeci 2008; Fritel 2015; Gorbea 2004; Ko 2011; Meyer 2001; Miquelutti 2013; Mørkved 2003; Sangsawang 2016; Stafne 2012). Sixteen trials included women with singleton pregnancies or excluded women with twins, or other multiple pregnancies or births (Ahlund 2013; Barakat 2011; Bø 2011; Cruz 2014; Fritel 2015; Gorbea 2004; Hilde 2013; Liu 2011; Meyer 2001; Miquelutti 2013; Mørkved 2003; Pelaez 2014; Sangsawang 2016; Stafne 2012; Stothers 2002; Wen 2010). Eight excluded women if the baby was stillborn or was very ill or died after birth (Chiarelli 2002; Ewings 2005; Glazener 2001; Hilde 2013; Mørkved 2003; Peirce 2013; Sleep 1987; Stafne 2012). Five excluded women if language difficulties meant it was difficult to seek informed consent (Chiarelli 2002; Dumoulin 2004; Ewings 2005; Peirce 2013; Woldringh 2007). An additional six outlined language requirements as part of their inclusion criteria (Bø 2011; Cruz 2014; Fritel 2015; Hilde 2013; Peirce 2013; Pelaez 2014). Four trials specifically excluded women who experienced pain with a PFM contraction (Dinc 2009; Ko 2011; Mørkved 2003; Sangsawang 2016).
Pelvic floor muscle training regimens and control interventions
The PFMT and control interventions are described in the Characteristics of included studies (overview) and in Table 1 (details of exercise parameters and adherence).
| Study ID | Voluntary pelvic floor muscle contraction confirmed? | PFMT parameters | PFMT supervision | Control comparison | Adherence | Notes |
| (treatment trial) | Vaginal palpation performed by study midwife: after randomisation and at each of the 3 visits to midwife (PFMT and control groups). | PFMT started with 3 fast contractions, followed by 3 sets of 8‐12 slow velocity, near maximal contractions, 6‐sec hold; 7 days per week for 6 months. Received written instructions on PFMT, but no information provided on PFMT progression. | Visit to the study midwife every 6th week (3 times during study period). | Usual care: written information describing PFM anatomy and PFMT. Received instructions on how to correctly perform PFM contraction (vaginal palpation) from midwife. | Women in the PFMT group were asked at each midwife visit how often they did PFMT; results not reported. | PFMT in lying or sitting positions. |
| (prevention trial) | Perineometry (at 1st meeting), but unclear by whom (PFMT group). | 5‐10 slow PFM contractions with 6‐sec hold, rest 6 sec between contractions with 3 rapid contractions at the end (as per Mørkved 2003). Daily PFMT in 4 positions, and 1 group (27 women) had 5 supervised sessions with a physiotherapist. Received manual of home PFMT exercises and asked to complete an exercise diary. | Supervised PFMT (27 women): received up to 5 monthly supervised exercise sessions with physiotherapist (22, 26, 30, 34, 38 weeks' gestation). Unsupervised PFMT (27 women): trained to perform PFMT by physiotherapist (1 session). | Did not receive intervention and did not exercise. | Not reported, although it stated that no dropouts occurred throughout the duration of the study due to all women in the PFMT group complying with the exercise protocol. | PFMT in a variety of positions including left side lying, sitting, reclined sitting, sitting with legs crossed, standing. Translation (Portuguese). |
| (prevention trial) | Not reported. | PFMT included in the 7‐ to 8‐min cool‐down period as part of a 35‐ to 45‐min exercise session, 3 days per week for duration of pregnancy (potential mean of 85 sessions in total). No specific details provided about PFMT programme. | Group exercise classes, supervised by a qualified fitness specialist, with the assistance of an obstetrician. | Not reported. | Adherence to PFMT was 90%. | General exercises targeted major muscles of arms and abdomen to promote good posture and prevent low back pain, and in the 3rd trimester strengthen the muscles of labour and PF. 1 session of aerobic dance per week. Accompanied by music. |
| (mixed prevention and treatment trial) | Participants did not have individual assessment of correct voluntary PFM contraction (due to pragmatic nature of study). Instructors were trained in how to explain a correct PFM contraction. | PFMT included as part of 15‐min strength training session within a 60‐min group exercise class. PFMT: 3 sets of 8‐12 maximal contractions, 6‐ to 8‐sec hold; strong verbal motivation to perform close to maximum PFM contractions. Women encouraged to participate in at least 2 out of 3 fitness classes per week for 12 weeks. Daily PFMT at home: 3 sets of 8‐12 close to maximum PFM contractions. Also encouraged to be physically active for at least 30 min per day. Received a specific PFMT brochure. | Group exercise classes, 2 or 3 per week for 12 weeks, led by certified aerobic instructors. Instructors were taught by a physiotherapist with > 20 years of experience in assessing, treating and researching women with PF dysfunction. | Usual antenatal care. | Mean adherence to exercise classes was 17.2 out of a possible 24 sessions. 40% (21/52) of women attended at least 80% of sessions. | PFMT integrated into aerobic dance class (accompanied by music): 5‐min warm‐up; 30‐min low‐impact aerobics; 15‐min strength training (including PFMT); 5‐min stretching and relaxation. PFMT in a variety of position including sitting, kneeling and standing. Informed of deep abdominal muscle co‐contraction during maximal PFM contraction. |
| (mixed prevention and treatment trial) | Visual inspection of perineum (PFMT group). | Maximum of 6 voluntary PFM contractions per set; 3‐6 sec hold; 3 sets per day; for 8 weeks. | PFMT taught 1‐to‐1 with physiotherapist. 1 (20 min) contact in hospital, and another (30 min) 8 weeks later at home or hospital. | Routine postnatal care; usual postnatal leaflet given; invitation to join postnatal class on ward; no restriction on PFMT if recommended by other health professional. | 84% (292/348) of women in the PFMT group and 58% (189/328) of controls were performing PFMT at "adequate" level at 3 months' postpartum. | Women were "asked if they were performing their PF exercises." |
| (treatment trial) | Not reported. | 5‐6 biweekly sessions. No specific details provided about PFMT. | Supervised by a physiotherapist. | Similar unsupervised PFMT at home. | Not reported. | Conference abstract. |
| (treatment trial) | Vaginal digital palpation (both PFMT and control groups). | Progressive PFMT programme. Level 1: 3 sets of 10 near maximal contractions; 3‐sec hold, 3‐sec rest; quick contraction, 1‐sec hold, 1‐sec rest; twice daily. Level 2: 3 sets of 10 near maximal contractions; 5‐sec hold, 5‐sec rest; quick contraction, 2‐sec hold, 2‐sec rest; twice daily. Level 3: 3 sets of 15 near maximal contractions; 10‐sec hold, 10‐sec rest; quick contraction, 2‐sec hold, 2‐sec rest; 3 per day. | Trained by a researcher on how to do PFMT in accordance with booklet of PFM exercises. | Usual care: instructed on how to perform a correct PFM contraction, but did not receive training about exercises. | Not reported. | In 2nd stage of study, 68% of women in study group were contracting the proper muscle group. The rest were given more training and reassessed 1 week later. |
| (mixed prevention and treatment trial) | Not reported. | Not reported. | Not reported. | Not reported. | Not reported. | Conference abstract. |
| (treatment trial) | Not reported. | 8‐12 close to maximal voluntary PFM contraction per set; 6‐ to 8‐sec hold each with 3‐4 fast contractions at the end of each contraction; 6‐sec rest between contractions; 3 sets per day; 5 days per week; for 8 weeks. Also taught 'the knack' (voluntary PFM contraction prior to hard cough and maintained through cough until abdominal wall relaxed). | PFMT taught 1‐to‐1 with physiotherapist. | Same number of physiotherapy contacts for relaxation massage of back and extremities; asked not to do PFMT at home. | Not reported. | In addition to PFMT 15 min of electrical stimulation (biphasic rectangular form, 50 Hz, pulse width 250 msec, duty cycle 6 sec on and 18 sec off for 1st 4 weeks, then 8 sec on and 24 sec off for next 4 weeks, at maximal tolerated current intensity) and 25 min of electromyographic biofeedback per appointment. |
| (mixed prevention and treatment trial) | Not reported. | 6 months. | PFMT taught 1‐to‐1 with physiotherapist in hospital. | Standard care including verbal promotion of PFMT and leaflet on PFMT. | Of 117 women in the PFMT group, 114 were visited by the physiotherapist in hospital, 21 attended the 2‐month PFMT group, and 5 attended the 4‐month group. | ‐ |
| (mixed prevention and treatment trial) | Vaginal digital palpation at each session (possibly by physiotherapist, but not stated; PFMT group). | 1 session per week (20‐30 min), total of 8 sessions between 6th and 8th month of pregnancy. Also 'the knack' (voluntary PFM contraction prior to increasing intra‐abdominal pressure). Provided with written information on PF anatomy and PFMT, and encouraged to perform daily PFMT at home, 10‐20 contractions. | Individually supervised by a physiotherapist or midwife at each session. In total, 37 different therapists (all trained by the same specialist physiotherapist) were involved in delivering the exercises. | Usual care, including written information on PF anatomy and PFMT (encouraged to perform daily at home, 10‐20 PFM contractions). | 69.3% (97/140) of women in the PFMT group completed all planned sessions, and 82.8% (116/140) completed at least 1 session (4‐8, median 8). At the end of pregnancy, women in both groups reported a similar frequency and duration of PFMT (including number of contractions). PFMT was performed daily at home by 4.3% (6/140) of PFMT women and 10.6% (15/142) of controls, at the end of pregnancy. | PFMT performed in standing (5 min) and lying (10 min). |
| (mixed prevention and treatment trial) | Not reported. | Standard postpartum discharge instructions plus written and verbal instructions for PFMT. | Not reported. | Standard postpartum discharge instructions. | Not reported. | Conference abstract. |
| (mixed prevention and treatment trial) | Not reported. | 2 weekly session of Kegel exercises; 8 weeks. Daily home exercises (20 min) and stretching. | Not reported. | Did not receive any PFMT, no other details provided. | Not reported. | Conference abstract. |
| (prevention trial) | Not reported. | 12‐week PFMT programme. | PFMT supervised by a physiotherapist and midwife. | Routine care and PFM exercises, customary instruction at intake visit. | Not reported. | Conference abstract. |
| (treatment trial) | Not reported. | 8‐10 sessions of fast and slow voluntary PFM contraction per day with aim of 80‐100 per day; for up to 8 months. | PFMT taught 1‐to‐1 with nurse, health visitor or continence advisor. | Usual antenatal and postnatal care that may have included advice on PFMT. | 78% (218/278) of women in the PFMT group and 48% (118/244) of controls had done some PFMT in the 11th postnatal month. Mean (SD) number of voluntary PFM contractions per day at 12 months' postnatal: PFMT group 20 (29) and controls 5 (15). | Frequency and urgency strategies added if needed at 7 or 9 months postnatally. 52.7% (394/747) of women at 6 years' follow‐up and 70.1% (471/672) of women at 12 years' follow‐up completed a questionnaire. About 50% of women in PFMT and control groups were performing any PFMT at both time points. Daily PFMT was undertaken by 6% (17/263) of PFMT women compared to 12% (29/253) of control women at 6 years; and 7% (15/227) of PFMT group compared to 8% (20/241) of control women at 12 years. |
| (prevention trial) | Surface electromyography (electrodes either side of anus; PFMT group). | 10 voluntary PFM contraction; 8‐sec hold followed by 3 fast, 1‐sec contractions; 6‐sec rest between contractions; for up to 20 weeks. Asked to complete an exercise diary. | PFMT taught 1‐to‐1 with physiotherapist. | Requested not to do PFMT during pregnancy or postnatally. | 63% attended all 8 physiotherapy appointments, 21% attended 7 appointments. | Electromyographic biofeedback at each appointment. |
| (mixed prevention and treatment trial) | Vaginal digital palpation (PFMT and control groups). | Progressive supervised PFM training programme (as per Mørkved 1997) for 16 weeks. Daily PFMT at home, 3 sets of 8‐12 close to maximal contractions. Customary written information on discharge from postnatal ward. Asked to complete an exercise diary. | Supervised exercise class from 6 weeks' postpartum, led by an experienced physiotherapist, once per week for 16 weeks. Class attendance was documented. | Usual care. Received customary written information on discharge from postnatal ward. At 6 weeks were instructed on how to perform a correct PFM contraction (verified with vaginal digital palpation). | 96% (72/75) of women in the PFMT group who completed the trial adhered to 80% of the class and daily home training. In the control group (retrospective questioning), 16.5% reported performing daily PFMT at home ≥ 3 times per week. | 4% (7/175) of women were unable to perform a voluntary PFM contraction at baseline. At baseline (6 weeks' postpartum) more women in the control group were performing PFMT ≥ 3 times or more per week. |
| (mixed prevention and treatment trial) | Vaginal digital palpation (PFMT and control groups). | Daily; for up to 11 months. | 1 individual session with physiotherapist, and 1 group PFMT session led by physiotherapist at 22‐25 weeks' gestation with maximum of 6 women per group. | Usual antenatal and postnatal care that may have included advice on PFMT (personal communication). | 79% (461/586) of women in PFMT group attended group PFMT session (personal communication). | 3.5% (16/460) of women who attended group PFMT session could not perform a voluntary PFM contraction after teaching, and 2.8% (13/460) of women could contract but not sustain a contraction (personal communication). Conference abstract. |
| (treatment trial) | Perineometer (vaginal probe) used to ensure PFM contraction and assess control of contraction in both PFMT and control groups. Unclear if this was performed every session with the PFMT women. | 20 maximal voluntary PFM contractions, 10‐sec hold, 3 times per week; for 8 weeks (as part of a class), and daily at home. Progressed by changing position (prone, sitting and standing). Initial session included information on PFM anatomy and function. Also provided with a booklet which included a training programme and an exercise diary. | Supervised training sessions (1‐hour duration) with a specialist physiotherapist (23 in total, unclear if individual contacts or group classes). | Usual care. Received the same information and demonstration session as PFMT group and instructions on how to correctly perform PFM contraction (perineometer). Unsupervised, daily PFMT for 8 weeks. | Not reported. | PFMT integrated with trunk stabilisation exercises (progressive abdominal strengthening, bridging, and side‐bridge). |
| (mixed prevention and treatment trial) | Observation of inward movement of perineum during contraction (PFMT group). | 3 repetitions of 8 PFM contractions, 6‐sec hold each, 2‐min rest between repetitions; repeated twice daily at home with additional training in groups once per week for 45 min for 12 weeks. Asked to complete an exercise diary. | Group training sessions (10 women) supervised by a physiotherapist once per week for 12 weeks. | Regular antenatal care and the customary written postpartum instructions that did not include PFMT from the hospital. Not discouraged from performing PFMT on their own. | > 80% attended every training session and 0 were absent more than twice. At 35 gestational weeks, 87% of PFMT group reported practice of PFMT ≥ 75% of the time. | Group training was performed in sitting and standing positions with legs apart to emphasise specific strength training of the PFM and relaxation of other muscles. |
| (prevention trial) | Observation of inward movement of perineum or digital vaginal palpation, or both (PFMT group). Vaginal digital palpation used to teach PFM contraction in 23.5% (16/68) of women. | 3 sets of 10 maximal voluntary PFM contractions at level 3 (2‐sec hold, 2‐sec rest for strength; 10‐sec hold, 10‐sec rest for endurance); 3 sessions per day during pregnancy and postpartum. Women received education about the anatomy and functions of the PFM and PFMT (unclear from whom) and were asked to complete an exercise diary (including progressions). | Exercise compliance was checked at every hospital visit (9‐10 visits on average, over a minimum of 12 weeks), and pregnant women were called once per month to encourage regular exercise. | Not instructed to do PFMT. Once data collection complete, controls received PFMT and a brochure with the relevant information during the 12th week home visit. | Women asked to record the number of times they did their exercises. No data reported. | Digital vaginal palpation was refused by 52/68 women due to concerns about pregnancy, cultural/religious reasons. Unclear if women progressed through levels 1‐3 or started at level 3, whether they did 3 sets of 10 exercises per day or 3 sets of 10 exercises 3 times per day, or how the sets were divided between endurance and strength training. |
| (mixed prevention and treatment trial) | Not reported. | PFM (Kegel) exercises undertaken 2‐3 times per day for 20‐30 min or 150‐200 contractions (3‐sec hold then relax), performed until 12 months' postpartum. Biofeedback used twice per week (no further details available). | Not reported who supervised the programme, or the number and type of contacts with health professional(s). | Usual care: received standard postpartum information. | Not reported. | Translation (Chinese). |
| (mixed prevention and treatment trial) | Not reported. | PFMT 2‐3 times per day, 15‐30 min each set (4‐ to 6‐sec hold, 10‐sec relaxation), started after birth and continued for ≥ 10 weeks. | Exercises taught by experienced midwives who also supervised the programme (number and type of contacts/visits unclear). | Usual care: standard postpartum information. Unclear if this included PFMT. | Not reported. | Translation (Chinese). Positions of exercises included supine, sitting or any other position, with legs slightly separated, with instructions to contract anus, vaginal and urinary tract while breathing in, and to relax with expiration. |
| (mixed prevention and treatment trial) | Not reported. | Up to 8 months; no details of PFMT provided. Each clinic session was followed by 20 min of biofeedback and 15 min of electrical stimulation. | 12 sessions (6 weeks) with a physiotherapist between 2 and 10 months postnatally. | No intervention. Women received PFMT education after 3rd assessment at 10 months' postpartum. | Not reported. | In addition to PFMT, 20 min of biofeedback and 15 min of electrical stimulation (vaginal electrode, biphasic rectangular waveform, pulse width 200‐400 msec, frequency 50 Hz, intensity 15‐15 mA, contraction time 6 sec, rest time 12 sec) per appointment. |
| (mixed prevention and treatment trial) | Instructed on correct contraction, but not verified (due to pragmatic nature of study). | PFMT (maximal rapid and sustained PFM contractions) performed as part of a class (50 min) for a median of 5 (range 2‐10) sessions between 18‐24 weeks' to 36‐38 weeks' gestation. Provided with an exercise guide and asked to do daily PFMT at home (30 rapid, 20 sustained (10‐sec hold) contractions), as well as 30‐min daily aerobic exercise (no specific examples provided). Received standard antenatal education and asked to complete an exercise diary. | Supervised by a trained study physiotherapists on a monthly basis. Either group or individual training sessions, depending on the number of women present. | Usual care: received standard antenatal and postnatal education (on labour, breastfeeding and pain relief) by trained physiotherapy, nursing and medial staff. | Analysis of adherence in intervention group was not possible as women failed to complete or return their exercise diaries. | PFMT performed in standing and sitting position. PFMT integrated into non‐aerobic exercise programme designed to reduce back pain. Included abdominal, stretching and relaxation exercises and exercises designed to promote venous return. |
| (mixed prevention and treatment) | Vaginal digital palpation and observation of perineum (both PFMT and control groups). | 8‐12 near maximal voluntary PFM contractions; 6‐ to 8‐sec hold each, 3‐4 fast contractions at the end of each contraction; 6‐sec rest between contractions; twice daily at home; for ≤ 8 months. Also asked to attend weekly 60‐min PFMT class for 12 weeks. Women asked to complete an exercise diary. | Group training session (10‐15 women), once per week for 12 weeks, supervised by physiotherapists (5 in total). | Usual antenatal and postnatal care that may have included advice on PFMT. Correct PFM contraction verified. Not discouraged from doing PFMT on their own. | 19% (28/148) of PFMT women attended less than half the 12 weekly PFMT classes and did not return training diaries. | During exercise class voluntary PFM contraction undertaken in a range of body positions (lying, sitting, kneeling and standing with legs apart). PFMT interspersed with abdominal, back and thigh muscle exercises (accompanied by music). 62% (188/280) of women completed a questionnaire at 6‐year follow‐up, and 45% of women in both the former PFMT and control groups were doing PFMT at least weekly. |
| (mixed prevention and treatment trial) | Contraction assessed with anal biofeedback as part of training session (by obstetrician or specialist nurse); PFMT group. | Sets of 10 PFM contractions (Kegel exercises), 5‐sec hold; 10‐sec rest between contractions; twice daily for 5 min with biofeedback; for 3 months. Standard postpartum education by midwives or physiotherapists, including written information. Women asked to complete an exercise diary. | Biofeedback (electromyographic) training provided at initial session, but no further contact with health professionals. | Usual care: "conventional PFM training," but no details provided. Women asked to complete an exercise diary. | Poor adherence defined as performing < 70% of the intended home exercise sessions. 7/30 women in the PFMT group reported poor adherence. | The portable biofeedback machines were programmed to the electromyography setting with the work period set to 10 contractions (5‐sec duration) with a 10‐sec rest between each contraction. PFMT for treatment of FI. |
| (prevention trial) | Instructed on correct contraction, but not formally verified. Women were asked to test themselves at home by stopping the flow of urine, digital palpation or using a mirror to observe the perineum (PFMT group). | PFMT programme, 3 times per week; for ≥ 22 weeks. Started with 1 set of 8 contractions increasing to 100; divided into different sets of slow (6 sec) and fast (5 as fast as possible) contractions. Unclear if this progression related to class or home exercises. Daily PFMT at home, 100 contractions in different sets. Received standard antenatal education about PFM. | Group training sessions (8‐12 women) designed and supervised by a physical activity and sport sciences graduate; 55‐ to 60‐min duration (10 min of PFMT); 70‐78 sessions in total. | Usual care: follow‐up by midwives, standard information about PFMT. Women were not asked not to do PFMT. | All women included in analysis attended ≥ 80% of exercise sessions. | PFMT integrated into supervised exercise programme; 30 min low‐impact aerobics including general strength training, PFMT and cool down (stretching, relaxation or massage); sometimes accompanied by music. PFMT in a variety of positions. Women wore heart rate monitors to control exercise intensity. |
| (prevention trial) | Unclear, but seems likely as physiotherapists gave individualised programmes to those unable to follow exercise regimen due to inability to do voluntary PFM contraction (PFMT group). | 8‐12 voluntary PFM contractions; 6‐sec hold each; 2‐min rest between each set of contractions; 3 sets of 8‐12 contractions twice daily; for about 20 weeks (as described by Bø 1995). | About 5 (monthly) contacts with physiotherapist between 20 weeks' gestation and delivery. | Usual antenatal and postnatal care that may have included advice on PFMT. Women appeared to have had same number of clinic visits as the PFMT group, and were asked if doing PFMT at each of these visits. | 43% (52/120) of women in the PFMT group did not return an exercise diary; 11% (13/120) completed < 28 days of PFMT; and 46% (55/120) completed ≥ 28 days. When asked postnatally, 28% (33/120) of PFMT women and 34% (37/110) of controls were doing occasional or no PFMT. | If unable to follow PFMT regimen then individualised programme until able to do so. 71% (164/230) of women completed a telephone questionnaire at 8‐year follow‐up, and 68.4% of women were doing PFMT, with 38% stating they were doing PFMT twice or more per week. |
| (mixed prevention and treatment trial) | Yes, but unclear how or by whom (PFMT group). | PFMT tailored to individual ability. 30 maximal or near maximal voluntary PFM contraction per day; for ≤ 17 months. | Not reported. | Usual antenatal and postnatal care; no systematic PFMT programme. | At 35 weeks' gestation, 85% of women in the PFMT group reported to be doing PFMT 75% of the time. At 1 year, PFMT adherence reported to vary between 62% and 90%. | ‐ |
| (treatment trial) | Assessed by ability to stop or slow the flow of urine for 1‐2 sec (PFMT group). | 20 sets of PFM exercises, twice daily, at least 5 days per week, for 6 weeks. 1 set of PFM exercises was 1 slow contraction (10‐sec hold), followed by 10 fast contractions; no progression in number of contractions per set. Also received a handbook with information on stress UI, PFM function, instructions on PFMT and a urinary diary. | Supervised group sessions (4‐5 women) with a midwife; 45 min; once every 2 weeks for 6 weeks (3 sessions in total). | Usual care: from health professionals, obstetricians or midwives. Did not receive information about UI and received no training support about performing correct PFM exercises. | No women were excluded for failing to perform the PFMT for < 28 (of approximately 42) days. | PFMT performed in various positions including lying down, sitting and standing. |
| (treatment trial) | Not reported. | Not reported. | "One to one teaching about pelvic floor exercises." | "Conventional care (hand‐out information about pelvic muscle exercises)." | Not reported. | Conference abstract. |
| (mixed prevention and treatment trial) | Not reported. | As for controls with additional section in leaflet recommending a specific exercise each week that integrated voluntary PFM contraction with usual activities of daily living; up to 3 months. Asked to complete a daily exercise diary for 4 weeks. | 1‐to‐1 session with midwife co‐ordinator each postnatal day in hospital. | Usual antenatal and postnatal care including PFMT leaflet; might include PFMT at antenatal class or postnatal class on ward (or both); instructed to do voluntary PFM contraction as often as remembered and mid‐stream urine stop. | At 10 days postnatally, 78% of PFMT group and 68% of controls were doing some PFMT; with 58% of PFMT group and 42% of controls doing some PFMT at 3 months. | ‐ |
| (mixed prevention and treatment trial) | Vaginal digital palpation (PFMT group). | 8‐12 near maximal voluntary PFM contractions; 6‐ to 8‐sec hold each with 3 fast contractions at the end of each contraction. Asked to perform PFM exercises as part of a 45‐min home programme at least twice per week or a weekly 60‐min exercise class (or both). Received written information including brochure with an evidence‐based PFMT programme, and asked to complete an exercise diary. | Group training sessions (8‐15 women) supervised by physiotherapist, 60 min, once per week for 12 weeks | Usual care: received customary information from midwife or GP. Also given a detailed information brochure including evidence‐based PFMT programme. Women were not discouraged from exercising. | Adherence to the general exercise protocol (exercising ≥ 3 days per week, moderate to high intensity) was 55% (217/397) in the PFMT group and 10% (36/365) in the control group. 67% of the PFMT group performed PFMT ≥ 3 times per week compared to 40% in the control group | PFMT integrated into standardised exercise programme: 30‐ to 35‐min low‐impact aerobics; 20‐ to 25‐min strengthening exercises (including PFMT, 3 sets of 10 reps); 5‐ to 10‐min stretching and relaxation. PFMT performed in a variety of positions, with legs apart to emphasise specific strengthening of the PFM. |
| (prevention trial) | Not reported. | 12 contractions, 3 times daily. | Seen twice monthly throughout pregnancy, and every 3 months postnatally for 1 year. | "Other (placebo) including no pelvic floor exercises." | Not reported. | Conference abstract. |
| (mixed prevention and treatment trial) | Assessment of PFM strength and contraction by an obstetrician (PFMT group; no further details) | Anal contraction; 3‐sec hold (while inhaling) followed by relaxation with 3‐5 faster contractions at the end of each contraction; 15‐30 min each set; twice daily; 6‐8 weeks. | Exercises taught by experienced midwives but unclear who supervised the programme of the number and type of contacts/visits. | Usual care: no other details provided other than "conventional guidance." | Not reported. | PFMT performed in a variety of positions including lying down, sitting or standing. Translation (Chinese). |
| (treatment trial) | Not reported. | Mix of fast and slow voluntary PFM contractions 8‐10 times per day with aim of 80‐100 voluntary PFM contraction daily; up to 9 months. | 1‐to‐1 sessions with physiotherapist at 3, 4, 6 and 9 months postnatally. | Usual PFMT as taught in antenatal and postnatal classes. | Mean (95% CI) number of daily voluntary PFM contraction at 12 months' postnatally was 86 (69‐104) in the PFMT group and 35 (30 to 40) in the control group. | Perineometry for biofeedback at each appointment. Mean time to teach PFMT to the PFMT group was 32 (95% CI 30 to 34) min. |
| Observation and palpation of perineal body by physiotherapists. Women also encouraged to practice self‐palpation (PFMT group). | Not reported. At each visit, women were asked about the frequency and duration of PFMT. | 1‐to‐1 30‐min sessions with physiotherapist. 4 in total: 3 antenatally and 1 at 6 weeks postnatally. In total, 25 physiotherapists (specialised in PFMT) were involved in delivering the exercises. | Usual antenatal and postnatal care including advice on PFMT; nearly two‐thirds received some instruction on PFMT. | At 35 weeks' gestation, 6% reported no PFMT, 17% reported some PFMT, 40% were doing PFMT at low intensity and 37% were exercising intensively in the PFMT group vs 36% reported no PFMT, 25% reported some PFMT, 26% were doing PFMT at low intensity and 14% were exercising intensively in the control group. | ‐ |
CI: confidence interval; FI: faecal incontinence; min: minute; PF: pelvic floor; PFM: pelvic floor muscle; PFMT: pelvic floor muscle training; SD: standard deviation; sec: second; UI: urinary incontinence.
First, the PFMT programmes were classified by their possible physiological effect(s) (strength, endurance, co‐ordination or a combination), based on the described exercise parameters. Second, the amount of contact or supervision from health professionals (low fewer than five contacts; moderate six to 12 contacts; high more than 12 contacts), confirmation of a correct PFM contraction and nature of the control interventions were examined. Third, adherence data were considered to assess whether exercise behaviour was likely to support a physiological effect. Trials were classified according to whether they provided data for both the intervention and control groups, the intervention group only or neither group. The likely impact of the exercise programmes on PFM function and the clinical difference between the intervention and control conditions are considered in the Discussion.
We categorised 11 trials as providing strength training and six as probably strength training trials, 17 in all.
-
Eleven trials clearly provided exercise parameters that favoured strength training; short duration contractions of maximal or near maximal effort and a relatively small number of repetitions (Ahlund 2013; Bø 2011; Dinc 2009; Dumoulin 2004; Hilde 2013; Kim 2012; Kocaoz 2013; Miquelutti 2013; Mørkved 2003; Sampselle 1998; Stafne 2012). The exercise protocol described by Bø 1995 was the PFM strength training protocol on which the trials by Bø 2011, Mørkved 2003, and Dumoulin 2004 were based. Supervised treatment duration was only eight weeks in the trials by Dumoulin 2004 and Kim 2012 and this might have been insufficient for muscle hypertrophy to be established. In addition to strength training, Dumoulin 2004 included some co‐ordination type training. Women were encouraged to perform voluntary PFM contraction in conjunction with rises in intra‐abdominal pressure, such as with coughing or sneezing, also known as 'the Knack' (Miller 2008). Kim 2012 included trunk stabilisation exercises. With regard to contact with health professionals, this was low in two trials (fewer than five contacts) (Ahlund 2013; Miquelutti 2013), moderate (six to 12 contacts) in four (Dumoulin 2004; Kocaoz 2013; Mørkved 2003; Stafne 2012) and high (more than 12 contacts) in three (Bø 2011; Hilde 2013; Kim 2012). Four trials stated that PFMT was supervised in an exercise class (Bø 2011; Hilde 2013; Mørkved 2003; Stafne 2012). Eight trials confirmed a correct voluntary PFM contraction prior to training (Ahlund 2013; Dinc 2009; Hilde 2013; Kim 2012; Kocaoz 2013; Mørkved 2003; Sampselle 1998; Stafne 2012). Five of these also confirmed a correct contraction in the control group along with provision of usual antenatal and postnatal care (Ahlund 2013; Dinc 2009; Hilde 2013; Kim 2012; Mørkved 2003). In the remaining six trials, the control conditions were usual care, which may or may not have included PFMT or no PFMT as controls were asked not to train (Bø 2011; Dumoulin 2004; Kocaoz 2013; Miquelutti 2013; Sampselle 1998; Stafne 2012). With regard to adherence, five trials reported some information about exercise behaviour and four of these compared group exercise classes and home PFMT versus usual care (Bø 2011; Hilde 2013; Mørkved 2003; Stafne 2012). The fifth trial with adherence data compared standardised instruction and home PFMT with usual care (Sampselle 1998). In Stafne 2012, 67% of the PFMT group performed home PFMT at least three times per week compared to 40% of controls in late pregnancy. At six months' postpartum, Hilde 2013 found that 96% of the PFMT group who completed the trial adhered to 80% of the class and daily home training, whereas 16.5% of controls reported daily PFMT at home, three or more times per week. The other three trials reported data only for the intervention group, with adherence to PFMT of about 70% (Bø 2011) and 80% (Mørkved 2003), or 85% of PFMT women doing PFMT 75% of the time (Sampselle 1998).
-
Six trials described PFMT programmes that were characteristic of strength training but did not mention loading (effort) (Assis 2015; Chiarelli 2002; Gorbea 2004; Ko 2011; Peirce 2013; Reilly 2002). Two trials referenced the exercise protocols of other authors. Reilly 2002 cited Bø 1995 (strength and load training) and Ko 2011 cited Reilly 2002. The supervised treatment duration was only eight weeks in the trial by Chiarelli 2002 and this may have been insufficient for muscle hypertrophy to be established. In addition to strength training, women undertook some co‐ordination type training, daily biofeedback or participated in a weekly exercise class supervised by a physiotherapist (Ko 2011; Peirce 2013; Reilly 2002). In two trials, the control groups did not exercise (Assis 2015; Gorbea 2004). In the other four trials, controls were randomised to usual care which may or may not have included PFMT (Chiarelli 2002; Ko 2011; Peirce 2013; Reilly 2002). A correct PFM contraction for women in the exercise group was confirmed in five of the six trials (Assis 2015; Chiarelli 2002; Gorbea 2004; Ko 2011; Peirce 2013). However, none of the control groups appeared to have confirmation of a correct contraction. With regard to adherence, five of the six trials reported some information about exercise behaviour (Chiarelli 2002; Gorbea 2004; Ko 2011; Peirce 2013; Reilly 2002). Five trials offered individual supervision (Assis 2015; Chiarelli 2002; Gorbea 2004; Peirce 2013; Reilly 2002). One offered group sessions (Ko 2011). At three months' postpartum, Chiarelli 2002 reported that more women in the PFMT group (84%) compared to controls (58%) were doing "adequate" PFMT. Similarly, in Reilly 2002, about 75% of the PFMT group and 66% of the control group were doing more than occasional or no PFMT (27.5% in the PFMT group and 34% in the control group reported occasional or no PFMT). During the antenatal intervention period, nearly half the women in the PFMT group exercised for 28 days or more (which is approximately once per week over 20 weeks). The other three trials reported data only for the intervention group, with two reporting that over 80% of women attended most or all supervised visits (Gorbea 2004; Ko 2011). Ko 2011 and Peirce 2013 reported that more than three‐quarters of women in the PFMT group completed 70% or more of the prescribed exercise.
There was insufficient detail in the other 21 trials to classify them as providing strength or endurance training.
-
Seven trials provided some information about PFMT but could not be categorised (Glazener 2001; Kou 2013; Liu 2011; Pelaez 2014; Sangsawang 2016; Wen 2010; Wilson 1998). None had any description of effort (i.e. load). Supervised treatment was only six to eight weeks in two trials and this might have been insufficient for muscle hypertrophy to be established if strengthening was intended (Sangsawang 2016; Wen 2010). Five of the seven trials included variously described mixes of fast and slow contractions with relatively large numbers of sets (eight to 10 per day) and few repetitions per set (about 10) or exercise sets of 15‐ to 30‐minute duration (Glazener 2001; Pelaez 2014; Sangsawang 2016; Wen 2010; Wilson 1998). Overall, all appeared to recommend a large number of contractions per day (more than 100) or a minimum of 30 minutes of PFMT per day. The programmes might have affected strength or endurance, or both, depending on the number of contractions performed daily and the amount of voluntary effort with each contraction. The amount of contact with healthcare providers varied. In two trials, women participated in group exercise sessions, either three groups over a period of six weeks or a total of 70 to 80 groups over 22 weeks (Pelaez 2014; Sangsawang 2016). In another two trials, women had one‐to‐one sessions with health professionals, with three or four visits spread over eight to nine months (Glazener 2001; Wilson 1998). In three trials, the number and duration of contacts with healthcare providers was unknown (Kou 2013; Liu 2011; Wen 2010), although it is possible this was twice per week in the trial that included biofeedback (Kou 2013). Only three trials mention confirmation of correct PFM contraction, being verified by an obstetrician or by the women themselves using self‐palpation, mirror observation of the perineum or mid‐stream urine stoppage (Pelaez 2014; Sangsawang 2016; Wen 2010). In all trials, the control group received usual care that may have included advice or opportunities to do PFMT (e.g. in an antenatal class), with the exception of Sangsawang 2016 where women received usual care but no information on urinary incontinence or PFMT. Four trials provided some adherence data. The women in the trials by Glazener 2001 and Wilson 1998 were supervised individually and performed significantly more voluntary PFM contractions per day at 12 months' postpartum in the PFMT groups. The mean number of contractions was 20 (SD 29) and 86 (95% CI 69 to 104) per day in PFMT women, and 5 (SD 15) and 35 (95% CI 30 to 40) per day in control women. Glazener 2001 followed up women for six years after the index delivery. Similar proportions of women in both groups were doing some PFMT, 50% (132/263) in the intervention group and 50% (127/253) in the control group. The other two trials offered group supervision and reported adherence data for the training groups only. Pelaez 2014 reported that all PFMT women attended at least 80% of the exercise sessions (approximately 70 to 78 in total). In the trial by Sangsawang 2016, it appeared that all women had done PFMT for 28 days (of 42 in total).
-
Fourteen trials did not specify any details of the PFMT received by intervention group (Barakat 2011; Cruz 2014; Dokmeci 2008; Ewings 2005; Fritel 2015; Frost 2014; Frumenzio 2012; Gaier 2010; Hughes 2001; Meyer 2001; Skelly 2004; Sleep 1987; Stothers 2002; Woldringh 2007). Eight of these were conference abstracts (Cruz 2014; Dokmeci 2008; Frost 2014; Frumenzio 2012; Gaier 2010; Hughes 2001; Skelly 2004; Stothers 2002). Four trials mentioned that women were asked to do daily PFMT at home (Fritel 2015; Frumenzio 2012; Hughes 2001; Stothers 2002). One asked women to complete a daily exercise diary (Sleep 1987). Most trials provided one or more one‐to‐one supervisory sessions with a health professional, two invited women to one or two additional group sessions (Ewings 2005; Hughes 2001). Barakat 2011 provided PFMT within approximately 85 exercise classes over the course of pregnancy. Three trials confirmed a correct PFM contraction either by digital palpation or observation and palpation of the perineal body (Fritel 2015; Hughes 2001; Woldringh 2007). The control conditions were: no PFMT (Frumenzio 2012; Meyer 2001; Stothers 2002), usual care (which may or may not have included advice on PFMT) (Frost 2014; Gaier 2010; Hughes 2001; Skelly 2004), usual care that included advice about PFMT (Ewings 2005; Sleep 1987; Woldringh 2007), and PFMT at home (Cruz 2014; Fritel 2015). In two trials, the control condition was unclear (Barakat 2011; Dokmeci 2008). In five of the 14 trials, no information was provided about adherence, or the number of contacts with health professionals in either the intervention or control groups (Cruz 2014; Dokmeci 2008; Frost 2014; Frumenzio 2012; Gaier 2010). All were abstracts. Six of the 14 trials provided some information about exercise behaviour (Barakat 2011; Ewings 2005; Fritel 2015; Hughes 2001; Sleep 1987; Woldringh 2007). Three trials reported adherence data for both the intervention and control groups (Fritel 2015; Sleep 1987; Woldringh 2007). In the trial by Fritel 2015, 69% of women in the PFMT group completed all eight supervised weekly exercise sessions and 83% completed at least one. Fewer women in the PFMT group (4.3%) compared to controls (10.6%) were doing daily exercise at home at the end of pregnancy. Woldringh 2007 reported that 37% of the PFMT women were exercising intensively, compared to 14% of controls, at 36 weeks' gestation. Similarly, at three months' postpartum, Sleep 1987 reported that more women in the PFMT group (58%) compared to controls (42%) were doing some PFMT. The other three trials provided data only for the intervention group (Barakat 2011; Ewings 2005; Hughes 2001). Barakat 2011 reported "adherence to training in the experimental group was 90%" (a mean of 85 sessions in total) and Hughes 2001 (personal communication) observed that 79% of women assigned to PFMT attended the single group training session. In contrast, Ewings 2005 invited PFMT women to attend a class at two and four months postnatally and, of the 117 women, only 18% attended at two months and 4% attended at four months.
Outcome measures
Twenty‐five of the 38 trials clearly stated the primary outcome(s) of interest in the trial.
-
In 17 trials, it was self‐reported urinary incontinence (Assis 2015; Bø 2011; Chiarelli 2002; Cruz 2014; Ewings 2005; Fritel 2015; Glazener 2001; Gorbea 2004; Hilde 2013; Ko 2011; Kou 2013; Mørkved 2003; Pelaez 2014; Reilly 2002; Sangsawang 2016; Skelly 2004; Stafne 2012). Three used the International Consultation on Incontinence Questionnaire‐Short Form (ICIQ‐SF) (Cruz 2014; Fritel 2015; Pelaez 2014).
-
Three trials used loss of urine under stress test (Dumoulin 2004; Kocaoz 2013; Stothers 2002).
-
One trial used the Bristol Female Lower Urinary Tract Symptoms (BFLUTS; 34 question tool, higher score worse) questionnaire, quality of life domain (Kim 2012).
-
One trial combined data from a urinary diary and questionnaire to give an incontinence severity score (Woldringh 2007).
-
One trial used the unspecified "urinary condition score" (Liu 2011).
-
One trial used PFM strength (perineometry) (Ahlund 2013).
-
One trial used the occurrence of traumatic tears and use of episiotomy (Gaier 2010).
While there was some consistency in the choice of outcome measures by trialists, the differences in the measures or the way the data were reported limited the possibilities for combining results from individual trials.
Only three trials reported long‐term results after the first year (Glazener 2001; Mørkved 2003; Reilly 2002).
Excluded studies
Thirty‐eight trials were excluded for the following reasons.
-
Twenty‐eight studies did not collect any urinary or faecal incontinence outcome data (Agur 2005; Assis 2013; Barakat 2014; Barakat 2016; Dias 2011; Domingues 2015; Dougherty 1989; Golmakani 2015; Hou 2010; Huang 2014; Lekskulchai 2014; Li 2010; Liu 2013; Mahmoodi 2014; Morin 2015; NCT01696201; NCT01723293; NCT01753622; Nielsen 1988; Norton 1990; Oblasser 2016; Okido 2015; Perales 2016; Ruiz 2013; Siva 2014; Thorp 1994; Wang 2014; Zhu 2012).
-
Three trials compared the Epi‐No device versus control (Dannecker 2004; Dietz 2014; Kamisan Atan 2016). The women were recruited in very late pregnancy (33 to 37 weeks' gestation) and the primary purpose of the intervention was prevention of perineal trauma. In one trial, it seemed women did PFM contractions with the Epi‐No device in the vagina (Dannecker 2004). However, this was unclear in the other two (Dietz 2014; Kamisan Atan 2016).
-
Four trials included PFMT as part of an intervention but the actual comparisons were: active versus sham magnetic stimulation (Culligan 2005), one type of feedback versus another (Fynes 1999; Mahony 2004), and PFMT plus episiotomy versus caesarean section (Taskin 1996). Another trial compared abdominal exercise with no abdominal exercise (Gouldthorpe 2003).
-
One study was excluded because of internal inconsistencies and data discrepancies (Mason 2010).
-
One trial was listed in a trials register but there was no report of this trial available. There was no response to a letter sent to the principal investigator (Mason 1999).
Risk of bias in included studies
We have provided details for each trial in the Characteristics of included studies. A summary of the risk of bias for each individual trial is presented in Figure 2, while Figure 3 summarises the risk of bias across all trials included in the review.
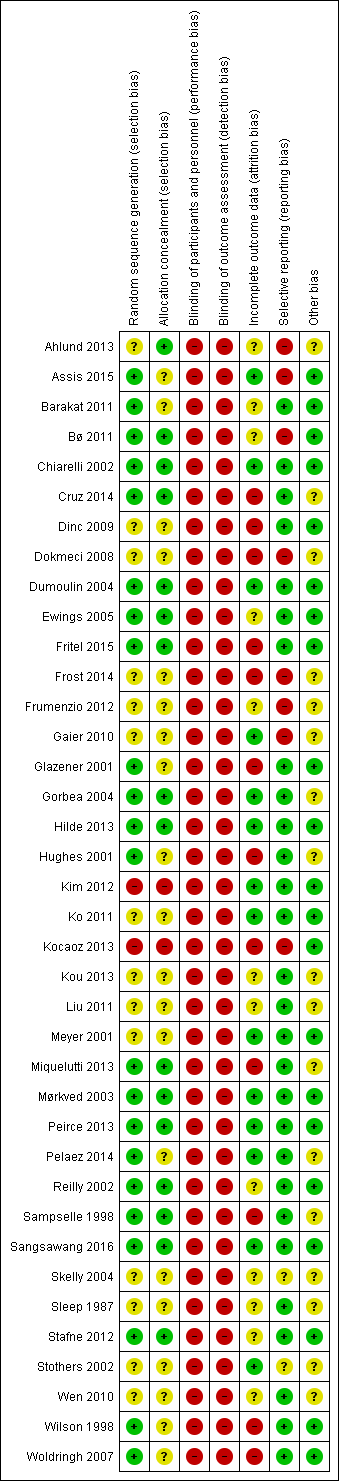
Risk of bias summary: review authors' judgements about each risk of bias item for each included study.
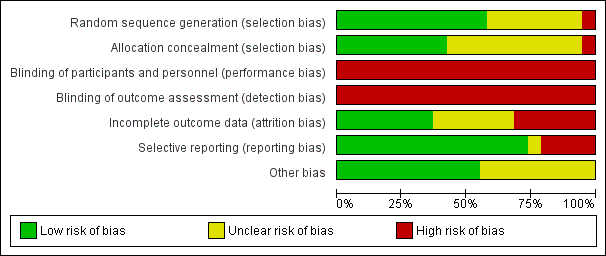
Risk of bias graph: review authors' judgements about each risk of bias item presented as percentages across all included studies.
Due to the brevity of reporting, it was difficult to assess the eight trials that were published as conference abstracts (Cruz 2014; Dokmeci 2008; Frost 2014; Frumenzio 2012; Gaier 2010; Hughes 2001; Skelly 2004; Stothers 2002). In addition, one of these abstracts did not report sample size (Skelly 2004). However, one‐to‐one randomisation was assumed. Three trials were small, with fewer than 25 women per comparison group (Dokmeci 2008; Dumoulin 2004; Kim 2012). Ten were of moderate size, with between 25 and 50 women per group (Ahlund 2013; Assis 2015; Barakat 2011; Cruz 2014; Dinc 2009; Frumenzio 2012; Gorbea 2004; Sampselle 1998; Sangsawang 2016; Stothers 2002). Twenty‐one trials allocated more than 50 women per group (Bø 2011; Chiarelli 2002; Ewings 2005; Fritel 2015; Frost 2014; Gaier 2010; Glazener 2001; Hilde 2013; Hughes 2001; Ko 2011; Kocaoz 2013; Kou 2013; Liu 2011; Meyer 2001; Miquelutti 2013; Mørkved 2003; Pelaez 2014; Reilly 2002; Stafne 2012; Wen 2010; Woldringh 2007). Three of these were large, that is, with more than 300 women per comparison group (Chiarelli 2002; Glazener 2001; Stafne 2012). Two were very large trials of more than 500 women per group (Hughes 2001; Sleep 1987). Peirce 2013 used block randomisation, meaning 30 women were allocated to PFMT and biofeedback and 90 women were included in the PFMT‐only group. Wilson and colleagues randomised just over 100 women to the control and individual treatment groups, with the individual treatment group being further randomised into three groups: PFMT only, PFMT with vaginal cones and vaginal cones only (Wilson 1998).
Twenty‐two of the 38 trials reported an a priori power calculation (Ahlund 2013; Assis 2015; Barakat 2011; Chiarelli 2002; Dinc 2009; Dumoulin 2004; Fritel 2015; Glazener 2001; Gorbea 2004; Hilde 2013; Kim 2012; Ko 2011; Meyer 2001; Miquelutti 2013; Mørkved 2003; Peirce 2013; Pelaez 2014; Reilly 2002; Sangsawang 2016; Sleep 1987; Stafne 2012; Woldringh 2007). One of the trials without a power calculation was a pilot trial (Ewings 2005).
Allocation
Random allocation generation
Twenty‐two trials provided enough information on random allocation generation for us to be reasonably sure that they had a low risk of bias (Assis 2015; Barakat 2011; Bø 2011; Chiarelli 2002; Cruz 2014; Dumoulin 2004; Ewings 2005; Fritel 2015; Glazener 2001; Gorbea 2004; Hilde 2013; Hughes 2001; Miquelutti 2013; Mørkved 2003; Peirce 2013; Pelaez 2014; Reilly 2002; Sampselle 1998; Sangsawang 2016; Stafne 2012; Wilson 1998; Woldringh 2007). Fourteen trials provided insufficient information for a judgement to be made, therefore these trials were at unclear risk of bias (Ahlund 2013; Dinc 2009; Dokmeci 2008; Frost 2014; Frumenzio 2012; Gaier 2010; Ko 2011; Kou 2013; Liu 2011; Meyer 2001; Skelly 2004; Sleep 1987; Stothers 2002; Wen 2010). Two trials were categorised as high risk of bias (Kim 2012; Kocaoz 2013). Kocaoz 2013 used methods suggestive of alternation and Kim 2012 provided participants with an envelope from which they drew one of two cards.
Random allocation concealment
Sixteen studies reported adequate allocation concealment and were at low risk of bias (Ahlund 2013; Bø 2011; Chiarelli 2002; Cruz 2014; Dumoulin 2004; Ewings 2005; Fritel 2015; Gorbea 2004; Hilde 2013; Miquelutti 2013; Mørkved 2003; Peirce 2013; Reilly 2002; Sampselle 1998; Sangsawang 2016; Stafne 2012). Two trials were at high risk of bias, being unable to adequately conceal randomisation (Kim 2012; Kocaoz 2013). The 22 remaining trials were at unclear risk of bias as insufficient information (e.g. not described or stated "randomised") was provided.
Blinding
Blinding of participants and therapists
Given the nature of the intervention, it was not feasible for the included trials to blind the treatment provider or participants to group allocation and so all 38 trials were at high risk of performance bias. The difficulty of blinding exercise‐based interventions is a common problem.
Blinding of outcome assessment
Because the two main outcomes of interest in this review, urinary incontinence and incontinence‐specific quality of life, are self‐reported, these are unblinded measures. As a result, all 38 trials were deemed to be at high risk of detection bias. Blinded outcome assessment should be possible for some secondary outcomes, such as pad testing, and 12 trials attempted this (Bø 2011; Chiarelli 2002; Cruz 2014; Dumoulin 2004; Fritel 2015; Glazener 2001; Hilde 2013; Kim 2012; Mørkved 2003; Reilly 2002; Sampselle 1998; Stothers 2002).
Incomplete outcome data
Reporting of dropout and withdrawal and analysis by intention to treat
Based on the criteria for assessment of attrition bias reported in the methods (see 'Assessment of risk of bias' in Included studies), 10 trials were at low risk of attrition bias (Assis 2015; Chiarelli 2002; Dumoulin 2004; Hilde 2013; Kim 2012; Ko 2011; Meyer 2001; Pelaez 2014; Sangsawang 2016; Stothers 2002). Another 10 were at unclear risk (Ahlund 2013; Barakat 2011; Frumenzio 2012; Kou 2013; Liu 2011; Reilly 2002; Skelly 2004; Sleep 1987; Stafne 2012; Wen 2010). Some trials did not report on losses to follow‐up and were at unclear risk of bias (Bø 2011; Frumenzio 2012; Kou 2013; Liu 2011; Skelly 2004; Wen 2010). Two of these were abstracts (Frumenzio 2012; Skelly 2004). The remaining 12 trials were at high risk. All trials appeared to analyse participants in the groups to which they were assigned.
Selective reporting
All outcomes appeared to have been reported in the majority of trials, with 28 of 38 trials assessed at low risk of bias in this domain. Eight trials were at high risk of bias. Six of these did not report all of the prespecified outcome measures (Ahlund 2013; Assis 2015; Bø 2011; Dokmeci 2008; Frumenzio 2012; Gaier 2010), and, of these, two also did not state the a priori primary outcome measure (Dokmeci 2008; Frumenzio 2012). A further two were at high risk due to not presenting data that related to a key outcome of the review (i.e. self‐reported urinary incontinence) (Frost 2014; Kocaoz 2013). Three of these were conference abstracts (Dokmeci 2008; Frost 2014; Frumenzio 2012). Two trials were at unclear risk of bias as it was uncertain if selective reporting had taken place (Skelly 2004; Stothers 2002).
Other potential sources of bias
From the 38 trials in this review, we considered 21 to be free of problems (such as conflict of interest) that could put them at risk of other bias. We considered the risk of other bias as unclear for 17 trials (Ahlund 2013; Cruz 2014; Dokmeci 2008; Frost 2014; Frumenzio 2012; Gaier 2010; Gorbea 2004; Hughes 2001; Kou 2013; Liu 2011; Miquelutti 2013; Pelaez 2014; Sampselle 1998; Skelly 2004; Sleep 1987; Stothers 2002; Wen 2010).
Effects of interventions
See: Summary of findings for the main comparison Antenatal pelvic floor muscle training compared to control for prevention of urinary and faecal incontinence; Summary of findings 2 Antenatal pelvic floor muscle training compared to control for treatment of urinary and faecal incontinence; Summary of findings 3 Antenatal pelvic floor muscle training compared to control for mixed prevention and treatment of urinary and faecal incontinence; Summary of findings 4 Postnatal pelvic floor muscle training compared to control for treatment of urinary and faecal incontinence; Summary of findings 5 Postnatal pelvic floor muscle training compared to control for mixed prevention and treatment of urinary and faecal incontinence
There were some data available to explore the hypothesis that PFMT is better than usual antenatal and postnatal care, or no treatment, for the prevention or treatment of urinary and faecal incontinence. The primary analysis investigated the prevalence of urinary and faecal incontinence. Data for outcomes of secondary interest (in 'Other data' tables) are only briefly discussed to give an indication of whether the findings were broadly consistent with the pooled data, or not. Thirty‐four trials contributed data to one or more forest plots. The four trials that did not were by Ahlund 2013, Dokmeci 2008, Frost 2014, and Liu 2011.
The 'Summary of findings' tables present the selected outcomes for each of the five main comparisons.
-
Antenatal PFMT compared to control for prevention of urinary and faecal incontinence: summary of findings Table for the main comparison.
-
Antenatal PFMT compared to control for treatment of urinary and faecal incontinence: summary of findings Table 2.
-
Antenatal PFMT compared to control for mixed prevention and treatment of urinary and faecal incontinence: summary of findings Table 3.
-
Postnatal PFMT compared to control for treatment of urinary and faecal incontinence: summary of findings Table 4.
-
Postnatal PFMT compared to control for mixed prevention and treatment of urinary and faecal incontinence: summary of findings Table 5.
Comparison 1: antenatal pelvic floor muscle training for prevention of incontinence
Ten trials reported antenatal PFMT for prevention of incontinence (Barakat 2011; Gaier 2010; Gorbea 2004; Kocaoz 2013; Mørkved 2003; Pelaez 2014; Reilly 2002; Sampselle 1998; Sangsawang 2016; Stothers 2002). Seven recruited nulliparous or primiparous or primigravid women during pregnancy (Gaier 2010; Gorbea 2004; Mørkved 2003; Pelaez 2014; Reilly 2002; Sampselle 1998; Sangsawang 2016). The other three recruited "pregnant women" or both primiparous and multiparous women (Barakat 2011; Kocaoz 2013; Stothers 2002). All women were continent at recruitment.
In all 10 trials, PFMT began during pregnancy. Controls were asked not to do PFMT, did not receive instruction on PFMT, received usual care that might have included information on PFMT, or the control condition was not specified (Barakat 2011; Gaier 2010; Gorbea 2004; Kocaoz 2013; Mørkved 2003; Pelaez 2014; Reilly 2002; Sampselle 1998; Sangsawang 2016; Stothers 2002).
Two of these trials were mixed prevention and treatment trials but published or unpublished data were available for women who were continent at recruitment (Mørkved 2003; Sampselle 1998). In Sampselle 1998, 54/72 women were continent based on a standing stress test at 20 weeks' gestation. After dropouts, there were unpublished data from 37 previously continent women (16 PFMT and 21 controls). Mørkved 2003 published data for 207/301 women who were continent before pregnancy and at 20 weeks' gestation. After dropouts, there were data from 193 previously continent women (94 PFMT and 99 controls). Neither trial was powered to find differences in the previously continent subgroup, as the subgroup sizes were small.
Primary outcome
Self‐reported urinary or faecal incontinence
-
Women randomised to PFMT were about 62% less likely to report urinary incontinence in late pregnancy compared to controls (RR 0.38, 95% CI 0.20 to 0.72; 6 trials, 624 women, random‐effects, I² = 78%, T² = 0.44; low‐quality evidence) (Analysis 1.1).
There was statistically significant heterogeneity in this comparison and in both subgroups (PFMT versus no PFMT, PFMT versus usual care). A random‐effects model was used because of the heterogeneity. Two trials appeared to contribute most to the heterogeneity (Gorbea 2004; Pelaez 2014), and both found many fewer cases of urinary incontinence in the intervention than control groups. Gorbea 2004 was the only trial that specifically asked controls not to do PFMT during pregnancy. In addition, as none of the PFMT women reported urinary incontinence in late pregnancy, the point estimate and CIs were perhaps less stable given there were no events in one of the two comparison groups. In Pelaez 2014, the PFMT was very intensive and of longer duration than other trials in the same subgroup. The intervention included three supervised exercise classes per week for at least 22 weeks and 80% of women attended the maximum number of classes.
-
PFMT women were about 62% less likely to report urinary incontinence, compared to controls, in the early postpartum period (RR 0.38, 95% CI 0.17 to 0.83; 5 trials, 439 women, random‐effects, I² = 74%, T² = 0.55) (Analysis 1.2). There was statistically significant heterogeneity in this comparison, as well as in one subgroup (PFMT versus usual care), which included the trial by Pelaez 2014 (see above).
-
PFMT women were still less likely than controls to have urinary incontinence in the mid‐postnatal period (three to six months), although the difference in risk had reduced to 29% (RR 0.71, 95% CI 0.54 to 0.95; 5 trials, 673 women, fixed‐effect, I² = 0%; moderate‐quality evidence) (Analysis 1.3). Overall, the pooled estimate favoured PFMT.
-
There were not enough participants (44 women; low‐quality evidence) in the trial by Sampselle 1998 to identify whether there was a difference in prevalence of urinary incontinence between PFMT women and women in the control group at 12 months' postpartum (RR 1.20, 95% CI 0.65 to 2.21) (Analysis 1.4).
Two trials measured incontinence at greater than five years (Mørkved 2003; Reilly 2002; seeTable 1 ). The pooled data suggested that the earlier effectiveness of PFMT did not persist in the long term (RR 1.07, 95% CI 0.77 to 1.48; 2 trials, 352 women, fixed‐effect, I² = 25%) (Analysis 1.6). Reilly 2002 found that 68.4% of women randomised to the intervention group were still performing PFMT, with 38% doing PFMT at least twice per week after eight years. Mørkved 2003 reported that the same number of women in the PFMT and control groups (45%) were exercising at least weekly, six years after the primary study. The lack of a difference in prevalence rates of incontinence in these three trials suggests that perhaps PFMT is not effective in the long term. There could be three immediately plausible explanations for this. The women may have stopped exercising, they may have had subsequent pregnancies or, as shown by Mørkved 2003, women were performing similar PFMT regimens regardless of which group they had initially been randomised.
None of the 10 trials reported data on the prevalence of either antenatal or postpartum faecal incontinence.
Incontinence‐specific quality of life
Reilly 2002 (King's Health Questionnaire) and Pelaez 2014 (ICIQ‐SF) were the only two trials to mention incontinence‐specific quality of life. Pelaez 2014 found a difference between the two groups in favour of PFMT (MD ‐2.42, 95% CI ‐3.32 to ‐1.52; 2 trials, 152 women; moderate‐quality evidence) (Analysis 1.13; lower score indicates better incontinence‐specific quality of life). Reilly 2002 did not report their data but stated there was no difference between the groups on any of the eight subscales (Analysis 1.14).
Secondary outcomes
Severity of incontinence
Seven of the 10 trials reported some data on symptom severity, such as frequency or amount of urine leakage (Analysis 1.14) (Barakat 2011; Gorbea 2004; Pelaez 2014; Reilly 2002; Sampselle 1998; Sangsawang 2016; Stothers 2002). The choice of measures (many of these of unknown validity) or the ways of reporting these were highly variable and data reporting was often incomplete. Two of the most recent trials used individual item scores from the ICIQ‐SF; frequency (item 3) and amount of leakage (item 4) (Barakat 2011; Pelaez 2014). There was a consistent pattern of effect in favour of PFMT, when compared to usual care, for frequency, amount and other urinary incontinence severity indices in two trials (Pelaez 2014; Sangsawang 2016).
Number of urinary or faecal incontinence episodes
None of the trials reported number of urinary or faecal incontinence episodes.
Loss of urine under stress test
Three trials reported whether women were continent or not based on a stress test (positive cough or one‐hour pad test) (Gorbea 2004; Kocaoz 2013; Reilly 2002). Women in the PFMT group were less likely to be incontinent in late pregnancy (RR 0.36, 95% CI 0.19 to 0.70; 1 trial, 102 women) or in the early postnatal period (RR 0.09, 95% CI 0.02 to 0.47; 2 trials, 174 women, fixed‐effect, I² = 0%) when compared with no treatment controls (Analysis 1.15; Analysis 1.16) (Gorbea 2004; Kocaoz 2013). There was no difference between PFMT versus usual care groups in the early postnatal period (RR 0.88, 95% CI 0.33 to 2.29; 1 trial, 148 women) (Analysis 1.16) (Reilly 2002). Two trials used the SF‐36 (Barakat 2011; Reilly 2002). In the general health domain, Reilly 2002 reported that the PFMT group scored significantly higher than the control group at three months' postpartum (MD 7.2, 95% CI 2.36 to 12.04), while Barakat 2011 found that women in the PFMT group were more likely to rate their health as very good (18/34 women in the PFMT group versus 9/33 women in the control group) (Analysis 1.17).
Other quality of life and health status measures
None of the trials reported other quality of life and health status measures.
Health economics
None of the trials reported health economic data.
Adverse effects
Only one trial noted any adverse events: two of 43 PFMT women withdrew due to pelvic floor pain (Stothers 2002). Barakat 2011 stated "there were no exercise‐related injuries experienced during pregnancy." No other trial reported whether there were adverse effects or not.
Other outcomes
Pelvic floor muscle function
Three trials measured PFM function (Gaier 2010; Gorbea 2004; Reilly 2002). However, Gaier 2010 reported no data. Measures were electromyography and vaginal squeeze pressure (Gorbea 2004; Reilly 2002). The lack of explanation of the type of electromyography and unusual presentation of the data in Gorbea 2004 made it difficult to interpret the findings. In Reilly 2002, mean vaginal squeeze pressure was not greater in the PFMT group than the control group (MD 1.00, 95% CI ‐1.31 to 3.31) (Analysis 1.18). Gaier 2010 reported significantly higher PFM strength in women doing PFMT. However, it was unclear how this was measured and the data were not given in the conference abstract.
Delivery outcome
Five trials reported delivery outcome (Barakat 2011; Gaier 2010; Gorbea 2004; Reilly 2002; Stothers 2002). However, the data by Stothers 2002 were not reported by group. Three trials reported the number of caesarean sections (Barakat 2011; Gorbea 2004; Reilly 2002). There was no difference between PFMT and control groups in any of these trials (RR 1.28, 95% CI 0.89 to 1.85; 3 trials, 373 women, fixed‐effect, I² = 49%) (Analysis 1.19). Two trials reported type of vaginal delivery (normal or instrumental) (Barakat 2011; Reilly 2002). Two trials reported perineal trauma (Barakat 2011; Gaier 2010). There were no apparent differences between groups for either outcome (Analysis 1.20).
Any other outcome not prespecified but of interest
None of the trials reported any other outcomes not prespecified but of interest.
Comparison 2: antenatal pelvic floor muscle training for treatment of incontinence
Four trials reported antenatal PFMT for treatment of incontinence (Cruz 2014; Dinc 2009; Skelly 2004; Woldringh 2007). Two trials recruited primiparous and multiparous women (Dinc 2009; Woldringh 2007). Two trials reported as abstracts did not state parity (Cruz 2014; Skelly 2004). In all four trials, the control group received usual care.
Primary outcome
Self‐reported urinary or faecal incontinence
-
There was no difference in prevalence of urinary incontinence in late pregnancy (RR 0.70, 95% CI 0.44 to 1.13; 3 trials, 345 women, random‐effects, I² = 71%, T² = 0.11; very low‐quality evidence) (Analysis 2.1).
This comparison showed statistically significant heterogeneity; a random‐effects model was used to provide a more conservative estimate (Analysis 2.1).
-
There were no differences in the early postnatal period (RR 0.75, 95% CI 0.37 to 1.53; 2 trials, 292 women, random‐effects, I² = 65%, T² = 0.19) or mid‐postnatal period (RR 0.94, 95% CI 0.70 to 1.24; 1 trial, 187 women; very low‐quality evidence) (Analysis 2.2; Analysis 2.3).
-
Two trials measured urinary incontinence in the late postnatal period. A random‐effects model was used because of statistically significant heterogeneity in this comparison and there was no difference between groups (RR 0.50, 95% CI 0.13 to 1.93; 2 trials, 869 women, random‐effects, I² = 94%, T² = 0.89; very low‐quality evidence) (Analysis 2.4) (Skelly 2004; Woldringh 2007). Skelly 2004 was available only as a conference abstract with limited data on which to base a risk of bias assessment and about half of the women randomised appeared to have urinary incontinence symptoms pre‐pregnancy. In Woldringh 2007, at 35 weeks' gestation, about two‐thirds of women in the control group were doing some form of PFMT, compared to 94% in the PFMT group. These, or other unknown reasons, could have contributed to the observed heterogeneity.
None of the four trials reported data on the prevalence of either antenatal or postpartum faecal incontinence.
Incontinence‐specific quality of life
Two trials used a validated incontinence‐specific quality of life measure (Cruz 2014, ICIQ‐SF; Woldringh 2007, IIQ). Cruz 2014 found a better quality of life in PFMT women in late pregnancy (MD ‐3.50, 95% CI ‐6.13 to ‐0.87; 1 trial, 41 women, low‐quality evidence) (Analysis 2.14; lower score better). Woldringh 2007 categorised IIQ scores, which meant that it was not possible to interpret these data (Analysis 2.15).
Secondary outcomes
Severity of incontinence
Woldringh 2007 reported on leakage severity, but the validity of this measure is unknown (Analysis 2.16).
Number of urinary or faecal incontinence episodes
None of the trials reported number of urinary or faecal incontinence episodes.
Loss of urine under stress test
None of the trials reported loss of urine under stress test.
Other quality of life and health status measures
None of the trials reported other quality of life and health status measures.
Health economics
None of the trials reported health economic data.
Adverse effects
None of the trials reported on adverse effects.
Other outcomes
Pelvic floor muscle function
Cruz 2014 found no difference between the groups in maximal vaginal squeeze pressure in the third trimester (Analysis 2.17).
Comparison 3: antenatal pelvic floor muscle training for mixed prevention and treatment of incontinence
Eleven trials reported antenatal PFMT for mixed prevention and treatment of incontinence (Assis 2015; Bø 2011; Dokmeci 2008; Fritel 2015; Frumenzio 2012; Hughes 2001; Ko 2011; Miquelutti 2013; Mørkved 2003; Sampselle 1998; Stafne 2012). The control group consisted of usual care in seven trials (Bø 2011; Fritel 2015; Hughes 2001; Miquelutti 2013; Mørkved 2003; Sampselle 1998; Stafne 2012). There was no PFMT in two trials (Assis 2015; Ko 2011). Two did not specify the control group (Dokmeci 2008; Frumenzio 2012).
Nine trials were in women who were delivering their first baby (Assis 2015; Bø 2011; Dokmeci 2008; Fritel 2015; Hughes 2001; Ko 2011; Miquelutti 2013; Mørkved 2003; Sampselle 1998). One recruited both primiparous and multiparous women (Stafne 2012). Parity was not stated in Frumenzio 2012, which was an abstract.
Primary outcome
Self‐reported urinary or faecal incontinence
-
Women randomised to PFMT had about 26% less risk of urinary incontinence in late pregnancy (RR 0.74, 95% CI 0.61 to 0.90; 9 trials, 3164 women, random‐effects, I² = 82%, T² = 0.06; low‐quality evidence) (Analysis 3.1).
There was statistically significant heterogeneity in both subgroups (PFMT versus no exercise and PFMT versus usual care) in this comparison (Analysis 3.1). The point estimates favoured PFMT in all but two trials (Bø 2011; Fritel 2015). In the seven trials where the point estimates favoured PFMT, there was considerable variation with RR ranging from 0.07 to 0.93 (Assis 2015; Hughes 2001; Ko 2011; Miquelutti 2013; Mørkved 2003; Sampselle 1998; Stafne 2012). The data that appeared notably different, being markedly in favour of PFMT, were those from Assis 2015 for reasons unknown, although this was one of two trials in which controls were asked not to do PFMT. In the two trials where the point estimates did not favour PFMT, there were plausible explanations for no differences between the two groups. Participants in Bø 2011 were encouraged to attend at least two out of three possible exercise classes every week. These exercise classes were led by general fitness instructors who were taught by a physiotherapist how to deliver PFMT to women. It may be that the women in this trial considered the classes solely as general fitness and did not concentrate on the PFMT component. In Fritel 2015, the authors reported that at the end of pregnancy there was no difference in the frequency and duration of PFMT between groups, suggesting no difference in exercise adherence between the PFMT and usual care groups.
-
There was a difference in the prevalence of urinary incontinence between antenatal PFMT and control groups in the early postnatal (RR 0.80, 95% CI 0.67 to 0.95; 5 trials, 760 women, fixed‐effect, I² = 0%, T² = 0.00) (Analysis 3.2) and mid‐postnatal periods (RR 0.73, 95% CI 0.55 to 0.97; 5 trials, 1921 women, random‐effects, I² = 65%, T² = 0.06; very low‐quality evidence) (Analysis 3.3), but not in the late postnatal period (RR 0.85, 95% CI 0.63 to 1.14; 2 trials, 244 women, fixed‐effect, I² = 0%; low‐quality evidence) (Analysis 3.4).
In the mid‐postnatal period, while all the point estimates favoured PFMT, these varied considerably between the trials (RRs of 0.42 to 0.97). In the one trial with long‐term data (six years), Mørkved 2003, there was no difference between groups (RR 1.38, 95% CI 0.77 to 2.45; 1 trial, 188 women) (Analysis 3.6). Women in the control group were offered a description of the PFMT programme after the post‐treatment comparison and this and other events (such as subsequent births) may have contributed to a lack of difference.
Two trials collected data on faecal incontinence in late pregnancy (Bø 2011; Stafne 2012). Bø 2011 also reported on faecal incontinence in the early postnatal period. There were no differences between PFMT and usual care groups at either time‐point (late pregnancy: RR 0.61, 95% CI 0.30 to 1.25; 2 trials, 867 women, fixed‐effect; moderate‐quality evidence; early postnatal: RR 0.36, 95% CI 0.04 to 3.37; 1 trial, 90 women) (Analysis 3.7; Analysis 3.8).
Incontinence‐specific quality of life
Four trials used a validated incontinence‐specific quality of life measure (Fritel 2015, ICIQ‐SF and Contilife (higher score better); Dokmeci 2008; Ko 2011, IIQ‐7; Hughes 2001, BFLUTS questionnaire). Fritel 2015 (ICIQ‐SF) found no difference in incontinence‐specific quality of life between PFMT and usual care groups at any of three time points (late pregnancy, early and late (late: MD ‐0.20, 95% CI ‐1 to 0.81; 190 women, low‐quality evidence) postnatal periods) (Analysis 3.13; Analysis 3.14; Analysis 3.15). However, all point estimates were in favour of the PFMT group. The two trials that reported IIQ‐7 scores had contrasting findings. Ko 2011 found better quality of life in the PFMT group at each of three time points (late pregnancy, early and mid‐postnatal) compared to no PFMT, whereas Dokmeci 2008 stated there were no "statistically significant" differences in late pregnancy or early postpartum (no data provided) between PFMT and unspecified controls (Analysis 3.18). The overall score in the trial by Hughes 2001 was not reported.
Secondary outcomes
Severity of incontinence
Two trials reported some data on symptom severity, such as frequency or amount of urine leakage. None of the data suggested that PFMT was superior to control, or vice versa, at the primary endpoint of either three months' postpartum (Hughes 2001) or 12 months' postpartum (Sampselle 1998).
Number of urinary or faecal incontinence episodes
None of the trials reported number of urinary or faecal incontinence episodes.
Loss of urine under stress test
The single trial reporting pad test data (24 hour) found no difference between PFMT and usual care groups (Analysis 3.17) (Fritel 2015).
Other quality of life and health status measures
Other quality of life and health status measures included:
-
Urogenital Distress Index‐Short Form (UDI‐6) (Dokmeci 2008; Ko 2011);
-
Female Pelvic Floor questionnaire (bladder, bowel, prolapse and sex scores; Fritel 2015);
-
Pelvic Organ Prolapse/Urinary Incontinence Sexual Questionnaire (PISQ; higher score better) (Dokmeci 2008);
-
State Trait Anxiety Inventory (Miquelutti 2013);
-
Psychological General Wellbeing Index (Stafne 2012);
-
Euro‐QoL‐5D (Fritel 2015; higher score better).
There were no differences between groups for these other measures of well‐being (Analysis 3.18).
Three trials measured some aspect of sexual function in pregnancy, immediately postpartum and up to six years post‐index delivery (Dokmeci 2008; Fritel 2015; Mørkved 2003). Overall, there was no difference in sexual function or the proportion of women who were sexually active in late pregnancy and up to 12 months' postpartum (Dokmeci 2008; Fritel 2015). At six years, Mørkved 2003 found that PFMT women were twice as likely to report sexual satisfaction compared to controls (Analysis 3.18).
Health economics
None of the trials reported health economic data.
Adverse effects
Two trials reported no adverse effects (Fritel 2015; Miquelutti 2013).
Other outcomes
Pelvic floor muscle function
PFM function was measured using perineometry, electromyography and digital palpation (Assis 2015; Dokmeci 2008; Fritel 2015; Mørkved 2003). In the three trials that reported data, point estimates favoured PFMT women over controls (Assis 2015; Fritel 2015; Mørkved 2003). There were differences in favour of PFMT in both trials that measured vaginal squeeze pressures (Analysis 3.19) (Assis 2015; Mørkved 2003).
Delivery outcome
Six trials reported the number of caesarean sections, with no difference between groups (RR 0.95, 95% CI 0.79 to 1.14; 6 trials, 1899 women, fixed‐effect, I² = 25%, T² = 0.00) between PFMT and control groups (Analysis 3.20) (Bø 2011; Fritel 2015; Ko 2011; Miquelutti 2013; Mørkved 2003; Stafne 2012). Mørkved 2003 found no difference in the type of delivery, although women in the supervised antenatal PFMT group had a shorter second stage of labour. However, it is worth noting that fetal head circumference was also smaller in the PFMT group. Ko 2011 also reported rates of episiotomy among women and there was no difference between the groups (RR 0.86, 95% CI 0.53 to 1.39).
Participant satisfaction and further treatment
Fritel 2015 reported no difference between the groups in the proportion of women who wanted further supervised training at 12 months' postpartum, or in the number of medical visits since delivery between the PFMT and usual care groups (Analysis 3.22).
Comparison 4: postnatal pelvic floor muscle training for treatment of incontinence
Five trials reported postnatal PFMT for treatment of incontinence and provided supervised PFMT beginning at three or more months' postpartum as treatment for women with persistent urinary incontinence symptoms after delivery (Ahlund 2013; Dumoulin 2004; Glazener 2001; Kim 2012; Wilson 1998). The control group received usual care or were asked not to do PFMT (Ahlund 2013; Dumoulin 2004; Glazener 2001; Kim 2012; Wilson 1998).
Primary outcome
Self‐reported urinary or faecal incontinence
-
Women randomised to PFMT were about 22% less likely to have urinary incontinence after treatment compared to controls more than six and up to 12 months postdelivery (RR 0.78, 95% CI 0.69 to 0.87; 3 trials, 696 women, fixed‐effect). However, there was statistical heterogeneity in this comparison (I² = 90%) and when the more conservative random‐effects model was used there was no difference (RR 0.55, 95% CI 0.29 to 1.07; 696 women, I² = 90%, T² = 0.30; very low‐quality evidence) (Analysis 4.3).
Women in all three studies were recruited at three months or more postpartum. In the case of Dumoulin 2004, women were recruited after completing an incontinence questionnaire at their annual gynaecological visit, so it seems likely many were much more than three months' postpartum at trial entry. Therefore, after a further two months' intervention, it seemed likely the postintervention outcome was between six and 12 months' postdelivery for most. For this reason, a decision was made to present the data from the trial in the late postnatal category (greater than six to 12 months) along with that from Glazener 2001 and Wilson 1998, who both measured outcome 12 months postdelivery.
In addition to possible differences in timing of outcome measurement, there were other obvious dissimilarities between the three studies. In Dumoulin 2004, women randomised to the control group were specifically asked not to do any PFMT, while women in the control group in Glazener 2001 and Wilson 1998 received usual postnatal care and some did PFMT. Glazener 2001 reported a mean of 20 PFM contractions every day in the PFMT group versus five PFM contractions every day in the control group. A total of 86 (PFMT) versus 35 (control) were performed in the trial by Wilson 1998. The second difference was that Dumoulin 2004 employed a strengthening PFMT regimen which incorporated electrical stimulation and biofeedback, while participants also had weekly contact with a physiotherapist for eight weeks. In contrast, Glazener 2001 and Wilson 1998 did not clearly aim their PFMT regimens at either strength or endurance and in both studies the intervention group had three or four contacts with health professionals over a six‐month period.
Glazener 2001 reported urinary incontinence prevalence at six years (RR 0.96, 95% CI 0.88 to 1.05; 1 trial, 516 women) and 12 years after the index delivery (RR 1.03, 95% CI 0.94 to 1.12; 1 trial, 471 women), with no difference between PFMT and control group at either time‐point (Analysis 4.5; Analysis 4.6).
Two trials reported data on the prevalence of faecal incontinence one year after delivery (Glazener 2001; Wilson 1998). There was statistically significant heterogeneity, therefore a random‐effects model was used to give a more conservative estimate of effect (RR 0.68, 95% CI 0.24 to 1.94, random‐effects, I² = 74%, T² = 0.42; 2 trials, 620 women; very low‐quality evidence) (Analysis 4.9).
Glazener 2001 reported no difference in the prevalence of faecal incontinence at six years (RR 0.95, 95% CI 0.60 to 1.50; 509 women) and 12 years (RR 1.36, 95% CI 0.84 to 2.22; 1 trial, 468 women) post‐index delivery (Analysis 4.11; Analysis 4.12). At both these time points, Glazener 2001 reported that about 50% of women in both the intervention and control groups were doing "any" PFMT. When questioned about performing daily PFMT, it was interesting to note that only 6% of the PFMT group were exercising daily, compared to 12% of the control group at six years' follow‐up. After 12 years, 7% of the intervention group and 8% of the control group were performing daily PFMT (Table 1).
Incontinence‐specific quality of life
Two trials used incontinence‐specific quality of life measures (Dumoulin 2004: IIQ and UDI; Kim 2012: BFLUTS). Kim 2012 found no difference between PFMT and usual care groups post‐treatment (MD ‐1.66, 95% CI ‐3.51 to 0.19; 18 women) (Analysis 4.13). Dumoulin 2004 reported an improvement in IIQ and UDI score in women who were doing PFMT compared with women who were randomised to the control (no PFMT) group (Analysis 4.15).
Secondary outcomes
Severity of incontinence
All five treatment trials reported some data on incontinence severity, for instance frequency or amount of urine leakage. None of the measures, or the methods of reporting these, were common to the five trials. The data suggest that women randomised to PFMT with symptoms of urinary incontinence might have had less severe symptoms than women in the control groups but this was not a consistent or clear‐cut finding (Analysis 4.14).
Number of urinary or faecal incontinence episodes
None of the trials reported number of urinary or faecal incontinence episodes.
Loss of urine under stress test
None of the trials reported loss of urine under stress test.
Other quality of life and health status measures
Glazener 2001 used the Hospital Anxiety and Depression Scale to measure quality of life and found reduced anxiety in the PFMT group (Analysis 4.15).
Health economics
None of the trials reported health economic data.
Adverse effects
Dumoulin 2004 stated that none of the women in the PFMT group reported any adverse events (with PFMT or electrical stimulation).
Other outcomes
Pelvic floor muscle function
One trial measured PFM function using a dynamometer and three trials reported vaginal squeeze pressure (Ahlund 2013; Dumoulin 2004; Kim 2012; Wilson 1998). Dynamometer findings favoured the PFMT group, as did the vaginal squeeze pressure readings in two trials (Analysis 4.16) (Ahlund 2013; Dumoulin 2004; Kim 2012).
Any other outcome not prespecified but of interest
Wilson 1998 noted that the mean time to teach PFMT to the intervention group was 32 minutes (95% CI 30 to 34) but no further economic analysis was reported (Table 1).
Comparison 5: postnatal pelvic floor muscle training for mixed prevention and treatment of incontinence
Ten trials reported postnatal PFMT for mixed prevention and treatment of incontinence (Chiarelli 2002; Ewings 2005; Frost 2014; Hilde 2013; Kou 2013; Liu 2011; Meyer 2001; Peirce 2013; Sleep 1987; Wen 2010). These randomised women to postnatal PFMT versus usual care with the exception of one, in which the controls were asked to do no exercise (Meyer 2001). The trials recruited previously nulliparous women during their first pregnancy (Meyer 2001), women having their first baby (Hilde 2013; Liu 2011; Peirce 2013), or postnatal women of mixed parity (Chiarelli 2002; Ewings 2005; Sleep 1987). Three trials did not report this information (Frost 2014; Kou 2013; Wen 2010).
Primary outcome
Self‐reported urinary or faecal incontinence
The only information from the early postnatal period was from Frost 2014, a conference abstract. This trial did not contribute any data to the review but the authors stated that there were no significant differences in "urinary symptoms" at six to eight weeks' postpartum between the PFMT and control (usual care) groups.
There was no difference in the prevalence of urinary incontinence in women randomised to postnatal PFMT or control group in the:
-
mid‐postnatal period, up to six months (RR 0.95, 95% CI 0.75 to 1.19, random‐effects, I² = 65%, T² = 0.04; 5 trials, 2800 women) (Analysis 5.2) or
-
late postnatal period, more than six to 12 months (RR 0.88, 95% CI 0.71 to 1.09, fixed‐effect, I² = 50%, T² = 0.00; 3 trials, 826 women; very low‐quality evidence) (Analysis 5.3).
There was statistically significant heterogeneity in both comparisons. There was no detail of the PFMT programmes in three of the five trials contributing data to the mid‐postnatal comparison (Ewings 2005; Meyer 2001; Sleep 1987). In addition, there were other notable dissimilarities, including the risk profile of the recruited population (e.g. Chiarelli 2002) and the degree of contrast between PFMT and control groups in exercise supervision and prescription (e.g. Sleep 1987, low contrast; Kou 2013, high contrast). In the two trials with findings in favour of PFMT, the control groups were offered usual care, while the PFMT interventions were intensively supervised or enhanced with application of health behaviour theory (Chiarelli 2002; Kou 2013). In addition, Chiarelli 2002 recruited women who were at potentially increased risk of postnatal incontinence, such as those who had a large baby or a forceps delivery.
There was considerably less difference in PFMT and control groups in the other three trials for various reasons and none found a difference between the groups. All control groups received usual postnatal care that may have or did include information about PFMT. Ewings 2005 reported that 114/117 women randomised to PFMT received one‐to‐one instruction on PFMT but only 21 attended one group class, with five attending both available classes. There was no difference between groups. Hilde 2013 randomised women to PFMT delivered in a weekly exercise class plus home exercise, versus a home exercise control condition. Both groups had a correct PFM contraction confirmed prior to training. Sleep 1987 randomised women within 24 hours of delivery to an individual daily session with a midwife co‐ordinator while in hospital and home exercise, versus usual care that included postnatal classes taken by an obstetric physiotherapist. At three months' postpartum, the proportion of women doing PFMT was reasonably similar (58% with PFMT and 42% with control).
Chiarelli 2002 and Kou 2013 also contributed data to the late postpartum comparison with the addition of that from Meyer 2001. Women in the study by Meyer 2001 were randomised to either eight months of supervised PFM rehabilitation with a physiotherapist or no PFMT. Like Kou 2013, there was a high degree of contrast between the PFMT and control groups. However, unlike Kou 2013, Meyer 2001 found no difference between groups in the prevalence of urinary incontinence. Neither of these trials reported details of their randomisation procedures.
Two trials reported the prevalence of postnatal faecal incontinence (Meyer 2001; Sleep 1987). Neither demonstrated a difference between PFMT and control groups (at more than six to 12 months: RR 0.73, 95% CI 0.13 to 4.21; 1 trial, 107 women; very low‐quality evidence) (Analysis 5.6; Analysis 5.7; Analysis 5.8).
Incontinence‐specific quality of life
One of the 10 trials reported incontinence‐specific quality of life data, with no differences between PFMT and controls for faecal incontinence (Analysis 5.10; Analysis 5.13; Peirce 2013).
Secondary outcomes
Severity of incontinence
Four trials reported some data on symptom severity (Hilde 2013; Liu 2011; Sleep 1987; Wen 2010).
At three months' postpartum, Sleep 1987 found no difference between the groups in frequency of leakage or the number of women using absorbent pads (often or always), whereas Liu 2011 reported less severe urinary incontinence (unspecified measure) in the PFMT group (Analysis 5.11).
Number of urinary or faecal incontinence episodes
None of the trials reported number of urinary or faecal incontinence episodes.
Loss of urine under stress test
At six months' postpartum, Hilde 2013 found no difference between the groups for amount of leakage on pad test and the results for unspecified urinary incontinence severity were inconsistent (Liu 2011; Wen 2010). Pooled data from two studies found no difference in the risk of positive pad test between PFMT compared to usual care (RR 0.96, 95% CI 0.58 to 1.57; 2 trials, 85 women, fixed‐effect, I² = 0%) (Analysis 5.12) (Hilde 2013; Wen 2010). At 12 months, unspecified urinary incontinence severity was less in the PFMT group compared to usual care and fewer women in the PFMT groups had a positive pad test (Wen 2010).
Other quality of life and health status measures
Two trials measured some aspect of sexual function (Meyer 2001; Sleep 1987). Meyer 2001 noted fewer women in the PFMT group reported a diminished vaginal sexual response at 10 months' postpartum, while Sleep 1987 found no difference between groups in the proportion of women who had attempted or had pain with sexual intercourse at three months' postpartum (Analysis 5.13).
Health economics
None of the trials reported health economic data.
Adverse effects
Two trials collected data on adverse events, with none reported in either group or in those using biofeedback as an adjunct to PFMT (Hilde 2013; Peirce 2013).
Other outcomes
Pelvic floor muscle function
Two studies measured PFM function using the Oxford scale (Liu 2011; Wen 2010). The outcomes at three, six and 12 months' postpartum were in favour of the PFMT group compared to usual care. Three trials assessed vaginal squeeze pressure at six, 10 and 12 months' postpartum and found no difference between the groups (Hilde 2013; Kou 2013; Meyer 2001). Two trials measured anal pressure, in cm of water (Meyer 2001) or mmHg (Peirce 2013), and neither found a difference between PFMT and control groups (Analysis 5.14).
Any other outcome not prespecified but of interest
One trial measured pelvic organ prolapse symptoms at six months' postpartum and found no difference between the groups (Analysis 5.15) (Hilde 2013).
Discusión
Esta revisión considera si el EMPP (tal como lo definieron los investigadores) es mejor que la atención prenatal o postnatal habitual para la prevención y el tratamiento de la incontinencia urinaria y fecal en las mujeres que parieron. Otra revisión sistemática Cochrane abordó una pregunta similar (si el EMPP era mejor que ningún tratamiento, placebo o tratamientos de control inactivos) en las pacientes con incontinencia urinaria (Dumoulin 2014). Esta revisión excluyó específicamente los ensayos que incorporaron a pacientes antes o después del parto.
Resumen de los resultados principales
¿El entrenamiento muscular del suelo pelviano es mejor que la atención prenatal o posnatal habitual para la prevención y el tratamiento de la incontinencia urinaria y fecal?
Hay tres maneras posibles de proporcionar las intervenciones de EMPP a las pacientes durante el embarazo y en el período después del parto. La primera manera es proporcionar el EMPP a mujeres que no tienen síntomas cuando se comienza el EMPP (es decir, prevención). La segunda es prescribir el EMPP a las pacientes que ya han presentado síntomas de incontinencia (es decir, tratamiento). La tercera es proporcionar el EMPP a todas las mujeres independientemente de si presentan síntomas de incontinencia urinaria o no cuando se comienza el EMPP (es decir, enfoque mixto de prevención y tratamiento). Las comparaciones se establecieron dentro de las tres poblaciones de pacientes siguientes.
-
Mujeres sin incontinencia cuando se asignaron al azar a los grupos de intervención, o sea, estudios de prevención.
-
Pacientes con incontinencia cuando se asignaron al azar, o sea, estudios de tratamiento.
-
Ensayos que incluyeron una población mixta, o sea, algunas mujeres sin incontinencia y algunas con incontinencia cuando se asignaron al azar.
Prevención primaria o secundaria de la incontinencia
Los datos resumidos de seis ensayos indicaron que el EMPP durante el embarazo disminuyó la incontinencia urinaria en la última etapa del embarazo en comparación con la atención habitual (CR 0,38; IC del 95%: 0,20 a 0,72; 624 mujeres; evidencia de baja calidad). Entre tres meses y hasta seis meses después del parto (período posnatal medio), los datos resumidos de cinco ensayos indicaron que el EMPP disminuyó la prevalencia de la incontinencia urinaria en comparación con la atención habitual (CR 0,71; IC del 95%: 0,54 a 0,95; 673 mujeres; evidencia de calidad moderada). Solo con los datos de subgrupos de un ensayo pequeño con 72 mujeres, hubo muy pocos datos a partir de los seis meses y hasta un año después del parto (período posnatal tardío) para hacer observaciones significativas (Sampselle 1998). Un ensayo único con 152 mujeres indicó que el EMPP probablemente mejoró la calidad de vida asociada con la incontinencia en la última etapa del embarazo en comparación con la atención habitual (ICIQ‐SF: DM ‐2,42; IC del 95%: ‐3,32 a ‐1,52; evidencia de calidad moderada) (Pelaez 2014). Ninguno de los ensayos informó datos sobre la incontinencia fecal en la última etapa del embarazo, ni en el período posnatal medio y tardío (Resumen de los hallazgos para la comparación principal).
Dos ensayos realizaron un seguimiento a largo plazo de las participantes a los ocho y seis años y no encontraron diferencias entre los grupos de EMPP y control (Análisis 1.6) (Mørkved 2003; Reilly 2002).
Tratamiento de la incontinencia
La incertidumbre acerca de los efectos del EMPP para el tratamiento de la incontinencia urinaria en pacientes antes y después del parto se señala más adelante. La incertidumbre surgió de la falta de precisión en la estimación agrupada del efecto; los IC para el resumen estadístico generalmente fueron amplios e incluyeron el efecto nulo.
Según los datos resumidos de tres ensayos, no está claro si el EMPP disminuyó la incontinencia urinaria existente en la última etapa del embarazo en comparación con la atención habitual (CR 0,70; IC del 95%: 0,44 a 1,13; 345 mujeres; evidencia de muy baja calidad). De manera similar, no está claro si el EMPP para tratar la incontinencia urinaria prenatal redujo la incontinencia urinaria en el período posnatal medio (CR 0,94; IC del 95%: 0,70 a 1,24; un ensayo, 187 mujeres; evidencia de muy baja calidad) o tardío (CR 0,50; IC del 95%: 0,13 a 1,93; dos ensayos, 869 mujeres; evidencia de muy baja calidad). Los datos de un ensayo único con 41 mujeres indicaron que el EMPP puede haber mejorado la calidad de vida asociada con la incontinencia en la última etapa del embarazo en comparación con la atención habitual (ICIQ‐SF: DM ‐3,50; IC del 95%: ‐6,13 a ‐0,87; evidencia de baja calidad) (Cruz 2014). Ninguno de los ensayos informó datos sobre la incontinencia fecal en la última etapa del embarazo, ni en los períodos posnatales medio y tardío en esta comparación (Resumen de los hallazgos 2). La evidencia en esta comparación fue particularmente débil; todos los ensayos estuvieron limitados por el informe incompleto de la intervención y de las condiciones control, así como de los métodos de los ensayos. Dos ensayos de esta comparación se informaron solo como resúmenes de congresos.
Según los datos resumidos de tres ensayos, no está claro si el EMPP para tratar la incontinencia urinaria posnatal redujo la incontinencia urinaria en el período posnatal tardío (CR 0,55; IC del 95%: 0,29 a 1,07; 696 mujeres; evidencia de muy baja calidad). Se señaló que dos de los tres ensayos que tuvieron la ponderación mayor en la estimación agrupada compararon el EMPP (con supervisión limitada por un profesional sanitario) con la atención habitual y algunas mujeres de los grupos control realizaron EMPP (Glazener 2001; Wilson 1998). No hubo diferencias entre los grupos en Wilson 1998 y casi ninguna diferencia en Glazener 2001. El tercer ensayo, Dumoulin 2004, comparó una intervención de EMPP más corta y con una supervisión más intensiva con ningún tratamiento y encontró una reducción del riesgo de incontinencia urinaria a favor del EMPP. Según los datos de un ensayo único muy pequeño, no está claro si la calidad de vida asociada con la incontinencia urinaria después del tratamiento mejoró con el EMPP (BFLUTS: DM ‐1,66; IC del 95%: ‐3,51 a 0,19; 18 mujeres; evidencia de muy baja calidad) (Kim 2012). Asimismo, según los datos resumidos de dos ensayos, no está claro si el EMPP reduce la incontinencia fecal en el período posnatal tardío en comparación con la atención habitual (CR 0,68; IC del 95%: 0,24 a 1,94; 620 mujeres; evidencia de muy baja calidad) (Glazener 2001; Wilson 1998) (Resumen de los hallazgos 4).
Glazener 2001 realizó un seguimiento a largo plazo de las pacientes a los seis y 12 años después del estudio inicial. No hubo diferencias en la prevalencia de la incontinencia urinaria entre los grupos de EMPP y control en cualquiera de estos puntos temporales, lo que indica que los posibles efectos beneficiosos del EMPP no se mantuvieron a largo plazo. Glazener y colegas también midieron la incontinencia fecal a los seis y 12 años después del parto. Estos resultados no mostraron diferencias, pero los IC fueron amplios, lo que destaca la necesidad de evidencia adicional en esta área.
Pacientes en el período prenatal
Pacientes en el período posnatal
Ensayos con un enfoque mixto de prevención y tratamiento
Los datos resumidos de nueve ensayos indicaron que el EMPP prenatal, administrado a una población de pacientes con o sin síntomas existentes de incontinencia urinaria, puede haber disminuido la prevalencia de la incontinencia urinaria en la última etapa del embarazo (CR 0,74; IC del 95%: 0,61 a 0,90; 3164 mujeres; evidencia de baja calidad). Los dos ensayos que compararon EMPP con ningún entrenamiento parecieron mostrar un mayor efecto que los otros siete ensayos que compararon el EMPP y la atención habitual (Assis 2015; Ko 2011). Los datos resumidos del período posnatal medio también favorecieron al EMPP sobre el control, aunque hubo incertidumbre acerca de este efecto (CR 0,73; IC del 95%: 0,55 a 0,97; cinco ensayos, 1921 mujeres; evidencia de muy baja calidad). Dos ensayos informaron datos sobre la incontinencia urinaria en el período posparto tardío y puede que no haya habido diferencias en la prevalencia de incontinencia urinaria entre el EMPP y la atención habitual, aunque hubo incertidumbre acerca de este efecto (CR 0,85; IC del 95%: 0,63 a 1,14; 244 mujeres; evidencia de baja calidad).
De manera similar, el EMPP prenatal puede haber dado lugar a poca o ninguna diferencia en la prevalencia de incontinencia fecal en la última etapa del embarazo (CR 0,61; IC del 95%: 0,30 a 1,25; evidencia de calidad moderada). No hubo datos de la prevalencia de la incontinencia fecal en los períodos posnatales medio o tardío en esta comparación. Un ensayo único (ICIQ‐SF: DM ‐0,20; IC del 95%: ‐1,21 a 0,80; 190 mujeres; evidencia de baja calidad) encontró que el EMPP prenatal puede haber dado lugar a poca o ninguna diferencia en la calidad de vida asociada con la incontinencia en el período posnatal tardío en comparación con la atención habitual (Fritel 2015). Sin embargo, es importante señalar que en Fritel 2015, las pacientes de ambos grupos informaron una frecuencia y duración similar del EMPP (incluido el número de contracciones) al final del embarazo. Lo anterior indicó que la falta de diferencias entre los grupos se debió a que el grupo control realizaba de forma sistemática el EMPP adecuado, lo que fue estimulante en cuanto a la práctica del EMPP en la población general (Resumen de los hallazgos 3).
Según los datos resumidos de tres ensayos, no está claro si el EMPP posnatal, administrado a una población de pacientes con o sin síntomas existentes de incontinencia urinaria, redujo la incontinencia urinaria en el período posnatal tardío (CR 0,88; IC del 95%: 0,71 a 1,09; 826 mujeres; evidencia de muy baja calidad). De manera similar, no está claro si el EMPP redujo la incontinencia fecal en el período posnatal tardío en comparación con ningún EMPP (CR 0,73; IC del 95%: 0,13 a 4,21; un ensayo, 107 mujeres; evidencia de muy baja calidad) (Meyer 2001). No hubo datos de la calidad de vida asociada con la incontinencia en esta comparación (Resumen de los hallazgos 5).
Pacientes en el período prenatal
Pacientes en el período posnatal
Resultados del parto
Se informaron pocos eventos adversos con el EMPP. Sin embargo, fue posible que el EMPP durante el embarazo influyera en los resultados del trabajo de parto y el parto. Lo anterior no pareció ser el caso, según los datos de nueve ensayos de EMPP prenatal incluidos en esta revisión.
Tres de los ensayos de EMPP prenatal para la prevención de la incontinencia informaron el resultado del parto (Barakat 2011; Gaier 2010; Gorbea 2004). El riesgo de cesárea no fue diferente (CR 1,28; IC del 95%: 0,89 a 1,85; 373 mujeres) (Análisis 1.19). Gaier 2010 informó datos sobre las tasas de episiotomía, en los que el grupo control recibió más episiotomías que el grupo de EMPP, mientras que Barakat 2011 informó las tasas de traumatismo perineal, sin diferencias evidentes en los grados de desgarro perineal entre los grupos (Análisis 1.20).
Seis de los ensayos de EMPP prenatal para el enfoque mixto de prevención y tratamiento de la incontinencia informaron el resultado del parto (Bø 2011; Fritel 2015; Ko 2011; Miquelutti 2013; Mørkved 2003; Stafne 2012). El riesgo de cesárea no fue diferente (CR 0,95; IC del 95%: 0,79 a 1,14; 1899 mujeres) (Análisis 3.20). Ninguno de los tres ensayos que informaron datos del riesgo de parto vaginal asistido encontró diferencias entre los grupos de EMPP y control (Análisis 3.21) (Fritel 2015; Mørkved 2003; Stafne 2012). Dos ensayos informaron datos sobre las tasas de episiotomía, en los que el grupo control recibió más episiotomías que el grupo de EMPP (Análisis 3.21) (Ko 2011; Mørkved 2003). Du 2015 publicó una revisión sistemática no Cochrane de EMPP prenatal y resultados del parto en la que los resultados parecieron consistentes con los anteriores. Dicha revisión incluyó más estudios, ya que contenía ensayos que no recogieron datos de la incontinencia urinaria ni de la incontinencia fecal.
Los ensayos de EMPP prenatal para el tratamiento de la incontinencia no informaron datos sobre los resultados del trabajo de parto o el parto.
Compleción y aplicabilidad general de las pruebas
Las medidas autoinformadas de incontinencia urinaria y fecal se consideraron los resultados más importantes en esta revisión. Sin embargo, hubo variabilidad en la manera en la que se definieron la incontinencia urinaria y fecal, cómo se formularon las preguntas y cómo se presentaron los datos. Hubo pocos datos de la calidad de vida asociada con la incontinencia y poco acuerdo con respecto a las medidas estándar. Además, algunos ensayos solo informaron parcialmente una puntuación (p.ej. un dominio de varios incluidos en la puntuación total) o una afirmación acerca de la diferencia o la falta de diferencia, en ocasiones con un valor de P; como estos datos se recopilaron pero no se informaron o solo se informaron de manera parcial, se trata de una forma de sesgo de informe.
Desafortunadamente, pocas veces se recopilaron datos de la incontinencia fecal en los ensayos de prevención o del enfoque mixto de prevención y tratamiento; sólo seis estudios presentaban datos. Al ser un evento menos frecuente que la incontinencia urinaria, se necesitan ensayos más grandes para documentar con exactitud el efecto del EMPP sobre este resultado y más ensayos deben recopilar estos datos para permitir una estimación del efecto más precisa según los datos agrupados.
La utilidad de la evidencia se redujo en cierta manera por las duraciones cortas del seguimiento después de la intervención. Lo anterior fue particularmente problemático en los ensayos de EMPP prenatal, en los que el resultado se midió al final del embarazo o en los tres meses posparto. Es posible que a los tres meses del parto no haya habido una resolución completa de muchos de los cambios fisiológicos asociados con el embarazo y el parto. Es probable que un seguimiento posparto mínimo de seis meses sea más útil para tener seguridad acerca de cuántos casos de incontinencia urinaria o fecal persistieron. En los estudios de tratamiento, aunque es útil una medida posintervención, se necesitan datos sobre la duración del efecto (p.ej. al año o más). Con respecto al seguimiento a más largo plazo, solo tres estudios proporcionaron datos después de los cinco años (Glazener 2001; Mørkved 2003; Reilly 2002). Los datos a más largo plazo son difíciles de interpretar, ya que a los grupos control se les puede ofrecer un EMPP estructurado después que se midió el resultado posintervención, las pacientes pueden tener más niños, y así sucesivamente. Sin embargo, a falta de datos a más largo plazo con respecto a la incontinencia urinaria y fecal y otras variables (número de partos, peso corporal, etc.), no hay una base de evidencia suficiente para comenzar a analizar e interpretar.
El embarazo y el parto parecen ser los factores más consistentes e importantes asociados con la aparición de la incontinencia urinaria y fecal en las mujeres. Por lo tanto, todas las mujeres que deciden tener un niño, o niños, se pueden considerar en riesgo de incontinencia posteriormente. Además, algunas mujeres (como las que tienen un trastorno del tejido conjuntivo, un IMC alto o un parto asistido) podrían presentar un riesgo mayor (Durnea 2017; Svare 2014). La mayor parte de los ensayos examinados se realizaron en muestras de pacientes en el período prenatal, principalmente en su primer embarazo y la mayoría de los datos fueron de incontinencia urinaria. Los resultados indicaron que las pacientes sin incontinencia en el período prenatal se beneficiaron más de los programas de EMPP "estructurados" (en cuanto a contenido y administración) que las mujeres de los grupos de atención habitual que pueden haber incorporado un asesoramiento o un aprendizaje de EMPP (o ad hoc) .
Los ensayos de EMPP prenatal para el enfoque mixto de prevención y tratamiento también reclutaron principalmente pacientes que tuvieron su primer hijo y mostraron un modelo similar de efectos beneficiosos del EMPP estructurado versus las condiciones control. Sin embargo, los datos agrupados indicaron menos reducción del riesgo de incontinencia urinaria, IC superiores más cercanos a 1 (es decir, ninguna reducción del riesgo de incontinencia urinaria) y en general también hubo más incertidumbre acerca del efecto.
Se justifican los esfuerzos para determinar qué valor le dan las pacientes, los profesionales sanitarios y las organizaciones profesionales, las fuentes y los organismos de financiamiento a este grupo de evidencia acerca de la prevención de la incontinencia urinaria mediante el EMPP prenatal estructurado y supervisado (al menos para las madres primíparas). Si los hallazgos se consideran suficientemente ciertos y de valor, entonces se necesitarán cambios en la administración actual ad hoc del asesoramiento del EMPP en la "atención habitual" del embarazo. Junto con lo anterior, y para informar cualquier decisión acerca del "valor" del EMPP prenatal para la prevención de la incontinencia, se necesitan investigaciones sobre economía sanitaria. A falta de dichos estudios, no hay evidencia acerca de su valor económico. Es estimulante que un estudio en curso identificado en la búsqueda planificó recopilar e informar datos económicos (Berghmans 2016).
Se resumieron datos de todos los ensayos. Hubo unos pocos en los que se consideró que el informe fue suficiente acerca de lo que se hizo en los grupos de EMPP y control, por lo que hubo seguridad acerca de la estimación de las diferencias en los resultados. En estos ensayos se proporcionó información suficiente acerca de la intervención y las condiciones control, por lo que fue posible hacer valoraciones acerca de:
-
la solidez de la fisiología del EMPP (es decir, si es probable que la intervención de EMPP estructurado fortalezca los músculos);
-
el comportamiento con respecto al ejercicio en ambos grupos (es decir, si ambos grupos hicieron cantidades similares o muy diferentes de EMPP);
-
el grado de contraste entre los dos grupos (p.ej. si el grupo de EMPP asistió a muchas clases de ejercicio mientras el grupo control no lo hizo [contraste alto], o hizo el grupo de EMPP tuvo una sesión de instrucción y los controles no [contraste bajo]) (ver la Tabla 1 y Sesgos potenciales en el proceso de revisión [heterogeneidad]).
Cuatro ensayos tuvieron la cantidad necesaria de información (Chiarelli 2002; Hilde 2013; Reilly 2002; Stafne 2012). Todos tuvieron bajo riesgo de sesgo de selección y tamaños de la muestra moderados a grandes. Dos examinaron el efecto del EMPP prenatal para la prevención de la incontinencia urinaria y fecal (Reilly 2002; pacientes primíparas con hipermovilidad del cuello vesical) y para el enfoque mixto de prevención y tratamiento (Stafne 2012; embarazadas sanas, número de partos mixto) y dos el efecto del EMPP posnatal para el enfoque mixto de prevención y tratamiento de la incontinencia urinaria y fecal (Chiarelli 2002, número de partos mixto, después de un parto con ventosa o fórceps o un recién nacido que pesó 4000 g o más; Hilde 2013, pacientes primíparas después de un parto vaginal). Al examinar los resultados calificados con GRADE, los datos de estos ensayos individuales fueron consistentes con las estimaciones agrupadas del efecto. El entrenamiento prenatal pareció tener reducciones clínicamente importantes de la incontinencia urinaria en la última etapa del embarazo y entre más de tres a seis meses en el período posnatal (Reilly 2002; Stafne 2012). El efecto del entrenamiento posnatal para el enfoque mixto de prevención y tratamiento puede no ser clínicamente importante a más de tres a seis meses después del parto para la incontinencia urinaria (Chiarelli 2002; Hilde 2013). Sin embargo, es posible que las pacientes con mayor riesgo de incontinencia posnatal se hayan beneficiado más (Chiarelli 2002).
Calidad de la evidencia
En general, la evidencia fue de calidad moderada, baja o incluso muy baja (ver Resumen de los hallazgos para la comparación principal; Resumen de los hallazgos 2; Resumen de los hallazgos 3; Resumen de los hallazgos 4; Resumen de los hallazgos 5). Las razones más frecuentes para disminuir la calidad de la evidencia fueron:
-
imprecisión, con pocos eventos generales que contribuyeron al análisis agrupado e IC amplios alrededor de las estimaciones del efecto;
-
inconsistencia, ya que muchos de los metanálisis demostraron heterogeneidad estadísticamente significativa (prueba ji² p < 0,10) o tuvieron una I² > 50%;
-
indireccionalidad, debido a la falta de un informe claro de la intervención de EMPP o la condición control, o ambos.
En algunas comparaciones se disminuyó por el sesgo de selección, que surge del informe inadecuado de la generación de la secuencia aleatoria y la asignación al azar. La mayoría de las comparaciones en las tablas "Resumen de los hallazgos" estuvieron afectadas por más de uno de los anteriores y la calidad se disminuyó en dos o tres niveles.
Calidad de los ensayos e informe
Se evaluó la calidad metodológica de los informes de los ensayos, que fue limitada cuando la única fuente de publicación provino de un resumen (ver Estudios incluidos). Además, los resúmenes informaron pocos datos.
La idoneidad del informe de la asignación al azar todavía es decepcionante, ya que menos de la mitad de los ensayos incluidos informaron la generación de la secuencia aleatoria y la ocultación de la asignación y 13/38 estudios no las describieron. Debido a la naturaleza de la intervención, no fue posible cegar la asignación a los grupos al profesional sanitario ni a las participantes (sesgo de realización) en ninguno de los ensayos incluidos. La dificultad para realizar el cegamiento de las intervenciones con ejercicios es inevitable. Además, es imposible realizar el cegamiento de los resultados primarios de la revisión porque ambos fueron autoinformados (prevalencia de la incontinencia urinaria o incontinencia fecal y calidad de vida asociada con la incontinencia). Aproximadamente tres cuartos de los ensayos (28/38) tuvieron un bajo riesgo de sesgo de informe, pero solo poco más de la mitad (21/38) se consideraron con bajo riesgo con respecto a posibles fuentes de otros sesgos (Figura 2; Figura 3).
Según la idoneidad de la asignación al azar informada, la proporción y el procesamiento de los abandonos y los retiros de las participantes, así como el bajo riesgo de informe selectivo y de otros sesgos, seis ensayos parecieron tener bajo riesgo de sesgo (Chiarelli 2002; Dumoulin 2004; Hilde 2013; Mørkved 2003; Peirce 2013; Sangsawang 2016). Sin embargo, esta evaluación no consideró la calidad de las descripciones de las intervenciones de EMPP ni de las condiciones control. Si lo anterior se tuviera en cuenta, se disminuiría la calidad del ensayo Sangsawang 2016, ya que la intervención fue de corta duración y no se proporcionó información suficiente para determinar el efecto fisiológico probable del EMPP. El análisis de sensibilidad sobre la base de la calidad del ensayo no se consideró apropiado en vista del número pequeño de ensayos que contribuían a cada comparación.
Sesgos potenciales en el proceso de revisión
Se combinaron los datos de un grupo diverso de estudios. Este hecho puede repercutir de forma inevitable en la aplicabilidad de los hallazgos para la práctica. A continuación se resumen los aspectos relacionados con la heterogeneidad de los estudios que se utilizaron.
Fuentes de heterogeneidad
Hubo tres fuentes importantes de heterogeneidad clínica. Estas fuentes fueron la variación en las características iniciales (p.ej. número de partos, tipo de parto, tipo y duración de la incontinencia, si las pacientes estaban sintomáticas cuando se reclutaron), los programas de EMPP y la atención control. Investigar los efectos de las características iniciales sobre el resultado del tratamiento requeriría un metanálisis de datos de pacientes individuales, que estaba más allá del alcance de esta revisión.
Variabilidad de los regímenes de entrenamiento muscular del piso pelviano
El contenido de los programas de EMPP a menudo se describió de manera deficiente. Por lo tanto, fue inevitable la disminución de la calidad de la evidencia sobre la base de la inconsistencia y la indireccionalidad debido a la falta de información acerca del EMPP y las condiciones control, el contenido del EMPP y la supervisión de los programas de ejercicio (ver tablas "Resumen de los hallazgos").
Más de la mitad de los ensayos no proporcionaron información suficiente para tener la seguridad del efecto fisiológico probable del ejercicio y solo la mitad proporcionó la confirmación de una contracción correcta de los MPP antes del entrenamiento (ver regímenes de EMPP e intervenciones control, Estudios incluidos y Tabla 1). En consecuencia, fue difícil evaluar la posible eficacia fisiológica de los programas de ejercicio. La inclusión de ensayos con un régimen de ejercicios subóptimo junto con ensayos que tenían un régimen suficiente podría influir negativamente en la estimación agrupada del efecto del EMPP.
Junto con la eficacia fisiológica del ejercicio, también se requiere el apoyo a los aspectos conductuales del ejercicio. Habitualmente el apoyo conductual se proporciona mediante la supervisión del ejercicio, y su grado varió notablemente entre los ensayos. La menor supervisión fue una sesión grupal o individual para introducir el EMPP y la mayor fue una media de 85 clases entre la sexta hasta las 39 semanas de embarazo (Tabla 1). La asistencia a veces se utilizó como una medida alternativa para medir el cumplimiento. Puede ser una buena medida de adherencia si el número de asistencias necesarias fuera suficiente para fortalecer los MPP (Haskell 2007). Sin embargo, si la asistencia al consultorio fue menor de dos veces por semana, entonces era probable que fuera necesario completar un entrenamiento adicional en el domicilio para lograr un régimen suficiente de ejercicio. La medición de la adherencia al ejercicio domiciliario se convierte entonces en un componente crítico para evaluar la eficacia probable del entrenamiento. La mitad de los ensayos incluidos informaron algún tipo de dato de adherencia de las pacientes de los grupos de intervención o control, pero solo nueve estudios les preguntaron a las pacientes de los grupos de EMPP y control acerca del comportamiento con respecto al ejercicio (ver Estudios incluidos). Los datos de adherencia se deben recopilar en ambos grupos de estudio, aunque se reconoce que su medición puede cambiar el comportamiento con respecto al ejercicio. A la vez, lo anterior puede provocar una sobrestimación del efecto probable en la vida "real" y puede disminuir la diferencia en el efecto entre el EMPP estructurado y las condiciones control.
Se ha recomendado la evaluación de la interacción entre la calidad y el efecto de la intervención, pero hubo muy pocos ensayos para realizar un análisis de sensibilidad formal según la calidad de la intervención (Herbert 2005). En lugar de excluir o incluir ensayos sobre la base de la suficiencia del EMPP, o de la probabilidad de que se había realizado una comparación clara entre el EMPP y la condición control, el enfoque preferido sería un análisis de sensibilidad sobre la base de las características del programa de EMPP o la magnitud de la diferencia clínica entre las intervenciones con EMPP y los controles. Sin embargo, para que sea posible este enfoque se necesitarían más ensayos en cada una de las comparaciones de la revisión. Se trató de extraer información acerca de la calidad fisiológica y conductual de las intervenciones de EMPP, junto con el grado de diferencia entre los grupos de EMPP y control (ver "Características de la muestra" en Estudios incluidos y Resumen de los resultados principales).
Variabilidad de las condiciones control
Las condiciones control también fueron muy variables y por lo general se describieron de forma deficiente; muchos estudios incluyeron un informe general acerca de las pacientes de los grupos control que recibieron atención habitual u estándar. Sin embargo, a menudo no estuvo claro si la atención habitual incluyó asesoramiento acerca del EMPP (es decir, instrucciones escritas o verbales) o una mayor preparación ad hoc (ver "Características de la muestra" en los Estudios incluidos y la Tabla 1).
Acuerdos y desacuerdos con otros estudios o revisiones
Los hallazgos y las conclusiones generales de esta revisión actualizada en general son los mismos de la versión anterior, a pesar de que esta actualización contiene más ensayos y significativamente más datos que la revisión anterior e integra las puntuaciones GRADE para evaluar la calidad de la evidencia (Boyle 2012). Desde la última actualización de esta revisión en 2012, se ha publicado una revisión sistemática no Cochrane sobre los efectos del EMPP durante el embarazo y después del parto para la prevención y el tratamiento de la incontinencia urinaria (Mørkved 2014). Aunque Mørkved 2014 consideró los datos en categorías algo diferentes, informaron que el EMPP durante el embarazo y después del parto fue efectivo para tratar y prevenir la incontinencia urinaria, en particular cuando las pacientes se adhirieron a un protocolo de entrenamiento de fuerza y con supervisión estrecha. Los resultados de esta revisión coincidieron con los de Mørkved 2014 con respecto a factores metodológicos como la heterogeneidad de las poblaciones de los ensayos incluidos, las diferencias en las medidas de resultado informadas y la variación considerable en el EMPP y las condiciones control entre los ensayos.

PRISMA study flow diagram.

Risk of bias summary: review authors' judgements about each risk of bias item for each included study.

Risk of bias graph: review authors' judgements about each risk of bias item presented as percentages across all included studies.

Comparison 1 Antenatal pelvic floor muscle training (PFMT) versus control for prevention of incontinence, Outcome 1 Urinary incontinence in late pregnancy.

Comparison 1 Antenatal pelvic floor muscle training (PFMT) versus control for prevention of incontinence, Outcome 2 Urinary incontinence early postnatal period (0‐3 months).

Comparison 1 Antenatal pelvic floor muscle training (PFMT) versus control for prevention of incontinence, Outcome 3 Urinary incontinence mid‐postnatal period (> 3‐6 months).

Comparison 1 Antenatal pelvic floor muscle training (PFMT) versus control for prevention of incontinence, Outcome 4 Urinary incontinence late postnatal period (> 6‐12 months).

Comparison 1 Antenatal pelvic floor muscle training (PFMT) versus control for prevention of incontinence, Outcome 6 Urinary incontinence long term (> 5 years).

Comparison 1 Antenatal pelvic floor muscle training (PFMT) versus control for prevention of incontinence, Outcome 13 Incontinence‐specific quality of life.
| Study | Measure of | Outcome measure | PFMT data | Control data | Difference |
| PFMT versus no PFMT | |||||
| Stothers 2002 | Frequency of leakage | Leakage episodes in 5 days | Mean 3.4, SD not reported, n=7 at 6 months postpartum | Mean 6.0, SD not reported, n=8 at 6 months postpartum | Not calculable |
| Stothers 2002 | Amount of leakage | Volume of urine loss (g) on stress test with standardised bladder volume | Mean 18, SD not reported, n=? at 6 months postpartum | Mean 38, SD not reported, n=? at 6 months postpartum | Not calculable |
| Stothers 2002 | Other leakage severity | Not measured | |||
| PFMT versus usual care | |||||
| Gorbea 2004 | Frequency of leakage | Less than weekly, weekly or daily urinary incontinence (not clear if self‐reported or from urinary diary) | 4 less than weekly, 2 weekly and none with daily leakage, n=38 at 6 weeks postpartum | 6 less than weekly, 8 weekly and 2 with daily leakage, n=34 at 6 weeks postpartum | Not calculated as validity/reliability of this measure not known |
| Gorbea 2004 | |||||
| Gorbea 2004 | Other leakage severity | Grade I, II or III leakage, where I=loss of urine with coughing or lifting, II=urine leakage when walking, and III=urine leakage when upright | 6 grade I, and none with grade II or III leakage, n=38 at 6 weeks postpartum | 10 grade I, 6 grade II, and none grade III leakage, n=34 at 6 weeks postpartum | Not calculated as validity/reliability of this measure not known |
| Pelaez 2014 | Frequency of leakage | Self‐reported leakage frequency categorised as never, once a week, 2‐3 times a week, once a day, several times a day, all the time (item 3, ICIQ‐SF) | 60 never, 3 once a week, n=63 at 36‐40 weeks gestation | 54 never, 18 once a week, 9 2‐3 times a week, 7 once a day, 1 several times a day, n=89 | Author reported p‐value 0.0001 |
| Pelaez 2014 | Amount of leakage | Self‐reported amount of leakage categorised as none, small, moderate, large (item 4, ICIQ‐SF) | 60 none, 3 small, n=63 at 36‐40 weeks gestation | 54 report none, 27 a small, 5 moderate, 3 large, n=89 | Author reported p‐value 0.0001 |
| Pelaez 2014 | Symptom bother | Symptom impact, numbered VAS 0‐10 (10 worse) (item 5, ICIQ‐SF) | Mean 0.10, SD 0.64, n=63 | Mean 0.97, SD 1.8, n=89 | Mean difference ‐0.87 (95% CI ‐1.28 to ‐0.46) |
| Reilly 2002 | Incontinence‐specific quality of life | King's Health Questionnaire | Not reported | Not reported | "No difference between the study groups on any of the 8 scales, and all mean scores were low" |
| Reilly 2002 | |||||
| Reilly 2002 | Other leakage severity | Mild, moderate or severe urinary incontinence (not clear how categorised) | 19 mild, 3 moderate and 1 severe, n=74 at 3 months postpartum | 30 mild, 5 moderate and 1 severe, n=74 at 3 months post partum | Not calculated as validity/reliability of this measure not known |
| Sampselle 1998 | Frequency of leakage | Not measured | |||
| Sampselle 1998 | Amount of leakage | Not measured | |||
| Sampselle 1998 | Other leakage severity | Average score from questionnaire re urine leakage with gentle cough, hard cough, sneeze and laugh scored 0 for none, 1 for dampness, 2 for wetness and 3 for soaked | Mean 0.30, standard deviation 0.44, n=16 at 12 months postpartum | Mean 0.32, standard deviation 0.41, n=21 at 12 months postpartum | Not calculated as validity/reliability of this measure not known |
| Sangsawang 2016 | Frequency of leakage | Bladder diary, number of leakages per week | Mean 12.4, SD 5.3, n=9 of 33 at 38 weeks gestation | Mean 23.1, SD 5.7, n=16 of 30 at 38 weeks gestation | Mean difference ‐8.9 (95% CI ‐13.7 to ‐4.0) |
| Sangsawang 2016 | Amount of leakage | Self‐reported: none, small (drops), moderate (wetting underwear), large (wetting outer clothing) | None 24, small 2, moderate 4, large 3 | None 14, small 2, moderate 8, large 6 | Author reported p‐value 0.03 |
| Sangsawang 2016 | Other leakage severity | Perceived severity on VAS (0‐10) | Mean 5.0, SD 0.9, n=9 of 33 | Mean 6.3, SD 1.2, n=16 of 30 | Mean difference ‐2.0 (95% CI ‐3.4 to ‐0.6) |
| PFMT versus unspecified control | |||||
| Barakat 2011 | Frequency of leakage | Self‐reported leakage frequency categorised as never, once a week, 2‐3 times a week, once a day, several times a day, all the time (item 3, ICIQ‐SF) | 24 never, 5 once a week, 2 2‐3 times a week, 2 once a day, 1 several times a day, n=34 | 22 never, 5 once a week, 1 2‐3 times a week, 2 once a day, 3 several times a day, n=33 | Author reported p‐value >0.05 |
| Barakat 2011 | Amount of leakage | Self‐reported amount of leakage categorised as none, small, moderate, large (item 4, ICIQ‐SF) | Not reported | Not reported | |
| Barakat 2011 | Other leakage severity | ||||
Comparison 1 Antenatal pelvic floor muscle training (PFMT) versus control for prevention of incontinence, Outcome 14 Severity of incontinence.
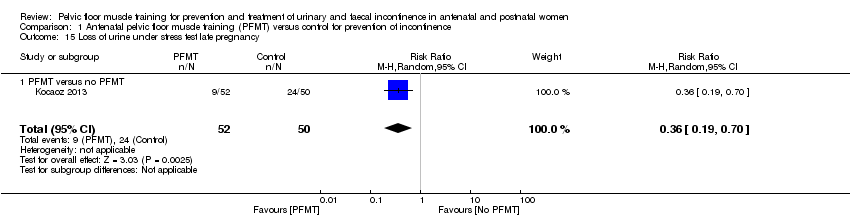
Comparison 1 Antenatal pelvic floor muscle training (PFMT) versus control for prevention of incontinence, Outcome 15 Loss of urine under stress test late pregnancy.

Comparison 1 Antenatal pelvic floor muscle training (PFMT) versus control for prevention of incontinence, Outcome 16 Loss of urine under stress test early postnatal period (0‐3 months).
| Study | Outcome measure | PFMT data | Control data | Difference |
| PFMT versus usual care | ||||
| Reilly 2002 | SF‐36, general health scale (0=worst, 100=best) | Mean 84.4, SD 13.5, n=76 | Mean 77.2, SD 16.3, n=72 | Mean difference 7.2 (95% CI 12.04, 2.36) |
| PFMT versus unspecified control | ||||
| Barakat 2011 | Maternal perception of health status (presume an item derived from SF‐36). Rated as very bad, somewhat bad, good or very good | 1 very bad, 14 good, 18 very good, n=34 | 1 very bad, 5 somewhat bad, 18 good, 9 very good, n=33 | |
Comparison 1 Antenatal pelvic floor muscle training (PFMT) versus control for prevention of incontinence, Outcome 17 Quality of life and health status measures.
| Study | Outcome measure | PFMT data | Control data | Difference |
| PFMT versus no PFMT | ||||
| Gorbea 2004 | No or minimal contraction on electromyography. Not clear what type of electromyography or how categorised | 14 of 14 at 6 weeks postpartum | 10 of 12 at 6 weeks postpartum | Not calculated as validity/reliability of this measure not known |
| PFMT versus usual care | ||||
| Gaier 2010 | PF muscle strength (measure not reported) | Significantly higher in the training group at 12 | ||
| Reilly 2002 | Vaginal squeeze pressure (need unit of measurement), early post‐natal | Mean 11.5, SD 7.8, n=68 | Mean 10.5, SD 5.5, n=64 | Mean difference 1.0 (95% CI ‐1.31 to 3.31) |
Comparison 1 Antenatal pelvic floor muscle training (PFMT) versus control for prevention of incontinence, Outcome 18 Pelvic floor muscle function.

Comparison 1 Antenatal pelvic floor muscle training (PFMT) versus control for prevention of incontinence, Outcome 19 Delivery outcome: caesarean section.
| Study | Outcome measure | PFMT data | Control data | Difference |
| PFMT versus no control | ||||
| Stothers 2002 | Type of delivery | 73.3% vaginal, 26.7% caesarean; not reported per group | ||
| Stothers 2002 | ||||
| PFMT versus usual care | ||||
| Gaier 2010 | Number with episiotomy | 2 of 65 | 6 of 62 | Relative risk 0.32 (95% CI 0.07 to 1.52) |
| Gaier 2010 | Perineal trauma | 0.5% | 4.2% | Unable to calculate |
| Reilly 2002 | Type of delivery | 78 normal vaginal, 13 ventouse, 8 forceps, n=120 | 72 normal vaginal, 22 ventouse, 2 forceps, n=110 | Relative risk for normal vaginal delivery 0.99 (95% CI 0.82 to 1.20) Relative risk for assisted vaginal delivery 0.80 (95% CI 0.47 to 1.36) |
| Reilly 2002 | ||||
| PFMT versus unspecified control | ||||
| Barakat 2011 | Type of delivery | 20 normal vaginal, 7 assisted vaginal, n=34 | 18 normal vaginal, 5 assisted vaginal, n=33 | Relative risk for normal vaginal delivery 1.08 (95% CI 0.71 to 1.64) Relative risk for assisted vaginal delivery 1.36 (95% CI 0.48 to 3.86) |
| Barakat 2011 | Perineal trauma | 22 intact perineum, 6 grade 1 tear, 5 grade 2 tear, 1 grade 3 tear, n=34 | 19 intact perineum, 6 grade 1 tear, 8 grade 2 tear, 0 grade 3 tear, n=33 | Relative risk for perineal tear 0.83 (95% CI 0.45 to 1.52) |
Comparison 1 Antenatal pelvic floor muscle training (PFMT) versus control for prevention of incontinence, Outcome 20 Delivery outcome: other.

Comparison 2 Antenatal pelvic floor muscle training (PFMT) versus control for treatment of incontinence, Outcome 1 Urinary incontinence late pregnancy.

Comparison 2 Antenatal pelvic floor muscle training (PFMT) versus control for treatment of incontinence, Outcome 2 Urinary incontinence early postnatal period (0‐3 months).
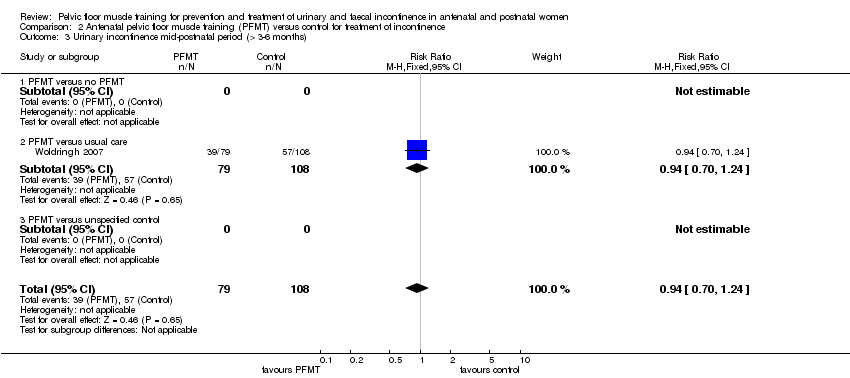
Comparison 2 Antenatal pelvic floor muscle training (PFMT) versus control for treatment of incontinence, Outcome 3 Urinary incontinence mid‐postnatal period (> 3‐6 months).
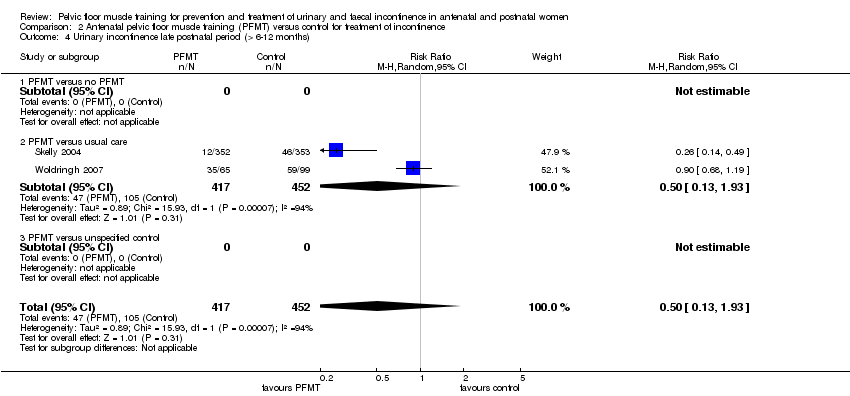
Comparison 2 Antenatal pelvic floor muscle training (PFMT) versus control for treatment of incontinence, Outcome 4 Urinary incontinence late postnatal period (> 6‐12 months).

Comparison 2 Antenatal pelvic floor muscle training (PFMT) versus control for treatment of incontinence, Outcome 14 Incontinence‐specific quality of life.
| Study | Outcome measure | PFMT data | Control data | Difference |
| PFMT versus usual care | ||||
| Woldringh 2007 | Incontinence Impact Questionnaire (IIQ), and data then dichotomised into impact versus no impact in four subscales ‐ impact on social relations, impact on emotional health, impact on recreational activities, and impact on physical activities (not clear how this was done) | Impact on social relations 2, on emotional health 11, on recreational activities 10, and on physical activities 4, n=65 at 12 months postpartum | Impact on social relations 5, on emotional health 14, on recreational activities 10, and on physical activities 7, n=99 at 12 months postpartum | Not calculated as validity/reliability of this measure not known |
| Woldringh 2007 | ||||
Comparison 2 Antenatal pelvic floor muscle training (PFMT) versus control for treatment of incontinence, Outcome 15 Quality of life and health status measures.
| Study | Measure of | Outcome measure | PFMT data | Control data | Difference |
| PFMT versus usual care | |||||
| Woldringh 2007 | Frequency of leakage | 7 day urinary diary | Not reported | Not reported | |
| Woldringh 2007 | Amount of leakage | Not measured | |||
| Woldringh 2007 | Other leakage severity | A combination of data from a 7 day bladder diary and a questionnaire (PRAFAB, Vierhout 1990), ending with a score between 0 and 10. Mild urinary incontinence 0 to 4, and moderate to severe incontinence 5 to 10 | 9 with moderate to severe leakage, n=65 at 12 months postpartum | 8 with moderate to severe leakage, n=99 at 12 months postpartum | Not calculated as validity/reliability of this measure not known |
Comparison 2 Antenatal pelvic floor muscle training (PFMT) versus control for treatment of incontinence, Outcome 16 Severity of incontinence.
| Study | Outcome measure | PFMT data | Control data | Difference |
| PFMT versus usual care | ||||
| Cruz 2014 | Maximal vaginal squeeze pressure, in cm water (Peritron) | Mean 29.8, SD 18.8, n=20 in third trimester | Mean 24.2, SD 12.9, n=21 in third trimester | Mean difference 5.6 (95% CI ‐4.32 to 15.52) |
| Cruz 2014 | ||||
Comparison 2 Antenatal pelvic floor muscle training (PFMT) versus control for treatment of incontinence, Outcome 17 Pelvic floor muscle function.
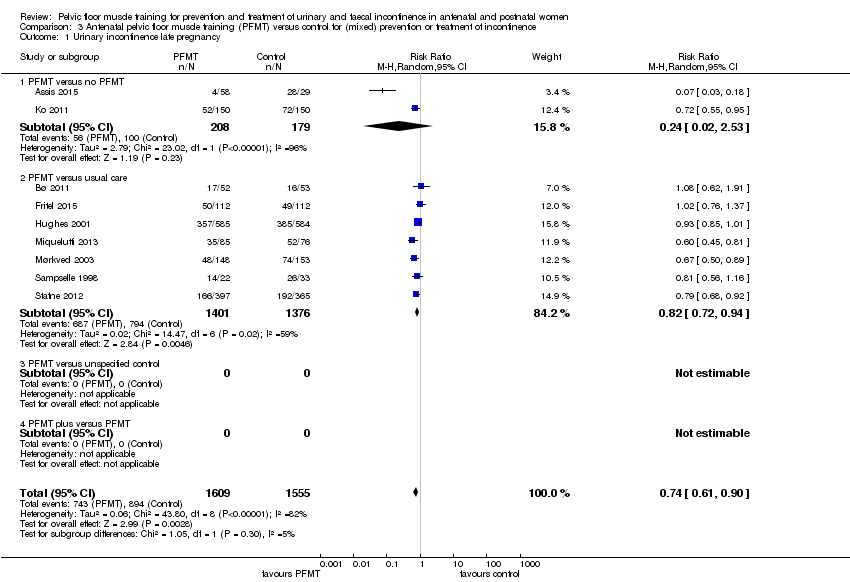
Comparison 3 Antenatal pelvic floor muscle training (PFMT) versus control for (mixed) prevention or treatment of incontinence, Outcome 1 Urinary incontinence late pregnancy.

Comparison 3 Antenatal pelvic floor muscle training (PFMT) versus control for (mixed) prevention or treatment of incontinence, Outcome 2 Urinary incontinence early postnatal period (0‐3 months).

Comparison 3 Antenatal pelvic floor muscle training (PFMT) versus control for (mixed) prevention or treatment of incontinence, Outcome 3 Urinary incontinence mid‐postnatal period (> 3‐6 months).

Comparison 3 Antenatal pelvic floor muscle training (PFMT) versus control for (mixed) prevention or treatment of incontinence, Outcome 4 Urinary incontinence late postnatal period (> 6‐12 months).

Comparison 3 Antenatal pelvic floor muscle training (PFMT) versus control for (mixed) prevention or treatment of incontinence, Outcome 6 Urinary incontinence long term (> 5 years).
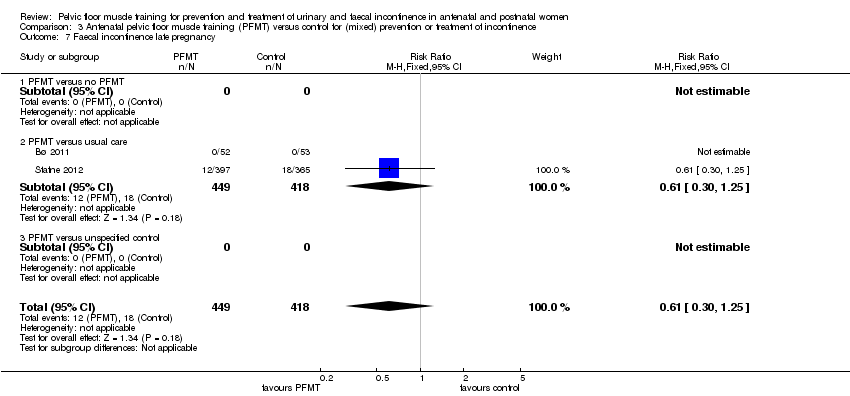
Comparison 3 Antenatal pelvic floor muscle training (PFMT) versus control for (mixed) prevention or treatment of incontinence, Outcome 7 Faecal incontinence late pregnancy.

Comparison 3 Antenatal pelvic floor muscle training (PFMT) versus control for (mixed) prevention or treatment of incontinence, Outcome 8 Faecal incontinence early postnatal period (0‐3 months).
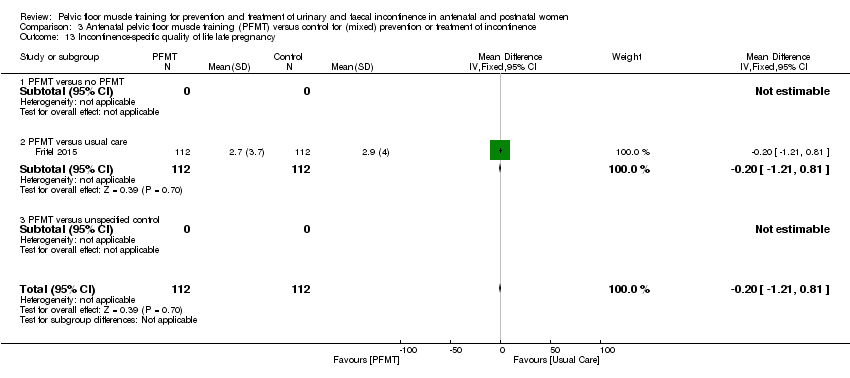
Comparison 3 Antenatal pelvic floor muscle training (PFMT) versus control for (mixed) prevention or treatment of incontinence, Outcome 13 Incontinence‐specific quality of life late pregnancy.

Comparison 3 Antenatal pelvic floor muscle training (PFMT) versus control for (mixed) prevention or treatment of incontinence, Outcome 14 Incontinence‐specific quality of life early postnatal period (0‐3 months).

Comparison 3 Antenatal pelvic floor muscle training (PFMT) versus control for (mixed) prevention or treatment of incontinence, Outcome 15 Incontinence‐specific quality of life late postnatal period (> 6‐12 months).
| Study | Measure of | Outcome measure | PFMT data | Control data | Difference |
| PFMT versus usual care | |||||
| Hughes 2001 | Frequency of leakage | Experiencing occasional or more than occasional urine leakage (not clear how measured) | 217 of 585 at 3 months postpartum | 210 of 584 at 3 months postpartum | Relative risk 1.03 (95% CI 0.89 to 1.20) |
| Hughes 2001 | Amount of leakage | Experiencing a drop or more than a drop of urine leakage (not clear how measured) | 228 of 585 at 3 months postpartum | 234 of 584 at 3 months postpartum | Relative risk 0.97 (95% CI 0.84 to 1.12) |
| Hughes 2001 | Other leakage severity | Not measured | |||
| Sampselle 1998 | Frequency of leakage | Not measured | |||
| Sampselle 1998 | Amount of leakage | Not measured | |||
| Sampselle 1998 | Other leakage severity | Average score from questionnaire re urine leakage with gentle cough, hard cough, sneeze and laugh scored 0 for none, 1 for dampness, 2 for wetness and 3 for soaked | Mean 0.38, SD 0.56, n=22 at 12 months postpartum | Mean 0.42, SD 0.49, n=24 at 12 months postpartum | Not calculated as validity/reliability of this measure not known |
Comparison 3 Antenatal pelvic floor muscle training (PFMT) versus control for (mixed) prevention or treatment of incontinence, Outcome 16 Severity of incontinence.
| Study | Measure | PFMT | Control | Difference |
| PFMT versus usual care | ||||
| Fritel 2015 | 24 hour pad test (g) | Mean 0.9, SD 1.6, n=78 at 2 months postpartum | Mean 1.3, SD 3.3, n=85 at 2 months postpartum | Mean difference ‐0.40 (95% CI ‐1.19 to 0.39) |
Comparison 3 Antenatal pelvic floor muscle training (PFMT) versus control for (mixed) prevention or treatment of incontinence, Outcome 17 Loss of urine under stress test early postnatal period (0‐3 months).
| Study | Outcome measure | PFMT data | Control data | Difference |
| PFMT versus no PFMT | ||||
| Ko 2011 | UDI‐6 (0‐100) | Mean 3.44, SD 3.26, n=150 in late pregnancy; Mean 0.81, SD 1.36, n=150 at 0‐3 months postpartum; Mean 0.35, SD 0.84, n=150 at > 3‐6 months postpartum | Mean 4.66, SD 3.32, n=150 in late pregnancy; Mean 1.54, SD 1.59, n=150 at 0‐3 months postpartum; Mean 0.86, SD 1.14, n=150 at > 3‐6 months postpartum | Late pregnancy, mean difference ‐1.22 (95% CI ‐1.96 to ‐0.48); 0‐3 months postpartum, mean difference ‐0.73 (95% CI ‐1.06 to ‐0.40); > 3‐6 months postpartum, mean difference ‐0.51 (95% CI ‐0.74 to ‐0.28) |
| Ko 2011 | IIQ7 (0‐100) | Mean 3.77, SD 6.01, n=150 in late pregnancy; Mean 1.73, SD 3.57, n=150 at 0‐3 months postpartum; Mean 0.77, SD 2.07, n=150 at > 3‐6 months postpartum | Mean 5.28, SD 5.16, n=150 in late pregnancy; Mean 5.28, SD 5.61, n=150 at 0‐3 months postpartum; Mean 1.56, SD 2.20, n=150 at > 3‐6 months postpartum | Late pregnancy, mean difference ‐1.51 (95% CI ‐2.78 to ‐0.24); 0‐3 months postpartum, mean difference ‐3.55 (95% CI ‐4.61 to ‐2.49); > 3‐6 months postpartum, mean difference ‐0.79 (95% CI ‐1.27 to ‐0.31) |
| Ko 2011 | ||||
| Ko 2011 | ||||
| Ko 2011 | ||||
| Ko 2011 | ||||
| Ko 2011 | ||||
| Ko 2011 | ||||
| PFMT versus usual care | ||||
| Fritel 2015 | Female Pelvic Floor Questionnaire (FPFQ) bladder score (0‐10; 10 worse) | Mean 1.7, SD 1.3, n=112 in late pregnancy; Mean 0.8, SD 0.9, n=105 at 0‐3 months postpartum; Mean 0.9, SD 1.1, n=94 at > 6‐12 months postpartum | Mean 2.0, SD 1.4, n=111 in late pregnancy; Mean 0.9, SD 1.0, n=107 at 0‐3 months postpartum; Mean 1.0, SD 1.1, n=97 at > 6‐12 months postpartum | Late pregnancy, mean difference ‐0.30 (95% CI ‐0.65 to 0.05); 0‐3 months postpartum, mean difference ‐0.10 (95% CI ‐0.36 to 0.16); >6‐12 months postpartum, mean difference ‐0.10 (95% CI ‐0.41 to ‐0.12) |
| Fritel 2015 | FPFQ bowel score (0‐10) | Mean 1.3, SD 1.1, n=112 in late pregnancy; Mean 1.2, SD 1.2, n=104 at 0‐3 months postpartum; Mean 1.0, SD 1.0, n=94 at > 6‐12 months postpartum | Mean 1.4, SD 1.1, n=112 in late pregnancy; Mean 1.4, SD 1.2, n=107 at 0‐3 months postpartum; Mean 1.1, SD 1.0, n=97 > 6‐12 months postpartum | Late pregnancy, mean difference ‐0.10 (95% CI ‐0.39 to ‐0.19); 0‐3 months postpartum, mean difference ‐0.20 (95% CI ‐0.52 to 0.12); >6‐12 months postpartum, mean difference ‐0.10 (95% CI ‐0.38 to 0.18) |
| Fritel 2015 | FPFQ prolapse score (0‐10) | Mean 0.7, SD 1.2, n=112 in late pregnancy; Mean 0.3, SD 1.1, n=104 at 0‐3 months postpartum; Mean 0.4, SD 1.2, n=95 at > 6‐12 months postpartum | Mean 0.7, SD 1.4, n=112 in late pregnancy; Mean 0.5, SD 1.3, n=107 at 0‐3 months postpartum; Mean 0.4, SD 1.0, n=97 at > 6‐12 months postpartum | Late pregnancy, mean difference 0.00 (95% CI ‐0.34 to 0.34); 0‐3 months postpartum, mean difference ‐0.20 (95% CI ‐0.52 to 0.12); >6‐12 months postpartum, mean difference 0.00 (95% CI ‐0.31 to 0.31) |
| Fritel 2015 | Female Pelvic Floor Questionnaire sex score (0‐10; 10 worse) | Mean 2.7, SD 1.8, n=79 in late pregnancy; Mean 3.1, SD 2.1, n=73 at 0‐3 months postpartum; Mean 2.4, SD 1.8, n=86 at > 6‐12 months postpartum | Mean 3.1, SD 2.1, n=68 in late pregnancy; Mean 3.5, SD 2.2, n=77 at 0‐3 months postpartum; Mean 2.7, SD 2.0, n=83 at > 6‐12 months postpartum | Late pregnancy, mean difference ‐0.90 (95% CI ‐1.54 to ‐0.26); 0‐3 months postpartum, mean difference ‐0.40 (95% CI ‐1.09 to 0.29); >6‐12 months postpartum, mean difference ‐0.30 (95% CI ‐0.87 to 0.27) |
| Fritel 2015 | Contilife score (0‐10; 10 better) | Mean 9.3, SD 1.1, n=108 in late pregancy; Mean 9.6, SD 0.8, n=102 at 0‐3 months postpartum; Mean 9.5, SD 1.2, n=91 at > 6‐12 months postpartum | Mean 9.2, SD 1.3, n=109 in late pregancy; Mean 9.5, SD 0.8, n=101 at 0‐3 months postpartum; Mean 9.5, SD 1.0, n=89 at > 6‐12 months postpartum | Late pregnancy, mean difference 0.10 (95% CI ‐0.22 to 0.42); 0‐3 months postpartum, mean difference 0.10 (95% CI ‐0.12 to 0.32); >6‐12 months postpartum, mean difference 0.00 (95% CI ‐0.32 to 0.32) |
| Fritel 2015 | Sexually active | 83 of 112 at end of pregnancy; 74 of 104 at 0‐3 months postpartum; 89 of 95 at > 6‐12 months postpartum | 70 of 112 at end of pregnancy; 79 of 106 at 0‐3 months postpartum; 91 of 97 at > 6‐12 months postpartum | Late pregnancy, relative risk 1.19 (95% CI 0.99 to 1.42); 0‐3 months postpartum, relative risk 0.95 (95% CI 0.81 to 1.13); >6‐12 months postpartum, relative risk 1.0 (95% CI 0.93 to 1.07) |
| Fritel 2015 | EuroQoL‐5D (0‐100; 100 better) | Mean 76.4, SD 20.4, n=111 at end of pregnancy; Mean 82.8, SD 18.2, n=105 at 0‐3 months postpartum; Mean 86.8, SD 13.1, n=94 at > 6‐12 months postpartum | Mean 77.9, SD 16.3, n=112 at end of pregnancy; Mean 80.4, SD 17.0, n=107 at 0‐3 months postpartum; Mean 82.9, SD 14.8, n=97 at > 6‐12 months postpartum | Late pregnancy, mean difference ‐1.50 (95% CI ‐6.35 to 3.35); 0‐3 months postpartum, mean difference 2.40 (95% CI ‐2.34 to 7.14); >6‐12 months postpartum, mean difference 3.90 (95% CI ‐0.06 to 7.86) |
| Fritel 2015 | ||||
| Hughes 2001 | ||||
| Hughes 2001 | BFLUTs questionnaire: a negative effect on exercise in response to question "does incontinence affect physical activity?" | 47 of 585 at 6 months postpartum | 41 of 584 at 6 months postpartum | Relative risk 1.14 (95% CI 0.76 to 1.71) |
| Hughes 2001 | ||||
| Hughes 2001 | ||||
| Hughes 2001 | ||||
| Hughes 2001 | ||||
| Hughes 2001 | ||||
| Hughes 2001 | ||||
| Miquelutti 2013 | State Trait Anxiety Inventory (STAI) (20‐80; 50‐64 high; 65‐80 very high) | Trait anxiety 18 of 85 State anxiety 16 of 85 | Trait anxiety 20 of 76 State anxiety 14 of 76 | Trait anxiety, relative risk 0.80 (95% CI 0.46 to 1.40) State anxiety, relative risk 1.02 (95% CI 0.53 to 1.95) |
| Miquelutti 2013 | ||||
| Miquelutti 2013 | ||||
| Miquelutti 2013 | ||||
| Miquelutti 2013 | ||||
| Miquelutti 2013 | ||||
| Miquelutti 2013 | ||||
| Miquelutti 2013 | ||||
| Mørkved 2003 | Sexual satisfaction at 6 years post‐delivery | 34 of 94 | 17 of 94 | Relative risk 2.00 (95% CI 1.20 to 3.32) |
| Mørkved 2003 | ||||
| Mørkved 2003 | ||||
| Mørkved 2003 | ||||
| Mørkved 2003 | ||||
| Mørkved 2003 | ||||
| Mørkved 2003 | ||||
| Mørkved 2003 | ||||
| Stafne 2012 | Psychological General Well‐being Index (PGWBI) (0‐110; 110 better) | Total score at end of pregnancy: Mean 79.5 (95% CI 78.5 to 80.6), n=389 | Total score at end of pregnancy: Mean 78.5 (95% CI 77.5 to 79.6), n=361 | Mean difference 0.71 (95% CI ‐0.60 to 2.01) |
| Stafne 2012 | ||||
| Stafne 2012 | ||||
| Stafne 2012 | ||||
| Stafne 2012 | ||||
| Stafne 2012 | ||||
| Stafne 2012 | ||||
| Stafne 2012 | ||||
| PFMT versus unspecified control | ||||
| Dokmeci 2008 | UDI‐6 | No data | No data | Authors stated that there was a significant decrease in scores between first trimester and third trimester and between third trimester and 6 weeks postpartum |
| Dokmeci 2008 | IIQ‐7 | No data | No data | Authors stated that there were no significant differences observed during pregnancy or postpartum |
| Dokmeci 2008 | PISQ‐12 | No data | No data | Authors stated that there were no significant differences observed during pregnancy or postpartum |
| Dokmeci 2008 | ||||
| Dokmeci 2008 | ||||
| Dokmeci 2008 | ||||
| Dokmeci 2008 | ||||
| Dokmeci 2008 | ||||
Comparison 3 Antenatal pelvic floor muscle training (PFMT) versus control for (mixed) prevention or treatment of incontinence, Outcome 18 Quality of life and health status measures.
| Study | Measure | PFMT | Control | Difference |
| PFMT versus no PFMT | ||||
| Assis 2015 | Perinometry, vaginal squeeze pressure (cm water), late pregnancy | Mean 9.45, SD 1.05, n=58 | Mean 4.7, SD 1.7, n=29 | Mean difference 4.75 (95% CI 4.07 to 5.43) |
| Assis 2015 | ||||
| PFMT versus usual care | ||||
| Fritel 2015 | Pelvic floor muscle strength, modified Oxford scale (0‐5; 5 better) | Mean 3.5, SD 1.5, n=105 at 2 months postpartum | Mean 3.3, SD 1.3, n=107 at 2 months postpartum | Mean difference 0.12 (95% CI ‐0.18 to 0.58) |
| Fritel 2015 | Change in pelvic floor muscle strength, baseline to 2 months postpartum | Mean 0.08, SD 1.32, n=101 | Mean ‐0.25, SD 1.11, n=103 | Mean difference 0.33 (95% CI ‐0.00 to 0.66) |
| Mørkved 2003 | Vaginal squeeze pressure (cm water) | Mean 29.5, 95% CI 26.8 to 32.2, n=143 at 3 months postpartum | Mean 25.6, 95% CI 23.2 to 27.9, n=146 at 3 months postpartum | Mean difference 3.90 (95% CI 0.35 to 7.45) |
| Mørkved 2003 | ||||
| PFMT versus unspecified control | ||||
| Dokmeci 2008 | Electromyography with vaginal electrode | No data | No data | Authors stated that "Maximum pelvic floor strength was increased significantly between first and third visits in PFMT group, p=0.03 and between first and post‐partum visits in control group, p=0.03." |
| Dokmeci 2008 | ||||
Comparison 3 Antenatal pelvic floor muscle training (PFMT) versus control for (mixed) prevention or treatment of incontinence, Outcome 19 Pelvic floor muscle function.

Comparison 3 Antenatal pelvic floor muscle training (PFMT) versus control for (mixed) prevention or treatment of incontinence, Outcome 20 Delivery outcome: caesarean section.
| Study | Outcome measure | PFMT data | Control data | Difference |
| PFMT versus no PFMT | ||||
| Ko 2011 | Episiotomy | 99 of 150 | 104 of 150 | Relative risk 0.95 (95% CI 0.81 to 1.11) |
| Ko 2011 | Severe perineal lacerations | 10 of 150 | 10 of 150 | |
| Ko 2011 | ||||
| PFMT versus usual care | ||||
| Fritel 2015 | Spontaneous vaginal delivery | 72 of 137 | 72 of 135 | Relative risk 0.99 (95% CI 0.79 to 1.23) |
| Fritel 2015 | Assisted delivery | 29 of 137 | 35 of 135 | Relative risk 0.82 (95% CI 0.53 to 1.26) |
| Fritel 2015 | ||||
| Miquelutti 2013 | Vaginal delivery | 44 of 76 | 38 of 71 | Relative risk 1.08 (95% CI 0.81 to 1.44) |
| Miquelutti 2013 | Duration active phase labour (min) | Mean 284.5, SD 175, n=78 | Mean 254.2, SD 139.4, n=71 | Mean difference 30.3 (95% CI ‐40.9 to 101.4) |
| Miquelutti 2013 | Duration 2nd stage labour (min) | Mean 29.2, SD 23.3, n=78 | Mean 19.7, SD 13.0, n=71 | Mean difference 9.48 (95% CI 0.32 to 18.64) |
| Mørkved 2003 | Type of delivery (excluding twin pregnancy, preterm delivery, planned caesarean section and induced labour) | 91 normal vaginal deliveries, 15 asssisted vaginal deliveries, 5 emergency caesarean section, n=111 | 91 normal vaginal deliveries, 19 assisted vaginal deliveries, 3 emergency caesarean section, n=113 | Relative risk for normal vaginal delivery 1.02 (95% CI 0.90 to 1.15) Relative risk for assisted vaginal delivery 0.80 (95% CI 0.43 to 1.50) |
| Mørkved 2003 | Perineal trauma | 56 with episiotomy, and 7 with third or fourth degree tears, n=111 | 72 with episiotomy, and 9 with third or fourth degree tears, n=113 | Relative risk for episiotomy 0.79 (95% CI 0.63 to 1.00) |
| Mørkved 2003 | Duration 2nd stage labour (min) | Mean 40, 95% CI 33 to 47, n=111 | Mean 45, 95% CI 38 to 52, n=113 | Mean difference ‐5.00 (95% CI ‐14.79 to 4.79) |
| Stafne 2012 | Assisted vaginal delivery | 62 of 426 | 50 of 425 | Relative risk 1.24 (95% CI 0.87 to 1.75) |
| Stafne 2012 | Mean duration labour (min) | Mean 289, n=426? | Mean 281, n=425? | Unable to estimate |
| Stafne 2012 | Mean duration active 2nd stage labor (min) | Mean 32, n=426? | Mean 29, n=425? | Unable to estimate |
Comparison 3 Antenatal pelvic floor muscle training (PFMT) versus control for (mixed) prevention or treatment of incontinence, Outcome 21 Delivery outcome: other.
| Study | Measure | PFMT | Control | Difference |
| PFMT versus usual care | ||||
| Fritel 2015 | Additional postnatal pelvic floor muscle training | 50 of 92 at 12 months postpartum | 61 of 97 at 12 months postpartum | Relative risk 0.86 (95% CI 0.68 to 1.10) |
| Fritel 2015 | Medical visits since delivery | Mean 3.0, SD 2.5, n=84 at 12 months postpartum | Mean 3.0, SD 2.2, n=83 at 12 months postpartum | Mean difference 0.00 (95% CI ‐0.71 to 0.71) |
| PFMT versus unspecified control | ||||
| Frumenzio 2012 | Visual analogue scale patient satisfaction (0‐10) | Mean 7.6 | No data | Not able to calculate |
| Frumenzio 2012 | ||||
Comparison 3 Antenatal pelvic floor muscle training (PFMT) versus control for (mixed) prevention or treatment of incontinence, Outcome 22 Patient satisfaction and further treatment.

Comparison 4 Postnatal pelvic floor muscle training (PFMT) versus control for treatment of incontinence, Outcome 3 Urinary incontinence late‐postnatal period (> 6‐12 months).

Comparison 4 Postnatal pelvic floor muscle training (PFMT) versus control for treatment of incontinence, Outcome 5 Urinary incontinence long term (> 5‐10 years).

Comparison 4 Postnatal pelvic floor muscle training (PFMT) versus control for treatment of incontinence, Outcome 6 Urinary incontinence very long term (> 10 years).

Comparison 4 Postnatal pelvic floor muscle training (PFMT) versus control for treatment of incontinence, Outcome 9 Faecal incontinence late‐postnatal period (> 6‐12 months).

Comparison 4 Postnatal pelvic floor muscle training (PFMT) versus control for treatment of incontinence, Outcome 11 Faecal incontinence long term (> 5‐10 years).

Comparison 4 Postnatal pelvic floor muscle training (PFMT) versus control for treatment of incontinence, Outcome 12 Faecal incontinence very long term (> 10 years).

Comparison 4 Postnatal pelvic floor muscle training (PFMT) versus control for treatment of incontinence, Outcome 13 Incontinence‐specific quality of life.
| Study | Measure of | Outcome measure | PFMT data | Control data | Difference |
| PFMT versus no PFMT | |||||
| Dumoulin 2004 | Frequency of leakage | Not measured | |||
| Dumoulin 2004 | Amount of leakage | Change, in grams, in 20 min pad test with standardised bladder volume | A: Median change 19.0, interquartile range 6.0 to 25.0, n=23 after 9 weeks of PFMT B: Median change 8, interquartile range 4.0 to 2.35, n=20 after 9 weeks of PFMT | Median change 0, interquartile range ‐3.0 to 9.8, n=19 after 9 weeks of control condition | Not calculable |
| Dumoulin 2004 | Other leakage | Change in visual analogue scale for perceived burden of incontinence (Stach‐Lempinen et al 2001) | A: Median change 3.0, interquartile range 2.0 to 4.0, n=23 after 9 weeks of PFMT B: Median change 2.5, interquartile range 0.8 to 5.0, n=20 after 9 weeks of PFMT | Median change 0, interquartile range ‐0.1 to 0.02, n=19 after 9 weeks of control condition | Not calculable |
| PFMT versus usual care | |||||
| Ahlund 2013 | Incontinence score (0‐20, 20 worse) | ICIQ‐FLUTS | Median 4.0, range 0 to 15, n=40 at 9 months postpartum | Median 4, range 0 to 12, n=42 at 9 months postpartum | Not calculable |
| Ahlund 2013 | Voiding score (0‐12, 12 worse) | ICIQ‐FLUTS | Median 1.0, range 0 to 5, n=40 at 9 months postpartum | Median 0.0, range 0 to 8, n=42 at 9 months postpartum | Not calculable |
| Ahlund 2013 | Incontinence score (0‐20, 20 worse) | ICIQ‐FLUTS | Median 4.0, range 0 to 15, n=40 at 9 months postpartum | Median 4, range 0 to 12, n=42 at 9 months postpartum | Not calculable |
| Glazener 2001 | Frequency of leakage | Not measured | |||
| Glazener 2001 | Amount of leakage | Using absorbent pads | 41 of 276 at 12 months postpartum | 55 of 245 at 12 months postpartum | Relative risk 0.66 (95% CI 0.46, 0.95) |
| Glazener 2001 | Other leakage severity | Visual analogue scale for severity of urine leakage | Mean 2.8, 95% CI 2.4 to 3.1, n=142 at 12 months postpartum | Mean 3.6, 95% CI 3.1 to 4.0, n=142 at 12 months postpartum | Mean difference ‐0.80 (95% CI ‐1.37 to ‐0.23) |
| Kim 2012 | Urinary symptoms (? range) | BFLUTS | Mean 40.56, SD 5.36, n=9 at between 8‐14 weeks postpartum | Mean 46.89, SD 3.62, n=9 at between 8‐14 weeks postpartum | |
| Kim 2012 | |||||
| Kim 2012 | |||||
| Wilson 1998 | Frequency of leakage | Not measured | |||
| Wilson 1998 | Amount of leakage | Urine loss on home pad test (Wilson et al 1989), in grams | Mean 2.1, 95% CI ‐0.3 to 4.5, n=18 at 12 months postpartum | Mean 2.6, 95% CI 0.1 to 5.1, n=82 at 12 months postpartum | Mean difference ‐0.50 (95% CI ‐3.81 to 2.81) |
| Wilson 1998 | Other leakage severity | Not measured | |||
Comparison 4 Postnatal pelvic floor muscle training (PFMT) versus control for treatment of incontinence, Outcome 14 Severity of incontinence.
| Study | Outcome measure | PFMT data | Control data | Difference |
| Dumoulin 2004 | Change in Urogenital Distress Inventory Score (maximum score 57) | A: Median change 4, interquartile range 1 to 10, n=23 after 9 weeks PFMT B: Median change 7, interquartile range 3 to 8, n=20 after 9 weeks PFMT | Median change 0, interquartile range ‐2.3 to 6.5, n=19 after 9 weeks of control condition | Not calculable |
| Dumoulin 2004 | Change in Incontinence Impact Questionnaire (maximum score 90) | A: Median change 10, interquartile range 2 to 16, n=23 after 9 weeks PFMT B: Median change 13, interquartile range 6 to 25, n=20 after 9 weeks PFMT | Median change 0.5, interquartile range ‐6.5 to 5.0, n=19 after 9 weeks of control condition | Not calculable |
| Glazener 2001 | Hospital Anxiety and Depression Score ‐ anxiety score | Mean 6.1, 95% CI 5.6 to 6.5, n=238 at 12 months | Mean 6.8, 95% CI 6.3 to 7.3, n=219 at 12 months postpartum | Mean difference ‐0.79 (95% CI ‐1.43 to ‐0.05) |
| Glazener 2001 | ||||
Comparison 4 Postnatal pelvic floor muscle training (PFMT) versus control for treatment of incontinence, Outcome 15 Quality of life and health status measures.
| Study | Outcome measure | PFMT data | Control data | Difference |
| PFMT versus no PFMT | ||||
| Dumoulin 2004 | Maximal strength (Newtons, pelvic floor dynamometer, Dumoulin et al 2003) | A: Median change 0.7, range ‐0.2 to 2.3, n=23 after 9 weeks PFMT B: Median change 0.5, range ‐0.6 to 2.5, n=20 after 9 weeks PFMT | Median change ‐0.5, range ‐1.7 to 1.0, n=19 after 9 weeks PFMT | Not calculable |
| Dumoulin 2004 | ||||
| Dumoulin 2004 | ||||
| PFMT versus usual care | ||||
| Ahlund 2013 | Maximal voluntary contraction (cm mercury, perineometer) | Median 26.0, estimated range 7 to 49, n=40 at 9 months postpartum | Median 18.2, estimated range 6 to 54, n=42 at 9 months postpartum | Not calculable |
| Ahlund 2013 | Endurance (secs, continuous contraction until pressure=0) | Median 26.7, estimated range 1 to 65, n =40 at 9 months postpartum | Median 23.4, estimated range 3 to 60, n=42 at 9 months postpartum | Not calculable |
| Ahlund 2013 | Oxford scale (0‐5, 0=no activity; 5, strong) | Median 4, estimated range 2 to 5, n=40 at 9 months postpartum | Median 3, estimated range 2 to 5, n=42 at 9 months postpartum | Not calculable |
| Kim 2012 | Maximal squeeze pressure (mm mercury, perineometer) | Mean 25.78, SD 10.74, n= 9 at between 8‐14 weeks postpartum | Mean 8.11, SD 2.57, n=9 at between 8‐14 weeks postpartum | Mean difference 17.67 (95% CI 10.46 to 24.88) |
| Kim 2012 | Holding time (sec, perineometer) | Mean 14.34, SD 3.08, n=9 at between 8‐14 weeks postpartum | Mean 8.89, SD 2.10, n=9 at between 8‐14 weeks postpartum | Mean difference 5.45 (95% CI 3.01 to 7.89) |
| Kim 2012 | ||||
| Wilson 1998 | Maximal vaginal squeeze pressure (cm water) | Mean 13.6, 95% CI 9.8 to 17.4, n=19 at 12 months postpartum | Mean 13.1, 95% CI 11.3 to 14.9, n=79 at 12 months postpartum | Mean difference 0.50 (95%CI ‐3.46 to 4.46) |
| Wilson 1998 | ||||
| Wilson 1998 | ||||
Comparison 4 Postnatal pelvic floor muscle training (PFMT) versus control for treatment of incontinence, Outcome 16 Pelvic floor muscle function.

Comparison 5 Postnatal pelvic floor muscle training (PFMT) versus control for (mixed) prevention or treatment of incontinence, Outcome 2 Urinary incontinence mid‐postnatal period (> 3‐6 months).

Comparison 5 Postnatal pelvic floor muscle training (PFMT) versus control for (mixed) prevention or treatment of incontinence, Outcome 3 Urinary incontinence late postnatal period (> 6‐12 months).

Comparison 5 Postnatal pelvic floor muscle training (PFMT) versus control for (mixed) prevention or treatment of incontinence, Outcome 6 Faecal incontinence early postnatal period (0‐3 months).

Comparison 5 Postnatal pelvic floor muscle training (PFMT) versus control for (mixed) prevention or treatment of incontinence, Outcome 8 Faecal incontinence late‐postnatal period (> 6‐12 months).
| Study | Measure of | Outcome measure | PFMT data | Control data | Difference |
| PFMT versus usual care | |||||
| Hilde 2013 | Amount of leakage | Pad test, 1 min with standardised bladder volume (positive test 2g or more) | Median 4.0, range 2.0 to 80.0, n=87 at 6 months postpartum | Median 6.0, range 2.0 to 114.0, n=88 at 6 months postpartum | Mann Whitney‐U 213.5, z‐value ‐0.13, p‐value 0.90 |
| Hilde 2013 | |||||
| Hilde 2013 | |||||
| Liu 2011 | Urinary condition score, not specified (lower score better; 3 months postpartum) | Mean 2.2, SD 0.2, n=106 | Mean 2.8, SD 0.4, n=86 | Mean difference ‐0.60 (95% CI ‐0.69 to ‐0.51) | |
| Liu 2011 | Urinary condition score, not specified (lower score better; 6 months postpartum) | Mean 2.0, SD 0.4, n=106 | Mean 2.5, SD 0.4, n =86 | Mean difference ‐0.50 (95% CI ‐0.61 to ‐0.39) | |
| Liu 2011 | |||||
| Sleep 1987 | Frequency of leakage | Urine leakage once or more per week | 64 of 816 at 3 months postpartum | 57 of 793 at 3 months postpartum | Relative risk 1.09 (95% CI 0.77 to 1.54) |
| Sleep 1987 | Amount of leakage | Using absorbent pads sometimes or always | 38 of 815 at 3 months postpartum | 43 of 793 at 3 months postpartum | Relative risk 0.86 (95% CI 0.56 to 1.32) |
| Sleep 1987 | Other leakage severity | Not measured | |||
| Wen 2010 | Stress UI | Criteria from International Continence Society, 0‐5 (lower score better; 6 months postpartum) | Mean 2.84, SD 0.43, n=75 | Mean 2.50, SD 0.41, n=73 | Mean difference 0.34 (95% CI 0.20 to 0.48) |
| Wen 2010 | Stress UI | Criteria from International Continence Society, 0‐5 (lower score better; 12 months postpartum) | Mean 1.16, SD 0.38, n=75 | Mean 2.20, SD 0.39, n=73 | Mean difference ‐1.04 (95% CI ‐1.16 to ‐0.92) |
| Wen 2010 | Amount of leakage | Pad test (postive test more than 2g) | 7 of 75 at 12 months postpartum | 19 of 73 at 6 months postpartum | Relative risk 0.29 (95% CI 0.11 to 0.75) |
Comparison 5 Postnatal pelvic floor muscle training (PFMT) versus control for (mixed) prevention or treatment of incontinence, Outcome 11 Severity of incontinence.
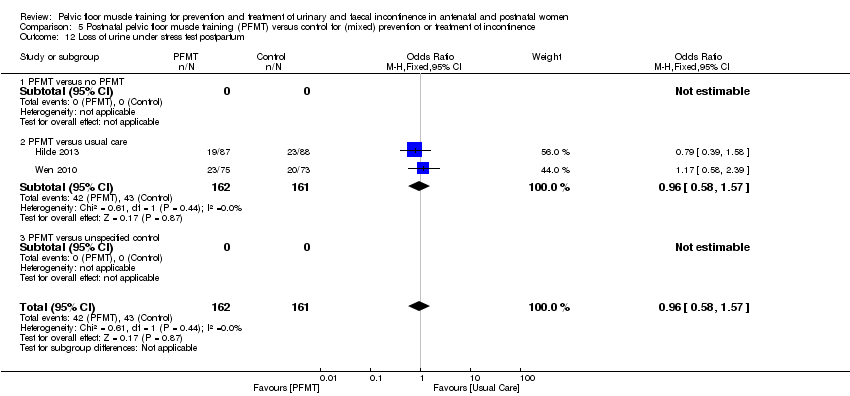
Comparison 5 Postnatal pelvic floor muscle training (PFMT) versus control for (mixed) prevention or treatment of incontinence, Outcome 12 Loss of urine under stress test postpartum.
| Study | Measure of | Outcome measure | PFMT data | Control data | Difference |
| PFMT versus no PFMT | |||||
| Meyer 2001 | Sexual function | Reduced vaginal response at 10 months postpartum | 5 of 51 | 13 of 56 | Relative risk 0.42 (95% CI 0.16 to 1.10) |
| Meyer 2001 | |||||
| Meyer 2001 | |||||
| PFMT versus usual care | |||||
| Peirce 2013 | Faecal Incontinence Specific Quality of Life | Rockwood Faecal Incontinence Quality of Life Scale (low better, no total score, 4 domain scores) | Lifestyle: no data; coping/behaviour: no data, depression/self perception: no data, embarrassment: no data, n=30 | Lifestyle: no data, coping/behaviour: no data, depression/self perception: no data, embarrassment: no data, n=90 | Lifestyle p =0.29, coping/behaviour p=0.27, depression/self perception p=089, embarrassment p=0.51 |
| Peirce 2013 | |||||
| Peirce 2013 | |||||
| Sleep 1987 | General wellbeing | 5 point Likhert scale in response to question "how are you feeling generally?" | 11 feeling not very well or not at all well, n=816 at 3 months postpartum | 18 feeling not very well or not at all well, n=793 at 3 months postpartum | Not calculated as validity/reliability of this measure not known |
| Sleep 1987 | Sexual function | Attempted sexual intercourse within 3 months of delivery | 714 of 819 | 681 of 792 | Relative risk 1.01 (95% CI 0.98 to 1.05) |
| Sleep 1987 | Sexual function | Dyspareunia at 3 months postpartum | 167 of 819 | 154 of 792 | Relative risk 1.05 (95% CI 0.86 to 1.28) |
Comparison 5 Postnatal pelvic floor muscle training (PFMT) versus control for (mixed) prevention or treatment of incontinence, Outcome 13 Quality of life and health status measures.
| Study | Outcome measure | PFMT data | Control data | Difference |
| PFMT versus no PFMT | ||||
| Meyer 2001 | Strength, vaginal squeeze pressure, in cm water (manometer, 10 months postpartum) | Mean 33, SD 22, n=51 | Mean 41, SD 27, n=56 | Mean difference ‐8.0 (95%CI ‐17.3 to 1.3) |
| Meyer 2001 | Mean anal squeeze pressure, in cm water (anorectal manometer, 10 months postpartum) | Mean 36, SD 20, n=51 | Mean 43, SD 24, n=56 | Mean difference ‐7.0 (95%CI ‐15.4 to 1.4) |
| Meyer 2001 | ||||
| PFMT versus usual care | ||||
| Hilde 2013 | Resting pressure, vaginal squeeze pressure (cm water, manometer) | n=87 at 6 months postpartum | n=88 at 6 months postpartum | Mean difference 1.3 (95% CI ‐1.0 to 3.6, p=0.257), reported by authors |
| Hilde 2013 | Strength, vaginal squeeze pressure (cm water, manometer) | n=87 at 6 months postpartum | n=88 at 6 months postpartum | Mean difference 3.3 (95% CI ‐1.4 to 8.0, p=0.172), reported by authors |
| Hilde 2013 | Endurance, vaginal squeeze pressure (cm sec, manometer) | n=87 at 6 months postpartum | n=88 at 6 months postpartum | Mean difference 29.8 (95% CI ‐10.6 to 70.2, p=0.148), reported by authors |
| Kou 2013 | Resting pressure, vaginal squeeze pressure (cm water) | Mean 33.7, SD 15.8, n=80 at 12 months postpartum | Mean 30.1, SD 15.3, n=70 at 12 months postpartum | Mean difference 3.60 (95% CI ‐1.38 to 8.58) |
| Kou 2013 | Vaginal squeeze pressure (cm water) | Mean 86.5, SD 14.8, n=80 at 12 months postpartum | Mean 60.4, SD 14.1, n=70 at 12 months postpartum | Mean difference 26.10 (95% CI 21.47 to 30.73) |
| Kou 2013 | Contraction time (sec) | Mean 5.9, SD 2.9, n=80 at 12 months postpartum | Mean 4.1, SD 2.6, n=70 at 12 months postpartum | Mean difference 1.80 (95% CI 0.92 to 2.68) |
| Liu 2011 | PF muscle tension (Oxford scale) | Mean 3.95, SD 0.32, n=106 at 3 months postpartum | Mean 3.02, SD 0.28, n=86 at 3 months postpartum | Mean difference 0.93 (95% CI 0.34 to 1.52) |
| Liu 2011 | PF muscle tension (Oxford scale) | Mean 4.73, SD 0.35, n=106 at 6 months postpartum | Mean 3.25, SD 0.41, n=86 at 6 months postpartum | Mean difference 1.48 (95% CI 1.37 to 1.59) |
| Liu 2011 | PF muscle tension (Oxford scale) | Mean 4.82, SD 0.38, n=106 at 12 months postpartum | Mean 3.43, SD 0.39, n=86 at 12 months postpartum | Mean difference 1.40 (95% CI 1.29 to 1.51) |
| Peirce 2013 | Mean anal resting pressure (mm Hg, anorectal manometer) | Mean 39, SD 13, n=30 at 3 months postpartum | Mean 43, SD 17, n=90 at 3 months postpartum | Mean difference ‐4.00 (95% CI ‐9.83 to 1.83) |
| Peirce 2013 | Mean anal squeeze pressure (mm Hg, anorectal manometer) | Mean 64, SD 17, n=30 at 3 months postpartum | Mean 62, SD 23, n=90 at 3 months postpartum | Mean difference 2.00 (95% CI ‐5.72 to 9.72) |
| Peirce 2013 | ||||
| Wen 2010 | PFMS (Oxford scale) | Mean 3.34, SD 0.35, n=75 at 6 months postpartum | Mean 3.25, SD 0.41, n=73 at 6 months postpartum | Mean difference 0.09 (95% CI ‐0.03 to 0.21) |
| Wen 2010 | PFMS (Oxford scale) | Mean 4.56, SD 0.38, n=75 at 12 months postpartum | Mean 3.46, SD 0.39, n=73 at 12 months postpartum | Mean difference 1.10 (95% CI 0.98 to 1.22) |
| Wen 2010 | ||||
Comparison 5 Postnatal pelvic floor muscle training (PFMT) versus control for (mixed) prevention or treatment of incontinence, Outcome 14 Pelvic floor muscle function.
| Study | Measure | PFMT | Control | Difference |
| PFMT versus usual care | ||||
| Hilde 2013 | ICIQ‐Vag, bulging inside vagina (yes, no) | 8 of 87 at 6 months postpartum | 22 of 88 at 6 months postpartum | Mean difference 0.37 (95% CI 0.17 to 0.78) |
| Hilde 2013 | ICIQ‐Vag, bulging outside vagina (yes, no) | 5 of 87 at 6 months postpartum | 6 of 88 at 6 months postpartum | Mean difference 0.84 (95% CI 0.27 to 2.66) |
| Hilde 2013 | POP‐Q, stage 1 or 2 | 61 of 87 at 6 months postpartum | 64 of 88 at 6 months postpartum | Mean difference 0.88 (95% CI 0.46 to 1.70) |
Comparison 5 Postnatal pelvic floor muscle training (PFMT) versus control for (mixed) prevention or treatment of incontinence, Outcome 15 Pelvic organ prolapse symptoms.
| Antenatal pelvic floor muscle training compared to control for prevention of urinary and faecal incontinence | ||||||
| Patient or population: pregnant women who were continent when randomised Setting: hospital or outpatient settings in Canada, Italy, Mexico, Norway, Spain, Thailand, Turkey, UK and USA Intervention: antenatal PFMT Comparison: control (no PFMT or usual care) | ||||||
| Outcomes | Anticipated absolute effects* (95% CI) | Relative effect | No of participants | Quality of the evidence | Comments | |
| Risk with control | Risk with antenatal PFMT | |||||
| Urinary incontinence in late pregnancy | Study population | RR 0.38 | 624 | ⊕⊕⊝⊝ | Upper and lower limits of the CI of summary statistic suggest clinical importance. | |
| 421 per 1000 | 160 per 1000 | |||||
| Urinary incontinence mid‐postnatal period (> 3‐6 months) | Study population | RR 0.71 | 673 | ⊕⊕⊕⊝ | Risk reduction is a clinically important effect but the upper limit of the CI is close to no effect. | |
| 251 per 1000 | 179 per 1000 | |||||
| Urinary incontinence late postnatal period (> 6‐12 months) | Study population | RR 1.20 | 44 | ⊕⊕⊝⊝ | Wide CI including no effect. | |
| 440 per 1000 | 528 per 1000 | |||||
| Faecal incontinence in late pregnancy | Study population | ‐ | (0 studies) | ‐ | Not reported. | |
| ‐ | ‐ | |||||
| Faecal incontinence mid‐postnatal period (> 3‐6 months) | Study population | ‐ | (0 studies) | ‐ | Not reported. | |
| ‐ | ‐ | |||||
| Faecal incontinence late postnatal period (> 6‐12 months) | Study population | ‐ | (0 studies) | ‐ | Not reported. | |
| ‐ | ‐ | |||||
| Incontinence‐specific quality of life | Mean 2.66, SD 4.1 | Mean 0.24, SD 1.2 | MD 2.42 lower | 152 | ⊕⊕⊕⊝ | Measured in late postnatal period. Upper and lower limits of the CI of summary statistic suggest clinical importance in ICIQ‐SF (Nyström 2015). |
| *The risk in the intervention group (and its 95% confidence interval) is based on the assumed risk in the comparison group and the relative effect of the intervention (and its 95% CI). CI: confidence interval; ICIQ‐SF: International Consultation on Incontinence ‐ Short Form; MD: mean difference; PFMT: pelvic floor muscle training; RCT: randomised controlled trial; RR: risk ratio; SD: standard deviation. | ||||||
| GRADE Working Group grades of evidence | ||||||
| 1Downgraded two levels for serious inconsistency and imprecision (multiple small RCTs, fewer than 300 events, heterogeneous intervention and control groups). 2Downgraded one level for serious imprecision (multiple small RCTs, fewer than 300 events). 3Downgraded two levels for very serious imprecision (single, small trial with wide confidence interval). 4Downgraded one level for serious imprecision (single trial, fewer than 300 events). The outcome measures relate to the presence of incontinence symptoms rather than absence. Symptoms of urinary and faecal incontinence were measured based on self‐report. | ||||||
| Antenatal pelvic floor muscle training compared to control for treatment of urinary and faecal incontinence | ||||||
| Patient or population: pregnant women who were incontinent when randomised Setting: health services or obstetric clinics in Brazil, Canada, the Netherlands and Turkey Intervention: antenatal PFMT Comparison: control (usual care) | ||||||
| Outcomes | Anticipated absolute effects* (95% CI) | Relative effect | No of participants | Quality of the evidence | Comments | |
| Risk with control | Risk with antenatal PFMT | |||||
| Urinary incontinence in late pregnancy | Study population | RR 0.70 | 345 | ⊕⊝⊝⊝ | Wide CI including no effect. | |
| 776 per 1000 | 543 per 1000 | |||||
| Urinary incontinence mid‐postnatal period (> 3‐6 months) | Study population | RR 0.94 | 187 | ⊕⊝⊝⊝ | Wide CL including no effect. | |
| 528 per 1000 | 496 per 1000 | |||||
| Urinary incontinence late postnatal period (> 6‐12 months) | Study population | RR 0.50 | 869 | ⊕⊝⊝⊝ | Wide CI including no effect. | |
| 232 per 1000 | 116 per 1000 | |||||
| Faecal incontinence in late pregnancy | Study population | ‐ | (0 studies) | ‐ | Not reported. | |
| ‐ | ‐ | |||||
| Faecal incontinence mid‐postnatal period (> 3‐6 months) | Study population | ‐ | (0 studies) | ‐ | Not reported. | |
| ‐ | ‐ | |||||
| Faecal incontinence late postnatal period (> 6‐12 months) | Study population | ‐ | (0 studies) | ‐ | Not reported. | |
| ‐ | ‐ | |||||
| Incontinence‐specific quality of life (ICIQ‐SF) | Mean 4.7, SD 5.6 | Mean 1.2, SD 2.5 | MD 3.5 lower | 41 | ⊕⊕⊝⊝ | MD suggests clinically important effect but the upper limit of the CI is close to no effect. |
| *The risk in the intervention group (and its 95% confidence interval) is based on the assumed risk in the comparison group and the relative effect of the intervention (and its 95% CI). CI: confidence interval; ICIQ‐SF: International Consultation on Incontinence ‐ Short Form; MD: mean difference; PFMT: pelvic floor muscle training; RCT: randomised controlled trial; RR: risk ratio; SD: standard deviation. | ||||||
| GRADE Working Group grades of evidence | ||||||
| 1Downgraded three levels due to serious risk of selection bias (one trial with heavy weighting in the pooled estimate at high risk), inconsistency and indirectness, and very serious imprecision (fewer than 300 events, wide confidence interval, two trials without any details about PFMT interventions). 2Downgraded three levels due to serious risk of selection bias, indirectness and imprecision (singe trial, fewer than 300 events, wide confidence interval, no details about PFMT interventions). 3Downgraded three levels due to very serious risk of selection bias, inconsistency and imprecision (fewer than 300 events, wide confidence interval) and serious indirectness (no details about the PFMT intervention in one trial with about half the weighting in the pooled estimate). 4Downgraded two levels due to serious indirectness and imprecision (single trial, fewer than 300 participants, wide confidence interval). The outcome measures relate to the presence of incontinence symptoms rather than absence. As this comparison addresses the effect of PFMT for treatment of existing continence symptoms, the data are "negative," that is continuing incontinence rather than cure. Symptoms of urinary and faecal incontinence were measured based on self‐report. | ||||||
| Antenatal pelvic floor muscle training compared to control for mixed prevention and treatment of urinary and faecal incontinence | ||||||
| Patient or population: pregnant women some of who were incontinent symptoms and some who were not when randomised Setting: health services, obstetric clinics or hospitals in Brazil, China, France, Italy, Norway, UK or USA Intervention: antenatal PFMT Comparison: control (no PFMT, usual care or unspecified control) | ||||||
| Outcomes | Anticipated absolute effects* (95% CI) | Relative effect | No of participants | Quality of the evidence | Comments | |
| Risk with control | Risk with antenatal PFMT | |||||
| Urinary incontinence in late pregnancy | Study population | RR 0.74 | 3164 | ⊕⊕⊝⊝ | RR suggests clinically important effect but the upper limit of the CI suggests lack of clinical importance. | |
| 575 per 1000 | 425 per 1000 | |||||
| Urinary incontinence mid‐postnatal period (> 3‐6 months) | Study population | RR 0.73 | 1921 | ⊕⊝⊝⊝ | RR suggests clinically important effect but the upper limit of the CI suggests lack of clinical importance. | |
| 363 per 1000 | 265 per 1000 | |||||
| Urinary incontinence late postnatal period (> 6‐12 months) | Study population | RR 0.85 | 244 | ⊕⊕⊝⊝ | RR suggests clinically important effect but the CI includes no effect. | |
| 448 per 1000 | 381 per 1000 | |||||
| Faecal incontinence in late pregnancy | Study population | RR 0.61 | 867 | ⊕⊕⊕⊝ | Wide CI including no effect. | |
| 43 per 1000 | 26 per 1000 | |||||
| Faecal incontinence mid‐postnatal period (> 3‐6 months) | Study population | ‐ | (0 studies) | ‐ | Not reported. | |
| ‐ | ‐ | |||||
| Faecal incontinence late postnatal period (> 6‐12 months) | Study population | ‐ | (0 studies) | ‐ | Not reported. | |
| ‐ | ‐ | |||||
| Incontinence‐specific quality of life late postnatal period (> 6‐12 months) (ICIQ‐SF) | Mean 2.1, SD 3.3 | Mean 1.9, SD 3.7 | MD 0.2 lower | 190 | ⊕⊕⊝⊝ | MD and CI suggest lack of clinically important effect. |
| *The risk in the intervention group (and its 95% confidence interval) is based on the assumed risk in the comparison group and the relative effect of the intervention (and its 95% CI). CI: confidence interval; ICIQ‐SF: International Consultation on Incontinence ‐ Short Form; MD: mean difference; PFMT: pelvic floor muscle training; RCT: randomised controlled trial; RR: risk ratio; SD: standard deviation. | ||||||
| GRADE Working Group grades of evidence | ||||||
| 1Downgraded two levels due to serious inconsistency (statistically significant heterogeneity) and indirectness (limited details about PFMT intervention in two trials with more than one‐quarter of the weighting in the pooled estimate). 2Downgraded three levels due to serious risk of selection bias (no information about random allocation concealment in three trials carrying more than 50% of weighting in the pooled estimate), serious imprecision (statistically significant heterogeneity) and serious indirectness (includes two trials carrying about 40% of the weighting in the pooled estimate with no information about PFMT intervention). 3Downgraded two levels due to serious indirectness (no information about PFMT in one trial with more than two‐thirds of the weighting in the pooled estimate) and serious imprecision (fewer than 300 event). 4Downgraded one level due to serious imprecision (single trial with fewer than 300 events). 5Downgraded two levels due to serious indirectness (single trial, no information about PFMT intervention) and serious imprecision (fewer than 300 events). The outcome measures relate to the presence of incontinence symptoms rather than absence. For those comparisons that addressed the effect of PFMT for treatment of existing continence symptoms, the data were "negative," that is continuing incontinence rather than cure. Symptoms of urinary and faecal incontinence were measured based on self‐report. | ||||||
| Postnatal pelvic floor muscle training compared to control for treatment of urinary and faecal incontinence | ||||||
| Patient or population: postnatal women who were incontinent when randomised Setting: health services or obstetric clinics in Canada, Republic of Korea, New Zealand and UK Intervention: postnatal PFMT Comparison: control (no PFMT or usual care) | ||||||
| Outcomes | Anticipated absolute effects* (95% CI) | Relative effect | No of participants | Quality of the evidence | Comments | |
| Risk with control | Risk with postnatal PFMT | |||||
| Urinary incontinence late postnatal period (> 6‐12 months) | Study population | RR 0.55 | 696 | ⊕⊝⊝⊝ | RR suggests clinically important effect but the CI includes no effect. | |
| 724 per 1000 | 398 per 1000 | |||||
| Faecal incontinence late postnatal period (> 6‐12 months) | Study population | RR 0.68 | 620 | ⊕⊝⊝⊝ | RR suggests clinically important effect but the CI includes no effect. | |
| 137 per 1000 | 93 per 1000 | |||||
| Incontinence‐specific quality of life | Mean 21.22, SD 2.11 | Mean 19.56, SD 1.88 | MD 1.66 lower | 18 | ⊕⊝⊝⊝ | Wide CI including no effect. |
| *The risk in the intervention group (and its 95% confidence interval) is based on the assumed risk in the comparison group and the relative effect of the intervention (and its 95% CI). BFLUTS: British Female Lower Urinary Tract Symptoms questionnaire; CI: confidence interval; MD: mean difference; PFMT: pelvic floor muscle training; RCT: randomised controlled trial; RR: risk ratio; SD: standard deviation. | ||||||
| GRADE Working Group grades of evidence | ||||||
| 1Downgraded three levels due to very serious risk of selection bias (two trials with 90% of weighting in pooled estimate at high risk) and inconsistency (statistically significant heterogeneity), and serious indirectness (two trials with 90% of weighting in pooled estimate provide insufficient information about the intervention). 2Downgraded three levels due to very serious risk of selection bias (two trials with 100% of weighting in pooled estimate at high risk), inconsistency (statistically significant heterogeneity) and imprecision (fewer than 300 events, wide confidence interval) and serious indirectness (neither trial provides sufficient information about the intervention). 3Downgraded three levels due to very serious risk of selection bias and imprecision (fewer than 300 events, wide confidence interval). The outcome measures relate to the presence of incontinence symptoms rather than absence. As this comparison addresses the effect of PFMT for treatment of existing continence symptoms, the data are "negative," that is continuing incontinence rather than cure. Symptoms of urinary and faecal incontinence were measured based on self‐report. | ||||||
| Postnatal pelvic floor muscle training compared to control for mixed prevention and treatment of urinary and faecal incontinence | ||||||
| Patient or population: postnatal women some of whom had incontinent symptoms and some of whom had not when randomised Setting: health services or hospitals in Australia, China and Switzerland Intervention: postnatal PFMT Comparison: control (no PFMT or usual care) | ||||||
| Outcomes | Anticipated absolute effects* (95% CI) | Relative effect | No of participants | Quality of the evidence | Comments | |
| Risk with control | Risk with postnatal PFMT | |||||
| Urinary incontinence late postnatal period (> 6‐12 months) | Study population | RR 0.88 | 826 | ⊕⊝⊝⊝ | Wide CI including no effect. | |
| 294 per 1000 | 212 per 1000 | |||||
| Faecal incontinence late postnatal period (> 6‐12 months) | Study population | RR 0.73 | 107 | ⊕⊝⊝⊝ | Wide CI including no effect. | |
| 54 per 1000 | 39 per 1000 | |||||
| Incontinence‐specific quality of life | Study population | ‐ | (0 studies) | ‐ | Not reported. | |
| ‐ | ‐ | |||||
| *The risk in the intervention group (and its 95% confidence interval) is based on the assumed risk in the comparison group and the relative effect of the intervention (and its 95% CI). CI: confidence interval; PFMT: pelvic floor muscle training; RCT: randomised controlled trial; RR: risk ratio. | ||||||
| GRADE Working Group grades of evidence | ||||||
| 1Downgraded three levels due to serious inconsistency (statistically significant heterogeneity) and imprecision (fewer than 300 events, wide confidence interval). 2Downgraded three levels due to very serious risk of selection bias and imprecision (fewer than 300 events, wide confidence interval) and serious indirectness (no information about the PFMT intervention). The outcome measures relate to the presence of incontinence symptoms rather than absence. For those comparisons that address the effect of PFMT for treatment of existing continence symptoms, the data are "negative," that is continuing incontinence rather than cure. Symptoms of urinary and faecal incontinence were measured based on self‐report. | ||||||
| Study ID | Voluntary pelvic floor muscle contraction confirmed? | PFMT parameters | PFMT supervision | Control comparison | Adherence | Notes |
| (treatment trial) | Vaginal palpation performed by study midwife: after randomisation and at each of the 3 visits to midwife (PFMT and control groups). | PFMT started with 3 fast contractions, followed by 3 sets of 8‐12 slow velocity, near maximal contractions, 6‐sec hold; 7 days per week for 6 months. Received written instructions on PFMT, but no information provided on PFMT progression. | Visit to the study midwife every 6th week (3 times during study period). | Usual care: written information describing PFM anatomy and PFMT. Received instructions on how to correctly perform PFM contraction (vaginal palpation) from midwife. | Women in the PFMT group were asked at each midwife visit how often they did PFMT; results not reported. | PFMT in lying or sitting positions. |
| (prevention trial) | Perineometry (at 1st meeting), but unclear by whom (PFMT group). | 5‐10 slow PFM contractions with 6‐sec hold, rest 6 sec between contractions with 3 rapid contractions at the end (as per Mørkved 2003). Daily PFMT in 4 positions, and 1 group (27 women) had 5 supervised sessions with a physiotherapist. Received manual of home PFMT exercises and asked to complete an exercise diary. | Supervised PFMT (27 women): received up to 5 monthly supervised exercise sessions with physiotherapist (22, 26, 30, 34, 38 weeks' gestation). Unsupervised PFMT (27 women): trained to perform PFMT by physiotherapist (1 session). | Did not receive intervention and did not exercise. | Not reported, although it stated that no dropouts occurred throughout the duration of the study due to all women in the PFMT group complying with the exercise protocol. | PFMT in a variety of positions including left side lying, sitting, reclined sitting, sitting with legs crossed, standing. Translation (Portuguese). |
| (prevention trial) | Not reported. | PFMT included in the 7‐ to 8‐min cool‐down period as part of a 35‐ to 45‐min exercise session, 3 days per week for duration of pregnancy (potential mean of 85 sessions in total). No specific details provided about PFMT programme. | Group exercise classes, supervised by a qualified fitness specialist, with the assistance of an obstetrician. | Not reported. | Adherence to PFMT was 90%. | General exercises targeted major muscles of arms and abdomen to promote good posture and prevent low back pain, and in the 3rd trimester strengthen the muscles of labour and PF. 1 session of aerobic dance per week. Accompanied by music. |
| (mixed prevention and treatment trial) | Participants did not have individual assessment of correct voluntary PFM contraction (due to pragmatic nature of study). Instructors were trained in how to explain a correct PFM contraction. | PFMT included as part of 15‐min strength training session within a 60‐min group exercise class. PFMT: 3 sets of 8‐12 maximal contractions, 6‐ to 8‐sec hold; strong verbal motivation to perform close to maximum PFM contractions. Women encouraged to participate in at least 2 out of 3 fitness classes per week for 12 weeks. Daily PFMT at home: 3 sets of 8‐12 close to maximum PFM contractions. Also encouraged to be physically active for at least 30 min per day. Received a specific PFMT brochure. | Group exercise classes, 2 or 3 per week for 12 weeks, led by certified aerobic instructors. Instructors were taught by a physiotherapist with > 20 years of experience in assessing, treating and researching women with PF dysfunction. | Usual antenatal care. | Mean adherence to exercise classes was 17.2 out of a possible 24 sessions. 40% (21/52) of women attended at least 80% of sessions. | PFMT integrated into aerobic dance class (accompanied by music): 5‐min warm‐up; 30‐min low‐impact aerobics; 15‐min strength training (including PFMT); 5‐min stretching and relaxation. PFMT in a variety of position including sitting, kneeling and standing. Informed of deep abdominal muscle co‐contraction during maximal PFM contraction. |
| (mixed prevention and treatment trial) | Visual inspection of perineum (PFMT group). | Maximum of 6 voluntary PFM contractions per set; 3‐6 sec hold; 3 sets per day; for 8 weeks. | PFMT taught 1‐to‐1 with physiotherapist. 1 (20 min) contact in hospital, and another (30 min) 8 weeks later at home or hospital. | Routine postnatal care; usual postnatal leaflet given; invitation to join postnatal class on ward; no restriction on PFMT if recommended by other health professional. | 84% (292/348) of women in the PFMT group and 58% (189/328) of controls were performing PFMT at "adequate" level at 3 months' postpartum. | Women were "asked if they were performing their PF exercises." |
| (treatment trial) | Not reported. | 5‐6 biweekly sessions. No specific details provided about PFMT. | Supervised by a physiotherapist. | Similar unsupervised PFMT at home. | Not reported. | Conference abstract. |
| (treatment trial) | Vaginal digital palpation (both PFMT and control groups). | Progressive PFMT programme. Level 1: 3 sets of 10 near maximal contractions; 3‐sec hold, 3‐sec rest; quick contraction, 1‐sec hold, 1‐sec rest; twice daily. Level 2: 3 sets of 10 near maximal contractions; 5‐sec hold, 5‐sec rest; quick contraction, 2‐sec hold, 2‐sec rest; twice daily. Level 3: 3 sets of 15 near maximal contractions; 10‐sec hold, 10‐sec rest; quick contraction, 2‐sec hold, 2‐sec rest; 3 per day. | Trained by a researcher on how to do PFMT in accordance with booklet of PFM exercises. | Usual care: instructed on how to perform a correct PFM contraction, but did not receive training about exercises. | Not reported. | In 2nd stage of study, 68% of women in study group were contracting the proper muscle group. The rest were given more training and reassessed 1 week later. |
| (mixed prevention and treatment trial) | Not reported. | Not reported. | Not reported. | Not reported. | Not reported. | Conference abstract. |
| (treatment trial) | Not reported. | 8‐12 close to maximal voluntary PFM contraction per set; 6‐ to 8‐sec hold each with 3‐4 fast contractions at the end of each contraction; 6‐sec rest between contractions; 3 sets per day; 5 days per week; for 8 weeks. Also taught 'the knack' (voluntary PFM contraction prior to hard cough and maintained through cough until abdominal wall relaxed). | PFMT taught 1‐to‐1 with physiotherapist. | Same number of physiotherapy contacts for relaxation massage of back and extremities; asked not to do PFMT at home. | Not reported. | In addition to PFMT 15 min of electrical stimulation (biphasic rectangular form, 50 Hz, pulse width 250 msec, duty cycle 6 sec on and 18 sec off for 1st 4 weeks, then 8 sec on and 24 sec off for next 4 weeks, at maximal tolerated current intensity) and 25 min of electromyographic biofeedback per appointment. |
| (mixed prevention and treatment trial) | Not reported. | 6 months. | PFMT taught 1‐to‐1 with physiotherapist in hospital. | Standard care including verbal promotion of PFMT and leaflet on PFMT. | Of 117 women in the PFMT group, 114 were visited by the physiotherapist in hospital, 21 attended the 2‐month PFMT group, and 5 attended the 4‐month group. | ‐ |
| (mixed prevention and treatment trial) | Vaginal digital palpation at each session (possibly by physiotherapist, but not stated; PFMT group). | 1 session per week (20‐30 min), total of 8 sessions between 6th and 8th month of pregnancy. Also 'the knack' (voluntary PFM contraction prior to increasing intra‐abdominal pressure). Provided with written information on PF anatomy and PFMT, and encouraged to perform daily PFMT at home, 10‐20 contractions. | Individually supervised by a physiotherapist or midwife at each session. In total, 37 different therapists (all trained by the same specialist physiotherapist) were involved in delivering the exercises. | Usual care, including written information on PF anatomy and PFMT (encouraged to perform daily at home, 10‐20 PFM contractions). | 69.3% (97/140) of women in the PFMT group completed all planned sessions, and 82.8% (116/140) completed at least 1 session (4‐8, median 8). At the end of pregnancy, women in both groups reported a similar frequency and duration of PFMT (including number of contractions). PFMT was performed daily at home by 4.3% (6/140) of PFMT women and 10.6% (15/142) of controls, at the end of pregnancy. | PFMT performed in standing (5 min) and lying (10 min). |
| (mixed prevention and treatment trial) | Not reported. | Standard postpartum discharge instructions plus written and verbal instructions for PFMT. | Not reported. | Standard postpartum discharge instructions. | Not reported. | Conference abstract. |
| (mixed prevention and treatment trial) | Not reported. | 2 weekly session of Kegel exercises; 8 weeks. Daily home exercises (20 min) and stretching. | Not reported. | Did not receive any PFMT, no other details provided. | Not reported. | Conference abstract. |
| (prevention trial) | Not reported. | 12‐week PFMT programme. | PFMT supervised by a physiotherapist and midwife. | Routine care and PFM exercises, customary instruction at intake visit. | Not reported. | Conference abstract. |
| (treatment trial) | Not reported. | 8‐10 sessions of fast and slow voluntary PFM contraction per day with aim of 80‐100 per day; for up to 8 months. | PFMT taught 1‐to‐1 with nurse, health visitor or continence advisor. | Usual antenatal and postnatal care that may have included advice on PFMT. | 78% (218/278) of women in the PFMT group and 48% (118/244) of controls had done some PFMT in the 11th postnatal month. Mean (SD) number of voluntary PFM contractions per day at 12 months' postnatal: PFMT group 20 (29) and controls 5 (15). | Frequency and urgency strategies added if needed at 7 or 9 months postnatally. 52.7% (394/747) of women at 6 years' follow‐up and 70.1% (471/672) of women at 12 years' follow‐up completed a questionnaire. About 50% of women in PFMT and control groups were performing any PFMT at both time points. Daily PFMT was undertaken by 6% (17/263) of PFMT women compared to 12% (29/253) of control women at 6 years; and 7% (15/227) of PFMT group compared to 8% (20/241) of control women at 12 years. |
| (prevention trial) | Surface electromyography (electrodes either side of anus; PFMT group). | 10 voluntary PFM contraction; 8‐sec hold followed by 3 fast, 1‐sec contractions; 6‐sec rest between contractions; for up to 20 weeks. Asked to complete an exercise diary. | PFMT taught 1‐to‐1 with physiotherapist. | Requested not to do PFMT during pregnancy or postnatally. | 63% attended all 8 physiotherapy appointments, 21% attended 7 appointments. | Electromyographic biofeedback at each appointment. |
| (mixed prevention and treatment trial) | Vaginal digital palpation (PFMT and control groups). | Progressive supervised PFM training programme (as per Mørkved 1997) for 16 weeks. Daily PFMT at home, 3 sets of 8‐12 close to maximal contractions. Customary written information on discharge from postnatal ward. Asked to complete an exercise diary. | Supervised exercise class from 6 weeks' postpartum, led by an experienced physiotherapist, once per week for 16 weeks. Class attendance was documented. | Usual care. Received customary written information on discharge from postnatal ward. At 6 weeks were instructed on how to perform a correct PFM contraction (verified with vaginal digital palpation). | 96% (72/75) of women in the PFMT group who completed the trial adhered to 80% of the class and daily home training. In the control group (retrospective questioning), 16.5% reported performing daily PFMT at home ≥ 3 times per week. | 4% (7/175) of women were unable to perform a voluntary PFM contraction at baseline. At baseline (6 weeks' postpartum) more women in the control group were performing PFMT ≥ 3 times or more per week. |
| (mixed prevention and treatment trial) | Vaginal digital palpation (PFMT and control groups). | Daily; for up to 11 months. | 1 individual session with physiotherapist, and 1 group PFMT session led by physiotherapist at 22‐25 weeks' gestation with maximum of 6 women per group. | Usual antenatal and postnatal care that may have included advice on PFMT (personal communication). | 79% (461/586) of women in PFMT group attended group PFMT session (personal communication). | 3.5% (16/460) of women who attended group PFMT session could not perform a voluntary PFM contraction after teaching, and 2.8% (13/460) of women could contract but not sustain a contraction (personal communication). Conference abstract. |
| (treatment trial) | Perineometer (vaginal probe) used to ensure PFM contraction and assess control of contraction in both PFMT and control groups. Unclear if this was performed every session with the PFMT women. | 20 maximal voluntary PFM contractions, 10‐sec hold, 3 times per week; for 8 weeks (as part of a class), and daily at home. Progressed by changing position (prone, sitting and standing). Initial session included information on PFM anatomy and function. Also provided with a booklet which included a training programme and an exercise diary. | Supervised training sessions (1‐hour duration) with a specialist physiotherapist (23 in total, unclear if individual contacts or group classes). | Usual care. Received the same information and demonstration session as PFMT group and instructions on how to correctly perform PFM contraction (perineometer). Unsupervised, daily PFMT for 8 weeks. | Not reported. | PFMT integrated with trunk stabilisation exercises (progressive abdominal strengthening, bridging, and side‐bridge). |
| (mixed prevention and treatment trial) | Observation of inward movement of perineum during contraction (PFMT group). | 3 repetitions of 8 PFM contractions, 6‐sec hold each, 2‐min rest between repetitions; repeated twice daily at home with additional training in groups once per week for 45 min for 12 weeks. Asked to complete an exercise diary. | Group training sessions (10 women) supervised by a physiotherapist once per week for 12 weeks. | Regular antenatal care and the customary written postpartum instructions that did not include PFMT from the hospital. Not discouraged from performing PFMT on their own. | > 80% attended every training session and 0 were absent more than twice. At 35 gestational weeks, 87% of PFMT group reported practice of PFMT ≥ 75% of the time. | Group training was performed in sitting and standing positions with legs apart to emphasise specific strength training of the PFM and relaxation of other muscles. |
| (prevention trial) | Observation of inward movement of perineum or digital vaginal palpation, or both (PFMT group). Vaginal digital palpation used to teach PFM contraction in 23.5% (16/68) of women. | 3 sets of 10 maximal voluntary PFM contractions at level 3 (2‐sec hold, 2‐sec rest for strength; 10‐sec hold, 10‐sec rest for endurance); 3 sessions per day during pregnancy and postpartum. Women received education about the anatomy and functions of the PFM and PFMT (unclear from whom) and were asked to complete an exercise diary (including progressions). | Exercise compliance was checked at every hospital visit (9‐10 visits on average, over a minimum of 12 weeks), and pregnant women were called once per month to encourage regular exercise. | Not instructed to do PFMT. Once data collection complete, controls received PFMT and a brochure with the relevant information during the 12th week home visit. | Women asked to record the number of times they did their exercises. No data reported. | Digital vaginal palpation was refused by 52/68 women due to concerns about pregnancy, cultural/religious reasons. Unclear if women progressed through levels 1‐3 or started at level 3, whether they did 3 sets of 10 exercises per day or 3 sets of 10 exercises 3 times per day, or how the sets were divided between endurance and strength training. |
| (mixed prevention and treatment trial) | Not reported. | PFM (Kegel) exercises undertaken 2‐3 times per day for 20‐30 min or 150‐200 contractions (3‐sec hold then relax), performed until 12 months' postpartum. Biofeedback used twice per week (no further details available). | Not reported who supervised the programme, or the number and type of contacts with health professional(s). | Usual care: received standard postpartum information. | Not reported. | Translation (Chinese). |
| (mixed prevention and treatment trial) | Not reported. | PFMT 2‐3 times per day, 15‐30 min each set (4‐ to 6‐sec hold, 10‐sec relaxation), started after birth and continued for ≥ 10 weeks. | Exercises taught by experienced midwives who also supervised the programme (number and type of contacts/visits unclear). | Usual care: standard postpartum information. Unclear if this included PFMT. | Not reported. | Translation (Chinese). Positions of exercises included supine, sitting or any other position, with legs slightly separated, with instructions to contract anus, vaginal and urinary tract while breathing in, and to relax with expiration. |
| (mixed prevention and treatment trial) | Not reported. | Up to 8 months; no details of PFMT provided. Each clinic session was followed by 20 min of biofeedback and 15 min of electrical stimulation. | 12 sessions (6 weeks) with a physiotherapist between 2 and 10 months postnatally. | No intervention. Women received PFMT education after 3rd assessment at 10 months' postpartum. | Not reported. | In addition to PFMT, 20 min of biofeedback and 15 min of electrical stimulation (vaginal electrode, biphasic rectangular waveform, pulse width 200‐400 msec, frequency 50 Hz, intensity 15‐15 mA, contraction time 6 sec, rest time 12 sec) per appointment. |
| (mixed prevention and treatment trial) | Instructed on correct contraction, but not verified (due to pragmatic nature of study). | PFMT (maximal rapid and sustained PFM contractions) performed as part of a class (50 min) for a median of 5 (range 2‐10) sessions between 18‐24 weeks' to 36‐38 weeks' gestation. Provided with an exercise guide and asked to do daily PFMT at home (30 rapid, 20 sustained (10‐sec hold) contractions), as well as 30‐min daily aerobic exercise (no specific examples provided). Received standard antenatal education and asked to complete an exercise diary. | Supervised by a trained study physiotherapists on a monthly basis. Either group or individual training sessions, depending on the number of women present. | Usual care: received standard antenatal and postnatal education (on labour, breastfeeding and pain relief) by trained physiotherapy, nursing and medial staff. | Analysis of adherence in intervention group was not possible as women failed to complete or return their exercise diaries. | PFMT performed in standing and sitting position. PFMT integrated into non‐aerobic exercise programme designed to reduce back pain. Included abdominal, stretching and relaxation exercises and exercises designed to promote venous return. |
| (mixed prevention and treatment) | Vaginal digital palpation and observation of perineum (both PFMT and control groups). | 8‐12 near maximal voluntary PFM contractions; 6‐ to 8‐sec hold each, 3‐4 fast contractions at the end of each contraction; 6‐sec rest between contractions; twice daily at home; for ≤ 8 months. Also asked to attend weekly 60‐min PFMT class for 12 weeks. Women asked to complete an exercise diary. | Group training session (10‐15 women), once per week for 12 weeks, supervised by physiotherapists (5 in total). | Usual antenatal and postnatal care that may have included advice on PFMT. Correct PFM contraction verified. Not discouraged from doing PFMT on their own. | 19% (28/148) of PFMT women attended less than half the 12 weekly PFMT classes and did not return training diaries. | During exercise class voluntary PFM contraction undertaken in a range of body positions (lying, sitting, kneeling and standing with legs apart). PFMT interspersed with abdominal, back and thigh muscle exercises (accompanied by music). 62% (188/280) of women completed a questionnaire at 6‐year follow‐up, and 45% of women in both the former PFMT and control groups were doing PFMT at least weekly. |
| (mixed prevention and treatment trial) | Contraction assessed with anal biofeedback as part of training session (by obstetrician or specialist nurse); PFMT group. | Sets of 10 PFM contractions (Kegel exercises), 5‐sec hold; 10‐sec rest between contractions; twice daily for 5 min with biofeedback; for 3 months. Standard postpartum education by midwives or physiotherapists, including written information. Women asked to complete an exercise diary. | Biofeedback (electromyographic) training provided at initial session, but no further contact with health professionals. | Usual care: "conventional PFM training," but no details provided. Women asked to complete an exercise diary. | Poor adherence defined as performing < 70% of the intended home exercise sessions. 7/30 women in the PFMT group reported poor adherence. | The portable biofeedback machines were programmed to the electromyography setting with the work period set to 10 contractions (5‐sec duration) with a 10‐sec rest between each contraction. PFMT for treatment of FI. |
| (prevention trial) | Instructed on correct contraction, but not formally verified. Women were asked to test themselves at home by stopping the flow of urine, digital palpation or using a mirror to observe the perineum (PFMT group). | PFMT programme, 3 times per week; for ≥ 22 weeks. Started with 1 set of 8 contractions increasing to 100; divided into different sets of slow (6 sec) and fast (5 as fast as possible) contractions. Unclear if this progression related to class or home exercises. Daily PFMT at home, 100 contractions in different sets. Received standard antenatal education about PFM. | Group training sessions (8‐12 women) designed and supervised by a physical activity and sport sciences graduate; 55‐ to 60‐min duration (10 min of PFMT); 70‐78 sessions in total. | Usual care: follow‐up by midwives, standard information about PFMT. Women were not asked not to do PFMT. | All women included in analysis attended ≥ 80% of exercise sessions. | PFMT integrated into supervised exercise programme; 30 min low‐impact aerobics including general strength training, PFMT and cool down (stretching, relaxation or massage); sometimes accompanied by music. PFMT in a variety of positions. Women wore heart rate monitors to control exercise intensity. |
| (prevention trial) | Unclear, but seems likely as physiotherapists gave individualised programmes to those unable to follow exercise regimen due to inability to do voluntary PFM contraction (PFMT group). | 8‐12 voluntary PFM contractions; 6‐sec hold each; 2‐min rest between each set of contractions; 3 sets of 8‐12 contractions twice daily; for about 20 weeks (as described by Bø 1995). | About 5 (monthly) contacts with physiotherapist between 20 weeks' gestation and delivery. | Usual antenatal and postnatal care that may have included advice on PFMT. Women appeared to have had same number of clinic visits as the PFMT group, and were asked if doing PFMT at each of these visits. | 43% (52/120) of women in the PFMT group did not return an exercise diary; 11% (13/120) completed < 28 days of PFMT; and 46% (55/120) completed ≥ 28 days. When asked postnatally, 28% (33/120) of PFMT women and 34% (37/110) of controls were doing occasional or no PFMT. | If unable to follow PFMT regimen then individualised programme until able to do so. 71% (164/230) of women completed a telephone questionnaire at 8‐year follow‐up, and 68.4% of women were doing PFMT, with 38% stating they were doing PFMT twice or more per week. |
| (mixed prevention and treatment trial) | Yes, but unclear how or by whom (PFMT group). | PFMT tailored to individual ability. 30 maximal or near maximal voluntary PFM contraction per day; for ≤ 17 months. | Not reported. | Usual antenatal and postnatal care; no systematic PFMT programme. | At 35 weeks' gestation, 85% of women in the PFMT group reported to be doing PFMT 75% of the time. At 1 year, PFMT adherence reported to vary between 62% and 90%. | ‐ |
| (treatment trial) | Assessed by ability to stop or slow the flow of urine for 1‐2 sec (PFMT group). | 20 sets of PFM exercises, twice daily, at least 5 days per week, for 6 weeks. 1 set of PFM exercises was 1 slow contraction (10‐sec hold), followed by 10 fast contractions; no progression in number of contractions per set. Also received a handbook with information on stress UI, PFM function, instructions on PFMT and a urinary diary. | Supervised group sessions (4‐5 women) with a midwife; 45 min; once every 2 weeks for 6 weeks (3 sessions in total). | Usual care: from health professionals, obstetricians or midwives. Did not receive information about UI and received no training support about performing correct PFM exercises. | No women were excluded for failing to perform the PFMT for < 28 (of approximately 42) days. | PFMT performed in various positions including lying down, sitting and standing. |
| (treatment trial) | Not reported. | Not reported. | "One to one teaching about pelvic floor exercises." | "Conventional care (hand‐out information about pelvic muscle exercises)." | Not reported. | Conference abstract. |
| (mixed prevention and treatment trial) | Not reported. | As for controls with additional section in leaflet recommending a specific exercise each week that integrated voluntary PFM contraction with usual activities of daily living; up to 3 months. Asked to complete a daily exercise diary for 4 weeks. | 1‐to‐1 session with midwife co‐ordinator each postnatal day in hospital. | Usual antenatal and postnatal care including PFMT leaflet; might include PFMT at antenatal class or postnatal class on ward (or both); instructed to do voluntary PFM contraction as often as remembered and mid‐stream urine stop. | At 10 days postnatally, 78% of PFMT group and 68% of controls were doing some PFMT; with 58% of PFMT group and 42% of controls doing some PFMT at 3 months. | ‐ |
| (mixed prevention and treatment trial) | Vaginal digital palpation (PFMT group). | 8‐12 near maximal voluntary PFM contractions; 6‐ to 8‐sec hold each with 3 fast contractions at the end of each contraction. Asked to perform PFM exercises as part of a 45‐min home programme at least twice per week or a weekly 60‐min exercise class (or both). Received written information including brochure with an evidence‐based PFMT programme, and asked to complete an exercise diary. | Group training sessions (8‐15 women) supervised by physiotherapist, 60 min, once per week for 12 weeks | Usual care: received customary information from midwife or GP. Also given a detailed information brochure including evidence‐based PFMT programme. Women were not discouraged from exercising. | Adherence to the general exercise protocol (exercising ≥ 3 days per week, moderate to high intensity) was 55% (217/397) in the PFMT group and 10% (36/365) in the control group. 67% of the PFMT group performed PFMT ≥ 3 times per week compared to 40% in the control group | PFMT integrated into standardised exercise programme: 30‐ to 35‐min low‐impact aerobics; 20‐ to 25‐min strengthening exercises (including PFMT, 3 sets of 10 reps); 5‐ to 10‐min stretching and relaxation. PFMT performed in a variety of positions, with legs apart to emphasise specific strengthening of the PFM. |
| (prevention trial) | Not reported. | 12 contractions, 3 times daily. | Seen twice monthly throughout pregnancy, and every 3 months postnatally for 1 year. | "Other (placebo) including no pelvic floor exercises." | Not reported. | Conference abstract. |
| (mixed prevention and treatment trial) | Assessment of PFM strength and contraction by an obstetrician (PFMT group; no further details) | Anal contraction; 3‐sec hold (while inhaling) followed by relaxation with 3‐5 faster contractions at the end of each contraction; 15‐30 min each set; twice daily; 6‐8 weeks. | Exercises taught by experienced midwives but unclear who supervised the programme of the number and type of contacts/visits. | Usual care: no other details provided other than "conventional guidance." | Not reported. | PFMT performed in a variety of positions including lying down, sitting or standing. Translation (Chinese). |
| (treatment trial) | Not reported. | Mix of fast and slow voluntary PFM contractions 8‐10 times per day with aim of 80‐100 voluntary PFM contraction daily; up to 9 months. | 1‐to‐1 sessions with physiotherapist at 3, 4, 6 and 9 months postnatally. | Usual PFMT as taught in antenatal and postnatal classes. | Mean (95% CI) number of daily voluntary PFM contraction at 12 months' postnatally was 86 (69‐104) in the PFMT group and 35 (30 to 40) in the control group. | Perineometry for biofeedback at each appointment. Mean time to teach PFMT to the PFMT group was 32 (95% CI 30 to 34) min. |
| Observation and palpation of perineal body by physiotherapists. Women also encouraged to practice self‐palpation (PFMT group). | Not reported. At each visit, women were asked about the frequency and duration of PFMT. | 1‐to‐1 30‐min sessions with physiotherapist. 4 in total: 3 antenatally and 1 at 6 weeks postnatally. In total, 25 physiotherapists (specialised in PFMT) were involved in delivering the exercises. | Usual antenatal and postnatal care including advice on PFMT; nearly two‐thirds received some instruction on PFMT. | At 35 weeks' gestation, 6% reported no PFMT, 17% reported some PFMT, 40% were doing PFMT at low intensity and 37% were exercising intensively in the PFMT group vs 36% reported no PFMT, 25% reported some PFMT, 26% were doing PFMT at low intensity and 14% were exercising intensively in the control group. | ‐ | |
| CI: confidence interval; FI: faecal incontinence; min: minute; PF: pelvic floor; PFM: pelvic floor muscle; PFMT: pelvic floor muscle training; SD: standard deviation; sec: second; UI: urinary incontinence. | ||||||
| Outcome or subgroup title | No. of studies | No. of participants | Statistical method | Effect size |
| 1 Urinary incontinence in late pregnancy Show forest plot | 6 | 624 | Risk Ratio (M‐H, Random, 95% CI) | 0.38 [0.20, 0.72] |
| 1.1 PFMT versus no PFMT | 2 | 174 | Risk Ratio (M‐H, Random, 95% CI) | 0.14 [0.01, 2.04] |
| 1.2 PFMT versus usual care | 4 | 450 | Risk Ratio (M‐H, Random, 95% CI) | 0.44 [0.22, 0.91] |
| 2 Urinary incontinence early postnatal period (0‐3 months) Show forest plot | 5 | 439 | Risk Ratio (M‐H, Random, 95% CI) | 0.38 [0.17, 0.83] |
| 2.1 PFMT versus no PFMT | 2 | 174 | Risk Ratio (M‐H, Random, 95% CI) | 0.27 [0.11, 0.67] |
| 2.2 PFMT versus usual care | 2 | 198 | Risk Ratio (M‐H, Random, 95% CI) | 0.30 [0.04, 2.31] |
| 2.3 PFMT versus unspecified control | 1 | 67 | Risk Ratio (M‐H, Random, 95% CI) | 0.88 [0.43, 1.79] |
| 3 Urinary incontinence mid‐postnatal period (> 3‐6 months) Show forest plot | 5 | 673 | Risk Ratio (M‐H, Fixed, 95% CI) | 0.71 [0.54, 0.95] |
| 3.1 PFMT versus no PFMT | 1 | 86 | Risk Ratio (M‐H, Fixed, 95% CI) | 0.88 [0.35, 2.20] |
| 3.2 PFMT versus usual care | 4 | 587 | Risk Ratio (M‐H, Fixed, 95% CI) | 0.70 [0.52, 0.94] |
| 4 Urinary incontinence late postnatal period (> 6‐12 months) Show forest plot | 1 | 44 | Risk Ratio (M‐H, Fixed, 95% CI) | 1.20 [0.65, 2.21] |
| 4.1 PFMT versus no PFMT | 0 | 0 | Risk Ratio (M‐H, Fixed, 95% CI) | 0.0 [0.0, 0.0] |
| 4.2 PFMT versus usual care | 1 | 44 | Risk Ratio (M‐H, Fixed, 95% CI) | 1.20 [0.65, 2.21] |
| 4.3 PFMT versus unspecified control | 0 | 0 | Risk Ratio (M‐H, Fixed, 95% CI) | 0.0 [0.0, 0.0] |
| 5 Urinary incontinence medium term (> 1‐5 years) | 0 | Risk Ratio (M‐H, Fixed, 95% CI) | Totals not selected | |
| 5.1 PFMT versus no PFMT | 0 | Risk Ratio (M‐H, Fixed, 95% CI) | 0.0 [0.0, 0.0] | |
| 5.2 PFMT versus usual care | 0 | Risk Ratio (M‐H, Fixed, 95% CI) | 0.0 [0.0, 0.0] | |
| 5.3 PFMT versus unspecified control | 0 | Risk Ratio (M‐H, Fixed, 95% CI) | 0.0 [0.0, 0.0] | |
| 6 Urinary incontinence long term (> 5 years) Show forest plot | 2 | Risk Ratio (M‐H, Fixed, 95% CI) | Subtotals only | |
| 6.1 PFMT versus no PFMT | 0 | 0 | Risk Ratio (M‐H, Fixed, 95% CI) | 0.0 [0.0, 0.0] |
| 6.2 PFMT versus usual care | 2 | 352 | Risk Ratio (M‐H, Fixed, 95% CI) | 1.07 [0.77, 1.48] |
| 6.3 PFMT versus unspecified control | 0 | 0 | Risk Ratio (M‐H, Fixed, 95% CI) | 0.0 [0.0, 0.0] |
| 7 Faecal incontinence late pregnancy | 0 | 0 | Risk Ratio (M‐H, Random, 95% CI) | 0.0 [0.0, 0.0] |
| 7.1 PFMT versus no PFMT | 0 | 0 | Risk Ratio (M‐H, Random, 95% CI) | 0.0 [0.0, 0.0] |
| 7.2 PFMT versus usual care | 0 | 0 | Risk Ratio (M‐H, Random, 95% CI) | 0.0 [0.0, 0.0] |
| 7.3 PFMT versus unspecified control | 0 | 0 | Risk Ratio (M‐H, Random, 95% CI) | 0.0 [0.0, 0.0] |
| 8 Faecal incontinence early postnatal period (0‐3 months) | 0 | 0 | Risk Ratio (M‐H, Fixed, 95% CI) | 0.0 [0.0, 0.0] |
| 9 Faecal incontinence mid‐postnatal period (> 3‐6 months) | 0 | 0 | Risk Ratio (M‐H, Fixed, 95% CI) | 0.0 [0.0, 0.0] |
| 10 Faecal incontinence late postnatal period (> 6‐12 months) | 0 | 0 | Risk Ratio (M‐H, Fixed, 95% CI) | 0.0 [0.0, 0.0] |
| 11 Faecal incontinence medium term (> 1‐5 years) | 0 | 0 | Risk Ratio (M‐H, Fixed, 95% CI) | 0.0 [0.0, 0.0] |
| 12 Faecal incontinence long term (> 5 years) | 0 | 0 | Risk Ratio (M‐H, Fixed, 95% CI) | 0.0 [0.0, 0.0] |
| 13 Incontinence‐specific quality of life Show forest plot | 1 | 152 | Mean Difference (IV, Fixed, 95% CI) | ‐2.42 [‐3.32, ‐1.52] |
| 13.1 PFMT versus no PFMT | 0 | 0 | Mean Difference (IV, Fixed, 95% CI) | 0.0 [0.0, 0.0] |
| 13.2 PFMT versus usual care | 1 | 152 | Mean Difference (IV, Fixed, 95% CI) | ‐2.42 [‐3.32, ‐1.52] |
| 13.3 PFMT versus unspecified control | 0 | 0 | Mean Difference (IV, Fixed, 95% CI) | 0.0 [0.0, 0.0] |
| 14 Severity of incontinence Show forest plot | Other data | No numeric data | ||
| 14.1 PFMT versus no PFMT | Other data | No numeric data | ||
| 14.2 PFMT versus usual care | Other data | No numeric data | ||
| 14.3 PFMT versus unspecified control | Other data | No numeric data | ||
| 15 Loss of urine under stress test late pregnancy Show forest plot | 1 | 102 | Risk Ratio (M‐H, Random, 95% CI) | 0.36 [0.19, 0.70] |
| 15.1 PFMT versus no PFMT | 1 | 102 | Risk Ratio (M‐H, Random, 95% CI) | 0.36 [0.19, 0.70] |
| 16 Loss of urine under stress test early postnatal period (0‐3 months) Show forest plot | 3 | 322 | Risk Ratio (M‐H, Fixed, 95% CI) | 0.35 [0.17, 0.75] |
| 16.1 PFMT versus no PFMT | 2 | 174 | Risk Ratio (M‐H, Fixed, 95% CI) | 0.09 [0.02, 0.47] |
| 16.2 PFMT versus usual care | 1 | 148 | Risk Ratio (M‐H, Fixed, 95% CI) | 0.88 [0.33, 2.29] |
| 16.3 PFMT versus unspecified control | 0 | 0 | Risk Ratio (M‐H, Fixed, 95% CI) | 0.0 [0.0, 0.0] |
| 17 Quality of life and health status measures Show forest plot | Other data | No numeric data | ||
| 17.1 PFMT versus no PFMT | Other data | No numeric data | ||
| 17.2 PFMT versus usual care | Other data | No numeric data | ||
| 17.3 PFMT versus unspecified control | Other data | No numeric data | ||
| 18 Pelvic floor muscle function Show forest plot | Other data | No numeric data | ||
| 18.1 PFMT versus no PFMT | Other data | No numeric data | ||
| 18.2 PFMT versus usual care | Other data | No numeric data | ||
| 18.3 PFMT versus unspecified control | Other data | No numeric data | ||
| 18.4 PFMT plus vs PFMT | Other data | No numeric data | ||
| 19 Delivery outcome: caesarean section Show forest plot | 3 | 373 | Risk Ratio (M‐H, Fixed, 95% CI) | 1.28 [0.89, 1.85] |
| 19.1 PFMT versus no PFMT | 1 | 76 | Risk Ratio (M‐H, Fixed, 95% CI) | 1.83 [1.07, 3.15] |
| 19.2 PFMT versus usual care | 1 | 230 | Risk Ratio (M‐H, Fixed, 95% CI) | 1.24 [0.66, 2.36] |
| 19.3 PFMT versus unspecified control | 1 | 67 | Risk Ratio (M‐H, Fixed, 95% CI) | 0.68 [0.29, 1.57] |
| 20 Delivery outcome: other Show forest plot | Other data | No numeric data | ||
| 20.1 PFMT versus no control | Other data | No numeric data | ||
| 20.2 PFMT versus usual care | Other data | No numeric data | ||
| 20.3 PFMT versus unspecified control | Other data | No numeric data | ||
| Outcome or subgroup title | No. of studies | No. of participants | Statistical method | Effect size |
| 1 Urinary incontinence late pregnancy Show forest plot | 3 | 345 | Risk Ratio (M‐H, Random, 95% CI) | 0.70 [0.44, 1.13] |
| 1.1 PFMT versus no PFMT | 0 | 0 | Risk Ratio (M‐H, Random, 95% CI) | 0.0 [0.0, 0.0] |
| 1.2 PFMT vs usual care | 3 | 345 | Risk Ratio (M‐H, Random, 95% CI) | 0.70 [0.44, 1.13] |
| 1.3 PFMT versus unspecified control | 0 | 0 | Risk Ratio (M‐H, Random, 95% CI) | 0.0 [0.0, 0.0] |
| 2 Urinary incontinence early postnatal period (0‐3 months) Show forest plot | 2 | 292 | Risk Ratio (M‐H, Random, 95% CI) | 0.75 [0.37, 1.53] |
| 2.1 PFMT versus no PFMT | 0 | 0 | Risk Ratio (M‐H, Random, 95% CI) | 0.0 [0.0, 0.0] |
| 2.2 PFMT versus usual care | 2 | 292 | Risk Ratio (M‐H, Random, 95% CI) | 0.75 [0.37, 1.53] |
| 2.3 PFMT versus unspecified control | 0 | 0 | Risk Ratio (M‐H, Random, 95% CI) | 0.0 [0.0, 0.0] |
| 3 Urinary incontinence mid‐postnatal period (> 3‐6 months) Show forest plot | 1 | 187 | Risk Ratio (M‐H, Fixed, 95% CI) | 0.94 [0.70, 1.24] |
| 3.1 PFMT versus no PFMT | 0 | 0 | Risk Ratio (M‐H, Fixed, 95% CI) | 0.0 [0.0, 0.0] |
| 3.2 PFMT versus usual care | 1 | 187 | Risk Ratio (M‐H, Fixed, 95% CI) | 0.94 [0.70, 1.24] |
| 3.3 PFMT versus unspecified control | 0 | 0 | Risk Ratio (M‐H, Fixed, 95% CI) | 0.0 [0.0, 0.0] |
| 4 Urinary incontinence late postnatal period (> 6‐12 months) Show forest plot | 2 | 869 | Risk Ratio (M‐H, Random, 95% CI) | 0.50 [0.13, 1.93] |
| 4.1 PFMT versus no PFMT | 0 | 0 | Risk Ratio (M‐H, Random, 95% CI) | 0.0 [0.0, 0.0] |
| 4.2 PFMT versus usual care | 2 | 869 | Risk Ratio (M‐H, Random, 95% CI) | 0.50 [0.13, 1.93] |
| 4.3 PFMT versus unspecified control | 0 | 0 | Risk Ratio (M‐H, Random, 95% CI) | 0.0 [0.0, 0.0] |
| 5 Urinary incontinence medium term (> 1‐5 years) | 0 | Risk Ratio (M‐H, Fixed, 95% CI) | Subtotals only | |
| 5.1 PFMT versus no PFMT | 0 | 0 | Risk Ratio (M‐H, Fixed, 95% CI) | 0.0 [0.0, 0.0] |
| 5.2 PFMT versus usual care | 0 | 0 | Risk Ratio (M‐H, Fixed, 95% CI) | 0.0 [0.0, 0.0] |
| 5.3 PFMT versus unspecified control | 0 | 0 | Risk Ratio (M‐H, Fixed, 95% CI) | 0.0 [0.0, 0.0] |
| 6 Urinary incontinence long term (> 5 years) | 0 | Risk Ratio (M‐H, Fixed, 95% CI) | Subtotals only | |
| 6.1 PFMT versus no PFMT | 0 | 0 | Risk Ratio (M‐H, Fixed, 95% CI) | 0.0 [0.0, 0.0] |
| 6.2 PFMT versus usual care | 0 | 0 | Risk Ratio (M‐H, Fixed, 95% CI) | 0.0 [0.0, 0.0] |
| 6.3 PFMT versus unspecified control | 0 | 0 | Risk Ratio (M‐H, Fixed, 95% CI) | 0.0 [0.0, 0.0] |
| 7 Faecal incontinence late pregnancy | 0 | 0 | Risk Ratio (M‐H, Fixed, 95% CI) | 0.0 [0.0, 0.0] |
| 8 Faecal incontinence early postnatal period (0‐3 months) | 0 | 0 | Risk Ratio (M‐H, Fixed, 95% CI) | 0.0 [0.0, 0.0] |
| 9 Faecal incontinence mid‐postnatal period (> 3‐6 months) | 0 | 0 | Risk Ratio (M‐H, Fixed, 95% CI) | 0.0 [0.0, 0.0] |
| 10 Faecal incontinence late postnatal period (> 6‐12 months) | 0 | Risk Ratio (M‐H, Random, 95% CI) | Subtotals only | |
| 10.1 PFMT versus no PFMT | 0 | 0 | Risk Ratio (M‐H, Random, 95% CI) | 0.0 [0.0, 0.0] |
| 10.2 PFMT versus usual care | 0 | 0 | Risk Ratio (M‐H, Random, 95% CI) | 0.0 [0.0, 0.0] |
| 10.3 PFMT versus unspecified control | 0 | 0 | Risk Ratio (M‐H, Random, 95% CI) | 0.0 [0.0, 0.0] |
| 11 Faecal incontinence medium term (> 1‐5 years) | 0 | Risk Ratio (M‐H, Fixed, 95% CI) | Subtotals only | |
| 11.1 PFMT versus no PFMT | 0 | 0 | Risk Ratio (M‐H, Fixed, 95% CI) | 0.0 [0.0, 0.0] |
| 11.2 PFMT versus usual care | 0 | 0 | Risk Ratio (M‐H, Fixed, 95% CI) | 0.0 [0.0, 0.0] |
| 11.3 PFMT versus unspecified control | 0 | 0 | Risk Ratio (M‐H, Fixed, 95% CI) | 0.0 [0.0, 0.0] |
| 12 Faecal incontinence long term (> 5 years) | 0 | Risk Ratio (M‐H, Fixed, 95% CI) | Subtotals only | |
| 12.1 PFMT versus no PFMT | 0 | 0 | Risk Ratio (M‐H, Fixed, 95% CI) | 0.0 [0.0, 0.0] |
| 12.2 PFMT versus usual care | 0 | 0 | Risk Ratio (M‐H, Fixed, 95% CI) | 0.0 [0.0, 0.0] |
| 12.3 PFMT versus unspecified control | 0 | 0 | Risk Ratio (M‐H, Fixed, 95% CI) | 0.0 [0.0, 0.0] |
| 13 Faecal incontinence very long term (> 10 years) | 0 | Risk Ratio (M‐H, Fixed, 95% CI) | Subtotals only | |
| 13.1 PFMT versus no PFMT | 0 | 0 | Risk Ratio (M‐H, Fixed, 95% CI) | 0.0 [0.0, 0.0] |
| 13.2 PFMT versus usual care | 0 | 0 | Risk Ratio (M‐H, Fixed, 95% CI) | 0.0 [0.0, 0.0] |
| 13.3 PFMT versus unspecified control | 0 | 0 | Risk Ratio (M‐H, Fixed, 95% CI) | 0.0 [0.0, 0.0] |
| 14 Incontinence‐specific quality of life Show forest plot | 1 | 41 | Mean Difference (IV, Fixed, 95% CI) | ‐3.5 [‐6.13, ‐0.87] |
| 14.1 PFMT versus no PFMT | 0 | 0 | Mean Difference (IV, Fixed, 95% CI) | 0.0 [0.0, 0.0] |
| 14.2 PFMT versus usual care | 1 | 41 | Mean Difference (IV, Fixed, 95% CI) | ‐3.5 [‐6.13, ‐0.87] |
| 14.3 PFMT versus unspecified control | 0 | 0 | Mean Difference (IV, Fixed, 95% CI) | 0.0 [0.0, 0.0] |
| 15 Quality of life and health status measures Show forest plot | Other data | No numeric data | ||
| 15.1 PFMT versus no PFMT | Other data | No numeric data | ||
| 15.2 PFMT versus usual care | Other data | No numeric data | ||
| 15.3 PFMT versus unspecified control | Other data | No numeric data | ||
| 16 Severity of incontinence Show forest plot | Other data | No numeric data | ||
| 16.1 PFMT versus no PFMT | Other data | No numeric data | ||
| 16.2 PFMT versus usual care | Other data | No numeric data | ||
| 16.3 PFMT versus unspecified control | Other data | No numeric data | ||
| 17 Pelvic floor muscle function Show forest plot | Other data | No numeric data | ||
| 17.1 PFMT versus no PFMT | Other data | No numeric data | ||
| 17.2 PFMT versus usual care | Other data | No numeric data | ||
| 17.3 PFMT versus unspecified control | Other data | No numeric data | ||
| Outcome or subgroup title | No. of studies | No. of participants | Statistical method | Effect size |
| 1 Urinary incontinence late pregnancy Show forest plot | 9 | 3164 | Risk Ratio (M‐H, Random, 95% CI) | 0.74 [0.61, 0.90] |
| 1.1 PFMT versus no PFMT | 2 | 387 | Risk Ratio (M‐H, Random, 95% CI) | 0.24 [0.02, 2.53] |
| 1.2 PFMT versus usual care | 7 | 2777 | Risk Ratio (M‐H, Random, 95% CI) | 0.82 [0.72, 0.94] |
| 1.3 PFMT versus unspecified control | 0 | 0 | Risk Ratio (M‐H, Random, 95% CI) | 0.0 [0.0, 0.0] |
| 1.4 PFMT plus versus PFMT | 0 | 0 | Risk Ratio (M‐H, Random, 95% CI) | 0.0 [0.0, 0.0] |
| 2 Urinary incontinence early postnatal period (0‐3 months) Show forest plot | 5 | 760 | Risk Ratio (M‐H, Fixed, 95% CI) | 0.80 [0.67, 0.95] |
| 2.1 PFMT versus no PFMT | 1 | 300 | Risk Ratio (M‐H, Fixed, 95% CI) | 0.72 [0.51, 1.02] |
| 2.2 PFMT versus usual care | 3 | 367 | Risk Ratio (M‐H, Fixed, 95% CI) | 0.88 [0.67, 1.16] |
| 2.3 PFMT versus unspecified control | 1 | 93 | Risk Ratio (M‐H, Fixed, 95% CI) | 0.77 [0.61, 0.97] |
| 3 Urinary incontinence mid‐postnatal period (> 3‐6 months) Show forest plot | 5 | 1921 | Risk Ratio (M‐H, Random, 95% CI) | 0.73 [0.55, 0.97] |
| 3.1 PFMT versus no PFMT | 1 | 300 | Risk Ratio (M‐H, Random, 95% CI) | 0.60 [0.38, 0.92] |
| 3.2 PFMT versus usual care | 3 | 1528 | Risk Ratio (M‐H, Random, 95% CI) | 0.85 [0.65, 1.11] |
| 3.3 PFMT versus unspecified control | 1 | 93 | Risk Ratio (M‐H, Random, 95% CI) | 0.42 [0.20, 0.86] |
| 4 Urinary incontinence late postnatal period (> 6‐12 months) Show forest plot | 2 | 244 | Risk Ratio (M‐H, Fixed, 95% CI) | 0.85 [0.63, 1.14] |
| 4.1 PFMT versus no PFMT | 0 | 0 | Risk Ratio (M‐H, Fixed, 95% CI) | 0.0 [0.0, 0.0] |
| 4.2 PFMT versus usual care | 2 | 244 | Risk Ratio (M‐H, Fixed, 95% CI) | 0.85 [0.63, 1.14] |
| 4.3 PFMT versus unspecified control | 0 | 0 | Risk Ratio (M‐H, Fixed, 95% CI) | 0.0 [0.0, 0.0] |
| 5 Urinary incontinence medium term (> 1‐5 years) | 0 | 0 | Risk Ratio (M‐H, Fixed, 95% CI) | 0.0 [0.0, 0.0] |
| 6 Urinary incontinence long term (> 5 years) Show forest plot | 1 | 188 | Risk Ratio (M‐H, Fixed, 95% CI) | 1.38 [0.77, 2.45] |
| 6.1 PFMT versus usual care | 1 | 188 | Risk Ratio (M‐H, Fixed, 95% CI) | 1.38 [0.77, 2.45] |
| 7 Faecal incontinence late pregnancy Show forest plot | 2 | 867 | Risk Ratio (M‐H, Fixed, 95% CI) | 0.61 [0.30, 1.25] |
| 7.1 PFMT versus no PFMT | 0 | 0 | Risk Ratio (M‐H, Fixed, 95% CI) | 0.0 [0.0, 0.0] |
| 7.2 PFMT versus usual care | 2 | 867 | Risk Ratio (M‐H, Fixed, 95% CI) | 0.61 [0.30, 1.25] |
| 7.3 PFMT versus unspecified control | 0 | 0 | Risk Ratio (M‐H, Fixed, 95% CI) | 0.0 [0.0, 0.0] |
| 8 Faecal incontinence early postnatal period (0‐3 months) Show forest plot | 1 | 90 | Risk Ratio (M‐H, Fixed, 95% CI) | 0.36 [0.04, 3.37] |
| 8.1 PFMT versus no PFMT | 0 | 0 | Risk Ratio (M‐H, Fixed, 95% CI) | 0.0 [0.0, 0.0] |
| 8.2 PFMT versus usual care | 1 | 90 | Risk Ratio (M‐H, Fixed, 95% CI) | 0.36 [0.04, 3.37] |
| 8.3 PFMT versus unspecified control | 0 | 0 | Risk Ratio (M‐H, Fixed, 95% CI) | 0.0 [0.0, 0.0] |
| 9 Faecal incontinence mid‐postnatal period (> 3‐6 months) | 0 | Risk Ratio (M‐H, Fixed, 95% CI) | Totals not selected | |
| 9.1 PFMT versus no PFMT | 0 | Risk Ratio (M‐H, Fixed, 95% CI) | 0.0 [0.0, 0.0] | |
| 9.2 PFMT versus usual care | 0 | Risk Ratio (M‐H, Fixed, 95% CI) | 0.0 [0.0, 0.0] | |
| 9.3 PFMT versus unspecified control | 0 | Risk Ratio (M‐H, Fixed, 95% CI) | 0.0 [0.0, 0.0] | |
| 10 Faecal incontinence late‐postnatal period (> 6‐12 months) | 0 | Risk Ratio (M‐H, Fixed, 95% CI) | Totals not selected | |
| 10.1 PFMT versus no PFMT | 0 | Risk Ratio (M‐H, Fixed, 95% CI) | 0.0 [0.0, 0.0] | |
| 10.2 PFMT versus usual care | 0 | Risk Ratio (M‐H, Fixed, 95% CI) | 0.0 [0.0, 0.0] | |
| 10.3 PFMT versus unspecified control | 0 | Risk Ratio (M‐H, Fixed, 95% CI) | 0.0 [0.0, 0.0] | |
| 11 Faecal incontinence medium term (> 1‐5 years) | 0 | 0 | Risk Ratio (M‐H, Fixed, 95% CI) | 0.0 [0.0, 0.0] |
| 11.1 PFMT versus no PFMT | 0 | 0 | Risk Ratio (M‐H, Fixed, 95% CI) | 0.0 [0.0, 0.0] |
| 11.2 PFMT versus usual care | 0 | 0 | Risk Ratio (M‐H, Fixed, 95% CI) | 0.0 [0.0, 0.0] |
| 11.3 PFMT versus unspecified control | 0 | 0 | Risk Ratio (M‐H, Fixed, 95% CI) | 0.0 [0.0, 0.0] |
| 12 Faecal incontinence long term (> 5 years) | 0 | 0 | Risk Ratio (M‐H, Fixed, 95% CI) | 0.0 [0.0, 0.0] |
| 12.1 PFMT versus no PFMT | 0 | 0 | Risk Ratio (M‐H, Fixed, 95% CI) | 0.0 [0.0, 0.0] |
| 12.2 PFMT versus usual care | 0 | 0 | Risk Ratio (M‐H, Fixed, 95% CI) | 0.0 [0.0, 0.0] |
| 12.3 PFMT versus unspecified control | 0 | 0 | Risk Ratio (M‐H, Fixed, 95% CI) | 0.0 [0.0, 0.0] |
| 13 Incontinence‐specific quality of life late pregnancy Show forest plot | 1 | 224 | Mean Difference (IV, Fixed, 95% CI) | ‐0.20 [‐1.21, 0.81] |
| 13.1 PFMT versus no PFMT | 0 | 0 | Mean Difference (IV, Fixed, 95% CI) | 0.0 [0.0, 0.0] |
| 13.2 PFMT versus usual care | 1 | 224 | Mean Difference (IV, Fixed, 95% CI) | ‐0.20 [‐1.21, 0.81] |
| 13.3 PFMT versus unspecified control | 0 | 0 | Mean Difference (IV, Fixed, 95% CI) | 0.0 [0.0, 0.0] |
| 14 Incontinence‐specific quality of life early postnatal period (0‐3 months) Show forest plot | 1 | 211 | Mean Difference (IV, Fixed, 95% CI) | ‐0.60 [‐1.45, 0.25] |
| 14.1 PFMT versus no PFMT | 0 | 0 | Mean Difference (IV, Fixed, 95% CI) | 0.0 [0.0, 0.0] |
| 14.2 PFMT versus usual care | 1 | 211 | Mean Difference (IV, Fixed, 95% CI) | ‐0.60 [‐1.45, 0.25] |
| 14.3 PFMT versus unspecified control | 0 | 0 | Mean Difference (IV, Fixed, 95% CI) | 0.0 [0.0, 0.0] |
| 15 Incontinence‐specific quality of life late postnatal period (> 6‐12 months) Show forest plot | 1 | 190 | Mean Difference (IV, Fixed, 95% CI) | ‐0.20 [‐1.20, 0.80] |
| 15.1 PFMT versus no PFMT | 0 | 0 | Mean Difference (IV, Fixed, 95% CI) | 0.0 [0.0, 0.0] |
| 15.2 PFMT versus usual care | 1 | 190 | Mean Difference (IV, Fixed, 95% CI) | ‐0.20 [‐1.20, 0.80] |
| 15.3 PFMT versus unspecified control | 0 | 0 | Mean Difference (IV, Fixed, 95% CI) | 0.0 [0.0, 0.0] |
| 16 Severity of incontinence Show forest plot | Other data | No numeric data | ||
| 16.3 PFMT versus no PFMT | Other data | No numeric data | ||
| 16.4 PFMT versus usual care | Other data | No numeric data | ||
| 16.5 PFMT versus unspecified control | Other data | No numeric data | ||
| 17 Loss of urine under stress test early postnatal period (0‐3 months) Show forest plot | Other data | No numeric data | ||
| 17.1 PFMT versus no PFMT | Other data | No numeric data | ||
| 17.2 PFMT versus usual care | Other data | No numeric data | ||
| 17.3 PFMT versus unspecified control | Other data | No numeric data | ||
| 18 Quality of life and health status measures Show forest plot | Other data | No numeric data | ||
| 18.3 PFMT versus no PFMT | Other data | No numeric data | ||
| 18.4 PFMT versus usual care | Other data | No numeric data | ||
| 18.5 PFMT versus unspecified control | Other data | No numeric data | ||
| 19 Pelvic floor muscle function Show forest plot | Other data | No numeric data | ||
| 19.1 PFMT versus no PFMT | Other data | No numeric data | ||
| 19.2 PFMT versus usual care | Other data | No numeric data | ||
| 19.3 PFMT versus unspecified control | Other data | No numeric data | ||
| 19.4 PFMT plus vs PFMT | Other data | No numeric data | ||
| 20 Delivery outcome: caesarean section Show forest plot | 6 | 1899 | Risk Ratio (M‐H, Fixed, 95% CI) | 0.95 [0.79, 1.14] |
| 20.1 PFMT versus no PFMT | 1 | 300 | Risk Ratio (M‐H, Fixed, 95% CI) | 1.12 [0.79, 1.57] |
| 20.2 PFMT versus usual care | 5 | 1599 | Risk Ratio (M‐H, Fixed, 95% CI) | 0.90 [0.73, 1.12] |
| 20.3 PFMT versus unspecified | 0 | 0 | Risk Ratio (M‐H, Fixed, 95% CI) | 0.0 [0.0, 0.0] |
| 21 Delivery outcome: other Show forest plot | Other data | No numeric data | ||
| 21.3 PFMT versus no PFMT | Other data | No numeric data | ||
| 21.4 PFMT versus usual care | Other data | No numeric data | ||
| 21.5 PFMT versus unspecified control | Other data | No numeric data | ||
| 22 Patient satisfaction and further treatment Show forest plot | Other data | No numeric data | ||
| 22.1 PFMT versus no PFMT | Other data | No numeric data | ||
| 22.2 PFMT versus usual care | Other data | No numeric data | ||
| 22.3 PFMT versus unspecified control | Other data | No numeric data | ||
| Outcome or subgroup title | No. of studies | No. of participants | Statistical method | Effect size |
| 1 Urinary incontinence early postnatal period (0‐3 months) | 0 | Risk Ratio (M‐H, Fixed, 95% CI) | Subtotals only | |
| 1.1 PFMT versus no PFMT | 0 | 0 | Risk Ratio (M‐H, Fixed, 95% CI) | 0.0 [0.0, 0.0] |
| 1.2 PFMT versus usual care | 0 | 0 | Risk Ratio (M‐H, Fixed, 95% CI) | 0.0 [0.0, 0.0] |
| 1.3 PFMT versus unspecified control | 0 | 0 | Risk Ratio (M‐H, Fixed, 95% CI) | 0.0 [0.0, 0.0] |
| 2 Urinary incontinence mid‐postnatal period (> 3‐6 months) | 0 | Risk Ratio (M‐H, Fixed, 95% CI) | Subtotals only | |
| 2.1 PFMT plus versus PFMT | 0 | 0 | Risk Ratio (M‐H, Fixed, 95% CI) | 0.0 [0.0, 0.0] |
| 2.2 PFMT versus no PFMT | 0 | 0 | Risk Ratio (M‐H, Fixed, 95% CI) | 0.0 [0.0, 0.0] |
| 2.3 PFMT versus usual care | 0 | 0 | Risk Ratio (M‐H, Fixed, 95% CI) | 0.0 [0.0, 0.0] |
| 2.4 PFMT versus unspecified control | 0 | 0 | Risk Ratio (M‐H, Fixed, 95% CI) | 0.0 [0.0, 0.0] |
| 3 Urinary incontinence late‐postnatal period (> 6‐12 months) Show forest plot | 3 | 696 | Risk Ratio (M‐H, Random, 95% CI) | 0.55 [0.29, 1.07] |
| 3.1 PFMT versus no PFMT | 1 | 62 | Risk Ratio (M‐H, Random, 95% CI) | 0.29 [0.18, 0.47] |
| 3.2 PFMT versus usual care | 2 | 634 | Risk Ratio (M‐H, Random, 95% CI) | 0.80 [0.61, 1.06] |
| 3.3 PFMT versus unspecified control | 0 | 0 | Risk Ratio (M‐H, Random, 95% CI) | 0.0 [0.0, 0.0] |
| 4 Urinary incontinence medium term (> 1‐5 years) | 0 | Risk Ratio (M‐H, Fixed, 95% CI) | Totals not selected | |
| 4.1 PFMT versus no PFMT | 0 | Risk Ratio (M‐H, Fixed, 95% CI) | 0.0 [0.0, 0.0] | |
| 4.2 PFMT versus usual care | 0 | Risk Ratio (M‐H, Fixed, 95% CI) | 0.0 [0.0, 0.0] | |
| 4.3 PFMT versus unspecified control | 0 | Risk Ratio (M‐H, Fixed, 95% CI) | 0.0 [0.0, 0.0] | |
| 5 Urinary incontinence long term (> 5‐10 years) Show forest plot | 1 | Risk Ratio (M‐H, Fixed, 95% CI) | Subtotals only | |
| 5.1 PFMT versus no PFMT | 0 | 0 | Risk Ratio (M‐H, Fixed, 95% CI) | 0.0 [0.0, 0.0] |
| 5.2 PFMT versus usual care | 1 | 516 | Risk Ratio (M‐H, Fixed, 95% CI) | 0.96 [0.88, 1.05] |
| 5.3 PFMT versus unspecified control | 0 | 0 | Risk Ratio (M‐H, Fixed, 95% CI) | 0.0 [0.0, 0.0] |
| 6 Urinary incontinence very long term (> 10 years) Show forest plot | 1 | 471 | Risk Ratio (M‐H, Fixed, 95% CI) | 1.03 [0.94, 1.12] |
| 6.1 PFMT versus usual care | 1 | 471 | Risk Ratio (M‐H, Fixed, 95% CI) | 1.03 [0.94, 1.12] |
| 7 Faecal incontinence early postnatal period (0‐3 months) | 0 | 0 | Risk Ratio (M‐H, Fixed, 95% CI) | 0.0 [0.0, 0.0] |
| 8 Faecal incontinence mid‐postnatal period (> 3‐6 months) | 0 | 0 | Risk Ratio (M‐H, Fixed, 95% CI) | 0.0 [0.0, 0.0] |
| 9 Faecal incontinence late‐postnatal period (> 6‐12 months) Show forest plot | 2 | 620 | Risk Ratio (M‐H, Random, 95% CI) | 0.68 [0.24, 1.94] |
| 9.1 PFMT versus no PFMT | 0 | 0 | Risk Ratio (M‐H, Random, 95% CI) | 0.0 [0.0, 0.0] |
| 9.2 PFMT versus usual care | 2 | 620 | Risk Ratio (M‐H, Random, 95% CI) | 0.68 [0.24, 1.94] |
| 9.3 PFMT versus unspecified control | 0 | 0 | Risk Ratio (M‐H, Random, 95% CI) | 0.0 [0.0, 0.0] |
| 10 Faecal incontinence medium term (> 1‐5 years) | 0 | 0 | Risk Ratio (M‐H, Fixed, 95% CI) | 0.0 [0.0, 0.0] |
| 11 Faecal incontinence long term (> 5‐10 years) Show forest plot | 1 | 509 | Risk Ratio (M‐H, Fixed, 95% CI) | 0.95 [0.60, 1.50] |
| 11.1 PFMT versus no PFMT | 0 | 0 | Risk Ratio (M‐H, Fixed, 95% CI) | 0.0 [0.0, 0.0] |
| 11.2 PFMT versus usual care | 1 | 509 | Risk Ratio (M‐H, Fixed, 95% CI) | 0.95 [0.60, 1.50] |
| 11.3 PFMT versus unspecified control | 0 | 0 | Risk Ratio (M‐H, Fixed, 95% CI) | 0.0 [0.0, 0.0] |
| 12 Faecal incontinence very long term (> 10 years) Show forest plot | 1 | 468 | Odds Ratio (M‐H, Fixed, 95% CI) | 1.36 [0.84, 2.22] |
| 12.1 PFMT versus no PFMT | 0 | 0 | Odds Ratio (M‐H, Fixed, 95% CI) | 0.0 [0.0, 0.0] |
| 12.2 PFMT versus usual care | 1 | 468 | Odds Ratio (M‐H, Fixed, 95% CI) | 1.36 [0.84, 2.22] |
| 12.3 PFMT versus unspecified control | 0 | 0 | Odds Ratio (M‐H, Fixed, 95% CI) | 0.0 [0.0, 0.0] |
| 13 Incontinence‐specific quality of life Show forest plot | 1 | 18 | Mean Difference (IV, Fixed, 95% CI) | ‐1.66 [‐3.51, 0.19] |
| 13.1 PFMT versus usual care | 1 | 18 | Mean Difference (IV, Fixed, 95% CI) | ‐1.66 [‐3.51, 0.19] |
| 14 Severity of incontinence Show forest plot | Other data | No numeric data | ||
| 14.2 PFMT versus no PFMT | Other data | No numeric data | ||
| 14.3 PFMT versus usual care | Other data | No numeric data | ||
| 14.4 PFMT versus unspecified control | Other data | No numeric data | ||
| 15 Quality of life and health status measures Show forest plot | Other data | No numeric data | ||
| 16 Pelvic floor muscle function Show forest plot | Other data | No numeric data | ||
| 16.1 PFMT versus no PFMT | Other data | No numeric data | ||
| 16.2 PFMT versus usual care | Other data | No numeric data | ||
| 16.3 PFMT versus unspecified control | Other data | No numeric data | ||
| Outcome or subgroup title | No. of studies | No. of participants | Statistical method | Effect size |
| 1 Urinary incontinence early postnatal period (0‐3 months) | 0 | Risk Ratio (M‐H, Fixed, 95% CI) | Subtotals only | |
| 2 Urinary incontinence mid‐postnatal period (> 3‐6 months) Show forest plot | 5 | 2800 | Risk Ratio (M‐H, Random, 95% CI) | 0.95 [0.75, 1.19] |
| 2.1 PFMT versus no PFMT | 0 | 0 | Risk Ratio (M‐H, Random, 95% CI) | 0.0 [0.0, 0.0] |
| 2.2 PFMT versus usual care | 5 | 2800 | Risk Ratio (M‐H, Random, 95% CI) | 0.95 [0.75, 1.19] |
| 2.3 PFMT versus unspecified control | 0 | 0 | Risk Ratio (M‐H, Random, 95% CI) | 0.0 [0.0, 0.0] |
| 3 Urinary incontinence late postnatal period (> 6‐12 months) Show forest plot | 3 | 826 | Risk Ratio (M‐H, Fixed, 95% CI) | 0.88 [0.71, 1.09] |
| 3.1 PFMT versus no PFMT | 1 | 107 | Risk Ratio (M‐H, Fixed, 95% CI) | 0.82 [0.31, 2.21] |
| 3.2 PFMT versus usual care | 2 | 719 | Risk Ratio (M‐H, Fixed, 95% CI) | 0.88 [0.71, 1.10] |
| 3.3 PFMT versus unspecified control | 0 | 0 | Risk Ratio (M‐H, Fixed, 95% CI) | 0.0 [0.0, 0.0] |
| 4 Urinary incontinence medium term (> 1‐5 years) | 0 | 0 | Risk Ratio (M‐H, Fixed, 95% CI) | 0.0 [0.0, 0.0] |
| 4.1 PFMT versus no PFMT | 0 | 0 | Risk Ratio (M‐H, Fixed, 95% CI) | 0.0 [0.0, 0.0] |
| 4.2 PFMT versus usual care | 0 | 0 | Risk Ratio (M‐H, Fixed, 95% CI) | 0.0 [0.0, 0.0] |
| 4.3 PFMT versus unspecified control | 0 | 0 | Risk Ratio (M‐H, Fixed, 95% CI) | 0.0 [0.0, 0.0] |
| 5 Urinary incontinence long term (> 5 years) | 0 | 0 | Risk Ratio (M‐H, Fixed, 95% CI) | 0.0 [0.0, 0.0] |
| 5.1 PFMT versus no PFMT | 0 | 0 | Risk Ratio (M‐H, Fixed, 95% CI) | 0.0 [0.0, 0.0] |
| 5.2 PFMT versus usual care | 0 | 0 | Risk Ratio (M‐H, Fixed, 95% CI) | 0.0 [0.0, 0.0] |
| 5.3 PFMT versus unspecified control | 0 | 0 | Risk Ratio (M‐H, Fixed, 95% CI) | 0.0 [0.0, 0.0] |
| 6 Faecal incontinence early postnatal period (0‐3 months) Show forest plot | 1 | 1609 | Risk Ratio (M‐H, Fixed, 95% CI) | 0.93 [0.51, 1.67] |
| 6.1 PFMT versus no PFMT | 0 | 0 | Risk Ratio (M‐H, Fixed, 95% CI) | 0.0 [0.0, 0.0] |
| 6.2 PFMT versus usual care | 1 | 1609 | Risk Ratio (M‐H, Fixed, 95% CI) | 0.93 [0.51, 1.67] |
| 6.3 PFMT versus unspecified control | 0 | 0 | Risk Ratio (M‐H, Fixed, 95% CI) | 0.0 [0.0, 0.0] |
| 7 Faecal incontinence mid‐postnatal period (> 3‐6 months) | 0 | Risk Ratio (M‐H, Fixed, 95% CI) | Totals not selected | |
| 7.1 PFMT versus no PFMT | 0 | Risk Ratio (M‐H, Fixed, 95% CI) | 0.0 [0.0, 0.0] | |
| 7.2 PFMT versus usual care | 0 | Risk Ratio (M‐H, Fixed, 95% CI) | 0.0 [0.0, 0.0] | |
| 7.3 PFMT versus unspecified control | 0 | Risk Ratio (M‐H, Fixed, 95% CI) | 0.0 [0.0, 0.0] | |
| 8 Faecal incontinence late‐postnatal period (> 6‐12 months) Show forest plot | 1 | 107 | Risk Ratio (M‐H, Fixed, 95% CI) | 0.73 [0.13, 4.21] |
| 8.1 PFMT versus no PFMT | 1 | 107 | Risk Ratio (M‐H, Fixed, 95% CI) | 0.73 [0.13, 4.21] |
| 8.2 PFMT versus usual care | 0 | 0 | Risk Ratio (M‐H, Fixed, 95% CI) | 0.0 [0.0, 0.0] |
| 8.3 PFMT versus unspecified control | 0 | 0 | Risk Ratio (M‐H, Fixed, 95% CI) | 0.0 [0.0, 0.0] |
| 9 Faecal incontinence medium term (> 1‐5 years) | 0 | 0 | Risk Ratio (M‐H, Fixed, 95% CI) | 0.0 [0.0, 0.0] |
| 10 Incontinence‐specific quality of life | 0 | Risk Ratio (M‐H, Fixed, 95% CI) | Totals not selected | |
| 10.1 PFMT versus no PFMT | 0 | Risk Ratio (M‐H, Fixed, 95% CI) | 0.0 [0.0, 0.0] | |
| 10.2 PFMT versus usual care | 0 | Risk Ratio (M‐H, Fixed, 95% CI) | 0.0 [0.0, 0.0] | |
| 10.3 PFMT versus unspecified control | 0 | Risk Ratio (M‐H, Fixed, 95% CI) | 0.0 [0.0, 0.0] | |
| 11 Severity of incontinence Show forest plot | Other data | No numeric data | ||
| 11.1 PFMT versus no PFMT | Other data | No numeric data | ||
| 11.2 PFMT versus usual care | Other data | No numeric data | ||
| 11.3 PFMT versus unspecified control | Other data | No numeric data | ||
| 12 Loss of urine under stress test postpartum Show forest plot | 2 | 323 | Odds Ratio (M‐H, Fixed, 95% CI) | 0.96 [0.58, 1.57] |
| 12.1 PFMT versus no PFMT | 0 | 0 | Odds Ratio (M‐H, Fixed, 95% CI) | 0.0 [0.0, 0.0] |
| 12.2 PFMT versus usual care | 2 | 323 | Odds Ratio (M‐H, Fixed, 95% CI) | 0.96 [0.58, 1.57] |
| 12.3 PFMT versus unspecified control | 0 | 0 | Odds Ratio (M‐H, Fixed, 95% CI) | 0.0 [0.0, 0.0] |
| 13 Quality of life and health status measures Show forest plot | Other data | No numeric data | ||
| 13.1 PFMT versus no PFMT | Other data | No numeric data | ||
| 13.2 PFMT versus usual care | Other data | No numeric data | ||
| 13.3 PFMT versus unspecified control | Other data | No numeric data | ||
| 14 Pelvic floor muscle function Show forest plot | Other data | No numeric data | ||
| 14.1 PFMT versus no PFMT | Other data | No numeric data | ||
| 14.2 PFMT versus usual care | Other data | No numeric data | ||
| 14.3 PFMT versus unspecified control | Other data | No numeric data | ||
| 14.4 PFMT plus versus PFMT | Other data | No numeric data | ||
| 15 Pelvic organ prolapse symptoms Show forest plot | Other data | No numeric data | ||
| 15.1 PFMT versus no PFMT | Other data | No numeric data | ||
| 15.2 PFMT versus usual care | Other data | No numeric data | ||
| 15.3 PFMT versus unspecified control | Other data | No numeric data | ||