Administración de suplementos de vitamina D para la prevención de la mortalidad en adultos
Resumen
Antecedentes
Las pruebas disponibles sobre los efectos de la vitamina D en la mortalidad no han sido concluyentes. En una revisión sistemática reciente, se encontraron pruebas de que la vitamina D3 puede reducir la mortalidad en la mayoría de las mujeres de edad muy avanzada. La presente revisión sistemática actualiza y reevalúa los efectos beneficiosos y perjudiciales de la administración de suplementos de vitamina D para la profilaxis primaria y secundaria de la mortalidad.
Objetivos
Evaluar los efectos beneficiosos y perjudiciales de la administración de suplementos de vitamina D para la prevención de la mortalidad en adultos sanos y adultos en una fase estable de la enfermedad.
Métodos de búsqueda
Se hicieron búsquedas en The Cochrane Library, MEDLINE, EMBASE, LILACS, Science Citation Index–Expanded y en Conference Proceedings Citation Index–Science (en todas las bases de datos hasta febrero 2012). Se examinaron las referencias de los ensayos incluidos y las compañías farmacéuticas para obtener ensayos relevantes no identificados.
Criterios de selección
Ensayos aleatorios que compararan cualquier tipo de vitamina D en cualquier dosis con cualquier duración y vía de administración versus placebo o ninguna intervención en participantes adultos. Los participantes podían haberse seleccionado de la población en general o de pacientes diagnosticados con enfermedades en una fase estable. La vitamina D podía haberse administrado como vitamina D suplementaria (vitamina D3 [colecalciferol] o vitamina D2 [ergocalciferol]) o como una forma activa de vitamina D (1α‐hidroxivitamina D [alfacalcidol] o 1,25‐dihidroxivitamina D [calcitriol]).
Obtención y análisis de los datos
Seis autores de la revisión extrajeron los datos de forma independiente. Se realizaron metanálisis de efectos aleatorios y de efectos fijos. Para los resultados dicotómicos, se calcularon los cocientes de riesgos (CR). Para representar los ensayos con cero eventos, se repitieron los metanálisis de los datos dicotómicos mediante las diferencias de riesgos (DR) y correcciones de continuidad empírica. Se utilizaron los datos publicados y los datos obtenidos mediante contacto con los autores de los ensayos.
Para minimizar el riesgo de errores sistemáticos, se evaluó el riesgo de sesgo de los ensayos incluidos. Los análisis secuenciales de los ensayos controlaron el riesgo de errores aleatorios posiblemente causados por los metanálisis acumulativos.
Resultados principales
Se identificaron 159 ensayos clínicos aleatorios. Noventa y cuatro ensayos no informaron sobre la mortalidad, y nueve ensayos informaron sobre la mortalidad, aunque no informaron en qué grupo de intervención se observó la misma. En consecuencia, 56 ensayos aleatorios con 95 286 participantes proporcionaron datos utilizables sobre la mortalidad. La edad de los participantes varió de 18 a 107 años. La mayoría de los ensayos incluyeron a mujeres de edad superior a los 70 años. La proporción media de mujeres fue del 77%. Cuarenta y ocho de los ensayos asignaron al azar a 94 491 participantes sanos. De los mismos, cuatro ensayos incluyeron a voluntarios sanos, nueve ensayos incluyeron a mujeres posmenopáusicas y 35 ensayos incluyeron a personas mayores que vivían de forma independiente o en centros de atención. Los ocho ensayos restantes asignaron al azar a 795 participantes con enfermedades neurológicas, cardiovasculares, respiratorias o reumatoides. La vitamina D fue administrada durante una media ponderada de 4,4 años. Más de la mitad de los ensayos tenían un bajo riesgo de sesgo. Todos los ensayos se realizaron en países de ingresos altos. Cuarenta y cinco ensayos (80%) informaron el estado inicial de la vitamina D de los participantes en base a los niveles séricos de 25‐hidroxivitamina D. Los participantes de 19 ensayos tenían niveles adecuados de vitamina D (de o por encima de 20 ng/mL). Los participantes de los 26 ensayos restantes tenían insuficiencia de vitamina D (menos de 20 ng/mL).
La vitamina D redujo la mortalidad en los 56 ensayos analizados juntos (5920/47 472 [12,5%] versus 6077/47 814 [12,7%]; CR 0,97 (intervalo de confianza [IC] del 95%: 0,94 a 0,99); P = 0,02; I2 = 0%). Más del 8% de los participantes se retiró. Los análisis de los escenarios del “peor‐mejor de los casos” y del “mejor‐peor de los casos” demostraron que la vitamina D podría asociarse con un aumento o disminución notables en la mortalidad. Al evaluar diferentes formas de vitamina D en análisis por separado, sólo la vitamina D3 disminuyó la mortalidad (4153/37 817 [11,0%] versus 4340/38 110 [11,4%]; CR 0,94 (IC del 95%: 0,91 a 0,98); P = 0,002; I2 = 0%; 75 927 participantes; 38 ensayos). La vitamina D2, alfacalcidol y calcitriol no afectó significativamente la mortalidad. Un análisis de subgrupos de los ensayos en riesgo alto de sesgo indicó que la vitamina D2 incluso puede aumentar la mortalidad, aunque este hallazgo podría deberse a errores aleatorios. El análisis secuencial de los ensayos apoyó el hallazgo con respecto a la vitamina D3, y la puntuación z acumulativa cruzó el límite de monitorización secuencial del ensayo en cuanto al beneficio, lo cual corresponde a 150 personas tratadas durante cinco años para evitar una muerte adicional. No se observaron diferencias estadísticamente significativas en el efecto de la vitamina D sobre la mortalidad en los análisis de subgrupos de los ensayos en riesgo bajo de sesgo comparados con los ensayos en riesgo alto de sesgo; de los ensayos que utilizaron placebo comparados con los ensayos que utilizaron ninguna intervención en el grupo de control; de los ensayos sin riesgo de sesgo por financiación industrial comparados con los ensayos con riesgo de sesgo por financiación industrial; de los ensayos que evaluaron la prevención primaria comparados con los ensayos que evaluaron la prevención secundaria; de los ensayos que incluyeron a participantes con un nivel de vitamina D por debajo de 20 ng/mL al ingreso comparados con los ensayos que incluyeron a participantes con niveles de vitamina D iguales o superiores a 20 ng/mL al ingreso; de los ensayos que incluyeron a participantes ambulatorios comparados con los ensayos que incluyeron a participantes en centros de atención; de los ensayos que utilizaron la administración concomitante de suplementos de calcio comparados con los ensayos sin calcio; de los ensayos que utilizaron una dosis por debajo de 800 UI por día comparados con los ensayos que utilizaron dosis por encima de los 800 UI por día; y de los ensayos que incluyeron sólo a mujeres comparados con los ensayos que incluyeron a ambos sexos o sólo a hombres. La vitamina D3 disminuyó estadística y significativamente la mortalidad por cáncer (CR 0,88 [IC del 95%: 0,78 a 0,98]; P = 0,02; I2 = 0%; 44 492 participantes; cuatro ensayos). La vitamina D3 combinada con calcio aumentó el riesgo de nefrolitiasis (CR 1,17 [IC del 95%: 1,02 a 1,34]); P = 0,02; I2 = 0%; 42 876 participantes; cuatro ensayos). El alfacalcidol y el calcitriol aumentaron el riesgo de hipercalcemia (CR 3,18 [IC del 95%: 1,17 a 8,68]); P = 0,02; I2 = 17%; 710 participantes; tres ensayos).
Conclusiones de los autores
La vitamina D3 pareció reducir la mortalidad en las personas de edad más avanzada que viven de forma independiente o en centros de atención. La vitamina D2, el alfacalcidol y el calcitriol no tuvieron ningún efecto beneficioso estadísticamente significativo sobre la mortalidad. La vitamina D3 combinada con calcio aumentó la nefrolitiasis. Tanto el alfacalcidol como el calcitriol aumentaron la hipercalcemia. Debido a los riesgos de sesgo de deserción originados a partir de una cantidad considerable de abandonos de los participantes y de sesgo de informe de resultado a causa de la falta de informe de algunos ensayos sobre la mortalidad, así como algunos otros defectos en las pruebas, se justifica la realización de ensayos aleatorios controlados con placebo adicionales.
PICO
Resumen en términos sencillos
Administración de suplementos de vitamina D para la prevención de la mortalidad en adultos
Pregunta de la revisión
Evaluar los efectos beneficiosos y perjudiciales de la vitamina D para la prevención de la mortalidad en adultos sanos y adultos en una fase estable de la enfermedad.
Antecedestes
Numerosos estudios observacionales indican que el estado óptimo de vitamina D puede asociarse con menos casos de cáncer y de enfermedades cardiovasculares (como ataque cardíaco o accidente cerebrovascular). La vitamina D se sintetiza en la piel como vitamina D3 (colecalciferol) o se obtiene a partir de fuentes alimentarias o suplementos como vitamina D3 o vitamina D2 (ergocalciferol). La revisión sistemática Cochrane de 2011, que analizó la influencia de diferentes formas de vitamina D en la mortalidad, indicó que la vitamina D3 (colecalciferol) redujo la mortalidad. Ahora se actualizó esta revisión sistemática, y todos los ensayos incluidos se han reevaluado en conformidad con una metodología Cochrane más adecuada, desarrollada para mejorar la validez de las conclusiones.
Características de los estudios
En los 56 ensayos que aportaron datos para los análisis, un total de 95 286 participantes fueron asignados al azar a la vitamina D o a ningún tratamiento o a un placebo. Más de la mitad de los ensayos se considera que tienen un riesgo bajo de sesgo. Todos los ensayos se realizaron en países de ingresos altos. La edad de los participantes varió de 18 a 107 años. La proporción media de mujeres fue del 77%. La vitamina D fue administrada durante un promedio de 4,4 años.
Este resumen en términos sencillos se actualizó hasta febrero de 2012.
Resultados clave
Esta revisión indica que la vitamina D3 puede reducir la mortalidad, lo cual indica que alrededor de 150 participantes deben ser tratados durante cinco años para salvar una vida adicional. Se encontraron efectos equivalentes de la vitamina D3 en los estudios que incluyeron sólo a mujeres en comparación con los estudios que incluyeron tanto a mujeres como a hombres. La vitamina D3 también pareció reducir la mortalidad por cáncer, y se observó una reducción de la mortalidad de 4 por 1000 personas tratadas durante cinco a siete años. También se observaron efectos adversos de la vitamina D como formación de cálculos renales (observados para la vitamina D3 combinada con calcio) y niveles sanguíneos elevados de calcio (observados tanto para el alfacalcidol como para el calcitriol). En conclusión, se encontraron algunas pruebas de que la vitamina D3 parece disminuir la mortalidad en las personas de edad más avanzada que viven de forma independiente sin ayuda o que residen en centros de atención.
Calidad de la evidencia
Un gran número de participantes en estudio abandonaron el ensayo antes de la finalización, lo cual plantea inquietudes con respecto a la validez de los resultados. Se necesitan más ensayos clínicos aleatorios sobre los efectos de la vitamina D3 en la mortalidad en personas más jóvenes y sanas, así como en personas de edad más avanzada que residen en la comunidad y en centros de atención y que no presentan deficiencia evidente de vitamina D.
Authors' conclusions
Summary of findings
| Vitamin D supplementation for prevention of mortality in adults | ||||||
| Population: adults | ||||||
| Outcomes | Illustrative comparative risks* (95% CI) | Relative effect | No of participants | Quality of the evidence | Comments | |
| Assumed risk | Corresponding risk | |||||
| Placebo or no intervention | Vitamin D | |||||
| All‐cause mortality in trials using vitamin D3 (Follow‐up: 0.08 to 7 years) | Study population | RR 0.94 | 75,927 | ⊕⊕⊕⊝ moderatea | Trial sequential analysis of all trials irrespective of bias risks showed that the required information size had not yet been reached and that the cumulative Z‐curve crossed the trial sequential monitoring boundary for benefit. If this is correct, the intervention effect corresponds to a number needed to treat for a beneficial outcome (NNTB) of 150 participants over five years to save one additional life | |
| 114 per 1000 | 107 per 1000 | |||||
| Moderate risk | ||||||
| 46 per 1000 | 43 per 1000 | |||||
| Cardiovascular mortality in trials using vitamin D3 (cholecalciferol) (Follow‐up: 0.31 to 6.2 years) | Study population | RR 0.98 | 47,267 | ⊕⊕⊝⊝ lowb | Trial sequential analysis showed that the cumulative Z‐curve did not cross the conventional monitoring boundary for benefit. The required information size was 2,539,845 participants | |
| 42 per 1000 | 41 per 1000 | |||||
| Moderate risk | ||||||
| 13 per 1000 | 11 per 1000 | |||||
| Cancer mortality in trials using vitamin D3 (cholecalciferol) (Follow‐up: 5 to 7 years) | Study population | RR 0.88 | 44,492 | ⊕⊕⊕⊝ moderatea | Trial sequential analysis showed that the cumulative Z‐curve did not cross the conventional monitoring boundary for benefit. The required information size was 66,724 participants | |
| 29 per 1000 | 25 per 1000 | |||||
| Moderate risk | ||||||
| 21 per 1000 | 19 per 1000 | |||||
| Adverse events: nephrolithiasis in trials using vitamin D3 combined with calcium (Follow‐up: 1.25 to 7 years) | Study population | RR 1.17 | 42,876 | ⊕⊕⊕⊝ | ||
| 18 per 1000 | 21 per 1000 | |||||
| Moderate risk | ||||||
| 9 per 1000 | 11 per 1000 | |||||
| Adverse events: hypercalcaemia in trials using the active forms of vitamin D (alfacalcidol and calcitriol) (Follow‐up: 0.75 to 3 years) | Study population | RR 3.18 | 710 | ⊕⊕⊝⊝ | ||
| 23 per 1000 | 72 per 1000 | |||||
| Moderate risk | ||||||
| 11 per 1000 | 15 per 1000 | |||||
| Health‐related quality of life (Follow‐up: 0.38 years) | See comment | See comment | Not estimable | 105 (1) | See comment | Insufficient information: significant worsening in disease‐specific quality of life in the vitamin D2 group compared with the placebo group was reported. The between‐group difference at 20 weeks was 5.3 (0.5 to 10.2), and the minimally important difference (MID) is estimated to be 5 points in either direction |
| Health economics (Follow‐up: 4 years) | See comment | See comment | Not estimable | 3270 (1) | See comment | Insufficient information: authors reported that vitamin D3 and calcium supplementation prevented 46 hip fractures in every 1000 women treated |
| *The basis for the assumed risk (e.g. the median control group risk across studies) is provided in footnotes. The corresponding risk (and its 95% confidence interval) is based on the assumed risk in the comparison group and the relative effect of the intervention (and its 95% CI). | ||||||
| GRADE Working Group grades of evidence | ||||||
| aDowngraded by one level because of risk of attrition bias | ||||||
Background
Description of the condition
Vitamin D is synthesised in the skin as vitamin D3 (cholecalciferol) or is obtained from dietary sources or supplements as vitamin D3 or vitamin D2 (ergocalciferol). Vitamins D3 and D2 are metabolised in the liver to 25‐hydroxyvitamin D and in the kidneys to the biologically active 1,25‐dihydroxyvitamin D (calcitriol), which functions as a steroid‐like hormone (Horst 2005; Lips 2006). The effects of vitamin D are mediated by its binding to vitamin D receptors in the cells (Wesley Pike 2005). Renal production of 1,25‐dihydroxyvitamin D is regulated by parathyroid hormone levels, by serum calcium and phosphorus levels and by the phosphaturic hormone fibroblast growth factor‐23 (Kovesdy 2013).
Under conditions of hypocalcaemia, synthesis of the biologically active form of vitamin D (1,25‐dihydroxyvitamin D or calcitriol) is stimulated. This, in turn, stimulates the transport of calcium out of the intestine, kidneys and bones into the blood (Lips 2006). Therefore, homeostasis of vitamin D and calcium levels is essential for bone health (Holick 2007a; Horst 2005; Lips 2006). Current interest in vitamin D has been provoked by the discovery that most cells and tissues in our body contain vitamin D receptors (Holick 2006). During past decades, observational studies have suggested that vitamin D is effective for prevention of malignant, cardiovascular, autoimmune and infectious diseases (Holick 2007a; Nnoaham 2008; Rosen 2011; Souberbielle 2010).
Vitamin D status
Vitamin D status is determined by measurement of the serum 25‐hydroxyvitamin D level, which is a functional indicator of 'vitamin D status' (Bischoff‐Ferrari 2009c; Dawson‐Hughes 2005; Lips 2004). The US Institute of Medicine recently recommended a target serum 25‐hydroxyvitamin D level of 20 ng/mL (50 nmol/L) (IOM 2011). The worldwide prevalence of suboptimal vitamin D status is estimated to be high (Holick 2007a; Mithal 2009). Major causes of vitamin D deficiency include insufficient exposure to sunlight, decreased dietary intake, skin pigmentation, obesity and advanced age (Lips 2006). Vitamin D deficiency in adults precipitates or exacerbates osteopenia and osteoporosis and induces osteomalacia (Holick 2007a). Vitamin D insufficiency is linked to increased risk of malignant, cardiovascular, autoimmune and infectious diseases (Holick 2007a; Rosen 2011; Souberbielle 2010). An opposing hypothesis that vitamin D insufficiency is a consequence of disease but not its cause has been postulated by Marshall et al (Marshall 2008).
How the intervention might work
Vitamin D supplementation (vitamin D3 (cholecalciferol), vitamin D2 (ergocalciferol), 1α‐hydroxyvitamin D (alfacalcidol) or 1,25‐dihydroxyvitamin D (calcitriol)) seems to prevent osteoporosis, osteomalacia and fractures (Holick 2007a; Lamberg‐Allardt 2006). It has been speculated that vitamin D may confer benefits beyond the skeletal system (Davis 2007). Evidence on whether vitamin D may prevent cancer, cardiovascular disease and mortality is contradictory (Bjelakovic 2011; Davis 2007; Giovannucci 2005; Michos 2008; Pittas 2010; Wang 2010; Zittermann 2006).
Adverse effects of the intervention
Excessive vitamin D intake over a prolonged time may lead to vitamin D toxicity. However, evidence that ingestion of high quantities of vitamin D is harmful is sparse. Most trials have reported hypercalcaemia, hypercalciuria or nephrocalcinosis when vitamin D was administered to participants with renal failure (Cranney 2007). Excessive exposure to sunlight does not seem to lead to vitamin D intoxication (Holick 2007b).
Why it is important to do this review
Available evidence on vitamin D and mortality is intriguing and for the most inconclusive. Most observational studies have associated low vitamin D status with increased risk of death (Johansson 2012; Zittermann 2012). Several systematic reviews and meta‐analyses found beneficial effects of vitamin D in elderly people with vitamin deficiency or in people who received vitamin D as monotherapy or in combination with calcium for osteoporosis, fractures and falls (Bischoff‐Ferrari 2005; Bischoff‐Ferrari 2009a; Jackson 2007; Latham 2003b; Richy 2005; Tang 2007). Vitamin D supplementation revealed positive effects in maintaining glucose homeostasis (Pittas 2007a) and in preventing tuberculosis (Nnoaham 2008). However, Izaks et al (Izaks 2007) and Boonen et al (Boonen 2006) found no statistically significant effects of vitamin D supplementation on these outcomes in the general population. A meta‐analysis by Autier and Gandini (Autier 2007) of 18 randomised clinical trials found significantly lower mortality among vitamin D–supplemented participants (Autier 2007). A Cochrane systematic review of 16 randomised trials on prevention of fractures found only a non‐significant tendency of vitamin D to reduce mortality (Avenell 2009). In our published Cochrane review in 2011, data from 50 randomised clinical trials with 94,148 participants suggested a beneficial effect of vitamin D3 on mortality (Bjelakovic 2011). Since the time of that review (Bjelakovic 2011), the results of several new randomised trials conducted to test the influence of vitamin D supplementation on mortality have become available. Also, we wanted to analyse further the influence of participants' sex on the effects of vitamin D3 and to implement the improved Cochrane methodology in performing data assessment. The present review is an update of the former review (Bjelakovic 2011).
Objectives
To assess the beneficial and harmful effects of vitamin D supplementation for prevention of mortality in healthy adults and adults in a stable phase of disease.
Methods
Criteria for considering studies for this review
Types of studies
Randomised clinical trials, irrespective of blinding, publication status or language, that have assessed supplemental vitamin D (vitamin D3 (cholecalciferol) or vitamin D2 (ergocalciferol)) or an active form of vitamin D (1α‐hydroxyvitamin D (alfacalcidol) or 1,25‐dihydroxyvitamin D (calcitriol)). We included primary prevention trials (defined as trials that seek to prevent disease before it occurs) and secondary prevention trials (defined as trials undertaken to prevent recurrences or exacerbations of a disease that has already been diagnosed) (Starfield 2008).
Types of participants
We included adult participants (18 years of age or older) who were.
-
Healthy or were recruited from the general population (primary prevention), irrespective of vitamin D status in the blood.
-
Diagnosed with a specific disease and in a stable phase (secondary prevention), irrespective of vitamin D status in the blood.
-
Diagnosed with vitamin D deficiency (secondary prevention).
We excluded trials that included:
-
Patients with secondary induced osteoporosis (e.g. glucocorticoid‐induced osteoporosis, thyroidectomy, primary hyperparathyroidism, chronic kidney disease, liver cirrhosis, Crohn's disease, gastrointestinal bypass surgery).
-
Pregnant or lactating women (as they usually are in need of vitamin D).
-
Patients with cancer.
Types of interventions
Intervention
Vitamin D at any dose and for any duration, administered as monotherapy or in combination with calcium. The route of administration could have been enteral or parenteral.
Vitamin D could have been administered as supplemental vitamin D (vitamin D3 (cholecalciferol) or vitamin D2 (ergocalciferol)) or as an active form of vitamin D (1α‐hydroxyvitamin D (alfacalcidol) or 1,25‐dihydroxyvitamin D (calcitriol)).
Control
Identical placebo or no intervention.
Calcium in the control group was allowed if used equally in the vitamin D groups of the trial.
Types of outcome measures
Primary outcomes
-
All‐cause mortality.
-
Adverse events: depending on the availability of data, we attempted to classify adverse events as serious and non‐serious. A serious adverse event was defined as any untoward medical occurrence that was life threatening; resulted in death, or in persistent or significant disability or incapacity; or was a congenital anomaly/birth defect; or any medical event that might have jeopardised the participant or required intervention to prevent it (ICH‐GCP 1997). All other adverse events (i.e. medical occurrences not necessarily having a causal relationship to the treatment but causing a dose reduction or discontinuation of treatment) were considered as non‐serious.
Secondary outcomes
-
Cancer‐related mortality.
-
Cardiovascular mortality.
-
Fracture‐related mortality.
-
Other causes of mortality.
-
Health‐related quality of life.
-
Health economics.
Co‐variates, effect modifiers and confounders
We recorded any possible co‐variates, effect modifiers and confounders such as dosage and form of vitamin D, dosing schedule, duration of supplementation, duration of follow‐up, mean age, risk of bias, calcium co‐administration, other medications, compliance and attrition.
Timing of outcome measurement
We applied no restrictions regarding duration of the intervention or length of follow‐up. We assessed outcome data at the end of the trial follow‐up period.
Search methods for identification of studies
Electronic searches
We searched the following sources from inception to the specified date to identify trials that met our criteria.
-
The Cochrane Library (Issue 2, February 2012).
-
MEDLINE (until February 2012).
-
EMBASE (until February 2012).
-
LILACS (until February 2012).
-
Science Citation Index–Expanded (until February 2012).
-
Conference Proceedings Citation Index–Science (until February 2012).
We also searched Clinicaltrials.gov (http://clinicaltrials.gov/) and the World Health Organization International Clinical Trials Registry Platform (ICTRP 2011) to look for ongoing trials.
The search strategies for the databases we have searched are given in Appendix 1.
Searching other resources
We identified additional trials by searching reference lists of included trials and systematic reviews, meta‐analyses and health technology assessment reports. We also contacted experts and main manufacturers of vitamin D to ask about unpublished randomised trials.
Data collection and analysis
The present updated review expands on the previously published review in 2011 (Bjelakovic 2011) and the protocol published in 2008 (Bjelakovic 2008a).
Selection of studies
One review author (GB) performed the electronic searches. Six review authors (GB, LLG, DN, KW, RGS and MB) participated in the manual searches, identified trials eligible for inclusion from the search results and extracted data from the included trials. GB listed the excluded studies along with the reasons for exclusion. When a discrepancy occurred in trial selection or data extraction, the review author CG was consulted so consensus could be reached. We contacted authors of the trials to ask for missing information. Interrater agreement for trial selection was measured using the Kappa statistic (Cohen 1960). Agreement between the review authors was very good (Kappa = 0.85). An adapted PRISMA flow diagram of study selection is included in the review (Moher 2009).
Data extraction and management
Six review authors (GB, LLG, DN, KW, RGS and MB) independently extracted data on the relevant population and intervention characteristics, as well as on the risk of bias components, from trials that fulfilled the inclusion criteria of our review protocol. We used standard templates for data extraction. We searched for duplicate publications. Disagreements were resolved by discussion or, when needed, by the review author CG.
Assessment of risk of bias in included studies
Because of the risk of overestimation of beneficial intervention effects in randomised clinical trials with unclear or inadequate methodological quality (Kjaergard 2001; Lundh 2012; Moher 1998; Savovic 2012; Schulz 1995; Wood 2008), we assessed the influence of the risk of bias on our results. We used the following domains: allocation sequence generation, allocation concealment, blinding, incomplete outcome data, selective outcome reporting, industry bias and other apparent biases (Higgins 2011). The following definitions were used.
Allocation sequence generation
-
Low risk of bias: sequence generation was achieved using computer random number generation or a random number table. Drawing lots, tossing a coin, shuffling cards and throwing dice are adequate if performed by an independent person not otherwise involved in the trial.
-
Uncertain risk of bias: the method of sequence generation was not specified.
-
High risk of bias: the sequence generation method was not random.
Allocation concealment
-
Low risk of bias: the participant allocations could not have been foreseen in advance of, or during, enrolment. Allocation was controlled by a central and independent randomisation unit. The allocation sequence was unknown to the investigators (e.g. if the allocation sequence was hidden in sequentially numbered, opaque and sealed envelopes).
-
Uncertain risk of bias: the method used to conceal the allocation was not described so that intervention allocations may have been foreseen in advance of, or during, enrolment.
-
High risk of bias: the allocation sequence was likely to be known to the investigators who assigned the participants.
Blinding of participants, personnel and outcome assessors
-
Low risk of bias: blinding was performed adequately, or the assessment of outcomes was not likely to be influenced by lack of blinding.
-
Uncertain risk of bias: information was insufficient to allow assessment of whether blinding was likely to induce bias on the results.
-
High risk of bias: no blinding or incomplete blinding was provided, and assessment of outcomes was likely to be influenced by lack of blinding.
Incomplete outcome data
-
Low risk of bias: missing data were unlikely to make treatment effects depart from plausible values. Sufficient methods, such as multiple imputation, have been employed to handle missing data.
-
Uncertain risk of bias: information was insufficient to allow assessment of whether missing data in combination with the method used to handle missing data were likely to induce bias on the results.
-
High risk of bias: the results were likely to be biased because of missing data.
Selective outcome reporting
-
Low risk of bias: all outcomes were predefined and reported, or all clinically relevant and reasonably expected outcomes were reported.
-
Uncertain risk of bias: it is unclear whether all predefined and clinically relevant and reasonably expected outcomes were reported.
-
High risk of bias: one or more clinically relevant and reasonably expected outcomes were not reported, and data on these outcomes were likely to have been recorded.
To be assessed with low risk of bias in the selective outcome reporting domain, the trial should have been registered on the www.clinicaltrials.gov website or a similar register, or a protocol should exist (e.g. published in a paper journal). In cases where the trial was run and published during the years when trial registration was not required, we tried to carefully scrutinise the publication reporting on the trial to identify the trial objectives and outcomes. If usable data on all outcomes specified in the trial objectives were provided in the publication's results section, the trial was considered to have low risk of bias in the 'Selective outcome reporting' domain.
Industry bias
-
Low risk of bias: the trial is not funded by a manufacturer of vitamin D.
-
Uncertain risk of bias: the source of funding is not clear.
-
High risk of bias: the trial is funded by a manufacturer of vitamin D.
Other bias
-
Low risk of bias: the trial appears to be free of other components that could put it at risk of bias.
-
Uncertain risk of bias: the trial may or may not be free of other components that could put it at risk of bias.
-
High risk of bias: other factors in the trial could put it at risk of bias (e.g. authors have conducted trials on the same topic, etc).
Trials assessed as having 'low risk of bias' in all of the individual domains specified above were considered 'trials with low risk of bias'. Trials assessed as having 'uncertain risk of bias' or 'high risk of bias' in one or more of the specified individual domains were considered trials with 'high risk of bias' (Gluud 2011).
Dealing with missing data
We tried to obtain relevant missing data from authors of the included trials. We performed an evaluation of important numerical data such as screened, eligible and randomly assigned participants, as well as intention‐to‐treat (ITT) and per‐protocol (PP) populations. We investigated attrition (i.e. dropouts, losses to follow‐up, and withdrawals).
Dealing with duplicate publications
In the case of duplicate publications and companion papers of a primary trial, we tried to maximise the yield of information by simultaneously evaluating all available data. When doubts arose, the publication that reported the longest follow‐up (usually the most recent publication) was given priority.
Assessment of heterogeneity
We identified heterogeneity through visual inspection of the forest plots by using a standard Chi2 test and a significance level of α = 0.1. In view of the low power of such tests, we also examined heterogeneity by using the I2 statistic (Higgins 2002); I2 values of 50% or more indicate a substantial level of heterogeneity (Higgins 2003). When heterogeneity was found, we attempted to determine potential reasons for it by examining individual trial characteristics and subgroups of the main body of evidence. For heterogeneity adjustment of the required information size, we used diversity, the D2 statistic (Wetterslev 2009).
Assessment of reporting biases
Funnel plots were used to assess the potential existence of bias (Lau 2006). Several explanations can be offered for the asymmetry of a funnel plot, including true heterogeneity of effect with respect to trial size, poor methodological design (and hence bias of small trials) and publication bias. We performed adjusted rank correlation (Begg 1994) and a regression asymmetry test for detection of bias (Egger 1997).
Data synthesis
We performed this review and meta‐analyses in accordance with the recommendations of the Cochrane Handbook for Systematic Reviews of Interventions (Higgins 2011).
For the statistical analyses, we used Review Manager 5.2 (RevMan 2012), Trial Sequential Analysis version 0.9 beta (TSA 2011), STATA 8.2 (STATA Corp, College Station, Texas) and Sigma Stat 3.0 (SPSS Inc, Chicago, Illinois). For dichotomous outcomes, we calculated the Mantel‐Haenszel risk ratios (RRs) (Gluud 2008). For all association measures, 95% confidence intervals (CIs) were used. We analysed the data with both fixed‐effect (DeMets 1987) and random‐effects (DerSimonian 1986) model meta‐analyses. In cases where no difference in statistical significance was observed between the results obtained with the two models, we presented the result of the random‐effects model analysis. Otherwise, we presented the results of both analyses.
We calculated weighted averages for factors related to the trials such as duration of the intervention and length of the follow‐up period.
Analyses were performed using the intention‐to‐treat (ITT) principle, including all randomly assigned participants, irrespective of completeness of data. Participants with missing data were included in the analyses using a carry forward of the last observed response. Accordingly, participants who had been lost to follow‐up were counted as being alive.
Review Manager 5.2 does not include trials with zero events in both intervention groups when calculating RR (RevMan 2012). To account for trials with zero events, meta‐analyses of dichotomous data were repeated using risk differences (RDs) (Friedrich 2007; Keus 2009). The influence of trials with zero events in the treatment, control or both groups was also assessed by recalculating the random‐effects model meta‐analyses with 0.5, 0.01 and 0.001 as empirical continuity corrections (Bradburn 2007; Sweeting 2004) using Trial Sequential Analysis version 0.9 beta (TSA 2011; www.ctu.dk/tsa).
For trials using a factorial design that tested vitamin D parallel to any other intervention (i.e. hormone replacement therapy, other vitamins, etc), we used 'inside the table' analysis in which we compared only the vitamin D intervention group versus the placebo or no intervention group. Otherwise, we used 'at margins' analysis (McAlister 2003). In trials with parallel‐group design with more than two intervention groups and additional therapy, we compared the vitamin D singly administered group versus the placebo or no intervention group.
We included in the analyses individually randomised trials as well as cluster‐randomised trials. Data from cluster‐randomised trials were incorporated using the generic inverse variance method. We explored the association between intervention effects of vitamin D and the subgrouping of individually randomised and cluster‐randomised trials. The influence of cluster‐randomised trials on our results was also explored in sensitivity analyses, which either included or excluded them.
We compared the intervention effects in subgroups of trials using the method described by Bornstein et al (Borenstein 2009) and implemented in RevMan 5.2 for all types of meta‐analyses.
Trial sequential analysis
A cumulative meta‐analysis runs the risk of random errors due to analysis of sparse data and repetitive testing of data (Thorlund 2009; Thorlund 2011a; Thorlund 2011b; Wetterslev 2008). We conducted trial sequential analyses to control the risk of random errors and to prevent premature statements of superiority of the experimental or control intervention or probably falsely declarations of absence of effect in cases for which we have too few data (Thorlund 2011a; Thorlund 2011b; Wetterslev 2008). We performed trial sequential analyses with a type I error of 5%, a type II error of 20% (80% power) and a diversity‐adjusted required information size (Brok 2008; Brok 2009; Thorlund 2009; Wetterslev 2008; Wetterslev 2009). We assumed an event proportion of 10% of deaths in the control group (Autier 2007) and an anticipated intervention effect of 5% relative risk reduction or otherwise as stated. Trials were entered into trial sequential analyses according to year of publication, and in cases where more than one trial was published in a year, trial entrance followed alphabetically the family name of the first author.
Subgroup analysis and investigation of heterogeneity
We performed subgroup analyses in cases where one of the primary outcome measures showed statistically significant differences between intervention groups.
We performed the following subgroup analyses.
-
Trials at low risk of bias compared with trials at high risk of bias.
-
Placebo‐controlled trials compared with trials with no intervention in the control group.
-
Individually randomised trials compared with cluster‐randomised trials.
-
Primary prevention trials compared with secondary prevention trials.
-
Vitamin D3 compared with placebo or no intervention.
-
Trials that administered vitamin D3 singly compared with trials that administered vitamin D3 combined with calcium.
-
Trials that administered low‐dose vitamin D3 compared with trials that administered high‐dose vitamin D3.
-
Trials that administered vitamin D3 daily compared with trials that administered vitamin D3 intermittently.
-
Trials that administered vitamin D3 to vitamin D–sufficient participants compared with trials that administered vitamin D3 to vitamin D–insufficient participants.
-
Vitamin D2 compared with placebo or no intervention.
-
Trials that administered vitamin D2 singly compared with trials that administered vitamin D2 combined with calcium.
-
Trials that administered low‐dose vitamin D2 compared with trials that administered high‐dose vitamin D2.
-
Trials that administered vitamin D2 daily compared with trials that administered vitamin D2 intermittently.
-
Trials that administered vitamin D2 to vitamin D–sufficient participants compared with trials that administered vitamin D2 to vitamin D–insufficient participants.
-
Alfacalcidol compared with placebo or no intervention.
-
Trials that administered alfacalcidol to vitamin D–sufficient participants compared with trials that administered alfacalcidol to vitamin D–insufficient participants.
-
Calcitriol compared with placebo or no intervention.
-
Trials that administered calcitriol to vitamin D–sufficient participants compared with trials that administered calcitriol to vitamin D–insufficient participants.
Sensitivity analysis
We performed the following sensitivity analyses to explore the influence of these factors on the intervention effect size.
-
Repeating the analysis while excluding cluster‐randomised trials.
-
Repeating the analysis while including trials with zero mortality in both intervention groups.
-
Repeating the analysis while taking attrition bias into consideration.
Results
Description of studies
Results of the search
We identified a total of 5995 references of possible interest by searching The Cochrane Library (n = 1118), MEDLINE (n = 1263), EMBASE (n = 1836), LILACS (n = 505), Science Citation Index–Expanded (n = 1205), Conference Proceedings Citation Index–Science (n = 28) and reference lists (n = 40). We excluded 4802 duplicates and 842 clearly irrelevant references by reading the abstracts. Accordingly, 351 references were retrieved for further assessment. Of these, we excluded 95 references describing 82 studies because they were not randomised clinical trials or did not fulfil our review protocol inclusion criteria. Reasons for exclusion are listed in the table Characteristics of excluded studies.
In total, 159 randomised trials described in 256 publications fulfilled our inclusion criteria (Figure 1). They included a total of 105,992 participants. In total, 94 trials described in 114 publications reported no deaths (Abu‐Mouch 2011; Aloia 1988; Aloia 1990; Aloia 2008; Aloia 2010; Andersen 2009; Angeles‐Agdeppa 2010; Armas 2004b; Arvold 2009; Bang 2011; Barnes 2006; Barnes 2011; Biancuzzo 2010; Braam 2004; Bunout 2006; Burton 2010; Caniggia 1984; Cashman 2008; Chen 1997; Christiansen 1980; Christiansen 1981; Dawson‐Hughes 1991; Deroisy 2002; Dhesi 2004; Di 2004; Domrongkitchaiporn 2000; Ebeling 2001; Fliser 1997; Forsythe 2012; Gallagher 1982; Gorai 1999; Green 2010; Harris 1999; Harris 2002; Himeno 2009; Himmelstein 1990; Holick 2008c; Hulshof 2000; Hunter 2000; Ishida 2004; Islam 2010; Jensen 1982a; Jensen 1982b; Jensen 1985; Johnson 1980; Jorde 2008; Jorde 2009; Jorde 2010a; Jorde 2010b; Jorde 2010c; Jorde 2010d; Jorde 2010e; Kenny 2003; Khaw 1994; Kimball 2011; Kruger 2010; Kuwabara 2009; Laaksi 2010; Lambrinoudaki 2000; Lappe 2008; Li‐Ng 2009; Lind 1989; Lind 1992; Lips 1988; Ljunghall 1987; Major 2007; Major 2009; Maki 2011; Malhotra 2009; Martin‐Bautista 2010; Menczel 1994; Mitri 2011; Nagpal 2009; Nelson 2009; Nordin 1985; Ongphiphadhanakul 2000; Orimo 1994; Orwoll 1988; Orwoll 1994; Patel 2001; Pfeifer 2000; Pfeifer 2001; Pfeifer 2009; Pignotti 2010; Pilz 2011; Schaafsma 2000; Scragg 1995a; Scragg 1995b; Shiomi 1999a; Shiomi 1999b; Shiraki 1985; Shiraki 1996; Shiraki 2004; Sneve 2008; Son 2001; Songpatanasilp 2009; Sorva 1991; Sugden 2008; Urbain 2011; Ushiroyama 1995; Ushiroyama 2001; Ushiroyama 2002; Van Der Klis 1996; Viljakainen 2006; Viljakainen 2009; von Hurst 2008; von Hurst 2009; von Hurst 2010a; von Hurst 2010b; Weisman 1986; Wicherts 2010; Yusupov 2010; Zittermann 2009b; Zubillaga 2006). We contacted the authors, and the authors of 62 trials confirmed that mortality was indeed zero. For 32 trials, we did not obtain such confirmation. Nine trials reported on deaths (n ≈ 50), but they did not report the trial intervention group in which the deaths occurred (Cashman 2009; Chapuy 1987; Doetsch 2004; Fedirko 2010; Gallagher 1989; Keane 1998; Moreira‐Pfrimer 2009; Orwoll 1990; Peacock 2000). The study authors did not reply to our request for additional information.

Study flow diagram.
In total, 56 trials described in 154 publications, with 95,286 participants, provided data for our analyses of mortality. A further 62 trials with zero mortality in both experimental and control groups were included in our sensitivity analyses.
We contacted 139 study authors to ask for the missing information and received answers from authors of 91 randomised clinical trials (65%).
We identified an additional 11 ongoing randomised clinical trials by searching databases of ongoing trials. Data from these trials will be included in future updates of this review.
Included studies
The included trials are described in detail in the tables Characteristics of included studies; Table 1; Table 2; Table 3; Table 4; Appendix 2; Appendix 3; Appendix 4; Appendix 5; and Appendix 6.
| Characteristic Study ID | Design | Arms | Bias | Blinding | Participants | Women | Mean |
| Aloia 2005 | Parallel | 2 | Low | PL | 208 | 100 | 60 |
| Avenell 2004 | 2 × 2 | 4 | High | NI | 134 | 83 | 77 |
| Avenell 2012 | 2 × 2 | 4 | Low | PL | 5292 | 85 | 77 |
| Baeksgaard 1998 | Parallel | 3 | High | PL | 240 | 100 | 62.5 |
| Bischoff 2003 | Parallel | 2 | High | PL | 122 | 100 | 85.3 |
| Bjorkman 2007 | Parallel | 3 | Low | PL | 218 | 82 | 84.5 |
| Bolton‐Smith 2007 | 2 × 2 | 4 | Low | PL | 244 | 100 | 68 |
| Brazier 2005 | Parallel | 2 | High | PL | 192 | 100 | 74.6 |
| Broe 2007 | Parallel | 5 | Low | PL | 124 | 73 | 89 |
| Brohult 1973 | Parallel | 2 | High | PL | 50 | 68 | 52 |
| Burleigh 2007 | Parallel | 2 | Low | PL | 205 | 59 | 83 |
| Campbell 2005 | 2 × 2 | 4 | High | NI | 391 | 68 | 83.6 |
| Chapuy 1992 | Parallel | 2 | High | PL | 3270 | 100 | 84 |
| Chapuy 2002 | Parallel | 3 | High | PL | 610 | 100 | 85 |
| Chel 2008 | Parallel | 6 | High | PL | 338 | 77 | 84 |
| Cherniack 2011 | Parallel | 2 | High | PL | 46 | 2 | 80 |
| Cooper 2003 | Parallel | 2 | Low | PL | 187 | 100 | 56 |
| Corless 1985 | Parallel | 2 | High | PL | 65 | 78 | 82.4 |
| Daly 2008 | Parallel | 2 | High | NI | 167 | 0 | 61.9 |
| Dawson‐Hughes 1997 | Parallel | 2 | Low | PL | 389 | 55 | 71 |
| Dukas 2004 | Parallel | 2 | Low | PL | 378 | 51 | 71 |
| Flicker 2005 | Parallel | 2 | Low | PL | 625 | 95 | 83.4 |
| Gallagher 2001 | 2 × 2 | 4 | Low | PL | 489 | 100 | 71.5 |
| Glendenning 2012 | Parallel | 2 | Low | PL | 686 | 100 | 76.7 |
| Grady 1991 | Parallel | 2 | High | PL | 98 | 54 | 79.1 |
| Grimnes 2011 | Parallel | 2 | Low | PL | 104 | 49 | 52 |
| Harwood 2004 | Parallel | 4 | High | NI | 150 | 100 | 81.2 |
| Jackson 2006 | Parallel | 2 | Low | PL | 36,282 | 100 | 62.4 |
| Janssen 2010 | Parallel | 2 | Low | PL | 70 | 100 | 80.8 |
| Komulainen 1999 | 2 × 2 | 4 | Low | PL | 464 | 100 | 52.7 |
| Krieg 1999 | Parallel | 2 | High | NI | 248 | 100 | 84.5 |
| Kärkkäinen 2010 | Parallel | 2 | High | NI | 3139 | 100 | 67 |
| Lappe 2007 | Parallel | 3 | High | PL | 1179 | 100 | 66.7 |
| Larsen 2004 | 2 × 2 | 4 | High | NI | 9605 | 60 | 75 |
| Latham 2003 | 2 × 2 | 4 | Low | PL | 243 | 53 | 79.5 |
| Law 2006 | Parallel | 2 | High | NI | 3717 | 76 | 85 |
| Lehouck 2012 | Parallel | 2 | Low | PL | 181 | 20 | 68 |
| Lips 1996 | Parallel | 2 | Low | PL | 2578 | 74 | 80 |
| Lips 2010 | Parallel | 2 | Low | PL | 226 | NR | 78 |
| Lyons 2007 | Parallel | 2 | Low | PL | 3440 | 76 | 84 |
| Meier 2004 | Parallel | 2 | High | NI | 55 | 65 | 56.5 |
| Mochonis 2006 | Parallel | 3 | High | NI | 112 | 100 | 60.3 |
| Ooms 1995 | Parallel | 2 | Low | PL | 348 | 100 | 80.3 |
| Ott 1989 | Parallel | 2 | High | PL | 86 | 100 | 67.5 |
| Porthouse 2005 | Parallel | 2 | High | NI | 3314 | 100 | 76.8 |
| Prince 2008 | Parallel | 2 | Low | PL | 302 | 100 | 77.2 |
| Sanders 2010 | Parallel | 2 | Low | PL | 2258 | 100 | 76.0 |
| Sato 1997 | Parallel | 2 | High | PL | 64 | 45 | 68.5 |
| Sato 1999a | Parallel | 2 | High | PL | 86 | 78 | 70.6 |
| Sato 1999b | Parallel | 3 | High | NI | 103 | 56 | 70.7 |
| Sato 2005a | Parallel | 2 | Low | PL | 96 | 100 | 74.1 |
| Schleithoff 2006 | Parallel | 2 | Low | PL | 123 | 17 | 51 |
| Smith 2007 | Parallel | 2 | Low | PL | 9440 | 54 | 79.1 |
| Trivedi 2003 | Parallel | 2 | Low | PL | 2686 | 24 | 74.7 |
| Witham 2010 | Parallel | 2 | Low | PL | 105 | 34 | 79.7 |
| Zhu 2008 | Parallel | 3 | Low | PL | 120 | 100 | 75 |
NI: no intervention; NR: not reported; PL: placebo
| Characteristic Study ID | Participants | Outcome Measures | Country | Sponsor |
| Aloia 2005 | Black postmenopausal African‐American women | Bone mineral density | USA | No |
| Avenell 2004 | Elderly people with an osteoporotic fracture within the past 10 years | Recruitment, compliance and retention within a randomised trial | UK | Yes |
| Avenell 2012 | Elderly people with low‐trauma osteoporotic fracture in the previous 10 years | Fractures | UK | Yes |
| Baeksgaard 1998 | Postmenopausal women | Bone mineral density | Denmark | Yes |
| Bischoff 2003 | Elderly women living in institutional care | Falls | Switzerland | Yes |
| Bjorkman 2007 | Chronically bedridden patients | Parathyroid function and bone mineral density | Finland | Yes |
| Bolton‐Smith 2007 | Elderly non‐osteoporotic women | Bone mineral density | UK | Yes |
| Brazier 2005 | Elderly vitamin D–insufficient women | Bone mineral density | France | Yes |
| Broe 2007 | Nursing home residents | Falls | USA | Yes |
| Brohult 1973 | Patients with rheumatoid arthritis | Objective and subjective improvement | Sweden | Yes |
| Burleigh 2007 | Older geriatric inpatients | Falls | UK | Yes |
| Campbell 2005 | Elderly people with visual impairment | Numbers of falls and injuries resulting from falls | New Zealand | No |
| Chapuy 1992 | Healthy ambulatory women | Fractures | France | Yes |
| Chapuy 2002 | Elderly people living in institutional care | Biochemical variables of calcium homeostasis, femoral neck bone mineral density and hip | France | Yes |
| Chel 2008 | Nursing home residents | Vitamin D status | Netherlands | Yes |
| Cherniack 2011 | Elderly people | Vitamin D status | USA | Yes |
| Cooper 2003 | Postmenopausal women | Bone mineral density | Australia | Yes |
| Corless 1985 | Elderly patients from the geriatric wards | Abilities to carry out basic activities of daily life | UK | Yes |
| Daly 2008 | Healthy ambulatory men | Bone mineral density | Australia | Yes |
| Dawson‐Hughes 1997 | Healthy ambulatory participants | Bone mineral density | USA | Yes |
| Dukas 2004 | Elderly people | Falls | Switzerland | Yes |
| Flicker 2005 | Elderly people living in institutional care | Falls and fractures | Australia | No |
| Gallagher 2001 | Elderly women | Bone mineral density | USA | No |
| Glendenning 2012 | Elderly community‐dwelling ambulatory women | Falls, muscular strength and mobility | Australia | No |
| Grady 1991 | Elderly people | Muscle strength | USA | Yes |
| Grimnes 2011 | Healthy people with a low vitamin D status | Insulin sensitivity and secretion | Norway | No |
| Harwood 2004 | Elderly women following surgery for hip fracture | Bone mineral density, falls and fractures | UK | Yes |
| Jackson 2006 | Postmenopausal women | Fractures | USA | Yes |
| Janssen 2010 | Elderly vitamin D–insufficient women | Muscle strength, power and functional mobility | Netherlands | Yes |
| Komulainen 1999 | Postmenopausal women | Bone mineral density | Finland | Yes |
| Krieg 1999 | Elderly institutionalised women | Bone mineral density | Switzerland | Yes |
| Kärkkäinen 2010 | Postmenopausal women | Falls | Finland | Yes |
| Lappe 2007 | Healthy postmenopausal white women | Fractures | USA | Yes |
| Larsen 2004 | Older community‐dwelling residents | Falls | Denmark | Yes |
| Latham 2003 | Frail elderly people | Self‐rated physical health and falls | New Zealand | No |
| Law 2006 | Nursing home residents | Falls and fractures | UK | No |
| Lehouck 2012 | Patients with chronic obstructive pulmonary disease | Time to first exacerbation | Belgium | Yes |
| Lips 1996 | Elderly people | Fractures | Netherlands | Yes |
| Lips 2010 | Elderly people with vitamin D insufficiency | Postural stability, muscle strength and safety | Netherlands | No |
| Lyons 2007 | Older people living in institutional care | Fractures | UK | No |
| Meier 2004 | Healthy volunteers | Bone mineral density | Germany | No |
| Mochonis 2006 | Postmenopausal women | Bone mineral density | Greece | Yes |
| Ooms 1995 | Elderly people | Bone mineral density | Netherlands | Yes |
| Ott 1989 | Postmenopausal women | Bone mass | USA | Yes |
| Porthouse 2005 | Elderly women with one or more risk factors for hip fracture | Fractures | UK | Yes |
| Prince 2008 | Elderly women with a history of falling and vitamin D insufficiency | Falls | Australia | Yes |
| Sanders 2010 | Elderly women at high risk of fracture | Falls and fractures | Australia | Yes |
| Sato 1997 | Outpatients with hemiplegia after stroke | Bone mineral density and fractures | Japan | No |
| Sato 1999a | Elderly patients with Parkinson's disease | Fractures | Japan | No |
| Sato 1999b | Outpatients with hemiplegia after stroke | Bone mineral density | Japan | Yes |
| Sato 2005a | Hospitalised elderly women with post‐stroke hemiplegia | Falls | Japan | No |
| Schleithoff 2006 | Patients with congestive heart failure | Mortality | Germany | Yes |
| Smith 2007 | Elderly people | Fractures | UK | No |
| Trivedi 2003 | Elderly people | Mortality, fractures | UK | No |
| Witham 2010 | Patients with systolic heart failure | Exercise capacity | UK | No |
| Zhu 2008 | Elderly women | Bone mineral density | Australia | No |
| Characteristic Study ID | D3 | D2 | 1α(OH)D | 1,25(OH)2D | Ca | Regimen | Route | Treatment | Follow‐up |
| Aloia 2005 | 800 |
|
|
| 1200‐1500a | Daily | Oral | 3 | 3 |
| Avenell 2004 | 800 |
|
|
| 1000b | Daily | Oral | 1 | 1 |
| Avenell 2012 | 800 |
|
|
| 500b | Daily | Oral | 3.75 | 6.2 |
| Baeksgaard 1998 | 560 |
|
|
| 1000 | Daily | Oral | 2 | 2 |
| Bischoff 2003 | 800 |
|
|
| 1200a | Daily | Oral | 0.25 | 0.25 |
| Bjorkman 2007 | 400 |
|
|
| 500a | Daily | Oral | 0.5 | 0.5 |
| Bolton‐Smith 2007 | 400 |
|
|
| 1000 | Daily | Oral | 2 | 2 |
| Brazier 2005 | 800 |
|
|
| 1000 | Daily | Oral | 1 | 1 |
| Broe 2007 |
| 200 |
|
|
| Daily | Oral | 0.42 | 0.42 |
| Brohult 1973 | 100,000 | Daily | Oral | 1 | 1 | ||||
| Burleigh 2007 | 800 |
|
|
| 1200a | Daily | Oral | 0.08 | 0.08 |
| Campbell 2005 | 50,000 100,000 |
|
|
|
| Monthly | Oral | 1 | 1 |
| Chapuy 1992 | 800 |
|
|
| 1200 | Daily | Oral | 1.5 | 4 |
| Chapuy 2002 | 800 |
|
|
| 1200 | Daily | Oral | 2 | 2 |
| Chel 2008 | 600 |
|
|
| 800 | Daily | Oral | 0.33 | 0.33 |
| Cherniack 2011 | 2000 | 1200a | Daily | Oral | 0.5 | 0.5 | |||
| Cooper 2003 |
| 10,000 |
|
| 1000a | Weekly | Oral | 2 | 2 |
| Corless 1985 |
| 9000 |
|
|
| Daily | Oral | 0.75 | 0.75 |
| Daly 2008 | 800 |
|
|
| 1000 | Daily | Oral | 2 | 3.5 |
| Dawson‐Hughes 1997 | 700 |
|
|
| 500 | Daily | Oral | 3 | 3 |
| Dukas 2004 |
|
| 1 |
|
| Daily | Oral | 0.75 | 0.75 |
| Flicker 2005 |
| 1000 |
|
| 600a | Daily | Oral | 2 | 2 |
| Gallagher 2001 |
|
|
| 0.5 |
| Daily | Oral | 3 | 5 |
| Glendenning 2012 | 150,000 | Three‐monthly | Oral | 0.5 | 0.75 | ||||
| Grady 1991 |
|
|
| 0.5 |
| Daily | Oral | 0.5 | 0.5 |
| Grimnes 2011 | 20,000 | Twice weekly | Oral | 0.5 | 0.5 | ||||
| Harwood 2004 | 800 | 300,000 |
|
| 1000 | Single dose | Intramuscular Oral | 1 | 1 |
| Jackson 2006 | 400 |
|
|
| 1000 | Daily | Oral | 7 | 7 |
| Janssen 2010 | 400 | 500a | Daily | Oral | 0.5 | 0.5 | |||
| Komulainen 1999 | 300 |
|
|
| 500 | Daily | Oral | 5 | 5 |
| Krieg 1999 | 880 |
|
|
| 1000 | Daily | Oral | 2 | 2 |
| Kärkkäinen 2010 | 800 |
|
|
| 1000 | Daily | Oral | 3 | 3 |
| Lappe 2007 | 1000 |
|
|
| 1400‐1500b | Daily | Oral | 4 | 4 |
| Larsen 2004 | 400 |
|
|
| 1000 | Daily | Oral | 3.5 | 3.5 |
| Latham 2003 | 300,000 |
|
|
|
| Single dose | Oral | 0.003 | 0.5 |
| Law 2006 |
| 100,000 |
|
|
| Four‐monthly | Oral | 0.83 | 0.83 |
| Lehouck 2012 | 100,000 | Monthly | Oral | 1 | 1 | ||||
| Lips 1996 | 400 |
|
|
|
| Daily | Oral | 3.5 | 3.5 |
| Lips 2010 | 8400 | 500a | weekly | Oral | 0.31 | 0.31 | |||
| Lyons 2007 |
| 100,000 |
|
|
| Four‐monthly | Oral | 3 | 3 |
| Meier 2004 | 500 |
|
|
| 500 | Daily | Oral | 0.5 | 1 |
| Mochonis 2006 | 300 |
|
|
| 1200b | Daily | Oral | 1 | 1 |
| Ooms 1995 | 400 |
|
|
|
| Daily | Oral | 2 | 2 |
| Ott 1989 |
|
|
| 0.5 | 1000a | Daily | Oral | 2 | 2 |
| Porthouse 2005 | 800 |
|
|
| 1000 | Daily | Oral | 2 | 2 |
| Prince 2008 |
| 1000 |
|
| 1000a | Daily | Oral | 1 | 1 |
| Sanders 2010 | 500,000 | Yearly | Oral | 2.96 | 2.96 | ||||
| Sato 1997 |
|
| 1 |
| 300a | Daily | Oral | 0.5 | 0.5 |
| Sato 1999a |
|
| 1 |
|
| Daily | Oral | 1.5 | 1.5 |
| Sato 1999b |
|
| 1 |
|
| Daily | Oral | 1 | 1 |
| Sato 2005a |
| 1000 |
|
|
| Daily | Oral | 2 | 2 |
| Schleithoff 2006 | 2000 |
|
|
| 500a | Daily | Oral | 0.75 | 1.25 |
| Smith 2007 |
| 300,000 |
|
|
| Yearly | Intramuscular | 3 | 3 |
| Trivedi 2003 | 100,000 |
|
|
|
| Four‐monthly | Oral | 5 | 5 |
| Witham 2010 | 100,000 |
|
|
| 10‐weekly | Oral | 0.38 | 0.38 | |
| Zhu 2008 |
| 1000 |
|
| 1200b | Daily | Oral | 5 | 5 |
aEqual dose of calcium was administered to a control group
bCalcium was tested singly in one arm of the trial as well as combined with vitamin D; placebo or no intervention group of the trial was not supplemented with calcium
1α(OH)D: alfacalcidol; 1,25(OH)2D: calcitriol; IU: international units; µg: microgram
| Characteristic Study ID | Intervention(s) and control(s) | [N] screened / eligible | [N] randomised | [N] ITT | [N] finishing study | [%] of randomised participants |
| 1. Aloia 2005 | I: vitamin D3 plus calcium | 322 | 104 | 104 | 74 | 71 |
| C: placebo | 104 | 104 | 74 | 71 | ||
| total: | 208 | 208 | 148 | 71 | ||
| 2. Avenell 2004 | I: vitamin D3 | 180 | 70 | 70 | ‐ | ‐ |
| C: no intervention | 64 | 64 | ‐ | ‐ | ||
| total: | 134 | 134 | ‐ | ‐ | ||
| 3. Avenell 2012 | I: vitamin D3 | 15,024 | 2649 | 2649 | 1813 | 68 |
| C: matched placebo tablets | 2643 | 2643 | 1762 | 67 | ||
| total: | 5292 | 5292 | 3575 | 68 | ||
| 4. Baeksgaard 1998 | I: vitamin D3 plus calcium | ‐ | 80 | 80 | 65 | 81 |
| C: matched placebo tablets | 80 | 80 | 64 | 80 | ||
| total: | 160 | 160 | 129 | 80 | ||
| 5. Bischoff 2003 | I: vitamin D3 plus calcium | 130 | 62 | 62 | ‐ | ‐ |
| C: calcium | 60 | 60 | ‐ | ‐ | ||
| total: | 122 | 122 | 89 | 73 | ||
| 6. Bjorkman 2007 | I: vitamin D3 plus calcium | 1215 | 150 | 150 | 123 | 82 |
| C: calcium | 68 | 68 | 59 | 87 | ||
| total: | 218 | 218 | 182 | 83 | ||
| 7. Bolton‐Smith 2007 | I: vitamin D3 plus calcium | ‐ | 62 | 62 | 50 | 81 |
| C: matched placebo | 61 | 61 | 56 | 92 | ||
| total: | 123 | 123 | 106 | 86 | ||
| 8. Brazier 2005 | I: vitamin D3 plus calcium | 360 | 95 | 95 | 74 | 78 |
| C: matched placebo tablets | 97 | 97 | 68 | 70 | ||
| total: | 192 | 192 | 142 | 74 | ||
| 9. Broe 2007 | I: vitamin D2 | 126 | 99 | 99 | 96 | 97 |
| C: matched placebo tablets | 25 | 25 | 25 | 100 | ||
| total: | 124 | 124 | 121 | 98 | ||
| 10. Brohult 1973 | I: vitamin D3 | ‐ | 25 | 25 | 24 | 96 |
| C: placebo | 25 | 25 | 25 | 100 | ||
| total: | 50 | 50 | 49 | 98 | ||
| 11. Burleigh 2007 | I: vitamin D3 plus calcium | 515 | 101 | 101 | 98 | 97 |
| C: placebo | 104 | 104 | 101 | 97 | ||
| total: | 205 | 205 | 199 | 97 | ||
| 12. Campbell 2005 | I: home safety assessment and modification programme | 391 | 195 | 195 | 177 | 91 |
| C: social visits | 196 | 196 | 184 | 94 | ||
| total: | 391 | 391 | 361 | 92 | ||
| 13. Chapuy 1992 | I: vitamin D3 plus calcium | ‐ | 1634 | 1634 | 1590 | 97 |
| C: double placebo | 1636 | 1636 | 1573 | 96 | ||
| total: | 3270 | 3270 | 3163 | 96 | ||
| 14. Chapuy 2002 | I: vitamin D3 plus calcium | 639 | 393 | 393 | ‐ | ‐ |
| C: double placebo | 190 | 190 | ‐ | ‐ | ||
| total: | 583 | 583 | ‐ | ‐ | ||
| 15. Chel 2008 | I: vitamin D3 | 1006 | 166 | 166 | 139 | 84 |
| C: matched placebo tablets | 172 | 172 | 137 | 80 | ||
| total: | 338 | 338 | 276 | 82 | ||
| 16. Cherniack 2011 | I: vitamin D3 plus calcium | 52 | 23 | 23 | 17 | 74 |
| C: matched placebo plus calcium | 23 | 23 | 17 | 74 | ||
| total: | 46 | 46 | 34 | 74 | ||
| 17. Cooper 2003 | I: vitamin D2 plus calcium | ‐ | 93 | 93 | 73 | 78 |
| C: calcium | 94 | 94 | 80 | 85 | ||
| total: | 187 | 187 | 153 | 82 | ||
| 18. Coreless 1985 | I: vitamin D2 | 320 | 32 | 32 | 8 | 25 |
| C: placebo | 33 | 33 | 17 | 51 | ||
| total: | 65 | 65 | 25 | 38 | ||
| 19. Daly 2006 | I: calcium‐vitamin D3–fortified milk plus calcium | 422 | 85 | 85 | 76 | 89 |
| C: no intervention | 82 | 82 | 73 | 89 | ||
| total: | 167 | 167 | 149 | 89 | ||
| 20. Dawson‐Hughes 1997 | I: vitamin D3 plus calcium | 545 | 187 | 187 | 148 | 79 |
| C: placebo | 202 | 202 | 170 | 84 | ||
| total: | 389 | 389 | 318 | 82 | ||
| 21. Dukas 2004 | I: alfacalcidol | 410 | 192 | 192 | ‐ | ‐ |
| C: placebo | 186 | 186 | ‐ | ‐ | ||
| total: | 378 | 378 | ‐ | ‐ | ||
| 22. Flicker 2005 | I: vitamin D3 plus calcium | 1767 | 313 | 313 | 269 | 86 |
| C: calcium | 312 | 312 | 271 | 87 | ||
| total: | 625 | 625 | 540 | 86 | ||
| 23. Gallagher 2001 | I: calcitriol | 1905 | 123 | 123 | 101 | 82 |
| C: matched placebo | 123 | 123 | 112 | 91 | ||
| total: | 246 | 246 | 213 | 87 | ||
| 24. Glendenning 2012 | I: cholecalciferol 150,000 three‐monthly | 2110 | 353 | 353 | 331 | 94 |
| C: placebo vitamin D | 333 | 333 | 307 | 92 | ||
| total: | 686 | 686 | 638 | 93 | ||
| 25. Grady 1991 | I: calcitriol | 98 | 50 | 50 | 49 | 98 |
| C: placebo vitamin D | 48 | 48 | 47 | 98 | ||
| total: | 98 | 98 | 96 | 98 | ||
| 26. Grimnes 2011 | I: vitamin D3 | 108 | 51 | 51 | 49 | 96 |
| C: placebo | 53 | 53 | 45 | 85 | ||
| total: | 104 | 104 | 94 | 90 | ||
| 27. Harwood 004 | I: vitamin D plus calcium | 208 | 113 | 113 | ‐ | ‐ |
| C: no intervention | 37 | 37 | ‐ | ‐ | ||
| total: | 150 | 150 | ‐ | ‐ | ||
| 28. Jackson 2006 | I: vitamin D3 plus calcium | 68,132 | 18,176 | 18,176 | 16,936 | 93 |
| C: matched placebo | 18,106 | 18,106 | 16,815 | 93 | ||
| total: | 36,282 | 36,282 | 33,751 | 93 | ||
| 29. Janssen 2010 | I: vitamin D3 plus calcium | 91 | 36 | 36 | 18 | 50 |
| C: matched placebo vitamin D3 plus calcium | 34 | 34 | 31 | 91 | ||
| total: | 70 | 70 | 49 | 70 | ||
| 30. Komulainen 1999 | I: oestradiol valerate and cyproterone acetate | 13,100 | 116 | 116 | ‐ | ‐ |
| C: placebo | 116 | 116 | ‐ | ‐ | ||
| total: | 232 | 232 | ‐ | ‐ | ||
| 31. Krieg 1999 | I: vitamin D3 plus calcium | ‐ | 124 | 124 | 50 | 40 |
| C: no treatment | 124 | 124 | 53 | 43 | ||
| total: | 248 | 248 | 103 | 41 | ||
| 32. Kärkkäinen 2010 | I: vitamin D3 plus calcium | 5407 | 1718 | 1718 | 1566 | 91 |
| C: no treatment | 1714 | 1714 | 1573 | 92 | ||
| total: | 3432 | 3432 | 3139 | 91 | ||
| 33. Lappe 2007 | I: vitamin D3 plus calcium | 1180 | 446 | 446 | ‐ | ‐ |
| C: calcium plus placebo tablets | 733 | 733 | ‐ | ‐ | ||
| total: | 1179 | 1179 | ‐ | ‐ | ||
| 34. Larsen 2004 | I: home safety inspection, vitamin D3 plus calcium | 62,000 | 4957 | 4957 | ‐ | ‐ |
| C: no intervention | 4648 | 4648 | ‐ | ‐ | ||
| total: | 9605 | 9605 | ‐ | ‐ | ||
| 35. Latham 2003 | I: vitamin D3 | 3,028 | 121 | 121 | 108 | 89 |
| C: matched placebo tablets | 122 | 122 | 114 | 93 | ||
| total: | 243 | 243 | 222 | 91 | ||
| 36. Law 2006 | I: vitamin D2 | ‐ | 1762 | 1762 | 1366 | 77 |
| C: no intervention | 1955 | 1955 | 1569 | 80 | ||
| total: | 3717 | 3717 | 2935 | 79 | ||
| 37. Lehouck 2012 | I: vitamin D3 | 419 | 91 | 91 | 72 | 79 |
| C: matched placebo | 91 | 91 | 78 | 86 | ||
| total: | 182 | 182 | 150 | 82 | ||
| 38. Lips 1996 | I: vitamin D3 | ‐ | 1291 | 1291 | 1061 | 82 |
| C: matched placebo | 1287 | 1287 | 1029 | 80 | ||
| total: | 2578 | 2578 | 2090 | 81 | ||
| 39. Lips 2010 | I: vitamin D3 | 593 | 114 | 114 | 105 | 92 |
| C: matched placebo | 112 | 112 | 97 | 87 | ||
| total: | 226 | 226 | 202 | 89 | ||
| 40. Lyons 2007 | I: vitamin D2 | 5745 | 1725 | 1725 | 778 | 45 |
| C: matched placebo tablets | 1715 | 1715 | 762 | 44 | ||
| total: | 3440 | 3440 | 1540 | 44 | ||
| 41. Meier 2004 | I: vitamin D3 | ‐ | 30 | 30 | 27 | 90 |
| C: no intervention | 25 | 25 | 16 | 64 | ||
| total: | 55 | 55 | 43 | 78 | ||
| 42. Mochonis 2006 | I: vitamin D3 plus calcium | ‐ | 72 | 72 | 65 | 90 |
| C: no intervention | 40 | 40 | 36 | 90 | ||
| total: | 112 | 112 | 101 | 90 | ||
| 43. Ooms 1995 | I: vitamin D3 | ‐ | 177 | 177 | 126 | 71 |
| C: matched placebo | 171 | 171 | 118 | 69 | ||
| total: | 348 | 348 | 244 | 70 | ||
| 44. Ott 1989 | I: vitamin D3 plus calcium | ‐ | 43 | 43 | 39 | 91 |
| C: matched placebo vitamin D plus calcium | 43 | 43 | 37 | 86 | ||
| total: | 86 | 86 | 76 | 88 | ||
| 45. Porthouse 2005 | I: vitamin D3 plus calcium | 11,022 | 1321 | 1321 | 1212 | 92 |
| C: no intervention | 1993 | 1993 | 1862 | 93 | ||
| total: | 3454 | 3454 | 3074 | 92 | ||
| 46. Prince 2008 | I: vitamin D2 plus calcium | 827 | 151 | 151 | 144 | 95 |
| C: matched placebo tablets of vitamin D plus calcium | 151 | 151 | 145 | 96 | ||
| total: | 302 | 302 | 289 | 95 | ||
| 47. Sanders 2010 | I: vitamin D3 | 7204 | 1131 | 1131 | 1015 | 90 |
| C: matched placebo tablets | 1127 | 1127 | 1017 | 90 | ||
| total: | 2258 | 2258 | 1032 | 90 | ||
| 48. Sato 1997 | I: vitamin D (alfacalcidol) plus calcium | ‐ | 45 | 45 | 30 | 67 |
| C: matched placebo tablets of vitamin D and calcium | 39 | 39 | 34 | 87 | ||
| total: | 84 | 84 | 64 | 76 | ||
| 49. Sato 1999a | I: vitamin D (alfacalcidol) | ‐ | 43 | 43 | 40 | 93 |
| C: matched placebo tablets of vitamin D | 43 | 43 | 40 | 93 | ||
| total: | 86 | 86 | 80 | 93 | ||
| 50. Sato 1999b | I: vitamin D (alfacalcidol) | ‐ | 34 | 34 | 32 | 94 |
| C: matched placebo tablet of vitamin D | 35 | 35 | 32 | 91 | ||
| total: | 69 | 69 | 64 | 93 | ||
| 51. Sato 2005a | I: vitamin D2 | ‐ | 48 | 48 | 43 | 90 |
| C: matched placebo tablets of vitamin D | 48 | 48 | 42 | 87 | ||
| total: | 96 | 96 | 85 | 88 | ||
| 52. Schleithoff 2006 | I: vitamin D3 plus calcium | ‐ | 61 | 61 | 42 | 69 |
| C: matched placebo vitamin D plus calcium | 62 | 62 | 51 | 82 | ||
| total: | 103 | 103 | 93 | 90 | ||
| 53. Smith 2007 | I: vitamin D2 | 13,487 | 4727 | 4727 | 2304 | 49 |
| C: matched placebo intramuscular injection | 4713 | 4713 | 2266 | 48 | ||
| total: | 9440 | 9440 | 4570 | 48 | ||
| 54. Trivedi 2003 | I: vitamin D3 | ‐ | 1345 | 1345 | 1262 | 94 |
| C: matched placebo vitamin D | 1341 | 1341 | 1264 | 94 | ||
| total: | 2696 | 2696 | 2526 | 94 | ||
| 55. Witham 2010 | I: vitamin D2 | 173 | 53 | 53 | 48 | 91 |
| C: matched placebo tablets | 52 | 52 | 48 | 91 | ||
| total: | 105 | 105 | 96 | 91 | ||
| 56. Zhu 2008 | I: vitamin D2 plus calcium | ‐ | 39 | 39 | 33 | 85 |
| C: matched placebo vitamin D and calcium | 81 | 81 | 74 | 91 | ||
| total: | 120 | 120 | 107 | 89 | ||
| Grand total | All interventions | 47,472 | 45,351 | |||
| All controls | 47,814 | 45,278 | ||||
| All interventions and controls | 95,286 | 90,629a | ||||
"‐" denotes not reported
aNumbers not available for all studies
C: control; I: intervention; ITT: intention‐to‐treat
Trial characteristics
Of the 56 trials reporting mortality, 54 trials randomly assigned participants individually and two trials as clusters (Larsen 2004; Law 2006). Forty‐eight trials used a parallel‐group design, and eight trials (Avenell 2004; Avenell 2012; Bolton‐Smith 2007; Campbell 2005; Gallagher 2001; Komulainen 1999; Larsen 2004; Latham 2003) used the 2 × 2 factorial design (Pocock 2004). The 56 trials were published from 1973 to 2012.
The trials were conducted in Europe (n = 34), North America (n = 9), Oceania (n = 9) and Asia (n = 4). All 56 trials came from high‐income countries.
In 38 trials (69%), vitamin D was provided free of charge by pharmaceutical companies. In the other 18 trials, funding was not reported.
The 62 trials reporting no mortality included a total of 10,723 participants. These trials were mostly phase I or phase II short‐term clinical trials assessing the pharmacokinetic or pharmacodynamic properties of vitamin D. These trials had typical outcome measures that are non‐validated potential surrogates for participant‐relevant outcomes (Gluud 2006).
Participants
A total of 95,286 participants were randomly assigned in the 56 trials reporting mortality (Table 4). The number of participants in each trial ranged from 46 to 36,282 participants (median 226). The age range of participants was from 18 to 107 years. The mean proportion of women was 77% (Table 1).
Forty‐eight trials were primary prevention trials that included 94,491 apparently healthy participants. Of these 48 trials, four trials included healthy volunteers, nine trials postmenopausal women and 35 trials older people living independently or in institutional care.
Eight trials with 795 participants were secondary prevention trials that included participants with neurological (Sato 1997; Sato 1999a; Sato 1999b; Sato 2005a), cardiovascular (Schleithoff 2006; Witham 2010), respiratory (Lehouck 2012) or rheumatoid disease (Brohult 1973) (Table 2).
Of the 56 trials reporting mortality, 45 trials (80%) reported the baseline vitamin D status of participants based on serum 25‐hydroxyvitamin D levels. Participants in 19 trials (Bjorkman 2007; Bolton‐Smith 2007; Broe 2007; Burleigh 2007; Chel 2008; Cooper 2003; Daly 2008; Dawson‐Hughes 1997; Dukas 2004; Flicker 2005; Gallagher 2001; Glendenning 2012; Grady 1991; Meier 2004; Moschonis 2006; Ott 1989; Smith 2007; Trivedi 2003; Zhu 2008) had baseline 25‐hydroxyvitamin D levels at or above vitamin D adequacy (20 ng/mL). Participants in the remaining 26 trials had baseline 25‐hydroxyvitamin D levels within a range of vitamin D insufficiency (less than 20 ng/mL). Eleven trials did not report the baseline vitamin D status of participants (Avenell 2004; Baeksgaard 1998; Brohult 1973; Campbell 2005; Komulainen 1999; Lappe 2007; Larsen 2004; Law 2006; Lyons 2007; Porthouse 2005; Sato 1997).
The main outcomes in the trials were bone mineral density, numbers of falls and fractures and mortality (Table 2).
Experimental interventions
Vitamin D3 (cholecalciferol)
Vitamin D was administered as vitamin D3 (cholecalciferol) in 38 trials (75,927 participants; 76.8% women; age range 51 to 85 years). Vitamin D3 was tested singly in 11 trials and combined with calcium in 25 trials. An additional two trials tested vitamin D3 both singly and combined with calcium (Avenell 2004; Avenell 2012). Vitamin D3 was tested orally in all trials. Vitamin D3 was administered daily in 30 trials and intermittently in eight trials (daily, weekly or monthly (Chel 2008); twice weekly (Grimnes 2011); weekly (Lips 2010); monthly (Campbell 2005; Lehouck 2012); three‐monthly (Glendenning 2012); four‐monthly (Trivedi 2003); or yearly (Sanders 2010)). The dose of vitamin D3 was 300 IU to 500,000 IU (mean daily dose 3650 IU; median daily dose 800 IU). The duration of supplementation in trials using vitamin D3 was one day to seven years (weighted mean 4.9 years), and the length of the follow‐up period was one month to seven years (weighted mean 5.2 years) (Table 3).
Vitamin D2 (ergocalciferol)
Vitamin D was administered as vitamin D2 (ergocalciferol) in 12 trials (18,349 participants; 82% women; age range 56 to 89 years). Vitamin D2 was tested singly in seven trials and combined with calcium in four trials. An additional one trial tested vitamin D2 both singly and combined with calcium (Harwood 2004). Vitamin D2 was administered orally in 10 trials. One trial administered vitamin D2 orally and parenterally (single intramuscular injection) (Harwood 2004), and one trial administered vitamin D2 parenterally (single intramuscular injection yearly) (Smith 2007). The dosing schedule for vitamin D2 was daily in five trials (Broe 2007; Corless 1985; Prince 2008; Sato 2005a; Zhu 2008) and intermittently in five trials (weekly (Cooper 2003), 10‐weekly (Witham 2010), three‐monthly (Law 2006), four‐monthly (Lyons 2007) or yearly (Smith 2007)). One trial tested vitamin D2 first weekly and then daily (Flicker 2005). The dose of vitamin D2 was 200 IU to 300,000 IU (mean daily dose 1661 IU; median daily dose 1000 IU). The duration of supplementation and follow‐up in trials using vitamin D2 was one day to seven years (weighted mean 2.4 years) (Table 3).
Alfacalcidol (1α‐hydroxyvitamin D)
Vitamin D was administered as alfacalcidol in four trials (617 participants; 57% women; age range 68 to 71 years). Alfacalcidol was tested singly in three trials and combined with calcium in one trial (Sato 1997). Alfacalcidol was administered orally and daily in all trials. The dose of alfacalcidol was 1 μg in all four trials. The duration of supplementation and follow‐up in trials using alfacalcidol was six months to one year (weighted mean 0.9 years) (Table 3).
Calcitriol (1,25‐dihydroxyvitamin D)
Vitamin D was administered as calcitriol in three trials (430 participants; 85% women; age range 67 to 79 years). Calcitriol was tested singly in two trials and combined with calcium in one trial (Ott 1989). Calcitriol was administered orally and daily in all trials. The dose of calcitriol was 0.5 μg in two trials (Gallagher 2001; Grady 1991), and one trial tested two doses of calcitriol 0.5 μg and 2 μg (Ott 1989). The duration of supplementation in trials using calcitriol was two to five years (weighted mean 2.2 years) and the follow‐up period lasted two to five years (weighted mean four years) (Table 3).
Control interventions
A total of 44 trials used placebo vitamin D and 12 trials used no intervention in the control group (Table 1).
Co‐interventions
Thirty‐four trials used vitamin D in combination with calcium in the experimental intervention groups. Calcium was administered orally and daily in all 34 trials. The dose of calcium was 300 mg to 1600 mg (mean 920 mg; median 1000 mg) (Table 3).
Thirteen trials used calcium combined with vitamin D placebo in the control group. The dose of calcium was 300 mg to 1500 mg (mean 835 mg; median 1000 mg). These trials used an equal dose of calcium in the experimental intervention groups (Table 3).
One trial with a 2 × 2 factorial design tested a combination of vitamin D3, vitamin K1 and calcium in one of the intervention groups (Bolton‐Smith 2007). The factorial design of this trial allowed us to compare only the vitamin D3 plus calcium group versus the placebo group of this trial. Another two trials with parallel‐group designs and three intervention groups tested in one of the groups the combination of calcium and multivitamins (Baeksgaard 1998) or ipriflavone (Sato 1999b). The parallel‐group design of these trials allowed us to compare the vitamin D group versus the placebo group. Two trials with a 2 × 2 factorial design tested vitamin D and hormone replacement (Gallagher 2001; Komulainen 1999). We have compared only the vitamin D group with the placebo group of these trials.
Risk of bias in included studies
Thirty trials reporting mortality (54% of the trials; 71% of the participants) were considered as having low risk of bias. The remaining 26 trials had unclear bias control in one or more of the components assessed (Table 1; Figure 2; Figure 3). Inspection of the funnel plot does not suggest potential bias (asymmetry) (Figure w7, http://ctu.dk/publications/supplementary‐material.aspx). The adjusted‐rank correlation test (P = 0.44) and the regression asymmetry test (P = 0.08) found no statistically significant evidence of bias.

Risk of bias according to bias domains in the 56 randomised clinical trials on vitamin D and mortality.

Risk of bias in the included 56 randomised clinical trials on vitamin D and mortality.
Allocation
The generation of the allocation sequence was adequately described in 43 trials. The remaining 13 trials were described as randomised, but the method used for sequence generation was not described (Baeksgaard 1998; Bischoff 2003; Brohult 1973; Chapuy 1992; Chapuy 2002; Chel 2008; Grady 1991; Krieg 1999; Larsen 2004; Meier 2004; Ott 1989; Sato 1997; Sato 1999b).
The method used to conceal allocation was adequately described in 37 trials. The method used for allocation concealment was judged as unclear in 12 trials (Baeksgaard 1998; Bischoff 2003; Brohult 1973; Chapuy 1992; Chapuy 2002; Chel 2008; Corless 1985; Grady 1991; Meier 2004; Ott 1989; Sato 1997; Sato 1999a) and inadequate in seven trials (Avenell 2004; Daly 2008; Krieg 1999; Moschonis 2006; Larsen 2004; Law 2006; Sato 1999b).
Blinding
The method of blinding was adequately described in 34 trials. The method of blinding was unclear in 10 trials (Brazier 2005; Brohult 1973; Chapuy 1992; Chapuy 2002; Chel 2008; Corless 1985; Grady 1991; Ott 1989; Sato 1997; Sato 1999a). Twelve trials were not blinded (Avenell 2004; Campbell 2005; Daly 2008; Harwood 2004; Krieg 1999; Kärkkäinen 2010; Larsen 2004; Law 2006; Meier 2004; Moschonis 2006; Porthouse 2005; Sato 1999b).
Incomplete outcome data
Incomplete data were addressed adequately in 54 trials. In two trials, information is insufficient to allow assessment of whether the missing data mechanism in combination with the method used to handle missing data is likely to induce bias on the estimate of effect (Lappe 2007; Larsen 2004).
Selective reporting
Predefined primary and secondary outcomes were reported in 51 trials. Five trials did not report all predefined or clinically relevant and reasonably expected outcomes (Baeksgaard 1998; Brohult 1973; Larsen 2004; Porthouse 2005; Sato 1997). The 103 randomised clinical trials that could not provide data for mortality analyses represent an unknown reservoir of outcome reporting bias.
Industry bias
Seven trials were not funded by industry (Campbell 2005; Flicker 2005; Janssen 2010; Lyons 2007; Meier 2004; Trivedi 2003; Witham 2010). Ten trials were funded by industry (Bischoff 2003; Brazier 2005; Brohult 1973; Chapuy 2002; Harwood 2004; Komulainen 1999; Lips 2010; Moschonis 2006; Porthouse 2005; Smith 2007) and 32 trials reported that trial medications were funded by industry (Aloia 2005; Avenell 2004; Avenell 2012; Baeksgaard 1998; Bjorkman 2007; Bolton‐Smith 2007; Broe 2007; Burleigh 2007; Chapuy 1992; Chel 2008; Cherniack 2011; Cooper 2003; Daly 2008; Dawson‐Hughes 1997; Dukas 2004; Gallagher 2001; Grady 1991; Grimnes 2011; Jackson 2006; Kärkkäinen 2010; Krieg 1999; Lappe 2007; Larsen 2004; Latham 2003; Lehouck 2012; Lips 1996; Ooms 1995; Ott 1989; Prince 2008; Sanders 2010; Schleithoff 2006; Zhu 2008). The source of funding is not clear for seven trials (Corless 1985; Glendenning 2012; Law 2006; Sato 1997; Sato 1999a; Sato 1999b; Sato 2005a).
Other potential sources of bias
Two trials had other factors that could put the trials at risk of bias, such as recruitment bias (Larsen 2004; Law 2006). The remaining 54 trials appeared to be free of other components that could put them at risk of bias.
Effects of interventions
All‐cause mortality in all trials
Overall, vitamin D significantly decreased all‐cause mortality (RR 0.97 (95% CI 0.94 to 0.99); P = 0.02; I2 = 0%; 95,286 participants; 56 trials; Analysis 1.1). A total of 5920 of 47,472 participants (12.5%) randomly assigned to the vitamin D group versus 6077 of 47,814 participants (12.7%) randomly assigned to the placebo or no intervention group died. A sensitivity analysis excluding the cluster‐randomised trials had no noticeable effect on the result (RR 0.96 (95% CI 0.93 to 0.99); P = 0.01; I2 = 0%; 81,964 participants; 54 trials; Analysis 1.2). The difference between the estimate of the effect of vitamin D on mortality in individually randomised and cluster‐randomised trials was not statistically significant by the test of interaction (Chi2 = 0.48; P = 0.49; Analysis 1.2).
Intervention effects according to bias risk of trials
In the trials with low risk of bias, mortality was significantly decreased in the vitamin D group (RR 0.96 (95% CI 0.92 to 0.99); P = 0.02; I2 = 0%; 67,516 participants; 30 trials; Analysis 1.1). In the trials with high risk of bias, vitamin D did not significantly affect all‐cause mortality (RR 0.99 (95% CI 0.92 to 1.06); P = 0.71; I2 = 10%; 27,770 participants; 26 trials; Analysis 1.1). The difference between the estimate of the effect of vitamin D on mortality in low‐ and high‐bias risk trials was not statistically significant by the test of interaction (Chi2 = 0.56; P = 0.46; Analysis 1.1).
Placebo‐controlled trials compared with trials with no intervention in the control group
Vitamin D significantly decreased mortality in the placebo‐controlled trials (RR 0.96 (95% CI 0.93 to 0.99); P = 0.009; I2 = 0%; 73,892 participants; 44 trials; Analysis 1.3). Vitamin D had no statistically significant effect on mortality in the trials with no intervention in the control group (RR 1.05 (95% CI 0.91 to 1.21); P = 0.51; I2 = 29%; 21,394 participants; 12 trials; Analysis 1.3.2). The difference between the estimate of the effect of vitamin D on mortality in the placebo‐controlled trials and in trials with no intervention in the control group was not statistically significant by the test of interaction (Chi2 = 1.50; P = 0.22; Analysis 1.3).
Trials without risk of industry bias compared to trials with risk of industry bias
Vitamin D had no significant effect on mortality in the trials without risk of industry bias (RR 0.97, 95% CI 0.92 to 1.03; P = 0.32; I2 = 0%; 7,372 participants; 7 trials; Analysis 1.4). Vitamin D significantly decreased mortality in the trials with risk of industry bias (RR 0.96 (95% CI 0.93 to 1.00); P = 0.003; I2 = 0%; 87,914 participants; 49 trials; Analysis 1.4). The difference between the estimate of the effect of vitamin D on mortality in the trials without risk of industry bias and the trials with risk of industry bias was not statistically significant by the test of interaction (Chi2 = 0.07; P = 0.80; Analysis 1.4).
Primary prevention compared with secondary prevention
Vitamin D significantly decreased mortality in the primary prevention trials (RR 0.97 (95% CI 0.94 to 0.99); P = 0.02; I2 = 0%; 94,491 participants; 48 trials; Analysis 1.5). Vitamin D had no statistically significant effect on mortality in the secondary prevention trials (RR 1.31 (95% CI 0.73 to 2.35); P = 0.37; I2 = 0%; 795 participants; 8 trials; Analysis 1.5). The difference between the estimates of the effect of vitamin D on mortality in the primary prevention and the secondary prevention trials was not statistically significant by the test of interaction (Chi2 = 1.04; P = 0.31; Analysis 1.5).
Intervention effects according to vitamin D status at entry
Vitamin D significantly decreased mortality in participants with vitamin D insufficiency at entry (RR 0.95 (95% CI 0.91 to 0.99); P = 0.01; I2 = 0%; 56,697 participants; 26 trials; Analysis 1.6). Vitamin D had no statistically significant effect on mortality in the trials including participants with vitamin D adequacy (RR 0.95 (95% CI 0.87 to 1.05); P = 0.30; I2 = 0%; 16,283 participants; 19 trials; Analysis 1.6). A similar finding was obtained in the trials including participants with unknown vitamin D status (Analysis 1.6). The difference between the estimates of the effect of vitamin D on mortality in the trials including participants with vitamin D insufficiency and the trials including participants with vitamin D adequacy was not statistically significant by the test of interaction (Chi2 = 1.59; P = 0.45; Analysis 1.6).
Trials including participants living independently compared with trials including participants living in care institutions
Vitamin D significantly decreased mortality in ambulatory participants (RR 0.95 (95% CI 0.92 to 0.98); P = 0.0003; I2 = 0%; 86,071 participants; 45 trials; Analysis 1.7). Vitamin D had no statistically significant effect on mortality in the trials including institutionalised participants (RR 1.02 (95% CI 0.92 to 1.13); P = 0.74; I2 = 21%; 9215 participants; 11 trials; Analysis 1.7). The difference between the estimates of the effect of vitamin D on mortality in the trials including ambulatory participants and the trials including institutionalised participants was not statistically significant by the test of interaction (Chi2 = 1.60; P = 0.21; Analysis 1.7).
Sensitivity analyses taking attrition into consideration
Of the 56 trials reporting mortality, 53 trials reported the exact numbers of participants with missing outcomes in the intervention and control groups. Two trials did not report losses to follow‐up (Larsen 2004; Sato 1997), and one trial did not report losses to follow‐up for the intervention groups separately (Lappe 2007). A total of 3634 of 42,024 participants (8.6%) had missing outcomes in the vitamin D group versus 3523 of 42,394 participants (8.3%) in the control group.
'Best‐worst case' scenario
If we assume that all participants lost to follow‐up in the experimental intervention group survived and all those with missing outcomes in the control intervention group died, vitamin D significantly decreased mortality (RR 0.40 (95% CI 0.32 to 0.51); P < 0.00001; I2 = 96%; 84,418 participants; 53 trials; Analysis 1.8).
'Worst‐best case' scenario
If we assume that all participants lost to follow‐up in the experimental intervention group died and all those lost to follow‐up in the control intervention group survived, vitamin D significantly increased mortality (RR 2.78 (95% CI 2.13 to 3.63); P < 0.00001; I2 = 97%; 84,418 participants; 53 trials; Analysis 1.8).
Sensitivity analyses taking zero event trials into account
In addition to the 56 trials reporting mortality, 62 trials with 10,804 participants had zero mortality in both experimental and control groups. We assessed the influence of these trials by recalculating the RR with 0.5, 0.01 and 0.001 as empirical continuity corrections. The random‐effects model RR for the three continuity corrections was not noticeably influenced (RR 0.97 (95% CI 0.94 to 0.99); P = 0.020; RR 0.97 (95% CI 0.94 to 1.00); P = 0.022; RR 0.97 (95% CI 0.94 to 1.00); P = 0.023; respectively). We also tested the influence of zero event trials using risk difference as the measure of association. Vitamin D significantly decreased all‐cause mortality using the fixed‐effect model meta‐analysis (RD ‐0.004 (95% CI ‐0.016 to ‐0.008); P = 0.015). Heterogeneity was substantial (I2 = 64%). The random‐effects model revealed no statistically significant effect of vitamin D on all‐cause mortality (RD ‐0.002 (95% CI ‐0.005 to 0.002); P = 0.30).
Vitamin D3 (cholecalciferol)
Vitamin D3 was tested in 38 trials (75,927 participants). Inspection of the funnel plot did not suggest potential bias (asymmetry) (Figure w8, http://ctu.dk/publications/supplementary‐material.aspx). The adjusted‐rank correlation test (P = 0.79) and the regression asymmetry test (P = 0.97) found no statistically significant evidence of bias. Overall, vitamin D3 significantly decreased mortality (RR 0.94 (95% CI 0.91 to 0.98); P = 0.002; I2 = 0; 75,927 participants; 38 trials; Analysis 1.9). Vitamin D3 significantly decreased mortality in the trials with low risk of bias (RR 0.93 (95% CI 0.89 to 0.98); P = 0.009; I2 = 0%; 52,645 participants; 20 trials; Analysis 1.9). Vitamin D3 had no statistically significant effect on mortality in the trials with high risk of bias (RR 0.95 (95% CI 0.91 to 1.00); P = 0.06; I2 = 0%; 23,282 participants; 18 trials; Analysis 1.7.2). The difference between estimates of the effect of vitamin D3 on mortality in the trials with low risk of bias and the trials with high risk of bias was not statistically significant by the test of interaction (Chi2 = 0.39; P = 0.53; Analysis 1.9).
Trial sequential analysis of all 38 vitamin D3 trials was constructed on the basis of diversity‐adjusted required information size calculated using mortality of 10% in the control group, a relative risk reduction of 5% with vitamin D3, a type I error of 5% and a type II error of 20% (80% power). No diversity was noted. The trial sequential analysis showed that the required information size had not yet been reached and that the cumulative Z‐curve crossed the trial sequential monitoring boundary for benefit in 2006 during the 22nd trial. The trial sequential analysis excludes risk of random errors (Figure 4). The intervention effect corresponds to the number needed to treat for an additional beneficial outcome (NNTB) of 150 participants treated over five years to save one additional life.
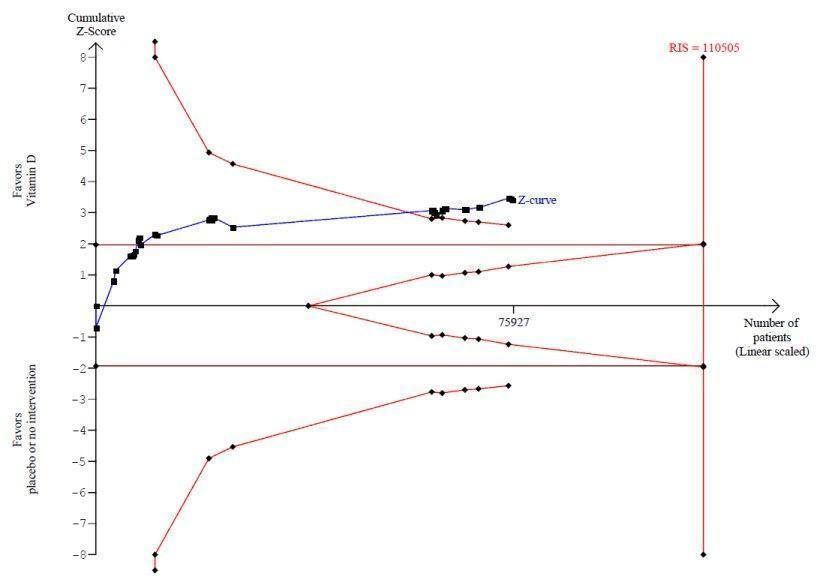
Trial sequential analysis on mortality in 38 vitamin D3 trials
The diversity‐adjusted required information size (RIS) was calculated based on mortality in the control group of 10%; relative risk reduction of 5% in the experimental group; type I error of 5%; and type II error of 20% (80% power). No diversity was noted. The required information size was 110,505 participants. The cumulative Z‐curve (blue line) crossed the trial sequential monitoring boundaries for benefit (red inward sloping line) after the 22nd trial. Accordingly, the risk of random error in the finding seems acceptable according to the O'Brien Fleming stopping rule for an individual trial interim analysis. Subsequently, 16 trials have been published.
Vitamin D3 and calcium
Vitamin D3 administered singly versus placebo or no intervention had no statistically significant effect on mortality (RR 0.92 (95% CI 0.85 to 1.00); P = 0.06; I2 = 5%; 12,609 participants; 13 trials; Analysis 1.10). Vitamin D3 combined with calcium versus placebo or no intervention significantly decreased mortality (RR 0.96 (95% CI 0.92 to 0.99); P = 0.03; I2 = 0%; 63,051 participants; 27 trials; Analysis 1.10). The difference between the estimate of the effect of vitamin D3 on mortality in the trials using vitamin D3 singly and the trials using vitamin D3 combined with calcium was not statistically significant by the test of interaction (Chi2 = 0.49; P = 0.49; Analysis 1.10).
The trial sequential analysis on mortality in the 27 trials that administered vitamin D3 combined with calcium showed that the cumulative Z‐curve did not cross the trial sequential monitoring boundary for benefit (Figure w9, http://ctu.dk/publications/supplementary‐material.aspx).
Dose of vitamin D3
A dose of vitamin D3 less than 800 IU a day significantly decreased mortality (RR 0.92 (95% CI 0.87 to 0.97); P = 0.005; I2 = 0%; 50,437 participants; 13 trials; Analysis 1.11). A dose of vitamin D3 equal to or greater than 800 IU a day had no statistically significant effect on mortality (RR 0.96 (95% CI 0.92 to 1.00); P = 0.07; I2 = 0%; 25,558 participants; 26 trials; Analysis 1.11). The difference between the estimate of the effect of vitamin D3 on mortality in the trials using a low dose of vitamin D3 and the trials using a high dose of vitamin D3 was not statistically significant by the test of interaction (Chi2 = 1.37; P = 0.24; Analysis 1.11).
The trial sequential analysis on mortality in the 13 trials that administered a low dose of vitamin D3 showed that the cumulative Z‐curve did not cross the trial sequential monitoring boundary for benefit (Figure 5).

Trial sequential analysis on mortality in the 13 trials that administered low dose of vitamin D3 (i.e. a dose less than 800 IU per day)
The diversity‐adjusted required information size (RIS) was calculated based on mortality in the control group of 10%; relative risk reduction of 5% in the experimental group; type I error of 5%; and type II error of 20% (80% power). No diversity was noted. The required information size was 110,505 participants. The cumulative Z‐curve (blue line) did not cross the trial sequential monitoring boundaries for benefit (red line) at any time. Accordingly, the crossing of the conventional statistical 5% boundary (the horizontal brown line) may be due to random errors.
Dosing schedule of vitamin D3
Vitamin D3 administered daily significantly decreased mortality (RR 0.95 (95% CI 0.91 to 0.98); P = 0.004; I2 = 0%; 69,168 participants; 31 trials; Analysis 1.12). Vitamin D3 administered intermittently had no statistically significant effect on mortality (RR 0.89 (95% CI 0.77 to 1.03); P = 0.11; I2 = 0%; 6871 participants; 8 trials; Analysis 1.12). The difference between the estimate of the effect of vitamin D3 on mortality in the trials that administered vitamin D3 daily and the trials that administered vitamin D3 intermittently was not statistically significant by the test of interaction (Chi2 = 0.66; P = 0.41; Analysis 1.12).
Intervention effect of vitamin D3 according to vitamin D status at entry
Vitamin D3 significantly decreased mortality in the trials including participants with vitamin D insufficiency (RR 0.95 (95% CI 0.91 to 0.99); P = 0.009; I2 = 0%; 55,883 participants; 20 trials; Analysis 1.13). Vitamin D3 had no statistically significant effect on mortality in the trials including participants with vitamin D adequacy (RR 0.92 (95% CI 0.80 to 1.07); P = 0.29; I2 = 0%; 4979 participants; 10 trials; Analysis 1.13). The difference between the estimate of the effect of vitamin D3 on mortality in the trials including participants with vitamin D insufficiency and the trials including participants with vitamin D adequacy was not statistically significant by the test of interaction (Chi2= 0.1; P = 0.75; Analysis 1.13).
Intervention effect of vitamin D3 according to the sex of the trial participants
Vitamin D3 had no statistically significant effect on mortality in the trials that exclusively included women (RR 0.93 (95% CI 0.84 to 1.03); P = 0.16; I2 = 22%; 53,062 participants; 19 trials; Analysis 1.14). Vitamin D3 significantly decreased mortality in the trials including both men and women, or including only men (one trial by Daly 2008) (RR 0.94 (95% CI 0.89 to 0.99); P = 0.01; I2 = 0%; 22,865 participants; 19 trials; Analysis 1.14). The difference between the estimate of the effect of vitamin D3 on mortality in the trials including only women and the trials including both men and women or only men was not statistically significant by the test of interaction (Chi2 = 0.03; P = 0.87; Analysis 1.14).
Vitamin D2 (ergocalciferol)
Vitamin D2 was tested in 12 trials (18,349 participants). Inspection of the funnel plot did not suggest potential bias (asymmetry) (Figure w10, http://ctu.dk/publications/supplementary‐material.aspx). The adjusted‐rank correlation test (P = 0.60) and the regression asymmetry test (P = 0.55) found no statistically significant evidence of bias. Overall, vitamin D2 had no statistically significant effect on mortality (RR 1.02 (95% CI 0.96 to 1.08); P = 0.54; I2 = 4%; Analysis 1.15). Vitamin D2 had no statistically significant effect on mortality in the trials with low risk of bias (RR 0.98 (95% CI 0.93 to 1.04); P = 0.57; I2 = 0%; 14,439 participants; 9 trials; Analysis 1.15). Vitamin D2 significantly increased mortality in the trials with high risk of bias (RR 1.20 (95% CI 1.05 to 1.37); P = 0.007; I2 = 0%; 3910 participants; 3 trials; Analysis 1.15). The difference between the estimate of effect of vitamin D2 on mortality in the trials with low risk of bias and the trials with high risk of bias was statistically significant by the test of interaction (Chi2 = 7.28; P = 0.007; Analysis 1.15).
The trial sequential analysis of all vitamin D2 trials suggests that we reached the futility area after the eighth trial, allowing us to conclude that any possible intervention effect, if present, is lower than a 5% relative risk reduction, or that the number needed to treat for an additional beneficial outcome (NNTB) is greater than 150 (Figure 6).

Trial sequential analysis of mortality in 12 vitamin D2 trials
The diversity‐adjusted required information size (RIS) was conducted based on 10% mortality in the control group; relative risk reduction of 10% in the experimental group; type I error of 5%; and type II error of 20% (80% power). No diversity was noted. The required information size was 27,585 participants. The cumulative Z‐curve (blue line) crossed the trial sequential monitoring boundaries for futility (red outward sloping line) after the eighth trial.
Vitamin D2 and calcium
Vitamin D2 administered singly had no statistically significant effect on mortality (RR 1.03 (95% CI 0.96 to 1.12); P = 0.37; I2 = 14%; 17,079 participants; 8 trials; Analysis 1.16). Vitamin D2 combined with calcium had no statistically significant effect on mortality (RR 1.00 (95% CI 0.64 to 1.57); P = 1.00; I2 = 11%; 1307 participants; 5 trials; Analysis 1.16). The difference between the estimates of effect of vitamin D2 on mortality in the trials using vitamin D2 singly and the trials using vitamin D2 combined with calcium was not statistically significant by the test of interaction (Chi2 = 0.02; P = 0.88; Analysis 1.16).
Dose of vitamin D2
A dose of vitamin D2 less than 800 IU a day, tested in one trial, had no statistically significant effect on mortality (RR 0.82 (95% CI 0.17 to 3.98); P = 0.81; 101 participants; Analysis 1.17). A dose of vitamin D2 equal to or greater than 800 IU a day had no statistically significant effect on mortality (RR 1.02 (95% CI 0.95 to 1.10); P = 0.51; I2 = 9%; 18,273 participants; 12 trials; Analysis 1.17). The difference between the estimate of effect of vitamin D2 on mortality in the trials using a high dose of vitamin D2 and the trial using low‐dose vitamin D2 was not statistically significant by the test of interaction (Chi2 = 0.07; P = 0.79; Analysis 1.17).
Dosing schedule of vitamin D2
Vitamin D2 administered daily had no statistically significant effect on mortality (RR 0.88 (95% CI 0.68 to 1.12); P = 0.30; I2 = 0%; 1349 participants; 6 trials; Analysis 1.18). Vitamin D2 administered intermittently had no statistically significant effect on mortality (RR 1.06 (95% CI 0.95 to 1.18); P = 0.33; I2 = 46%; 17,000 participants; 6 trials; Analysis 1.18). The difference between the estimates of effect of vitamin D2 on mortality in the trials that administered vitamin D2 daily and the trials that administered vitamin D2 intermittently was not statistically significant by the test of interaction (Chi2 = 1.81; P = 0.18; Analysis 1.18).
Intervention effect of vitamin D2 according to vitamin D status
Vitamin D2 significantly increased mortality in the trials including participants with vitamin D insufficiency (RR 1.20 (95% CI 1.05 to 1.37); P = 0.008; I2 = 0%; 4413 participants; 6 trials; Analysis 1.19). Vitamin D2 had no statistically significant effect on mortality in the trials including participants with vitamin D adequacy (RR 0.97 (95% CI 0.86 to 1.10); P = 0.62; I2 = 0%; 10,496 participants; 5 trials; Analysis 1.19). The difference between the estimates of effect of vitamin D2 on mortality in the trials including participants with vitamin D insufficiency and the trials including participants with vitamin D adequacy was statistically significant by the test of interaction (Chi2 = 5.23; P = 0.02; Analysis 1.19).
Alfacalcidol (1α‐hydroxyvitamin D)
Alfacalcidol was tested in four trials (617 participants). Inspection of the funnel plot did not suggest potential bias (asymmetry) (Figure w11, http://ctu.dk/publications/supplementary‐material.aspx). The adjusted‐rank correlation test (P = 1.00) found no significant evidence of bias. Alfacalcidol had no statistically significant effect on mortality (RR 0.96 (95% CI 0.22 to 4.15); P = 0.95; I2 = 0%; Analysis 1.20). The effect of alfacalcidol on mortality was not dependent on vitamin D status (Analysis 1.21).
Calcitriol (1,25‐dihydroxyvitamin D)
Calcitriol was tested in three trials (430 participants). Inspection of the funnel plot did not suggest potential bias (asymmetry) (Figure w12, http://ctu.dk/publications/supplementary‐material.aspx). Calcitriol had no statistically significant effect on mortality (RR 1.37 (95% CI 0.27 to 7.03); P = 0.71; I2 = 0%; Analysis 1.22). The effect of calcitriol on mortality was not dependent on vitamin D status (Analysis 1.23).
Cause‐specific mortality
Vitamin D3 statistically significantly decreased cancer mortality (RR 0.88 (95% CI 0.78 to 0.98); P = 0.02; I2 = 0%; 44,492 participants; 4 trials; Analysis 1.24).
Trial sequential analysis on cancer mortality in the four trials that administered vitamin D3 was performed on the basis of mortality in the control group of 2.85%; relative risk reduction (based on trials with low risk of bias) of 12.28% in the experimental group; type I error of 5%; and type II error of 20% (80% power). No diversity was noted. The required information size was 66,724 participants. The cumulative Z‐curve (blue line) did not cross the trial sequential monitoring boundary for benefit (red line) (Figure w13, http://ctu.dk/publications/supplementary‐material.aspx).
Vitamin D3 had no significant effect on cardiovascular mortality (RR 0.98 (95% CI 0.90 to 1.07); P = 0.68; I2 = 0%; 47,267 participants; 10 trials; Analysis 1.25).
The trial sequential analysis on cardiovascular mortality in the 10 trials that administered vitamin D3 was performed on the basis of mortality in the control group of 4.17%; relative risk reduction (based on trials with low risk of bias) of 1.68% in the experimental group; type I error of 5%; and type II error of 20% (80% power). No diversity was noted. The required information size was 2,539,845 participants. The cumulative Z‐curve (blue line) did not cross the conventional monitoring boundary for benefit (red line) (Figure w14, http://ctu.dk/publications/supplementary‐material.aspx).
We were not able to extract from the included trials relevant data on fracture‐related mortality and other causes of mortality.
Adverse events
Several adverse events were reported (e.g. hypercalcaemia, nephrolithiasis, hypercalciuria, renal insufficiency, gastrointestinal disorders, cardiovascular disorders, psychiatric disorders, skin disorders, cancer).
The supplemental forms of vitamin D (D3 and D2) had no statistically significant effect on the risk of hypercalcaemia (RR 1.36 (95% CI 0.85 to 2.18); P = 0.21; I2 = 0%; 11,323 participants; 15 trials; Analysis 1.26).
The active forms of vitamin D (alfacalcidol and calcitriol) statistically significantly increased the risk of hypercalcaemia (RR 3.18 (95% CI 1.17 to 8.68); P = 0.02; I2 = 17%; 710 participants; 3 trials; Analysis 1.26). The difference between the estimate of effect of vitamin D on hypercalcaemia in the trials that administered supplemental forms of vitamin D (D3 and D2) and the trials that administered active forms of vitamin D (alfacalcidol or calcitriol) was not statistically significant by the test of interaction (Chi2 = 2.27; P = 0.13; Analysis 1.26).
Vitamin D3 combined with calcium significantly increased nephrolithiasis (RR 1.17 (95% CI 1.02 to 1.34); P = 0.02; I2 = 0%; 42,876 participants; 4 trials; Analysis 1.26).
The effect of vitamin D on the other adverse events was not statistically significant (hypercalciuria: RR 4.64 (95% CI 0.99 to 21.76; P = 0.05; I2 = 0%; 695 participants; 3 trials; Analysis 1.26 renal insufficiency: RR 1.70 (95% CI 0.27 to 10.70); P = 0.57; I2 = 53%; 5495 participants; 3 trials; Analysis 1.26; cardiovascular disorders: RR 0.95 (95% CI 0.86 to 1.05); P = 0.29; I2 = 0%; 4495 participants; 8 trials; Analysis 1.26; gastrointestinal disorders: RR 1.36 (95% CI 0.87 to 2.13); P = 0.17; I2 = 57%; 9702 participants; 16 trials; Analysis 1.26; psychiatric disorders: RR 1.44 (95% CI 0.56 to 3.73); P = 0.45; I2 = 0%; 580 participants; 3 trials; Analysis 1.26; skin disorders: RR 3.27 (95% CI 0.17 to 62.47); P = 0.43; I2 = 77%; 3810 participants; 2 trials; Analysis 1.26; cancer: RR 0.99 (95% CI 0.94 to 1.06); P = 0.85; I2 = 0%; 49,707 participants; 14 trials; Analysis 1.26).
Health‐related quality of life
Only one trial published data on health‐related quality of life (Witham 2010). Authors reported significant worsening in disease‐specific quality of life (MLWHF, Minnesota Living With Heart Failure score) in the vitamin D2 group compared with the placebo group (Witham 2010). The between‐group difference at 20 weeks was 5.3 (0.5 to 10.2), and the minimally important difference (MID) was estimated to be 5 points in either direction.
Health economics
We found only one randomised clinical trial (Chapuy 1992) that reported a cost‐effectiveness analysis (Lilliu 2003). The authors found that vitamin D3 and calcium supplementation prevented 46 hip fractures in every 1000 women treated and concluded that vitamin D3 with calcium supplementation is cost‐effective (Lilliu 2003). Mortality was not addressed.
Discussion
Summary of main results
Our systematic review contains a number of important findings. We found evidence suggesting that vitamin D3 may significantly benefit survival of elderly ambulatory participants living in institutional care who were likely to be vitamin D deficient with significant risk of falls and fractures, when we disregard the risks of attrition bias and outcome reporting bias. However, if these bias risks are considered, we do not yet know whether vitamin D3 affects mortality. Vitamin D2, alfacalcidol and calcitriol had no statistically significant effect on mortality, but these estimates are at risk of type II errors because of the fact that much smaller groups of participants were examined compared with the trials assessing vitamin D3.
A subgroup analysis of trials with high risk of bias suggests that vitamin D2 may increase mortality, but a trial sequential analysis opens the possibility that this could be a random error. Alfacalcidol and calcitriol significantly increased the risk of hypercalcaemia, and vitamin D3 combined with calcium significantly increased nephrolithiasis. Vitamin D had no clear effect on other adverse events, including cancer.
Compared with our previous version of this systematic review (Bjelakovic 2011), the number of included trials in the present review has increased, with six new trials (12%) adding another 1,138 participants (1.2%). In addition, we have obtained updated results of a longer follow‐up from one large‐scale randomised trial (Avenell 2012). In spite of these additional amounts of information, our results remain largely the same, but our assessment of the robustness of our findings has weakened.
Overall completeness and applicability of evidence
Our published protocol described our plan to analyse the effect of vitamin D on mortality in primary and secondary prevention randomised clinical trials in adults. All eligible randomised clinical trials up to February 2012 were included. All trials were conducted in high‐income countries. Both sexes were included. Most of the participants were elderly persons, They were living alone or were living in institutions. A vast majority of the participants came from primary prevention trials, and we assume that they were apparently healthy when included in the trials. Few trials with very few participants were included in the secondary prevention trials, so our ability to say anything about such patients is week to absent. We included randomised trials with both vitamin D–deficient participants and persons who seemed to have adequate vitamin D levels at entry. We were unable to detect significant differences regarding these variables on the estimated intervention effect on mortality. Surprisingly little heterogeneity was found in all of our analyses. Most trials assessed vitamin D3, and our major conclusions are related to this intervention. Although more than half of the trials were considered of low risk of bias, our analyses revealed that outcome reporting on more than 8% of participants was lacking. This number is too high when mortality is about 12% to 13% in the placebo or no intervention group. Accordingly, our 'best‐worst case' and 'worst‐best case' analyses revealed that our results were compatible with both a very large beneficial effect and a very large detrimental effect of vitamin D3 on mortality. Although these extreme sensitivity analyses are unlikely, they reveal how few unaccounted for patients should have died to substantially change our findings of modest benefit into nil effect or maybe even harm. Therefore, we warn against uncritical application of our findings.
Quality of the evidence
Our review follows the overall plan of a published, peer‐reviewed Cochrane protocol (Bjelakovic 2008a). It represents a comprehensive review of the topic, including 159 randomised trials with more than 105,000 participants. A total of 56 trials including more than 94,000 participants reported on mortality. This increases the precision and power of our analyses (Higgins 2011). Previous meta‐analyses of preventive trials of vitamin D supplements have included substantially less information and have not examined the separate influence of different forms of vitamin D on mortality. We conducted a thorough review in accordance with The Cochrane Collaboration methodology (Higgins 2011) while implementing findings of methodological studies (Kjaergard 2001; Lundh 2012; Moher 1998; Savovic 2012; Schulz 1995; Wood 2008). Between‐trial heterogeneity is almost absent in our meta‐analyses. This may emphasise the consistency of our findings but should also raise concern (Ioannidis 2006). Furthermore, all‐cause mortality should generally be connected with unbiased estimates (Savovic 2012; Wood 2008). We also performed trial sequential analyses to control the risk of random errors in a cumulative meta‐analysis and to prevent premature statements of superiority of vitamin D based on estimation of the diversity‐adjusted required information size (Brok 2008; Brok 2009; Thorlund 2009; Thorlund 2011a; Thorlund 2011b; Wetterslev 2008; Wetterslev 2009).
A major drawback in most of the included trials is the relatively large proportion of more than 8% of participants who dropped out. This opens up for attrition bias, and our 'best‐worst' and 'worst‐best' intention‐to‐treat analyses demonstrate that the intervention effect of vitamin D may be either beneficial or harmful. Although both of the two extreme scenarios are unlikely, they demonstrate that we cannot depend fully on the estimates we arrive at. The percentage of participants lost to follow‐up in both experimental and control groups was about 8.5%. Our 'best‐worst case' and 'worst‐best case' scenario analyses revealed much more extreme confidence limits (95% CI 0.32 to 3.63) compared with our 'complete‐case' scenario analysis (95% CI 0.93 to 0.99), and they convey a message of a noticeable degree of uncertainty regarding our results. This observation calls for more comprehensive meta‐analyses of individual participant data plus further large randomised clinical trials. We have abstained from conducting 'uncertainty' analyses (Gamble 2005). The latter analyses accept the point estimate from the complete‐participant analysis, assuming that the distribution of deaths among the participants lost to follow‐up is equal to the distribution of deaths among all participants. But the distribution of dead participants among the lost to follow‐up participants may indeed be different from the distribution of dead participants among participants actually followed through the whole observation period, making the 'uncertainty' analyses themselves uncertain.
We conducted a number of subgroup analyses. We observed no statistically significant different effects of the intervention effect of vitamin D on mortality in subgroup analyses of trials with low risk of bias compared with trials with high risk of bias; of trials using placebo compared with trials using no intervention in the control group; of trials with no risk of industry bias compared with trials with risk of industry bias; of trials assessing primary prevention compared with trials assessing secondary prevention; of trials including participants with vitamin D level below 20 mg/mL at entry compared with trials including participants with normal vitamin D levels at entry; of trials including ambulatory participants compared with trials including institutionalised participants; of vitamin D3 trials using concomitant calcium supplementation compared with vitamin D3 trials without calcium; of trials using a dose of vitamin D3 less than 800 IU per day compared with trials using doses greater than 800 IU per day; of vitamin D3 trials including only women compared with vitamin D3 trials including both sexes or only men.
In addition to the 56 trials reporting mortality, 62 trials with 10,804 participants had zero mortality in both the experimental and control groups. These trials were mostly phase I and phase II randomised clinical trials assessing the effects of short‐term vitamin D administration on surrogate outcomes. These trials were excluded from the meta‐analyses by using RR as the association measure. We assessed the influence of these trials by recalculating the RR with 0.5, 0.01 and 0.001 as empirical continuity corrections. The random‐effects model RR for the three continuity corrections was not noticeably influenced. We also tested the influence of zero event trials using a risk difference as the measure of association. Vitamin D significantly decreased all‐cause mortality using the fixed‐effect model meta‐analysis. Heterogeneity was substantial. The random‐effects model revealed no statistically significant effect of vitamin D on all‐cause mortality. Accordingly, the decreased mortality could be an artefact created by exclusion of trials with zero events in both intervention groups (Bradburn 2007; Sweeting 2004).
Two trials had other factors that could put them at risk of bias (i.e. recruitment bias) (Larsen 2004; Law 2006). These trials were cluster‐randomised. We explored the association between intervention effects of vitamin D and the subgrouping of individually randomised and cluster‐randomised trials. The influence of cluster‐randomised trials on our results was also explored in sensitivity analyses, which included or excluded them. The difference between the estimate of the effect of vitamin D on mortality in individually randomised compared with cluster‐randomised trials was not statistically significant. Our sensitivity analyses by including or excluding cluster‐randomised trials revealed no noticeable effect on our results.
We conducted trial sequential analyses to control the risk of random errors and to prevent premature statements of superiority of the experimental or control intervention or probably false declarations of absence of effect in the cases for which we had too few data (Thorlund 2011a; Thorlund 2011b; Wetterslev 2008). The finding of significantly decreased mortality with vitamin D3 (cholecalciferol) did not seem to be due to a random error. The cumulative Z‐curve crossed the trial sequential monitoring boundary for benefit after the 22nd trial. However, such an analysis cannot remove risks of bias‐detected or undetected. The trial sequential analysis for vitamin D2 (ergocalciferol) suggests that we reached the futility area after the eighth trial, allowing us to conclude that any possible intervention effect, if present, is lower than a 5% relative risk reduction. One should discuss, however, how much evidence one would require when dealing with potential benefit or harm. On the one hand, beneficial or harmful effects can occur as the result of random errors; therefore, sufficient information needs to be assessed to demonstrate benefit or harm beyond reasonable doubt.
Potential biases in the review process
We repeatedly searched several databases and contacted authors of trials and industry producing vitamin D supplements. Therefore, we believe that we have not overlooked important randomised clinical trials. On the other hand, only about every second trial is reported (Gluud 2008), so we cannot exclude reporting biases, although our funnel plots did not suggest publication bias. On the positive side, we managed to obtain much more information on a number of trials from this update. However, this does not detract from the fact that we did not have access to individual participant data. Accordingly, we have no chance of analysing the effect of vitamin D in only women or in only men. When we separate trials with only women from trials with men and women combined, we see no significant difference in the intervention effect of vitamin D.
We selected all trials and extracted all data in duplicate, and we reached a high level of agreement. We did not conduct the quality assessments or data extractions blinded for authors and bias risks.
In this review update, we have now presented a more conservative and, we believe, a more correct interpretation of our findings compared with interpretations in the first version of this review.
Agreements and disagreements with other studies or reviews
In our present systematic review, we found no significant effects of bias on our estimates of intervention of vitamin D in general or of vitamin D3 specifically.
On the other hand, most of the trials were conducted with some type of support from the industry, and in general, the risk of potential industry bias was poorly described or accounted for. However, the difference in the estimates of vitamin D effect on mortality in the trials sponsored by industry compared with trials that were not sponsored by industry was not statistically significant. Accordingly, we could not confirm results from a recently published Cochrane review (Lundh 2012), which found that sponsorship of a trial by the manufacturing company leads to more favourable results and conclusions compared with trials having no sponsors.
No difference in the estimates of vitamin D effect on mortality was evident in the primary and secondary prevention trials. The number of trials with secondary prevention was low, and these trials included very few participants. Our findings may seem to contrast with earlier claims in the literature that vitamin D might be beneficial for patients with cardiovascular, malignant, infectious or autoimmune diseases (Holick 2007a; Rosen 2011; Souberbielle 2010). Assessment of vitamin D supplementation for participant groups with active disease was outside the scope of the present systematic review.
We found no statistically significant difference regarding the effect of vitamin D on mortality in trials including participants with vitamin D insufficiency (25‐hydroxyvitamin D level less than 20 ng/mL) compared with trials including participants with optimal vitamin D status. The optimal vitamin D status, reached by using the blood level of 25‐hydroxyvitamin D that maximally suppresses serum parathyroid hormone, varies widely (8 ng/mL to 44 ng/mL) (Dawson‐Hughes 2005; Lips 2004; Vieth 2006). The level of 25‐hydroxyvitamin D in the blood also depends much on the laboratory methods used for assessment of vitamin D concentration (Binkley 2009; Holick 2009; Lips 1999). Many external factors (latitude, season, time of the day, air pollution) and internal factors (skin colour, age, clothing, use of sunscreen) influence the cutaneous synthesis of vitamin D, and consequently the 25‐hydroxyvitamin D levels (Webb 2006). According to a recent report of the Institute of Medicine (IOM 2011), a serum 25‐hydroxyvitamin D level of 20 ng/mL (50 nmol/L) meets the vitamin D requirements of at least 97.5% of the population. Our results do not support earlier claims that participants with insufficient vitamin D status may benefit from vitamin D supplementation (Bischoff‐Ferrari 2009c; Holick 2008a; Zittermann 2009a).
No difference was noted in the estimates of vitamin D effect on mortality in trials including ambulatory participants compared with trials including institutionalised participants. This could be due to random error associated with the fact that a much smaller number of institutionalised participants were analysed.
Our review identified a possible difference between the two forms of supplemental vitamin D, that is, vitamin D3 and vitamin D2. Vitamin D3 seemed to significantly decrease mortality, while the effect of vitamin D2 may be neutral or even detrimental. The World Health Organization officially regards these two forms as equivalent, based on the results of quite old studies on rickets prevention (World Health Organization 1950). Biological differences between vitamins D3 and D2 are found in some species such as birds and monkeys (Hoy 1988; Marx 1989). Evidence on biological differences between the two vitamins in humans has been sparse and contradictory. A number of recently published clinical trials found evidence that vitamin D3 increases serum 25‐hydroxyvitamin D more efficiently than vitamin D2 (Armas 2004; Heaney 2011; Leventis 2009; Romagnoli 2008; Trang 1998). However, a randomised clinical trial found that vitamin D3 and vitamin D2 were comparable in maintaining serum 25‐hydroxyvitamin D levels (Holick 2008b). A recently published systematic review and meta‐analysis indicated that vitamin D3 is more efficacious than vitamin D2 in raising serum 25‐hydroxyvitamin D concentrations (Tripkovic 2012). An emerging body of evidence suggests several plausible explanations for this observation. The plasma half‐life of vitamin D3 is longer, and it has higher affinity to the vitamin D binding protein, hepatic vitamin D hydroxylase, and the vitamin D receptor (Holmberg 1986; Houghton 2006; Mistretta 2008). Vitamin D3 is the only naturally occurring form of vitamin D produced endogenously in our body, while vitamin D2 can be obtained only through the diet (Norman 2008). Vitamin D2 seems to upregulate several enzymes that degrade administered vitamin D2 and endogenous D3 (Heaney 2008). Our result could be of interest to health policy makers in different countries. The predominant supplemental form of vitamin D in the United States is vitamin D2 (Houghton 2006). In Europe, Japan and Canada, vitamin D supplements principally contain vitamin D3 (Holick 2008a), although in some European countries, like France and Great Britain, vitamin D2 is also available on the market.
Furthermore, we found no statistically significant difference between the intervention effects of vitamin D3 on mortality in trials using vitamin D3 singly and trials using vitamin D3 combined with calcium. Vitamin D3 was tested in combination with calcium in 27 trials and alone in 13 trials. Because of the small number of included trials assessing vitamin D3 alone, the findings could be due to a type II error. Our finding seems consistent with the result obtained by Autier et al, who found that calcium supplements did not affect mortality (Autier 2007), but opposite to the results of recent meta‐analyses examining the influence of vitamin D on mortality (Rejnmark 2012) or bone health (DIPART 2010). These meta‐analyses concluded that vitamin D is effective in preventing mortality (Rejnmark 2012) and hip fractures (DIPART 2010) only when combined with calcium. The complex interactions between vitamin D and calcium make it difficult to separate their effects. More research seems needed.
The current recommendation for adequate intake of calcium for adults is in the range of 1000 mg to 1200 mg. The tolerable upper limit is 2,000 mg (IOM 2011). The dosages used in the trials included in our meta‐analysis are in accordance with recommended intakes. In most of the included trials, the primary outcome measure was bone health. Vitamin D and calcium are well‐recognised nutritional factors related to bone health. Fractures, especially in elderly people, are associated with increased mortality risk (Haentjens 2010). We speculate that by preventing fractures, especially in elderly people, vitamin D combined with calcium can indirectly decrease mortality. Our results concur with the results of a recently published Cochrane review, which found that vitamin D singly could not prevent hip fracture but combined with calcium had a significant beneficial effect (Avenell 2009). However, Avenell et al found no statistically significant effect of vitamin D on mortality (Avenell 2009), although the review authors assessed a much more limited number of trials. A number of meta‐analyses of randomised trials found that vitamin D combined with calcium could prevent falls and fractures (Bischoff‐Ferrari 2005; Bischoff‐Ferrari 2009a; Bischoff‐Ferrari 2009b; Tang 2007). A recent meta‐analysis observed that calcium supplementation (with or without co‐administration of vitamin D) is associated with increased risk of cardiovascular events, especially myocardial infarction (Bolland 2010; Bolland 2011). Another review of prospective studies and randomised clinical trials found neutral effects of calcium (Patel 2012). A US Preventive Services Task Force recently recommended against daily supplementation with 400 IU or less of vitamin D3 and 1000 mg or less of calcium for the primary prevention of fractures in noninstitutionalised postmenopausal women (Moyer 2013).
A further important outcome of our review is that we found no significant differences in the effect of vitamin D3 on mortality in trials assessing doses less than 800 IU a day compared with trials assessing doses equal to or greater than 800 IU a day. The cutoff value for dividing trials was the median daily dose of vitamin D3 in the included trials (800 IU). The trial sequential analysis revealed that we may need more randomised trials assessing the influence of low doses of vitamin D3 (less than 800 IU) on mortality if we are to obtain the required information size. Controversy persists about the optimal dosage of vitamin D. Recommended daily intakes of vitamin D proposed by the Institute of Medicine are 600 IU per day for adults up to 70 years of age and 800 IU per day for those 70 years of age and older (IOM 2011). Recent randomised trials and meta‐analyses of randomised trials that have falls and fractures as the primary outcome have concluded that the reduction in risk for falls and hip and non‐vertebral fractures is dose dependent (Bischoff‐Ferrari 2009a; Bischoff‐Ferrari 2009b; Bischoff‐Ferrari 2009c; Bischoff‐Ferrari 2012). Conversely, two recent randomised clinical trials (Sanders 2010; Smith 2007) identified a potential harm associated with high doses of vitamin D. Furthermore, recent studies undertaken to examine how vitamin D status in the blood relates to all‐cause mortality found a U‐ or J‐shaped association between vitamin D status and all‐cause mortality (Durup 2012; Michaëlsson 2010), as well as cancer mortality (Michaëlsson 2010). Both high and low concentrations of plasma 25‐hydroxyvitamin D were associated with elevated risks of mortality (Durup 2012; Michaëlsson 2010). Amer et al evaluated the association of 25‐hydroxyvitamin D with all‐cause and cardiovascular mortality using National Health and Nutrition Examination Survey data (2001 to 2004) (Amer 2013). They found an inverse association between 25‐hydroxyvitamin D and all‐cause mortality in healthy adults with serum 25‐hydroxyvitamin D levels equal to or less than 21 ng/mL (Amer 2013). These results should warn us to be very cautious about the changes in recommended daily intakes of vitamin D (Bischoff‐Ferrari 2010b; Holick 2011; Sanders 2013).
It still is not known which dosing schedules are optimal for vitamin D3 supplementation. We found no significant differences in the effects of vitamin D3 on mortality in trials that administered vitamin D3 orally and daily compared with trials that applied vitamin D3 orally and intermittently. This could be due to type II errors. The randomised trial by Chel et al comparing daily, weekly and monthly dosing of vitamin D3 found that daily dosing was more effective than weekly and monthly dosing for preventing fractures (Chel 2008). A recently completed randomised clinical trial that assessed annual high‐dose vitamin D3 reported an increase in the primary outcome of fractures compared with placebo (Sanders 2010).
Most of the trial participants were women. However, when we compared the effect of vitamin D3 on all‐cause mortality in trials including participants of both sexes or only men versus the effect of vitamin D3 on all‐cause mortality in trials including only women, no statistically significant difference was noted. Therefore, our results are compatible with vitamin D3 having similar effects in men and women. Obviously, further randomised trials stratifying for sex and reporting effects according to the sex of the participants are needed.
We observed that vitamin D2 may increase mortality in trials with high risk of bias, as well as in vitamin D–insufficient participants. These subgroup findings may be due to random errors, and our trial sequential analysis supports this assessment. Until more data become available, regulatory authorities need to consider how this information should be handled.
We lack evidence for drawing any firm conclusions about the influence of the active forms of vitamin D (alfacalcidol and calcitriol) on mortality. Available evidence suggests that alfacalcidol and calcitriol have no statistically significant effect on mortality risk. However, only a few trials were conducted, and the risk of type II errors is high. We were not able to identify other meta‐analyses or systematic reviews assessing the influence of alfacalcidol and calcitriol on mortality. A recent systematic review that examined the influence of alfacalcidol and calcitriol on falls and fractures found no significant effect on vertebral fractures, a beneficial effect on non‐vertebral fractures and falls and increased risk of hypercalcaemia (O'Donnell 2008). Occurrences of hypercalcaemia due to the active forms of vitamin D were increased significantly in our review.
Vitamin D had no significant effect on cardiovascular mortality. Much debate in the literature has surrounded the possible beneficial effect of vitamin D on cardiovascular disease (Holick 2004; Scragg 2010; Zittermann 2006; Zittermann 2010). Results of recently published population‐based cohort studies are inconsistent (Schottker 2013; Skaaby 2012). Four recently published systematic reviews summarised the role of vitamin D in cardiovascular disease (Elamin 2011; Myung 2013; Pittas 2010; Wang 2010). These review authors found no evidence to support the use of vitamin D for prevention or treatment of cardiovascular disease (Elamin 2011; Myung 2013; Pittas 2010; Wang 2010).
Vitamin D seems to decrease cancer mortality. However, data were sparse, and selective outcome reporting bias is likely. Furthermore, the cumulative Z‐curve did not cross the trial sequential monitoring boundary in our analysis of cancer mortality, and additional evidence seems needed. Pilz and coworkers recently reviewed the evidence on vitamin D status and cancer mortality (Pilz 2009b). They concluded that epidemiological data were inconsistent in favour of the hypothesis that optimal vitamin D status was related to decreased cancer mortality. However, they lacked evidence from randomised clinical trials on intervention with vitamin D to strengthen their conclusion (Pilz 2009b). Although our present data are encouraging, we need more trials to exclude risks of systematic errors and risks of random errors.
We found that vitamin D had no significant effect on cancer occurrence (Bjelakovic 2008b). A large number of observational studies have provided evidence suggesting that vitamin D may have a role in cancer prevention (Garland 2007; Gorham 2007; Schwartz 2007). The first evidence came from ecological studies that found an inverse relationship between exposure to sunlight and cancer risk (Apperly 1941; Garland 1980). Several mechanisms have been proposed to explain how vitamin D may modify cancer risk. Experimental studies revealed that vitamin D inhibits cellular proliferation and stimulates apoptosis (Artaza 2010; Pan 2010). However, some observational studies found that high vitamin D status was connected with increased oesophageal (Chen 2007), pancreatic (Stolzenberg 2006), breast (Goodwin 2009) and prostate cancer risks (Ahn 2008). One should consider the possibility of a U‐shaped relation between vitamin D status and cancer risk (Toner 2010). Our results are in accordance with the conclusions of the recently published International Agency for Research on Cancer and Institute of Medicine reports stating that vitamin D status is not correlated with cancer occurrence (IARC 2008; IOM 2011). Recently, an updated meta‐analysis prepared for the US Preventive Services Task Force found inconclusive evidence regarding vitamin D supplementation for the prevention of cancer (Chung 2011). We still lack evidence; therefore, we need additional randomised clinical trials if we are to better understand the potential effect of vitamin D on cancer.
Vitamin D3 combined with calcium significantly increased nephrolithiasis. Active forms of vitamin D significantly increased hypercalcaemia. Other adverse events such as elevated urinary calcium excretion, renal insufficiency, cancer and cardiovascular, gastrointestinal, psychiatric or skin disorders were not statistically significantly influenced by vitamin D supplementation.
We lack sufficient evidence on the effect of vitamin D supplementation on health‐related quality of life and on the cost‐effectiveness of vitamin D supplementation. However, vitamin D3 products and calcium are relatively cheap, so these interventions are likely to be cost‐effective if they work sufficiently well.
In conclusion, we see a potentially positive effect of vitamin D3 on mortality, but we caution against thinking that now we know what to do in clinical practice because of the following. Our collection of trials showed a large dropout rate, which could seriously influence our results. The 'worst‐best case' scenario analysis does not exclude a risk of increased mortality associated with vitamin D. We found no significant difference in mortality between vitamin D3 given singly compared with combined with calcium, or vitamin D3 given in doses greater than compared with less than 800 IU/d. Vitamin D3 in doses less than 800 IU did not cross the trial sequential monitoring boundary for benefit, so random errors cannot be excluded. The effect of vitamin D3 on participants with adequate vitamin D status is unknown. Furthermore, we do not know the harm‐to‐benefit ratio when the intervention is used over a longer time. Moreover, we lack information on the effect in men and in younger persons of both sexes. All these reservations lead us to conclude that more research is urgently needed.
A great debate has been documented in the literature about the possible beneficial health effects of vitamin D supplementation. A lot of evidence indicates that vitamin D has beneficial effects, in addition to its effects on bones (Cavalier 2009; Stechschulte 2009; Wang 2009). It has been speculated that optimal vitamin D status is related to prevention of a spectrum of chronic diseases, including malignant and cardiovascular diseases (Fleet 2008; Ingraham 2008; Judd 2009; Zittermann 2010). Vitamin D insufficiency has been associated with increased mortality (Hutchinson 2010; Melamed 2008; Pilz 2009a; Pilz 2012; Zittermann 2009a). Two recently published evidence reports prepared for The Agency for Healthcare Research and Quality have assessed the influence of vitamin D and calcium on different health outcomes (Chung 2009; Cranney 2007). Most of the findings on bone health and different health outcomes were inconsistent (Chung 2009; Cranney 2007). The Institute of Medicine recently reported that available evidence supports a role of vitamin D and calcium in skeletal health (IOM 2011). However, the evidence was considered insufficient and inconclusive for extraskeletal outcomes, including mortality (IOM 2011). A recent meta‐analysis on the effects of vitamin D supplements on bone mineral density concluded that vitamin D supplementation for osteoporosis prevention in community‐dwelling adults without specific risk factors for vitamin D deficiency seems inappropriate (Reid 2013; Rosen 2013).

Study flow diagram.
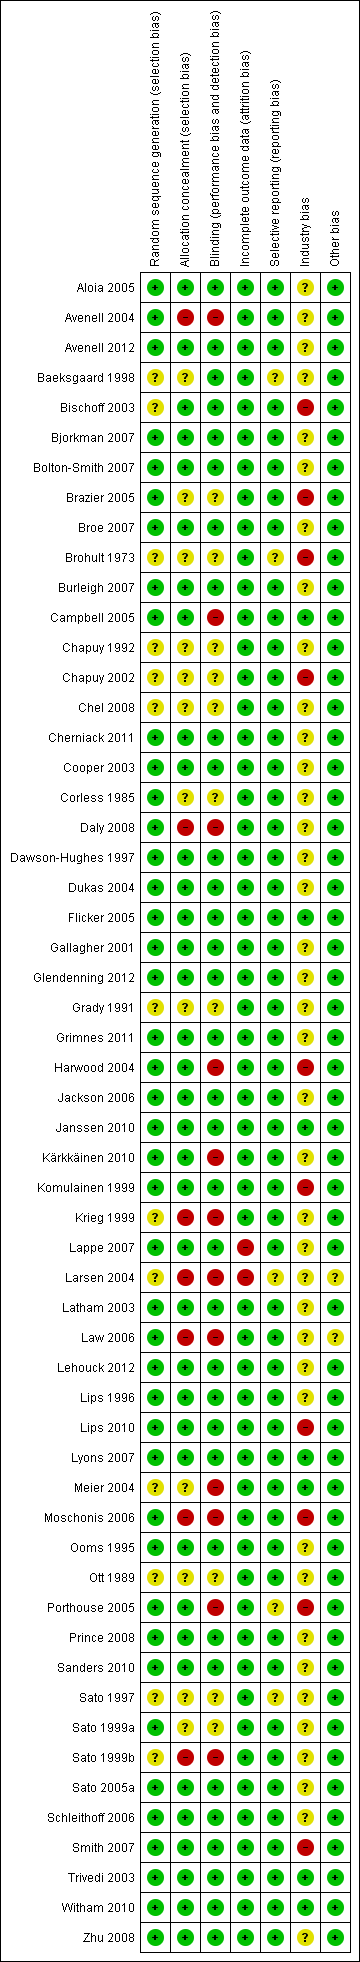
Risk of bias according to bias domains in the 56 randomised clinical trials on vitamin D and mortality.
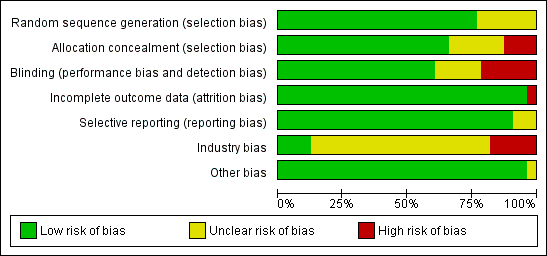
Risk of bias in the included 56 randomised clinical trials on vitamin D and mortality.

Trial sequential analysis on mortality in 38 vitamin D3 trials
The diversity‐adjusted required information size (RIS) was calculated based on mortality in the control group of 10%; relative risk reduction of 5% in the experimental group; type I error of 5%; and type II error of 20% (80% power). No diversity was noted. The required information size was 110,505 participants. The cumulative Z‐curve (blue line) crossed the trial sequential monitoring boundaries for benefit (red inward sloping line) after the 22nd trial. Accordingly, the risk of random error in the finding seems acceptable according to the O'Brien Fleming stopping rule for an individual trial interim analysis. Subsequently, 16 trials have been published.

Trial sequential analysis on mortality in the 13 trials that administered low dose of vitamin D3 (i.e. a dose less than 800 IU per day)
The diversity‐adjusted required information size (RIS) was calculated based on mortality in the control group of 10%; relative risk reduction of 5% in the experimental group; type I error of 5%; and type II error of 20% (80% power). No diversity was noted. The required information size was 110,505 participants. The cumulative Z‐curve (blue line) did not cross the trial sequential monitoring boundaries for benefit (red line) at any time. Accordingly, the crossing of the conventional statistical 5% boundary (the horizontal brown line) may be due to random errors.

Trial sequential analysis of mortality in 12 vitamin D2 trials
The diversity‐adjusted required information size (RIS) was conducted based on 10% mortality in the control group; relative risk reduction of 10% in the experimental group; type I error of 5%; and type II error of 20% (80% power). No diversity was noted. The required information size was 27,585 participants. The cumulative Z‐curve (blue line) crossed the trial sequential monitoring boundaries for futility (red outward sloping line) after the eighth trial.
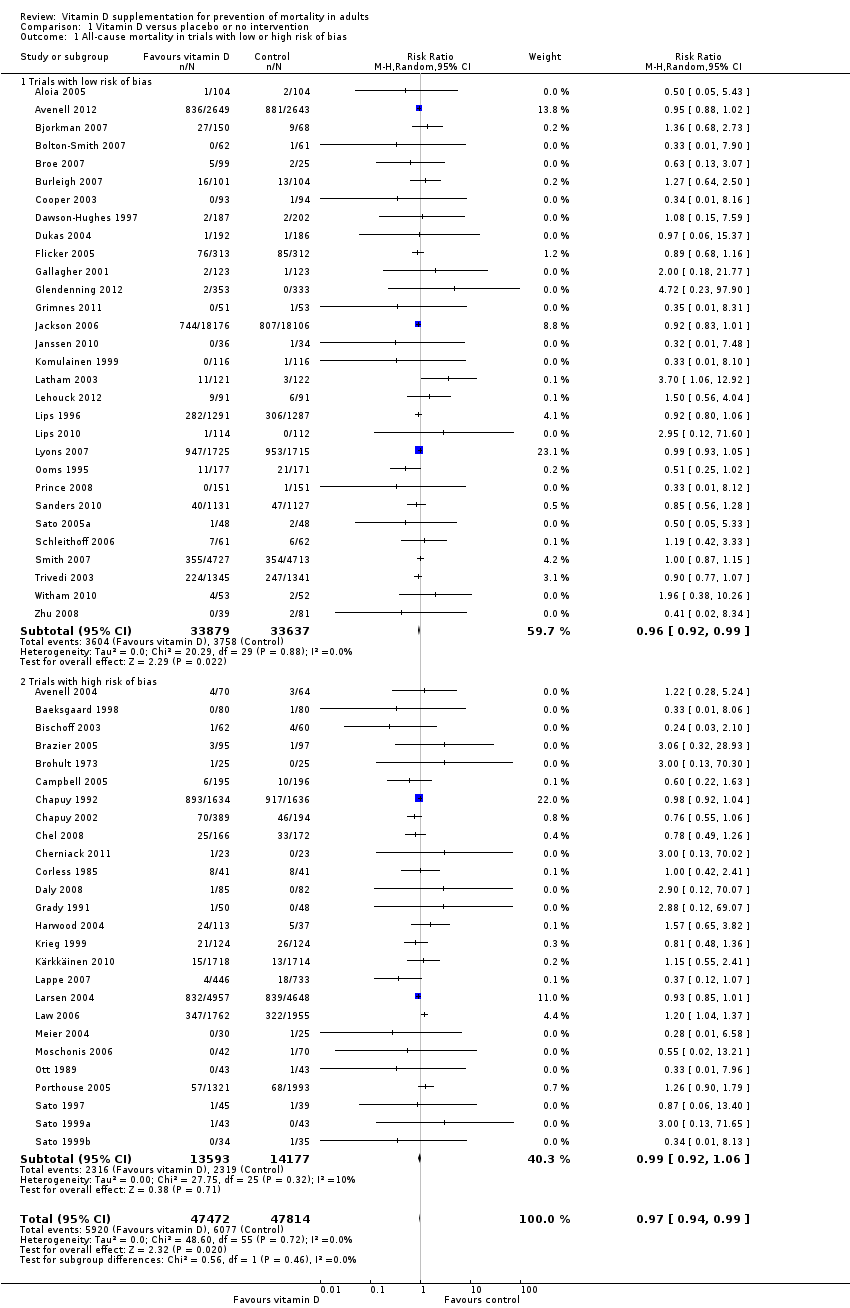
Comparison 1 Vitamin D versus placebo or no intervention, Outcome 1 All‐cause mortality in trials with low or high risk of bias.

Comparison 1 Vitamin D versus placebo or no intervention, Outcome 2 All‐cause mortality in individually randomised and cluster‐randomised trials.

Comparison 1 Vitamin D versus placebo or no intervention, Outcome 3 All‐cause mortality in placebo‐controlled and no intervention trials.
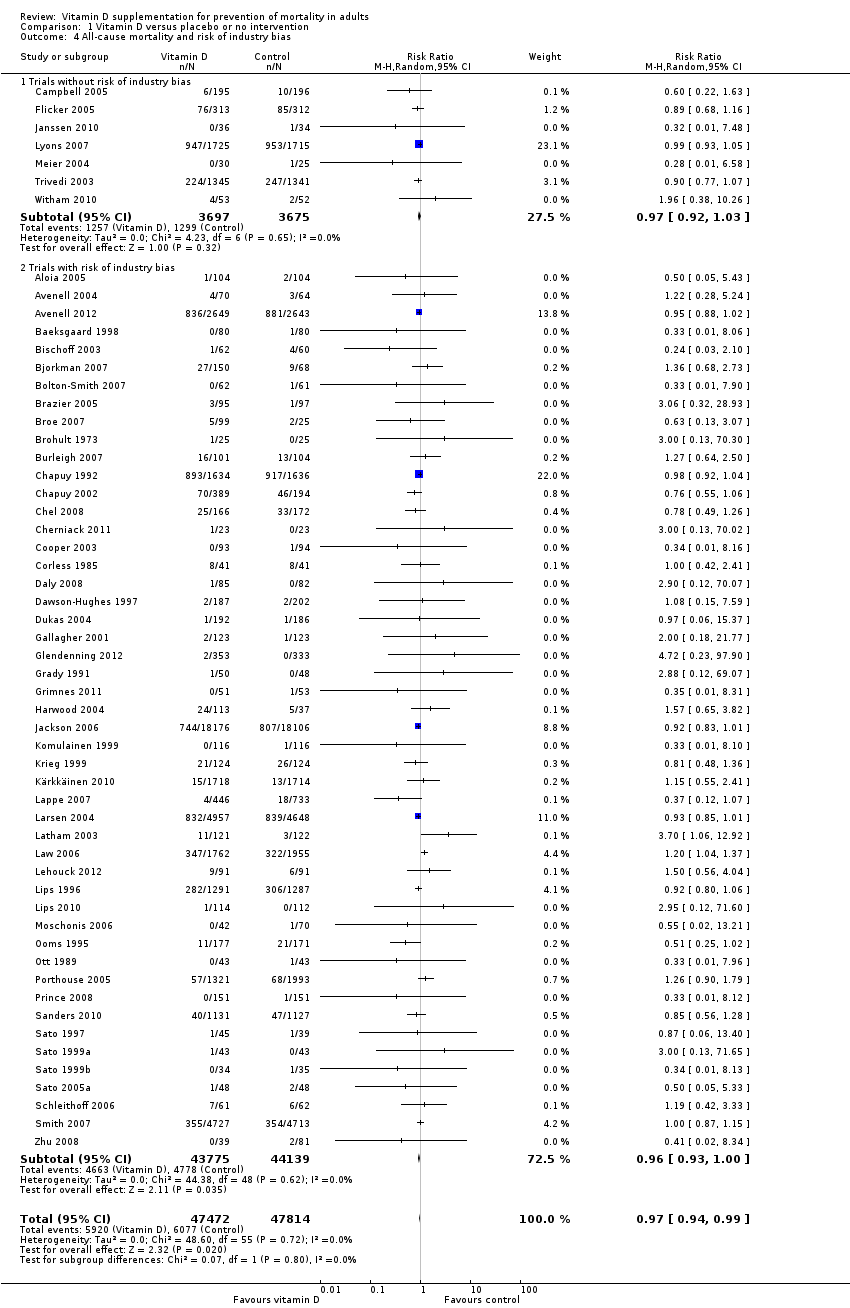
Comparison 1 Vitamin D versus placebo or no intervention, Outcome 4 All‐cause mortality and risk of industry bias.
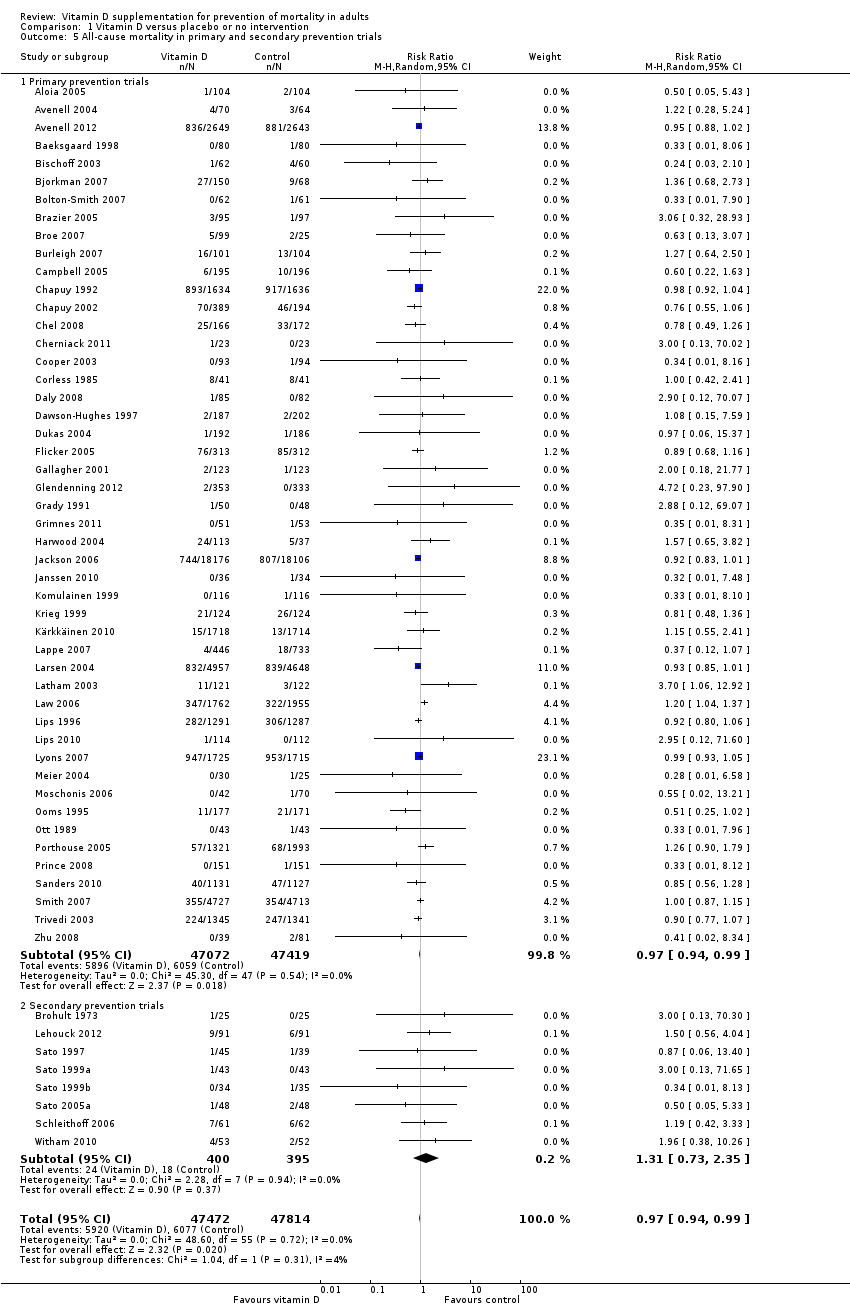
Comparison 1 Vitamin D versus placebo or no intervention, Outcome 5 All‐cause mortality in primary and secondary prevention trials.

Comparison 1 Vitamin D versus placebo or no intervention, Outcome 6 All‐cause mortality and vitamin D status.

Comparison 1 Vitamin D versus placebo or no intervention, Outcome 7 All‐cause mortality in ambulatory and institutionalised participants.

Comparison 1 Vitamin D versus placebo or no intervention, Outcome 8 All‐cause mortality ('best‐worst case' and 'worst‐best case' scenario).

Comparison 1 Vitamin D versus placebo or no intervention, Outcome 9 All‐cause mortality in trials using vitamin D3 (cholecalciferol).

Comparison 1 Vitamin D versus placebo or no intervention, Outcome 10 All‐cause mortality in trials using vitamin D3 singly or combined with calcium.
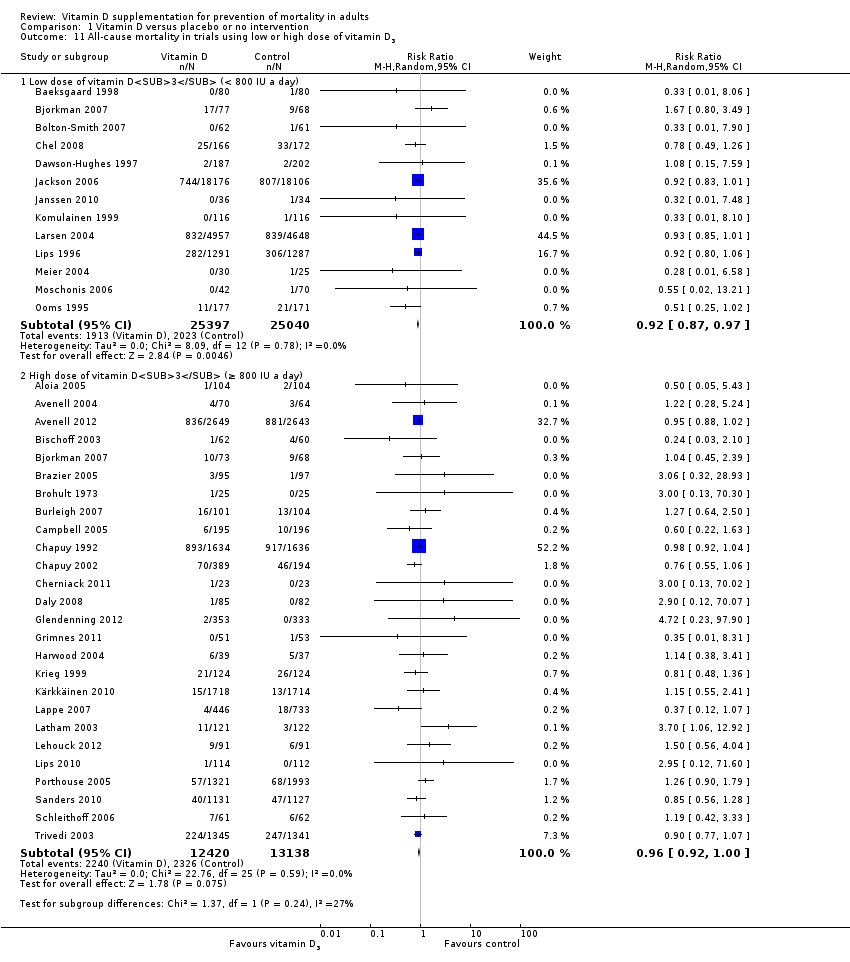
Comparison 1 Vitamin D versus placebo or no intervention, Outcome 11 All‐cause mortality in trials using low or high dose of vitamin D3.

Comparison 1 Vitamin D versus placebo or no intervention, Outcome 12 All‐cause mortality in trials applying vitamin D3 daily or intermittently.

Comparison 1 Vitamin D versus placebo or no intervention, Outcome 13 All‐cause mortality in trials using vitamin D3 and vitamin D status.

Comparison 1 Vitamin D versus placebo or no intervention, Outcome 14 All‐cause mortality in trials using vitamin D3 according to the participant's sex.

Comparison 1 Vitamin D versus placebo or no intervention, Outcome 15 All‐cause mortality in trials using vitamin D2 (ergocalciferol).
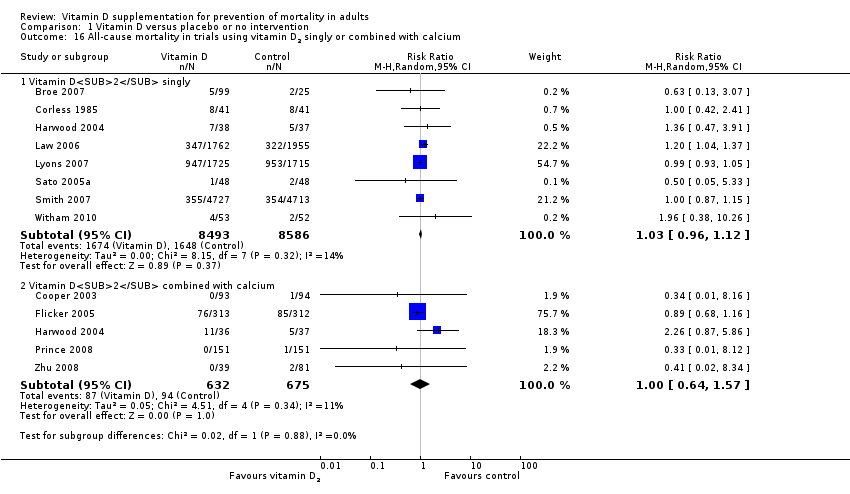
Comparison 1 Vitamin D versus placebo or no intervention, Outcome 16 All‐cause mortality in trials using vitamin D2 singly or combined with calcium.

Comparison 1 Vitamin D versus placebo or no intervention, Outcome 17 All‐cause mortality in trials using low or high dose of vitamin D2.

Comparison 1 Vitamin D versus placebo or no intervention, Outcome 18 All‐cause mortality in trials applying vitamin D2 daily or intermittently.

Comparison 1 Vitamin D versus placebo or no intervention, Outcome 19 All‐cause mortality in trials using vitamin D2 and vitamin D status.

Comparison 1 Vitamin D versus placebo or no intervention, Outcome 20 All‐cause mortality in trials using alfacalcidol (1α‐hydroxyvitamin D).

Comparison 1 Vitamin D versus placebo or no intervention, Outcome 21 All‐cause mortality in trials using alfacalcidol and vitamin D status.

Comparison 1 Vitamin D versus placebo or no intervention, Outcome 22 All‐cause mortality in trials using calcitriol (1,25‐dihydroxyvitamin D).
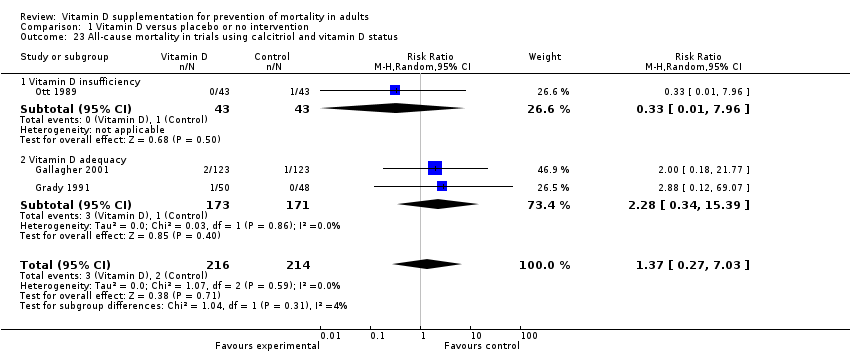
Comparison 1 Vitamin D versus placebo or no intervention, Outcome 23 All‐cause mortality in trials using calcitriol and vitamin D status.
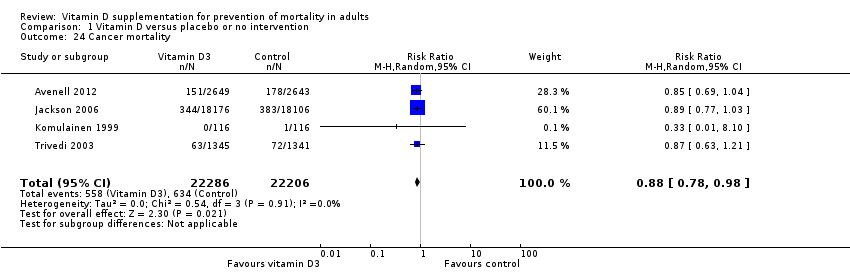
Comparison 1 Vitamin D versus placebo or no intervention, Outcome 24 Cancer mortality.

Comparison 1 Vitamin D versus placebo or no intervention, Outcome 25 Cardiovascular mortality.

Comparison 1 Vitamin D versus placebo or no intervention, Outcome 26 Adverse events.
| Vitamin D supplementation for prevention of mortality in adults | ||||||
| Population: adults | ||||||
| Outcomes | Illustrative comparative risks* (95% CI) | Relative effect | No of participants | Quality of the evidence | Comments | |
| Assumed risk | Corresponding risk | |||||
| Placebo or no intervention | Vitamin D | |||||
| All‐cause mortality in trials using vitamin D3 (Follow‐up: 0.08 to 7 years) | Study population | RR 0.94 | 75,927 | ⊕⊕⊕⊝ moderatea | Trial sequential analysis of all trials irrespective of bias risks showed that the required information size had not yet been reached and that the cumulative Z‐curve crossed the trial sequential monitoring boundary for benefit. If this is correct, the intervention effect corresponds to a number needed to treat for a beneficial outcome (NNTB) of 150 participants over five years to save one additional life | |
| 114 per 1000 | 107 per 1000 | |||||
| Moderate risk | ||||||
| 46 per 1000 | 43 per 1000 | |||||
| Cardiovascular mortality in trials using vitamin D3 (cholecalciferol) (Follow‐up: 0.31 to 6.2 years) | Study population | RR 0.98 | 47,267 | ⊕⊕⊝⊝ lowb | Trial sequential analysis showed that the cumulative Z‐curve did not cross the conventional monitoring boundary for benefit. The required information size was 2,539,845 participants | |
| 42 per 1000 | 41 per 1000 | |||||
| Moderate risk | ||||||
| 13 per 1000 | 11 per 1000 | |||||
| Cancer mortality in trials using vitamin D3 (cholecalciferol) (Follow‐up: 5 to 7 years) | Study population | RR 0.88 | 44,492 | ⊕⊕⊕⊝ moderatea | Trial sequential analysis showed that the cumulative Z‐curve did not cross the conventional monitoring boundary for benefit. The required information size was 66,724 participants | |
| 29 per 1000 | 25 per 1000 | |||||
| Moderate risk | ||||||
| 21 per 1000 | 19 per 1000 | |||||
| Adverse events: nephrolithiasis in trials using vitamin D3 combined with calcium (Follow‐up: 1.25 to 7 years) | Study population | RR 1.17 | 42,876 | ⊕⊕⊕⊝ | ||
| 18 per 1000 | 21 per 1000 | |||||
| Moderate risk | ||||||
| 9 per 1000 | 11 per 1000 | |||||
| Adverse events: hypercalcaemia in trials using the active forms of vitamin D (alfacalcidol and calcitriol) (Follow‐up: 0.75 to 3 years) | Study population | RR 3.18 | 710 | ⊕⊕⊝⊝ | ||
| 23 per 1000 | 72 per 1000 | |||||
| Moderate risk | ||||||
| 11 per 1000 | 15 per 1000 | |||||
| Health‐related quality of life (Follow‐up: 0.38 years) | See comment | See comment | Not estimable | 105 (1) | See comment | Insufficient information: significant worsening in disease‐specific quality of life in the vitamin D2 group compared with the placebo group was reported. The between‐group difference at 20 weeks was 5.3 (0.5 to 10.2), and the minimally important difference (MID) is estimated to be 5 points in either direction |
| Health economics (Follow‐up: 4 years) | See comment | See comment | Not estimable | 3270 (1) | See comment | Insufficient information: authors reported that vitamin D3 and calcium supplementation prevented 46 hip fractures in every 1000 women treated |
| *The basis for the assumed risk (e.g. the median control group risk across studies) is provided in footnotes. The corresponding risk (and its 95% confidence interval) is based on the assumed risk in the comparison group and the relative effect of the intervention (and its 95% CI). | ||||||
| GRADE Working Group grades of evidence | ||||||
| aDowngraded by one level because of risk of attrition bias | ||||||
| Characteristic Study ID | Design | Arms | Bias | Blinding | Participants | Women | Mean |
| Aloia 2005 | Parallel | 2 | Low | PL | 208 | 100 | 60 |
| Avenell 2004 | 2 × 2 | 4 | High | NI | 134 | 83 | 77 |
| Avenell 2012 | 2 × 2 | 4 | Low | PL | 5292 | 85 | 77 |
| Baeksgaard 1998 | Parallel | 3 | High | PL | 240 | 100 | 62.5 |
| Bischoff 2003 | Parallel | 2 | High | PL | 122 | 100 | 85.3 |
| Bjorkman 2007 | Parallel | 3 | Low | PL | 218 | 82 | 84.5 |
| Bolton‐Smith 2007 | 2 × 2 | 4 | Low | PL | 244 | 100 | 68 |
| Brazier 2005 | Parallel | 2 | High | PL | 192 | 100 | 74.6 |
| Broe 2007 | Parallel | 5 | Low | PL | 124 | 73 | 89 |
| Brohult 1973 | Parallel | 2 | High | PL | 50 | 68 | 52 |
| Burleigh 2007 | Parallel | 2 | Low | PL | 205 | 59 | 83 |
| Campbell 2005 | 2 × 2 | 4 | High | NI | 391 | 68 | 83.6 |
| Chapuy 1992 | Parallel | 2 | High | PL | 3270 | 100 | 84 |
| Chapuy 2002 | Parallel | 3 | High | PL | 610 | 100 | 85 |
| Chel 2008 | Parallel | 6 | High | PL | 338 | 77 | 84 |
| Cherniack 2011 | Parallel | 2 | High | PL | 46 | 2 | 80 |
| Cooper 2003 | Parallel | 2 | Low | PL | 187 | 100 | 56 |
| Corless 1985 | Parallel | 2 | High | PL | 65 | 78 | 82.4 |
| Daly 2008 | Parallel | 2 | High | NI | 167 | 0 | 61.9 |
| Dawson‐Hughes 1997 | Parallel | 2 | Low | PL | 389 | 55 | 71 |
| Dukas 2004 | Parallel | 2 | Low | PL | 378 | 51 | 71 |
| Flicker 2005 | Parallel | 2 | Low | PL | 625 | 95 | 83.4 |
| Gallagher 2001 | 2 × 2 | 4 | Low | PL | 489 | 100 | 71.5 |
| Glendenning 2012 | Parallel | 2 | Low | PL | 686 | 100 | 76.7 |
| Grady 1991 | Parallel | 2 | High | PL | 98 | 54 | 79.1 |
| Grimnes 2011 | Parallel | 2 | Low | PL | 104 | 49 | 52 |
| Harwood 2004 | Parallel | 4 | High | NI | 150 | 100 | 81.2 |
| Jackson 2006 | Parallel | 2 | Low | PL | 36,282 | 100 | 62.4 |
| Janssen 2010 | Parallel | 2 | Low | PL | 70 | 100 | 80.8 |
| Komulainen 1999 | 2 × 2 | 4 | Low | PL | 464 | 100 | 52.7 |
| Krieg 1999 | Parallel | 2 | High | NI | 248 | 100 | 84.5 |
| Kärkkäinen 2010 | Parallel | 2 | High | NI | 3139 | 100 | 67 |
| Lappe 2007 | Parallel | 3 | High | PL | 1179 | 100 | 66.7 |
| Larsen 2004 | 2 × 2 | 4 | High | NI | 9605 | 60 | 75 |
| Latham 2003 | 2 × 2 | 4 | Low | PL | 243 | 53 | 79.5 |
| Law 2006 | Parallel | 2 | High | NI | 3717 | 76 | 85 |
| Lehouck 2012 | Parallel | 2 | Low | PL | 181 | 20 | 68 |
| Lips 1996 | Parallel | 2 | Low | PL | 2578 | 74 | 80 |
| Lips 2010 | Parallel | 2 | Low | PL | 226 | NR | 78 |
| Lyons 2007 | Parallel | 2 | Low | PL | 3440 | 76 | 84 |
| Meier 2004 | Parallel | 2 | High | NI | 55 | 65 | 56.5 |
| Mochonis 2006 | Parallel | 3 | High | NI | 112 | 100 | 60.3 |
| Ooms 1995 | Parallel | 2 | Low | PL | 348 | 100 | 80.3 |
| Ott 1989 | Parallel | 2 | High | PL | 86 | 100 | 67.5 |
| Porthouse 2005 | Parallel | 2 | High | NI | 3314 | 100 | 76.8 |
| Prince 2008 | Parallel | 2 | Low | PL | 302 | 100 | 77.2 |
| Sanders 2010 | Parallel | 2 | Low | PL | 2258 | 100 | 76.0 |
| Sato 1997 | Parallel | 2 | High | PL | 64 | 45 | 68.5 |
| Sato 1999a | Parallel | 2 | High | PL | 86 | 78 | 70.6 |
| Sato 1999b | Parallel | 3 | High | NI | 103 | 56 | 70.7 |
| Sato 2005a | Parallel | 2 | Low | PL | 96 | 100 | 74.1 |
| Schleithoff 2006 | Parallel | 2 | Low | PL | 123 | 17 | 51 |
| Smith 2007 | Parallel | 2 | Low | PL | 9440 | 54 | 79.1 |
| Trivedi 2003 | Parallel | 2 | Low | PL | 2686 | 24 | 74.7 |
| Witham 2010 | Parallel | 2 | Low | PL | 105 | 34 | 79.7 |
| Zhu 2008 | Parallel | 3 | Low | PL | 120 | 100 | 75 |
| NI: no intervention; NR: not reported; PL: placebo | |||||||
| Characteristic Study ID | Participants | Outcome Measures | Country | Sponsor |
| Aloia 2005 | Black postmenopausal African‐American women | Bone mineral density | USA | No |
| Avenell 2004 | Elderly people with an osteoporotic fracture within the past 10 years | Recruitment, compliance and retention within a randomised trial | UK | Yes |
| Avenell 2012 | Elderly people with low‐trauma osteoporotic fracture in the previous 10 years | Fractures | UK | Yes |
| Baeksgaard 1998 | Postmenopausal women | Bone mineral density | Denmark | Yes |
| Bischoff 2003 | Elderly women living in institutional care | Falls | Switzerland | Yes |
| Bjorkman 2007 | Chronically bedridden patients | Parathyroid function and bone mineral density | Finland | Yes |
| Bolton‐Smith 2007 | Elderly non‐osteoporotic women | Bone mineral density | UK | Yes |
| Brazier 2005 | Elderly vitamin D–insufficient women | Bone mineral density | France | Yes |
| Broe 2007 | Nursing home residents | Falls | USA | Yes |
| Brohult 1973 | Patients with rheumatoid arthritis | Objective and subjective improvement | Sweden | Yes |
| Burleigh 2007 | Older geriatric inpatients | Falls | UK | Yes |
| Campbell 2005 | Elderly people with visual impairment | Numbers of falls and injuries resulting from falls | New Zealand | No |
| Chapuy 1992 | Healthy ambulatory women | Fractures | France | Yes |
| Chapuy 2002 | Elderly people living in institutional care | Biochemical variables of calcium homeostasis, femoral neck bone mineral density and hip | France | Yes |
| Chel 2008 | Nursing home residents | Vitamin D status | Netherlands | Yes |
| Cherniack 2011 | Elderly people | Vitamin D status | USA | Yes |
| Cooper 2003 | Postmenopausal women | Bone mineral density | Australia | Yes |
| Corless 1985 | Elderly patients from the geriatric wards | Abilities to carry out basic activities of daily life | UK | Yes |
| Daly 2008 | Healthy ambulatory men | Bone mineral density | Australia | Yes |
| Dawson‐Hughes 1997 | Healthy ambulatory participants | Bone mineral density | USA | Yes |
| Dukas 2004 | Elderly people | Falls | Switzerland | Yes |
| Flicker 2005 | Elderly people living in institutional care | Falls and fractures | Australia | No |
| Gallagher 2001 | Elderly women | Bone mineral density | USA | No |
| Glendenning 2012 | Elderly community‐dwelling ambulatory women | Falls, muscular strength and mobility | Australia | No |
| Grady 1991 | Elderly people | Muscle strength | USA | Yes |
| Grimnes 2011 | Healthy people with a low vitamin D status | Insulin sensitivity and secretion | Norway | No |
| Harwood 2004 | Elderly women following surgery for hip fracture | Bone mineral density, falls and fractures | UK | Yes |
| Jackson 2006 | Postmenopausal women | Fractures | USA | Yes |
| Janssen 2010 | Elderly vitamin D–insufficient women | Muscle strength, power and functional mobility | Netherlands | Yes |
| Komulainen 1999 | Postmenopausal women | Bone mineral density | Finland | Yes |
| Krieg 1999 | Elderly institutionalised women | Bone mineral density | Switzerland | Yes |
| Kärkkäinen 2010 | Postmenopausal women | Falls | Finland | Yes |
| Lappe 2007 | Healthy postmenopausal white women | Fractures | USA | Yes |
| Larsen 2004 | Older community‐dwelling residents | Falls | Denmark | Yes |
| Latham 2003 | Frail elderly people | Self‐rated physical health and falls | New Zealand | No |
| Law 2006 | Nursing home residents | Falls and fractures | UK | No |
| Lehouck 2012 | Patients with chronic obstructive pulmonary disease | Time to first exacerbation | Belgium | Yes |
| Lips 1996 | Elderly people | Fractures | Netherlands | Yes |
| Lips 2010 | Elderly people with vitamin D insufficiency | Postural stability, muscle strength and safety | Netherlands | No |
| Lyons 2007 | Older people living in institutional care | Fractures | UK | No |
| Meier 2004 | Healthy volunteers | Bone mineral density | Germany | No |
| Mochonis 2006 | Postmenopausal women | Bone mineral density | Greece | Yes |
| Ooms 1995 | Elderly people | Bone mineral density | Netherlands | Yes |
| Ott 1989 | Postmenopausal women | Bone mass | USA | Yes |
| Porthouse 2005 | Elderly women with one or more risk factors for hip fracture | Fractures | UK | Yes |
| Prince 2008 | Elderly women with a history of falling and vitamin D insufficiency | Falls | Australia | Yes |
| Sanders 2010 | Elderly women at high risk of fracture | Falls and fractures | Australia | Yes |
| Sato 1997 | Outpatients with hemiplegia after stroke | Bone mineral density and fractures | Japan | No |
| Sato 1999a | Elderly patients with Parkinson's disease | Fractures | Japan | No |
| Sato 1999b | Outpatients with hemiplegia after stroke | Bone mineral density | Japan | Yes |
| Sato 2005a | Hospitalised elderly women with post‐stroke hemiplegia | Falls | Japan | No |
| Schleithoff 2006 | Patients with congestive heart failure | Mortality | Germany | Yes |
| Smith 2007 | Elderly people | Fractures | UK | No |
| Trivedi 2003 | Elderly people | Mortality, fractures | UK | No |
| Witham 2010 | Patients with systolic heart failure | Exercise capacity | UK | No |
| Zhu 2008 | Elderly women | Bone mineral density | Australia | No |
| Characteristic Study ID | D3 | D2 | 1α(OH)D | 1,25(OH)2D | Ca | Regimen | Route | Treatment | Follow‐up |
| Aloia 2005 | 800 |
|
|
| 1200‐1500a | Daily | Oral | 3 | 3 |
| Avenell 2004 | 800 |
|
|
| 1000b | Daily | Oral | 1 | 1 |
| Avenell 2012 | 800 |
|
|
| 500b | Daily | Oral | 3.75 | 6.2 |
| Baeksgaard 1998 | 560 |
|
|
| 1000 | Daily | Oral | 2 | 2 |
| Bischoff 2003 | 800 |
|
|
| 1200a | Daily | Oral | 0.25 | 0.25 |
| Bjorkman 2007 | 400 |
|
|
| 500a | Daily | Oral | 0.5 | 0.5 |
| Bolton‐Smith 2007 | 400 |
|
|
| 1000 | Daily | Oral | 2 | 2 |
| Brazier 2005 | 800 |
|
|
| 1000 | Daily | Oral | 1 | 1 |
| Broe 2007 |
| 200 |
|
|
| Daily | Oral | 0.42 | 0.42 |
| Brohult 1973 | 100,000 | Daily | Oral | 1 | 1 | ||||
| Burleigh 2007 | 800 |
|
|
| 1200a | Daily | Oral | 0.08 | 0.08 |
| Campbell 2005 | 50,000 100,000 |
|
|
|
| Monthly | Oral | 1 | 1 |
| Chapuy 1992 | 800 |
|
|
| 1200 | Daily | Oral | 1.5 | 4 |
| Chapuy 2002 | 800 |
|
|
| 1200 | Daily | Oral | 2 | 2 |
| Chel 2008 | 600 |
|
|
| 800 | Daily | Oral | 0.33 | 0.33 |
| Cherniack 2011 | 2000 | 1200a | Daily | Oral | 0.5 | 0.5 | |||
| Cooper 2003 |
| 10,000 |
|
| 1000a | Weekly | Oral | 2 | 2 |
| Corless 1985 |
| 9000 |
|
|
| Daily | Oral | 0.75 | 0.75 |
| Daly 2008 | 800 |
|
|
| 1000 | Daily | Oral | 2 | 3.5 |
| Dawson‐Hughes 1997 | 700 |
|
|
| 500 | Daily | Oral | 3 | 3 |
| Dukas 2004 |
|
| 1 |
|
| Daily | Oral | 0.75 | 0.75 |
| Flicker 2005 |
| 1000 |
|
| 600a | Daily | Oral | 2 | 2 |
| Gallagher 2001 |
|
|
| 0.5 |
| Daily | Oral | 3 | 5 |
| Glendenning 2012 | 150,000 | Three‐monthly | Oral | 0.5 | 0.75 | ||||
| Grady 1991 |
|
|
| 0.5 |
| Daily | Oral | 0.5 | 0.5 |
| Grimnes 2011 | 20,000 | Twice weekly | Oral | 0.5 | 0.5 | ||||
| Harwood 2004 | 800 | 300,000 |
|
| 1000 | Single dose | Intramuscular Oral | 1 | 1 |
| Jackson 2006 | 400 |
|
|
| 1000 | Daily | Oral | 7 | 7 |
| Janssen 2010 | 400 | 500a | Daily | Oral | 0.5 | 0.5 | |||
| Komulainen 1999 | 300 |
|
|
| 500 | Daily | Oral | 5 | 5 |
| Krieg 1999 | 880 |
|
|
| 1000 | Daily | Oral | 2 | 2 |
| Kärkkäinen 2010 | 800 |
|
|
| 1000 | Daily | Oral | 3 | 3 |
| Lappe 2007 | 1000 |
|
|
| 1400‐1500b | Daily | Oral | 4 | 4 |
| Larsen 2004 | 400 |
|
|
| 1000 | Daily | Oral | 3.5 | 3.5 |
| Latham 2003 | 300,000 |
|
|
|
| Single dose | Oral | 0.003 | 0.5 |
| Law 2006 |
| 100,000 |
|
|
| Four‐monthly | Oral | 0.83 | 0.83 |
| Lehouck 2012 | 100,000 | Monthly | Oral | 1 | 1 | ||||
| Lips 1996 | 400 |
|
|
|
| Daily | Oral | 3.5 | 3.5 |
| Lips 2010 | 8400 | 500a | weekly | Oral | 0.31 | 0.31 | |||
| Lyons 2007 |
| 100,000 |
|
|
| Four‐monthly | Oral | 3 | 3 |
| Meier 2004 | 500 |
|
|
| 500 | Daily | Oral | 0.5 | 1 |
| Mochonis 2006 | 300 |
|
|
| 1200b | Daily | Oral | 1 | 1 |
| Ooms 1995 | 400 |
|
|
|
| Daily | Oral | 2 | 2 |
| Ott 1989 |
|
|
| 0.5 | 1000a | Daily | Oral | 2 | 2 |
| Porthouse 2005 | 800 |
|
|
| 1000 | Daily | Oral | 2 | 2 |
| Prince 2008 |
| 1000 |
|
| 1000a | Daily | Oral | 1 | 1 |
| Sanders 2010 | 500,000 | Yearly | Oral | 2.96 | 2.96 | ||||
| Sato 1997 |
|
| 1 |
| 300a | Daily | Oral | 0.5 | 0.5 |
| Sato 1999a |
|
| 1 |
|
| Daily | Oral | 1.5 | 1.5 |
| Sato 1999b |
|
| 1 |
|
| Daily | Oral | 1 | 1 |
| Sato 2005a |
| 1000 |
|
|
| Daily | Oral | 2 | 2 |
| Schleithoff 2006 | 2000 |
|
|
| 500a | Daily | Oral | 0.75 | 1.25 |
| Smith 2007 |
| 300,000 |
|
|
| Yearly | Intramuscular | 3 | 3 |
| Trivedi 2003 | 100,000 |
|
|
|
| Four‐monthly | Oral | 5 | 5 |
| Witham 2010 | 100,000 |
|
|
| 10‐weekly | Oral | 0.38 | 0.38 | |
| Zhu 2008 |
| 1000 |
|
| 1200b | Daily | Oral | 5 | 5 |
| aEqual dose of calcium was administered to a control group | |||||||||
| Characteristic Study ID | Intervention(s) and control(s) | [N] screened / eligible | [N] randomised | [N] ITT | [N] finishing study | [%] of randomised participants |
| 1. Aloia 2005 | I: vitamin D3 plus calcium | 322 | 104 | 104 | 74 | 71 |
| C: placebo | 104 | 104 | 74 | 71 | ||
| total: | 208 | 208 | 148 | 71 | ||
| 2. Avenell 2004 | I: vitamin D3 | 180 | 70 | 70 | ‐ | ‐ |
| C: no intervention | 64 | 64 | ‐ | ‐ | ||
| total: | 134 | 134 | ‐ | ‐ | ||
| 3. Avenell 2012 | I: vitamin D3 | 15,024 | 2649 | 2649 | 1813 | 68 |
| C: matched placebo tablets | 2643 | 2643 | 1762 | 67 | ||
| total: | 5292 | 5292 | 3575 | 68 | ||
| 4. Baeksgaard 1998 | I: vitamin D3 plus calcium | ‐ | 80 | 80 | 65 | 81 |
| C: matched placebo tablets | 80 | 80 | 64 | 80 | ||
| total: | 160 | 160 | 129 | 80 | ||
| 5. Bischoff 2003 | I: vitamin D3 plus calcium | 130 | 62 | 62 | ‐ | ‐ |
| C: calcium | 60 | 60 | ‐ | ‐ | ||
| total: | 122 | 122 | 89 | 73 | ||
| 6. Bjorkman 2007 | I: vitamin D3 plus calcium | 1215 | 150 | 150 | 123 | 82 |
| C: calcium | 68 | 68 | 59 | 87 | ||
| total: | 218 | 218 | 182 | 83 | ||
| 7. Bolton‐Smith 2007 | I: vitamin D3 plus calcium | ‐ | 62 | 62 | 50 | 81 |
| C: matched placebo | 61 | 61 | 56 | 92 | ||
| total: | 123 | 123 | 106 | 86 | ||
| 8. Brazier 2005 | I: vitamin D3 plus calcium | 360 | 95 | 95 | 74 | 78 |
| C: matched placebo tablets | 97 | 97 | 68 | 70 | ||
| total: | 192 | 192 | 142 | 74 | ||
| 9. Broe 2007 | I: vitamin D2 | 126 | 99 | 99 | 96 | 97 |
| C: matched placebo tablets | 25 | 25 | 25 | 100 | ||
| total: | 124 | 124 | 121 | 98 | ||
| 10. Brohult 1973 | I: vitamin D3 | ‐ | 25 | 25 | 24 | 96 |
| C: placebo | 25 | 25 | 25 | 100 | ||
| total: | 50 | 50 | 49 | 98 | ||
| 11. Burleigh 2007 | I: vitamin D3 plus calcium | 515 | 101 | 101 | 98 | 97 |
| C: placebo | 104 | 104 | 101 | 97 | ||
| total: | 205 | 205 | 199 | 97 | ||
| 12. Campbell 2005 | I: home safety assessment and modification programme | 391 | 195 | 195 | 177 | 91 |
| C: social visits | 196 | 196 | 184 | 94 | ||
| total: | 391 | 391 | 361 | 92 | ||
| 13. Chapuy 1992 | I: vitamin D3 plus calcium | ‐ | 1634 | 1634 | 1590 | 97 |
| C: double placebo | 1636 | 1636 | 1573 | 96 | ||
| total: | 3270 | 3270 | 3163 | 96 | ||
| 14. Chapuy 2002 | I: vitamin D3 plus calcium | 639 | 393 | 393 | ‐ | ‐ |
| C: double placebo | 190 | 190 | ‐ | ‐ | ||
| total: | 583 | 583 | ‐ | ‐ | ||
| 15. Chel 2008 | I: vitamin D3 | 1006 | 166 | 166 | 139 | 84 |
| C: matched placebo tablets | 172 | 172 | 137 | 80 | ||
| total: | 338 | 338 | 276 | 82 | ||
| 16. Cherniack 2011 | I: vitamin D3 plus calcium | 52 | 23 | 23 | 17 | 74 |
| C: matched placebo plus calcium | 23 | 23 | 17 | 74 | ||
| total: | 46 | 46 | 34 | 74 | ||
| 17. Cooper 2003 | I: vitamin D2 plus calcium | ‐ | 93 | 93 | 73 | 78 |
| C: calcium | 94 | 94 | 80 | 85 | ||
| total: | 187 | 187 | 153 | 82 | ||
| 18. Coreless 1985 | I: vitamin D2 | 320 | 32 | 32 | 8 | 25 |
| C: placebo | 33 | 33 | 17 | 51 | ||
| total: | 65 | 65 | 25 | 38 | ||
| 19. Daly 2006 | I: calcium‐vitamin D3–fortified milk plus calcium | 422 | 85 | 85 | 76 | 89 |
| C: no intervention | 82 | 82 | 73 | 89 | ||
| total: | 167 | 167 | 149 | 89 | ||
| 20. Dawson‐Hughes 1997 | I: vitamin D3 plus calcium | 545 | 187 | 187 | 148 | 79 |
| C: placebo | 202 | 202 | 170 | 84 | ||
| total: | 389 | 389 | 318 | 82 | ||
| 21. Dukas 2004 | I: alfacalcidol | 410 | 192 | 192 | ‐ | ‐ |
| C: placebo | 186 | 186 | ‐ | ‐ | ||
| total: | 378 | 378 | ‐ | ‐ | ||
| 22. Flicker 2005 | I: vitamin D3 plus calcium | 1767 | 313 | 313 | 269 | 86 |
| C: calcium | 312 | 312 | 271 | 87 | ||
| total: | 625 | 625 | 540 | 86 | ||
| 23. Gallagher 2001 | I: calcitriol | 1905 | 123 | 123 | 101 | 82 |
| C: matched placebo | 123 | 123 | 112 | 91 | ||
| total: | 246 | 246 | 213 | 87 | ||
| 24. Glendenning 2012 | I: cholecalciferol 150,000 three‐monthly | 2110 | 353 | 353 | 331 | 94 |
| C: placebo vitamin D | 333 | 333 | 307 | 92 | ||
| total: | 686 | 686 | 638 | 93 | ||
| 25. Grady 1991 | I: calcitriol | 98 | 50 | 50 | 49 | 98 |
| C: placebo vitamin D | 48 | 48 | 47 | 98 | ||
| total: | 98 | 98 | 96 | 98 | ||
| 26. Grimnes 2011 | I: vitamin D3 | 108 | 51 | 51 | 49 | 96 |
| C: placebo | 53 | 53 | 45 | 85 | ||
| total: | 104 | 104 | 94 | 90 | ||
| 27. Harwood 004 | I: vitamin D plus calcium | 208 | 113 | 113 | ‐ | ‐ |
| C: no intervention | 37 | 37 | ‐ | ‐ | ||
| total: | 150 | 150 | ‐ | ‐ | ||
| 28. Jackson 2006 | I: vitamin D3 plus calcium | 68,132 | 18,176 | 18,176 | 16,936 | 93 |
| C: matched placebo | 18,106 | 18,106 | 16,815 | 93 | ||
| total: | 36,282 | 36,282 | 33,751 | 93 | ||
| 29. Janssen 2010 | I: vitamin D3 plus calcium | 91 | 36 | 36 | 18 | 50 |
| C: matched placebo vitamin D3 plus calcium | 34 | 34 | 31 | 91 | ||
| total: | 70 | 70 | 49 | 70 | ||
| 30. Komulainen 1999 | I: oestradiol valerate and cyproterone acetate | 13,100 | 116 | 116 | ‐ | ‐ |
| C: placebo | 116 | 116 | ‐ | ‐ | ||
| total: | 232 | 232 | ‐ | ‐ | ||
| 31. Krieg 1999 | I: vitamin D3 plus calcium | ‐ | 124 | 124 | 50 | 40 |
| C: no treatment | 124 | 124 | 53 | 43 | ||
| total: | 248 | 248 | 103 | 41 | ||
| 32. Kärkkäinen 2010 | I: vitamin D3 plus calcium | 5407 | 1718 | 1718 | 1566 | 91 |
| C: no treatment | 1714 | 1714 | 1573 | 92 | ||
| total: | 3432 | 3432 | 3139 | 91 | ||
| 33. Lappe 2007 | I: vitamin D3 plus calcium | 1180 | 446 | 446 | ‐ | ‐ |
| C: calcium plus placebo tablets | 733 | 733 | ‐ | ‐ | ||
| total: | 1179 | 1179 | ‐ | ‐ | ||
| 34. Larsen 2004 | I: home safety inspection, vitamin D3 plus calcium | 62,000 | 4957 | 4957 | ‐ | ‐ |
| C: no intervention | 4648 | 4648 | ‐ | ‐ | ||
| total: | 9605 | 9605 | ‐ | ‐ | ||
| 35. Latham 2003 | I: vitamin D3 | 3,028 | 121 | 121 | 108 | 89 |
| C: matched placebo tablets | 122 | 122 | 114 | 93 | ||
| total: | 243 | 243 | 222 | 91 | ||
| 36. Law 2006 | I: vitamin D2 | ‐ | 1762 | 1762 | 1366 | 77 |
| C: no intervention | 1955 | 1955 | 1569 | 80 | ||
| total: | 3717 | 3717 | 2935 | 79 | ||
| 37. Lehouck 2012 | I: vitamin D3 | 419 | 91 | 91 | 72 | 79 |
| C: matched placebo | 91 | 91 | 78 | 86 | ||
| total: | 182 | 182 | 150 | 82 | ||
| 38. Lips 1996 | I: vitamin D3 | ‐ | 1291 | 1291 | 1061 | 82 |
| C: matched placebo | 1287 | 1287 | 1029 | 80 | ||
| total: | 2578 | 2578 | 2090 | 81 | ||
| 39. Lips 2010 | I: vitamin D3 | 593 | 114 | 114 | 105 | 92 |
| C: matched placebo | 112 | 112 | 97 | 87 | ||
| total: | 226 | 226 | 202 | 89 | ||
| 40. Lyons 2007 | I: vitamin D2 | 5745 | 1725 | 1725 | 778 | 45 |
| C: matched placebo tablets | 1715 | 1715 | 762 | 44 | ||
| total: | 3440 | 3440 | 1540 | 44 | ||
| 41. Meier 2004 | I: vitamin D3 | ‐ | 30 | 30 | 27 | 90 |
| C: no intervention | 25 | 25 | 16 | 64 | ||
| total: | 55 | 55 | 43 | 78 | ||
| 42. Mochonis 2006 | I: vitamin D3 plus calcium | ‐ | 72 | 72 | 65 | 90 |
| C: no intervention | 40 | 40 | 36 | 90 | ||
| total: | 112 | 112 | 101 | 90 | ||
| 43. Ooms 1995 | I: vitamin D3 | ‐ | 177 | 177 | 126 | 71 |
| C: matched placebo | 171 | 171 | 118 | 69 | ||
| total: | 348 | 348 | 244 | 70 | ||
| 44. Ott 1989 | I: vitamin D3 plus calcium | ‐ | 43 | 43 | 39 | 91 |
| C: matched placebo vitamin D plus calcium | 43 | 43 | 37 | 86 | ||
| total: | 86 | 86 | 76 | 88 | ||
| 45. Porthouse 2005 | I: vitamin D3 plus calcium | 11,022 | 1321 | 1321 | 1212 | 92 |
| C: no intervention | 1993 | 1993 | 1862 | 93 | ||
| total: | 3454 | 3454 | 3074 | 92 | ||
| 46. Prince 2008 | I: vitamin D2 plus calcium | 827 | 151 | 151 | 144 | 95 |
| C: matched placebo tablets of vitamin D plus calcium | 151 | 151 | 145 | 96 | ||
| total: | 302 | 302 | 289 | 95 | ||
| 47. Sanders 2010 | I: vitamin D3 | 7204 | 1131 | 1131 | 1015 | 90 |
| C: matched placebo tablets | 1127 | 1127 | 1017 | 90 | ||
| total: | 2258 | 2258 | 1032 | 90 | ||
| 48. Sato 1997 | I: vitamin D (alfacalcidol) plus calcium | ‐ | 45 | 45 | 30 | 67 |
| C: matched placebo tablets of vitamin D and calcium | 39 | 39 | 34 | 87 | ||
| total: | 84 | 84 | 64 | 76 | ||
| 49. Sato 1999a | I: vitamin D (alfacalcidol) | ‐ | 43 | 43 | 40 | 93 |
| C: matched placebo tablets of vitamin D | 43 | 43 | 40 | 93 | ||
| total: | 86 | 86 | 80 | 93 | ||
| 50. Sato 1999b | I: vitamin D (alfacalcidol) | ‐ | 34 | 34 | 32 | 94 |
| C: matched placebo tablet of vitamin D | 35 | 35 | 32 | 91 | ||
| total: | 69 | 69 | 64 | 93 | ||
| 51. Sato 2005a | I: vitamin D2 | ‐ | 48 | 48 | 43 | 90 |
| C: matched placebo tablets of vitamin D | 48 | 48 | 42 | 87 | ||
| total: | 96 | 96 | 85 | 88 | ||
| 52. Schleithoff 2006 | I: vitamin D3 plus calcium | ‐ | 61 | 61 | 42 | 69 |
| C: matched placebo vitamin D plus calcium | 62 | 62 | 51 | 82 | ||
| total: | 103 | 103 | 93 | 90 | ||
| 53. Smith 2007 | I: vitamin D2 | 13,487 | 4727 | 4727 | 2304 | 49 |
| C: matched placebo intramuscular injection | 4713 | 4713 | 2266 | 48 | ||
| total: | 9440 | 9440 | 4570 | 48 | ||
| 54. Trivedi 2003 | I: vitamin D3 | ‐ | 1345 | 1345 | 1262 | 94 |
| C: matched placebo vitamin D | 1341 | 1341 | 1264 | 94 | ||
| total: | 2696 | 2696 | 2526 | 94 | ||
| 55. Witham 2010 | I: vitamin D2 | 173 | 53 | 53 | 48 | 91 |
| C: matched placebo tablets | 52 | 52 | 48 | 91 | ||
| total: | 105 | 105 | 96 | 91 | ||
| 56. Zhu 2008 | I: vitamin D2 plus calcium | ‐ | 39 | 39 | 33 | 85 |
| C: matched placebo vitamin D and calcium | 81 | 81 | 74 | 91 | ||
| total: | 120 | 120 | 107 | 89 | ||
| Grand total | All interventions | 47,472 | 45,351 | |||
| All controls | 47,814 | 45,278 | ||||
| All interventions and controls | 95,286 | 90,629a | ||||
| "‐" denotes not reported aNumbers not available for all studies C: control; I: intervention; ITT: intention‐to‐treat | ||||||
| Outcome or subgroup title | No. of studies | No. of participants | Statistical method | Effect size |
| 1 All‐cause mortality in trials with low or high risk of bias Show forest plot | 56 | 95286 | Risk Ratio (M‐H, Random, 95% CI) | 0.97 [0.94, 0.99] |
| 1.1 Trials with low risk of bias | 30 | 67516 | Risk Ratio (M‐H, Random, 95% CI) | 0.96 [0.92, 0.99] |
| 1.2 Trials with high risk of bias | 26 | 27770 | Risk Ratio (M‐H, Random, 95% CI) | 0.99 [0.92, 1.06] |
| 2 All‐cause mortality in individually randomised and cluster‐randomised trials Show forest plot | 56 | 95286 | Risk Ratio (M‐H, Random, 95% CI) | 0.97 [0.94, 0.99] |
| 2.1 Individually randomised trials | 54 | 81964 | Risk Ratio (M‐H, Random, 95% CI) | 0.96 [0.93, 0.99] |
| 2.2 Cluster‐randomised trials | 2 | 13322 | Risk Ratio (M‐H, Random, 95% CI) | 1.05 [0.82, 1.34] |
| 3 All‐cause mortality in placebo‐controlled and no intervention trials Show forest plot | 56 | 95286 | Risk Ratio (M‐H, Random, 95% CI) | 0.97 [0.94, 0.99] |
| 3.1 Placebo in the control group | 44 | 73892 | Risk Ratio (M‐H, Random, 95% CI) | 0.96 [0.93, 0.99] |
| 3.2 No intervention in the control group | 12 | 21394 | Risk Ratio (M‐H, Random, 95% CI) | 1.05 [0.91, 1.21] |
| 4 All‐cause mortality and risk of industry bias Show forest plot | 56 | 95286 | Risk Ratio (M‐H, Random, 95% CI) | 0.97 [0.94, 0.99] |
| 4.1 Trials without risk of industry bias | 7 | 7372 | Risk Ratio (M‐H, Random, 95% CI) | 0.97 [0.92, 1.03] |
| 4.2 Trials with risk of industry bias | 49 | 87914 | Risk Ratio (M‐H, Random, 95% CI) | 0.96 [0.93, 1.00] |
| 5 All‐cause mortality in primary and secondary prevention trials Show forest plot | 56 | 95286 | Risk Ratio (M‐H, Random, 95% CI) | 0.97 [0.94, 0.99] |
| 5.1 Primary prevention trials | 48 | 94491 | Risk Ratio (M‐H, Random, 95% CI) | 0.97 [0.94, 0.99] |
| 5.2 Secondary prevention trials | 8 | 795 | Risk Ratio (M‐H, Random, 95% CI) | 1.31 [0.73, 2.35] |
| 6 All‐cause mortality and vitamin D status Show forest plot | 56 | 95286 | Risk Ratio (M‐H, Random, 95% CI) | 0.97 [0.94, 0.99] |
| 6.1 Vitamin D insufficiency | 26 | 56697 | Risk Ratio (M‐H, Random, 95% CI) | 0.95 [0.91, 0.99] |
| 6.2 Vitamin D adequacy | 19 | 16283 | Risk Ratio (M‐H, Random, 95% CI) | 0.95 [0.87, 1.05] |
| 6.3 Unknown vitamin D status | 11 | 22306 | Risk Ratio (M‐H, Random, 95% CI) | 1.02 [0.92, 1.13] |
| 7 All‐cause mortality in ambulatory and institutionalised participants Show forest plot | 56 | 95286 | Risk Ratio (M‐H, Random, 95% CI) | 0.97 [0.94, 0.99] |
| 7.1 Ambulatory participants | 45 | 86071 | Risk Ratio (M‐H, Random, 95% CI) | 0.95 [0.92, 0.98] |
| 7.2 Institutionalised participants | 11 | 9215 | Risk Ratio (M‐H, Random, 95% CI) | 1.02 [0.92, 1.13] |
| 8 All‐cause mortality ('best‐worst case' and 'worst‐best case' scenario) Show forest plot | 53 | Risk Ratio (M‐H, Random, 95% CI) | Subtotals only | |
| 8.1 'Best‐worst' case scenario | 53 | 84418 | Risk Ratio (M‐H, Random, 95% CI) | 0.40 [0.32, 0.51] |
| 8.2 'Worst‐best' case scenario | 53 | 84418 | Risk Ratio (M‐H, Random, 95% CI) | 2.78 [2.13, 3.63] |
| 9 All‐cause mortality in trials using vitamin D3 (cholecalciferol) Show forest plot | 38 | 75927 | Risk Ratio (M‐H, Random, 95% CI) | 0.94 [0.91, 0.98] |
| 9.1 Vitamin D3 trials with low risk of bias | 20 | 52645 | Risk Ratio (M‐H, Random, 95% CI) | 0.93 [0.89, 0.98] |
| 9.2 Vitamin D3 trials with high risk of bias | 18 | 23282 | Risk Ratio (M‐H, Random, 95% CI) | 0.95 [0.91, 1.00] |
| 10 All‐cause mortality in trials using vitamin D3 singly or combined with calcium Show forest plot | 38 | Risk Ratio (M‐H, Random, 95% CI) | Subtotals only | |
| 10.1 Vitamin D3 singly | 13 | 12609 | Risk Ratio (M‐H, Random, 95% CI) | 0.92 [0.85, 1.00] |
| 10.2 Vitamin D3 combined with calcium | 27 | 63051 | Risk Ratio (M‐H, Random, 95% CI) | 0.96 [0.92, 0.99] |
| 11 All‐cause mortality in trials using low or high dose of vitamin D3 Show forest plot | 38 | Risk Ratio (M‐H, Random, 95% CI) | Subtotals only | |
| 11.1 Low dose of vitamin D3 (< 800 IU a day) | 13 | 50437 | Risk Ratio (M‐H, Random, 95% CI) | 0.92 [0.87, 0.97] |
| 11.2 High dose of vitamin D3 (≥ 800 IU a day) | 26 | 25558 | Risk Ratio (M‐H, Random, 95% CI) | 0.96 [0.92, 1.00] |
| 12 All‐cause mortality in trials applying vitamin D3 daily or intermittently Show forest plot | 38 | Risk Ratio (M‐H, Random, 95% CI) | Subtotals only | |
| 12.1 Vitamin D3 daily | 31 | 69168 | Risk Ratio (M‐H, Random, 95% CI) | 0.95 [0.91, 0.98] |
| 12.2 Vitamin D3 intermittently | 8 | 6871 | Risk Ratio (M‐H, Random, 95% CI) | 0.89 [0.77, 1.03] |
| 13 All‐cause mortality in trials using vitamin D3 and vitamin D status Show forest plot | 38 | 75927 | Risk Ratio (M‐H, Random, 95% CI) | 0.94 [0.91, 0.98] |
| 13.1 Vitamin D insufficiency | 20 | 55883 | Risk Ratio (M‐H, Random, 95% CI) | 0.95 [0.91, 0.99] |
| 13.2 Vitamin D adequacy | 10 | 4979 | Risk Ratio (M‐H, Random, 95% CI) | 0.92 [0.80, 1.07] |
| 13.3 Unknown vitamin D status | 8 | 15065 | Risk Ratio (M‐H, Random, 95% CI) | 0.95 [0.78, 1.16] |
| 14 All‐cause mortality in trials using vitamin D3 according to the participant's sex Show forest plot | 38 | 75927 | Risk Ratio (M‐H, Random, 95% CI) | 0.94 [0.91, 0.98] |
| 14.1 Vitamin D3 trialsincluding only women | 19 | 53062 | Risk Ratio (M‐H, Random, 95% CI) | 0.93 [0.84, 1.03] |
| 14.2 Vitamin D3 trials including men and women | 19 | 22865 | Risk Ratio (M‐H, Random, 95% CI) | 0.94 [0.89, 0.98] |
| 15 All‐cause mortality in trials using vitamin D2 (ergocalciferol) Show forest plot | 12 | 18349 | Risk Ratio (M‐H, Random, 95% CI) | 1.02 [0.96, 1.08] |
| 15.1 Vitamin D2 trials with low risk of bias | 9 | 14439 | Risk Ratio (M‐H, Random, 95% CI) | 0.98 [0.93, 1.04] |
| 15.2 Vitamin D2 trials with high risk of bias | 3 | 3910 | Risk Ratio (M‐H, Random, 95% CI) | 1.20 [1.05, 1.37] |
| 16 All‐cause mortality in trials using vitamin D2 singly or combined with calcium Show forest plot | 12 | Risk Ratio (M‐H, Random, 95% CI) | Subtotals only | |
| 16.1 Vitamin D2 singly | 8 | 17079 | Risk Ratio (M‐H, Random, 95% CI) | 1.03 [0.96, 1.12] |
| 16.2 Vitamin D2 combined with calcium | 5 | 1307 | Risk Ratio (M‐H, Random, 95% CI) | 1.00 [0.64, 1.57] |
| 17 All‐cause mortality in trials using low or high dose of vitamin D2 Show forest plot | 12 | Risk Ratio (M‐H, Random, 95% CI) | Subtotals only | |
| 17.1 Low dose of vitamin D2 | 1 | 101 | Risk Ratio (M‐H, Random, 95% CI) | 0.82 [0.17, 3.98] |
| 17.2 High dose of vitamin D2 | 12 | 18273 | Risk Ratio (M‐H, Random, 95% CI) | 1.02 [0.95, 1.10] |
| 18 All‐cause mortality in trials applying vitamin D2 daily or intermittently Show forest plot | 12 | Risk Ratio (M‐H, Random, 95% CI) | Subtotals only | |
| 18.1 Vitamin D2 daily | 6 | 1349 | Risk Ratio (M‐H, Random, 95% CI) | 0.88 [0.68, 1.12] |
| 18.2 Vitamin D2 intermittently | 6 | 17000 | Risk Ratio (M‐H, Random, 95% CI) | 1.06 [0.95, 1.18] |
| 19 All‐cause mortality in trials using vitamin D2 and vitamin D status Show forest plot | 12 | 18349 | Risk Ratio (M‐H, Random, 95% CI) | 1.02 [0.96, 1.08] |
| 19.1 Vitamin D insufficiency | 6 | 4413 | Risk Ratio (M‐H, Random, 95% CI) | 1.20 [1.05, 1.37] |
| 19.2 Vitamin D adequacy | 5 | 10496 | Risk Ratio (M‐H, Random, 95% CI) | 0.97 [0.86, 1.10] |
| 19.3 Unknown vitamin D status | 1 | 3440 | Risk Ratio (M‐H, Random, 95% CI) | 0.99 [0.93, 1.05] |
| 20 All‐cause mortality in trials using alfacalcidol (1α‐hydroxyvitamin D) Show forest plot | 4 | 617 | Risk Ratio (M‐H, Random, 95% CI) | 0.96 [0.22, 4.15] |
| 21 All‐cause mortality in trials using alfacalcidol and vitamin D status Show forest plot | 4 | 617 | Risk Ratio (M‐H, Random, 95% CI) | 0.96 [0.22, 4.15] |
| 21.1 Vitamin D insufficiency | 2 | 155 | Risk Ratio (M‐H, Random, 95% CI) | 1.01 [0.11, 9.52] |
| 21.2 Vitamin D adequacy | 1 | 378 | Risk Ratio (M‐H, Random, 95% CI) | 0.97 [0.06, 15.37] |
| 21.3 Unknown vitamin D status | 1 | 84 | Risk Ratio (M‐H, Random, 95% CI) | 0.87 [0.06, 13.40] |
| 22 All‐cause mortality in trials using calcitriol (1,25‐dihydroxyvitamin D) Show forest plot | 3 | 430 | Risk Ratio (M‐H, Random, 95% CI) | 1.37 [0.27, 7.03] |
| 23 All‐cause mortality in trials using calcitriol and vitamin D status Show forest plot | 3 | 430 | Risk Ratio (M‐H, Random, 95% CI) | 1.37 [0.27, 7.03] |
| 23.1 Vitamin D insufficiency | 1 | 86 | Risk Ratio (M‐H, Random, 95% CI) | 0.33 [0.01, 7.96] |
| 23.2 Vitamin D adequacy | 2 | 344 | Risk Ratio (M‐H, Random, 95% CI) | 2.28 [0.34, 15.39] |
| 24 Cancer mortality Show forest plot | 4 | 44492 | Risk Ratio (M‐H, Random, 95% CI) | 0.88 [0.78, 0.98] |
| 25 Cardiovascular mortality Show forest plot | 10 | 47267 | Risk Ratio (M‐H, Random, 95% CI) | 0.98 [0.90, 1.07] |
| 26 Adverse events Show forest plot | 35 | Risk Ratio (M‐H, Random, 95% CI) | Subtotals only | |
| 26.1 Hypercalcemia in trials using supplemental forms of vitamin D | 15 | 11323 | Risk Ratio (M‐H, Random, 95% CI) | 1.36 [0.85, 2.18] |
| 26.2 Hypercalcemia in trials using active forms of vitamin D | 3 | 710 | Risk Ratio (M‐H, Random, 95% CI) | 3.18 [1.17, 8.68] |
| 26.3 Nephrolithiasis in trials using vitamin D3 combined with calcium | 4 | 42876 | Risk Ratio (M‐H, Random, 95% CI) | 1.17 [1.02, 1.34] |
| 26.4 Nephrolithiasis in trials using calcitriol | 1 | 246 | Risk Ratio (M‐H, Random, 95% CI) | 0.33 [0.01, 8.10] |
| 26.5 Hypercalciuria | 3 | 695 | Risk Ratio (M‐H, Random, 95% CI) | 4.64 [0.99, 21.76] |
| 26.6 Renal insufficiency | 3 | 5495 | Risk Ratio (M‐H, Random, 95% CI) | 1.70 [0.27, 10.70] |
| 26.7 Cardiovascular disorders | 8 | 4495 | Risk Ratio (M‐H, Random, 95% CI) | 0.95 [0.86, 1.05] |
| 26.8 Gastrointestinal disorders | 16 | 9702 | Risk Ratio (M‐H, Random, 95% CI) | 1.36 [0.87, 2.13] |
| 26.9 Psychiatric disorders | 3 | 580 | Risk Ratio (M‐H, Random, 95% CI) | 1.44 [0.56, 3.73] |
| 26.10 Skin disorders | 2 | 3810 | Risk Ratio (M‐H, Random, 95% CI) | 3.27 [0.17, 62.47] |
| 26.11 Cancer | 14 | 49707 | Risk Ratio (M‐H, Random, 95% CI) | 0.99 [0.94, 1.06] |