Vitamin D supplementation for prevention of mortality in adults
Information
- DOI:
- https://doi.org/10.1002/14651858.CD007470.pub3Copy DOI

- Database:
-
- Cochrane Database of Systematic Reviews
- Version published:
-
- 10 January 2014see what's new
- Type:
-
- Intervention
- Stage:
-
- Review
- Cochrane Editorial Group:
-
Cochrane Metabolic and Endocrine Disorders Group
- Copyright:
-
- Copyright © 2014 The Cochrane Collaboration. Published by John Wiley & Sons, Ltd.
Article metrics
Altmetric:
Cited by:
Authors
Contributions of authors
Goran Bjelakovic (GB): performed the literature search, data extraction and statistical analyses and drafted the review.
Lise Lotte Gluud (LLG): performed data extraction and revised the review.
Dimitrinka Nikolova (DN): performed data extraction and revised the review.
Kate Whitfield (KW): developed the search strategy, performed data extraction and revised the review.
Jørn Wetterslev (JW): performed data extraction and revised the review.
Rosa G Simonetti (RGS): performed data extraction and revised the review.
Marija Bjelakovic (MB) performed data extraction and revised the review.
Christian Gluud (CG): initiated the systematic review, acted as arbiter for disagreements and revised the review.
Sources of support
Internal sources
-
The Copenhagen Trial Unit, Centre for Clinical Intervention Research, Rigshospitalet, Denmark.
External sources
-
Ministry of Science Republic of Serbia, Serbia.
Declarations of interest
None known.
Acknowledgements
We extend our gratitude to all participants and investigators in the randomised clinical trials. We are grateful to the many authors of publications who kindly responded to our requests for further information on the trials in which they were involved.
Version history
| Published | Title | Stage | Authors | Version |
| 2014 Jan 10 | Vitamin D supplementation for prevention of mortality in adults | Review | Goran Bjelakovic, Lise Lotte Gluud, Dimitrinka Nikolova, Kate Whitfield, Jørn Wetterslev, Rosa G Simonetti, Marija Bjelakovic, Christian Gluud | |
| 2011 Jul 06 | Vitamin D supplementation for prevention of mortality in adults | Review | Goran Bjelakovic, Lise Lotte Gluud, Dimitrinka Nikolova, Kate Whitfield, Jørn Wetterslev, Rosa G Simonetti, Marija Bjelakovic, Christian Gluud | |
| 2008 Oct 08 | Vitamin D supplementation for prevention of mortality in adults | Protocol | Goran Bjelakovic, Lise Lotte Gluud, Dimitrinka Nikolova, Kate Whitfield, Jørn Wetterslev, Christian Gluud | |
Differences between protocol and review
Difference between the last published review version and the present review version
We interpreted our results much more conservatively as the result of extensive discussion of the validity of our results among the review authors.
Keywords
MeSH
Medical Subject Headings (MeSH) Keywords
Medical Subject Headings Check Words
Adolescent; Adult; Aged; Aged, 80 and over; Female; Humans; Male; Middle Aged; Young Adult;
PICOs

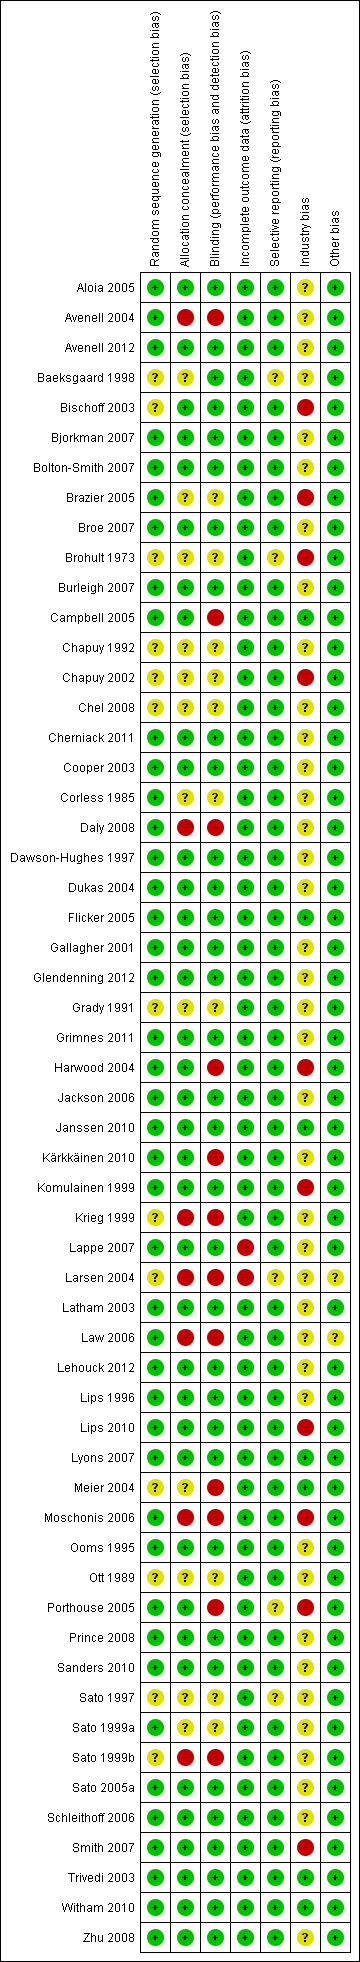
Risk of bias according to bias domains in the 56 randomised clinical trials on vitamin D and mortality.

Risk of bias in the included 56 randomised clinical trials on vitamin D and mortality.
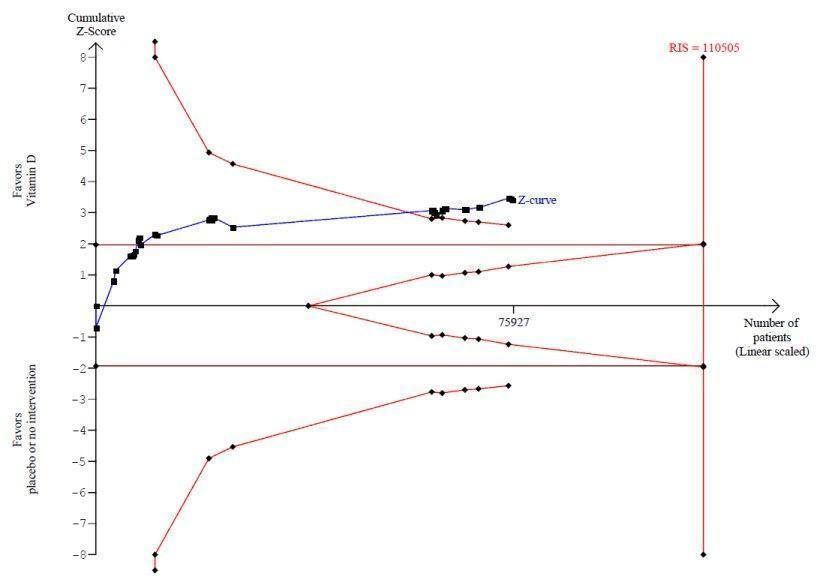
Trial sequential analysis on mortality in 38 vitamin D3 trials
The diversity‐adjusted required information size (RIS) was calculated based on mortality in the control group of 10%; relative risk reduction of 5% in the experimental group; type I error of 5%; and type II error of 20% (80% power). No diversity was noted. The required information size was 110,505 participants. The cumulative Z‐curve (blue line) crossed the trial sequential monitoring boundaries for benefit (red inward sloping line) after the 22nd trial. Accordingly, the risk of random error in the finding seems acceptable according to the O'Brien Fleming stopping rule for an individual trial interim analysis. Subsequently, 16 trials have been published.

Trial sequential analysis on mortality in the 13 trials that administered low dose of vitamin D3 (i.e. a dose less than 800 IU per day)
The diversity‐adjusted required information size (RIS) was calculated based on mortality in the control group of 10%; relative risk reduction of 5% in the experimental group; type I error of 5%; and type II error of 20% (80% power). No diversity was noted. The required information size was 110,505 participants. The cumulative Z‐curve (blue line) did not cross the trial sequential monitoring boundaries for benefit (red line) at any time. Accordingly, the crossing of the conventional statistical 5% boundary (the horizontal brown line) may be due to random errors.

Trial sequential analysis of mortality in 12 vitamin D2 trials
The diversity‐adjusted required information size (RIS) was conducted based on 10% mortality in the control group; relative risk reduction of 10% in the experimental group; type I error of 5%; and type II error of 20% (80% power). No diversity was noted. The required information size was 27,585 participants. The cumulative Z‐curve (blue line) crossed the trial sequential monitoring boundaries for futility (red outward sloping line) after the eighth trial.

Comparison 1 Vitamin D versus placebo or no intervention, Outcome 1 All‐cause mortality in trials with low or high risk of bias.

Comparison 1 Vitamin D versus placebo or no intervention, Outcome 2 All‐cause mortality in individually randomised and cluster‐randomised trials.

Comparison 1 Vitamin D versus placebo or no intervention, Outcome 3 All‐cause mortality in placebo‐controlled and no intervention trials.

Comparison 1 Vitamin D versus placebo or no intervention, Outcome 4 All‐cause mortality and risk of industry bias.

Comparison 1 Vitamin D versus placebo or no intervention, Outcome 5 All‐cause mortality in primary and secondary prevention trials.

Comparison 1 Vitamin D versus placebo or no intervention, Outcome 6 All‐cause mortality and vitamin D status.

Comparison 1 Vitamin D versus placebo or no intervention, Outcome 7 All‐cause mortality in ambulatory and institutionalised participants.

Comparison 1 Vitamin D versus placebo or no intervention, Outcome 8 All‐cause mortality ('best‐worst case' and 'worst‐best case' scenario).

Comparison 1 Vitamin D versus placebo or no intervention, Outcome 9 All‐cause mortality in trials using vitamin D3 (cholecalciferol).

Comparison 1 Vitamin D versus placebo or no intervention, Outcome 10 All‐cause mortality in trials using vitamin D3 singly or combined with calcium.

Comparison 1 Vitamin D versus placebo or no intervention, Outcome 11 All‐cause mortality in trials using low or high dose of vitamin D3.

Comparison 1 Vitamin D versus placebo or no intervention, Outcome 12 All‐cause mortality in trials applying vitamin D3 daily or intermittently.

Comparison 1 Vitamin D versus placebo or no intervention, Outcome 13 All‐cause mortality in trials using vitamin D3 and vitamin D status.

Comparison 1 Vitamin D versus placebo or no intervention, Outcome 14 All‐cause mortality in trials using vitamin D3 according to the participant's sex.

Comparison 1 Vitamin D versus placebo or no intervention, Outcome 15 All‐cause mortality in trials using vitamin D2 (ergocalciferol).

Comparison 1 Vitamin D versus placebo or no intervention, Outcome 16 All‐cause mortality in trials using vitamin D2 singly or combined with calcium.

Comparison 1 Vitamin D versus placebo or no intervention, Outcome 17 All‐cause mortality in trials using low or high dose of vitamin D2.

Comparison 1 Vitamin D versus placebo or no intervention, Outcome 18 All‐cause mortality in trials applying vitamin D2 daily or intermittently.

Comparison 1 Vitamin D versus placebo or no intervention, Outcome 19 All‐cause mortality in trials using vitamin D2 and vitamin D status.

Comparison 1 Vitamin D versus placebo or no intervention, Outcome 20 All‐cause mortality in trials using alfacalcidol (1α‐hydroxyvitamin D).

Comparison 1 Vitamin D versus placebo or no intervention, Outcome 21 All‐cause mortality in trials using alfacalcidol and vitamin D status.

Comparison 1 Vitamin D versus placebo or no intervention, Outcome 22 All‐cause mortality in trials using calcitriol (1,25‐dihydroxyvitamin D).

Comparison 1 Vitamin D versus placebo or no intervention, Outcome 23 All‐cause mortality in trials using calcitriol and vitamin D status.

Comparison 1 Vitamin D versus placebo or no intervention, Outcome 24 Cancer mortality.

Comparison 1 Vitamin D versus placebo or no intervention, Outcome 25 Cardiovascular mortality.

Comparison 1 Vitamin D versus placebo or no intervention, Outcome 26 Adverse events.
| Vitamin D supplementation for prevention of mortality in adults | ||||||
| Population: adults | ||||||
| Outcomes | Illustrative comparative risks* (95% CI) | Relative effect | No of participants | Quality of the evidence | Comments | |
| Assumed risk | Corresponding risk | |||||
| Placebo or no intervention | Vitamin D | |||||
| All‐cause mortality in trials using vitamin D3 (Follow‐up: 0.08 to 7 years) | Study population | RR 0.94 | 75,927 | ⊕⊕⊕⊝ moderatea | Trial sequential analysis of all trials irrespective of bias risks showed that the required information size had not yet been reached and that the cumulative Z‐curve crossed the trial sequential monitoring boundary for benefit. If this is correct, the intervention effect corresponds to a number needed to treat for a beneficial outcome (NNTB) of 150 participants over five years to save one additional life | |
| 114 per 1000 | 107 per 1000 | |||||
| Moderate risk | ||||||
| 46 per 1000 | 43 per 1000 | |||||
| Cardiovascular mortality in trials using vitamin D3 (cholecalciferol) (Follow‐up: 0.31 to 6.2 years) | Study population | RR 0.98 | 47,267 | ⊕⊕⊝⊝ lowb | Trial sequential analysis showed that the cumulative Z‐curve did not cross the conventional monitoring boundary for benefit. The required information size was 2,539,845 participants | |
| 42 per 1000 | 41 per 1000 | |||||
| Moderate risk | ||||||
| 13 per 1000 | 11 per 1000 | |||||
| Cancer mortality in trials using vitamin D3 (cholecalciferol) (Follow‐up: 5 to 7 years) | Study population | RR 0.88 | 44,492 | ⊕⊕⊕⊝ moderatea | Trial sequential analysis showed that the cumulative Z‐curve did not cross the conventional monitoring boundary for benefit. The required information size was 66,724 participants | |
| 29 per 1000 | 25 per 1000 | |||||
| Moderate risk | ||||||
| 21 per 1000 | 19 per 1000 | |||||
| Adverse events: nephrolithiasis in trials using vitamin D3 combined with calcium (Follow‐up: 1.25 to 7 years) | Study population | RR 1.17 | 42,876 | ⊕⊕⊕⊝ | ||
| 18 per 1000 | 21 per 1000 | |||||
| Moderate risk | ||||||
| 9 per 1000 | 11 per 1000 | |||||
| Adverse events: hypercalcaemia in trials using the active forms of vitamin D (alfacalcidol and calcitriol) (Follow‐up: 0.75 to 3 years) | Study population | RR 3.18 | 710 | ⊕⊕⊝⊝ | ||
| 23 per 1000 | 72 per 1000 | |||||
| Moderate risk | ||||||
| 11 per 1000 | 15 per 1000 | |||||
| Health‐related quality of life (Follow‐up: 0.38 years) | See comment | See comment | Not estimable | 105 (1) | See comment | Insufficient information: significant worsening in disease‐specific quality of life in the vitamin D2 group compared with the placebo group was reported. The between‐group difference at 20 weeks was 5.3 (0.5 to 10.2), and the minimally important difference (MID) is estimated to be 5 points in either direction |
| Health economics (Follow‐up: 4 years) | See comment | See comment | Not estimable | 3270 (1) | See comment | Insufficient information: authors reported that vitamin D3 and calcium supplementation prevented 46 hip fractures in every 1000 women treated |
| *The basis for the assumed risk (e.g. the median control group risk across studies) is provided in footnotes. The corresponding risk (and its 95% confidence interval) is based on the assumed risk in the comparison group and the relative effect of the intervention (and its 95% CI). | ||||||
| GRADE Working Group grades of evidence | ||||||
| aDowngraded by one level because of risk of attrition bias | ||||||
| Characteristic Study ID | Design | Arms | Bias | Blinding | Participants | Women | Mean |
| Aloia 2005 | Parallel | 2 | Low | PL | 208 | 100 | 60 |
| Avenell 2004 | 2 × 2 | 4 | High | NI | 134 | 83 | 77 |
| Avenell 2012 | 2 × 2 | 4 | Low | PL | 5292 | 85 | 77 |
| Baeksgaard 1998 | Parallel | 3 | High | PL | 240 | 100 | 62.5 |
| Bischoff 2003 | Parallel | 2 | High | PL | 122 | 100 | 85.3 |
| Bjorkman 2007 | Parallel | 3 | Low | PL | 218 | 82 | 84.5 |
| Bolton‐Smith 2007 | 2 × 2 | 4 | Low | PL | 244 | 100 | 68 |
| Brazier 2005 | Parallel | 2 | High | PL | 192 | 100 | 74.6 |
| Broe 2007 | Parallel | 5 | Low | PL | 124 | 73 | 89 |
| Brohult 1973 | Parallel | 2 | High | PL | 50 | 68 | 52 |
| Burleigh 2007 | Parallel | 2 | Low | PL | 205 | 59 | 83 |
| Campbell 2005 | 2 × 2 | 4 | High | NI | 391 | 68 | 83.6 |
| Chapuy 1992 | Parallel | 2 | High | PL | 3270 | 100 | 84 |
| Chapuy 2002 | Parallel | 3 | High | PL | 610 | 100 | 85 |
| Chel 2008 | Parallel | 6 | High | PL | 338 | 77 | 84 |
| Cherniack 2011 | Parallel | 2 | High | PL | 46 | 2 | 80 |
| Cooper 2003 | Parallel | 2 | Low | PL | 187 | 100 | 56 |
| Corless 1985 | Parallel | 2 | High | PL | 65 | 78 | 82.4 |
| Daly 2008 | Parallel | 2 | High | NI | 167 | 0 | 61.9 |
| Dawson‐Hughes 1997 | Parallel | 2 | Low | PL | 389 | 55 | 71 |
| Dukas 2004 | Parallel | 2 | Low | PL | 378 | 51 | 71 |
| Flicker 2005 | Parallel | 2 | Low | PL | 625 | 95 | 83.4 |
| Gallagher 2001 | 2 × 2 | 4 | Low | PL | 489 | 100 | 71.5 |
| Glendenning 2012 | Parallel | 2 | Low | PL | 686 | 100 | 76.7 |
| Grady 1991 | Parallel | 2 | High | PL | 98 | 54 | 79.1 |
| Grimnes 2011 | Parallel | 2 | Low | PL | 104 | 49 | 52 |
| Harwood 2004 | Parallel | 4 | High | NI | 150 | 100 | 81.2 |
| Jackson 2006 | Parallel | 2 | Low | PL | 36,282 | 100 | 62.4 |
| Janssen 2010 | Parallel | 2 | Low | PL | 70 | 100 | 80.8 |
| Komulainen 1999 | 2 × 2 | 4 | Low | PL | 464 | 100 | 52.7 |
| Krieg 1999 | Parallel | 2 | High | NI | 248 | 100 | 84.5 |
| Kärkkäinen 2010 | Parallel | 2 | High | NI | 3139 | 100 | 67 |
| Lappe 2007 | Parallel | 3 | High | PL | 1179 | 100 | 66.7 |
| Larsen 2004 | 2 × 2 | 4 | High | NI | 9605 | 60 | 75 |
| Latham 2003 | 2 × 2 | 4 | Low | PL | 243 | 53 | 79.5 |
| Law 2006 | Parallel | 2 | High | NI | 3717 | 76 | 85 |
| Lehouck 2012 | Parallel | 2 | Low | PL | 181 | 20 | 68 |
| Lips 1996 | Parallel | 2 | Low | PL | 2578 | 74 | 80 |
| Lips 2010 | Parallel | 2 | Low | PL | 226 | NR | 78 |
| Lyons 2007 | Parallel | 2 | Low | PL | 3440 | 76 | 84 |
| Meier 2004 | Parallel | 2 | High | NI | 55 | 65 | 56.5 |
| Mochonis 2006 | Parallel | 3 | High | NI | 112 | 100 | 60.3 |
| Ooms 1995 | Parallel | 2 | Low | PL | 348 | 100 | 80.3 |
| Ott 1989 | Parallel | 2 | High | PL | 86 | 100 | 67.5 |
| Porthouse 2005 | Parallel | 2 | High | NI | 3314 | 100 | 76.8 |
| Prince 2008 | Parallel | 2 | Low | PL | 302 | 100 | 77.2 |
| Sanders 2010 | Parallel | 2 | Low | PL | 2258 | 100 | 76.0 |
| Sato 1997 | Parallel | 2 | High | PL | 64 | 45 | 68.5 |
| Sato 1999a | Parallel | 2 | High | PL | 86 | 78 | 70.6 |
| Sato 1999b | Parallel | 3 | High | NI | 103 | 56 | 70.7 |
| Sato 2005a | Parallel | 2 | Low | PL | 96 | 100 | 74.1 |
| Schleithoff 2006 | Parallel | 2 | Low | PL | 123 | 17 | 51 |
| Smith 2007 | Parallel | 2 | Low | PL | 9440 | 54 | 79.1 |
| Trivedi 2003 | Parallel | 2 | Low | PL | 2686 | 24 | 74.7 |
| Witham 2010 | Parallel | 2 | Low | PL | 105 | 34 | 79.7 |
| Zhu 2008 | Parallel | 3 | Low | PL | 120 | 100 | 75 |
| NI: no intervention; NR: not reported; PL: placebo | |||||||
| Characteristic Study ID | Participants | Outcome Measures | Country | Sponsor |
| Aloia 2005 | Black postmenopausal African‐American women | Bone mineral density | USA | No |
| Avenell 2004 | Elderly people with an osteoporotic fracture within the past 10 years | Recruitment, compliance and retention within a randomised trial | UK | Yes |
| Avenell 2012 | Elderly people with low‐trauma osteoporotic fracture in the previous 10 years | Fractures | UK | Yes |
| Baeksgaard 1998 | Postmenopausal women | Bone mineral density | Denmark | Yes |
| Bischoff 2003 | Elderly women living in institutional care | Falls | Switzerland | Yes |
| Bjorkman 2007 | Chronically bedridden patients | Parathyroid function and bone mineral density | Finland | Yes |
| Bolton‐Smith 2007 | Elderly non‐osteoporotic women | Bone mineral density | UK | Yes |
| Brazier 2005 | Elderly vitamin D–insufficient women | Bone mineral density | France | Yes |
| Broe 2007 | Nursing home residents | Falls | USA | Yes |
| Brohult 1973 | Patients with rheumatoid arthritis | Objective and subjective improvement | Sweden | Yes |
| Burleigh 2007 | Older geriatric inpatients | Falls | UK | Yes |
| Campbell 2005 | Elderly people with visual impairment | Numbers of falls and injuries resulting from falls | New Zealand | No |
| Chapuy 1992 | Healthy ambulatory women | Fractures | France | Yes |
| Chapuy 2002 | Elderly people living in institutional care | Biochemical variables of calcium homeostasis, femoral neck bone mineral density and hip | France | Yes |
| Chel 2008 | Nursing home residents | Vitamin D status | Netherlands | Yes |
| Cherniack 2011 | Elderly people | Vitamin D status | USA | Yes |
| Cooper 2003 | Postmenopausal women | Bone mineral density | Australia | Yes |
| Corless 1985 | Elderly patients from the geriatric wards | Abilities to carry out basic activities of daily life | UK | Yes |
| Daly 2008 | Healthy ambulatory men | Bone mineral density | Australia | Yes |
| Dawson‐Hughes 1997 | Healthy ambulatory participants | Bone mineral density | USA | Yes |
| Dukas 2004 | Elderly people | Falls | Switzerland | Yes |
| Flicker 2005 | Elderly people living in institutional care | Falls and fractures | Australia | No |
| Gallagher 2001 | Elderly women | Bone mineral density | USA | No |
| Glendenning 2012 | Elderly community‐dwelling ambulatory women | Falls, muscular strength and mobility | Australia | No |
| Grady 1991 | Elderly people | Muscle strength | USA | Yes |
| Grimnes 2011 | Healthy people with a low vitamin D status | Insulin sensitivity and secretion | Norway | No |
| Harwood 2004 | Elderly women following surgery for hip fracture | Bone mineral density, falls and fractures | UK | Yes |
| Jackson 2006 | Postmenopausal women | Fractures | USA | Yes |
| Janssen 2010 | Elderly vitamin D–insufficient women | Muscle strength, power and functional mobility | Netherlands | Yes |
| Komulainen 1999 | Postmenopausal women | Bone mineral density | Finland | Yes |
| Krieg 1999 | Elderly institutionalised women | Bone mineral density | Switzerland | Yes |
| Kärkkäinen 2010 | Postmenopausal women | Falls | Finland | Yes |
| Lappe 2007 | Healthy postmenopausal white women | Fractures | USA | Yes |
| Larsen 2004 | Older community‐dwelling residents | Falls | Denmark | Yes |
| Latham 2003 | Frail elderly people | Self‐rated physical health and falls | New Zealand | No |
| Law 2006 | Nursing home residents | Falls and fractures | UK | No |
| Lehouck 2012 | Patients with chronic obstructive pulmonary disease | Time to first exacerbation | Belgium | Yes |
| Lips 1996 | Elderly people | Fractures | Netherlands | Yes |
| Lips 2010 | Elderly people with vitamin D insufficiency | Postural stability, muscle strength and safety | Netherlands | No |
| Lyons 2007 | Older people living in institutional care | Fractures | UK | No |
| Meier 2004 | Healthy volunteers | Bone mineral density | Germany | No |
| Mochonis 2006 | Postmenopausal women | Bone mineral density | Greece | Yes |
| Ooms 1995 | Elderly people | Bone mineral density | Netherlands | Yes |
| Ott 1989 | Postmenopausal women | Bone mass | USA | Yes |
| Porthouse 2005 | Elderly women with one or more risk factors for hip fracture | Fractures | UK | Yes |
| Prince 2008 | Elderly women with a history of falling and vitamin D insufficiency | Falls | Australia | Yes |
| Sanders 2010 | Elderly women at high risk of fracture | Falls and fractures | Australia | Yes |
| Sato 1997 | Outpatients with hemiplegia after stroke | Bone mineral density and fractures | Japan | No |
| Sato 1999a | Elderly patients with Parkinson's disease | Fractures | Japan | No |
| Sato 1999b | Outpatients with hemiplegia after stroke | Bone mineral density | Japan | Yes |
| Sato 2005a | Hospitalised elderly women with post‐stroke hemiplegia | Falls | Japan | No |
| Schleithoff 2006 | Patients with congestive heart failure | Mortality | Germany | Yes |
| Smith 2007 | Elderly people | Fractures | UK | No |
| Trivedi 2003 | Elderly people | Mortality, fractures | UK | No |
| Witham 2010 | Patients with systolic heart failure | Exercise capacity | UK | No |
| Zhu 2008 | Elderly women | Bone mineral density | Australia | No |
| Characteristic Study ID | D3 | D2 | 1α(OH)D | 1,25(OH)2D | Ca | Regimen | Route | Treatment | Follow‐up |
| Aloia 2005 | 800 |
|
|
| 1200‐1500a | Daily | Oral | 3 | 3 |
| Avenell 2004 | 800 |
|
|
| 1000b | Daily | Oral | 1 | 1 |
| Avenell 2012 | 800 |
|
|
| 500b | Daily | Oral | 3.75 | 6.2 |
| Baeksgaard 1998 | 560 |
|
|
| 1000 | Daily | Oral | 2 | 2 |
| Bischoff 2003 | 800 |
|
|
| 1200a | Daily | Oral | 0.25 | 0.25 |
| Bjorkman 2007 | 400 |
|
|
| 500a | Daily | Oral | 0.5 | 0.5 |
| Bolton‐Smith 2007 | 400 |
|
|
| 1000 | Daily | Oral | 2 | 2 |
| Brazier 2005 | 800 |
|
|
| 1000 | Daily | Oral | 1 | 1 |
| Broe 2007 |
| 200 |
|
|
| Daily | Oral | 0.42 | 0.42 |
| Brohult 1973 | 100,000 | Daily | Oral | 1 | 1 | ||||
| Burleigh 2007 | 800 |
|
|
| 1200a | Daily | Oral | 0.08 | 0.08 |
| Campbell 2005 | 50,000 100,000 |
|
|
|
| Monthly | Oral | 1 | 1 |
| Chapuy 1992 | 800 |
|
|
| 1200 | Daily | Oral | 1.5 | 4 |
| Chapuy 2002 | 800 |
|
|
| 1200 | Daily | Oral | 2 | 2 |
| Chel 2008 | 600 |
|
|
| 800 | Daily | Oral | 0.33 | 0.33 |
| Cherniack 2011 | 2000 | 1200a | Daily | Oral | 0.5 | 0.5 | |||
| Cooper 2003 |
| 10,000 |
|
| 1000a | Weekly | Oral | 2 | 2 |
| Corless 1985 |
| 9000 |
|
|
| Daily | Oral | 0.75 | 0.75 |
| Daly 2008 | 800 |
|
|
| 1000 | Daily | Oral | 2 | 3.5 |
| Dawson‐Hughes 1997 | 700 |
|
|
| 500 | Daily | Oral | 3 | 3 |
| Dukas 2004 |
|
| 1 |
|
| Daily | Oral | 0.75 | 0.75 |
| Flicker 2005 |
| 1000 |
|
| 600a | Daily | Oral | 2 | 2 |
| Gallagher 2001 |
|
|
| 0.5 |
| Daily | Oral | 3 | 5 |
| Glendenning 2012 | 150,000 | Three‐monthly | Oral | 0.5 | 0.75 | ||||
| Grady 1991 |
|
|
| 0.5 |
| Daily | Oral | 0.5 | 0.5 |
| Grimnes 2011 | 20,000 | Twice weekly | Oral | 0.5 | 0.5 | ||||
| Harwood 2004 | 800 | 300,000 |
|
| 1000 | Single dose | Intramuscular Oral | 1 | 1 |
| Jackson 2006 | 400 |
|
|
| 1000 | Daily | Oral | 7 | 7 |
| Janssen 2010 | 400 | 500a | Daily | Oral | 0.5 | 0.5 | |||
| Komulainen 1999 | 300 |
|
|
| 500 | Daily | Oral | 5 | 5 |
| Krieg 1999 | 880 |
|
|
| 1000 | Daily | Oral | 2 | 2 |
| Kärkkäinen 2010 | 800 |
|
|
| 1000 | Daily | Oral | 3 | 3 |
| Lappe 2007 | 1000 |
|
|
| 1400‐1500b | Daily | Oral | 4 | 4 |
| Larsen 2004 | 400 |
|
|
| 1000 | Daily | Oral | 3.5 | 3.5 |
| Latham 2003 | 300,000 |
|
|
|
| Single dose | Oral | 0.003 | 0.5 |
| Law 2006 |
| 100,000 |
|
|
| Four‐monthly | Oral | 0.83 | 0.83 |
| Lehouck 2012 | 100,000 | Monthly | Oral | 1 | 1 | ||||
| Lips 1996 | 400 |
|
|
|
| Daily | Oral | 3.5 | 3.5 |
| Lips 2010 | 8400 | 500a | weekly | Oral | 0.31 | 0.31 | |||
| Lyons 2007 |
| 100,000 |
|
|
| Four‐monthly | Oral | 3 | 3 |
| Meier 2004 | 500 |
|
|
| 500 | Daily | Oral | 0.5 | 1 |
| Mochonis 2006 | 300 |
|
|
| 1200b | Daily | Oral | 1 | 1 |
| Ooms 1995 | 400 |
|
|
|
| Daily | Oral | 2 | 2 |
| Ott 1989 |
|
|
| 0.5 | 1000a | Daily | Oral | 2 | 2 |
| Porthouse 2005 | 800 |
|
|
| 1000 | Daily | Oral | 2 | 2 |
| Prince 2008 |
| 1000 |
|
| 1000a | Daily | Oral | 1 | 1 |
| Sanders 2010 | 500,000 | Yearly | Oral | 2.96 | 2.96 | ||||
| Sato 1997 |
|
| 1 |
| 300a | Daily | Oral | 0.5 | 0.5 |
| Sato 1999a |
|
| 1 |
|
| Daily | Oral | 1.5 | 1.5 |
| Sato 1999b |
|
| 1 |
|
| Daily | Oral | 1 | 1 |
| Sato 2005a |
| 1000 |
|
|
| Daily | Oral | 2 | 2 |
| Schleithoff 2006 | 2000 |
|
|
| 500a | Daily | Oral | 0.75 | 1.25 |
| Smith 2007 |
| 300,000 |
|
|
| Yearly | Intramuscular | 3 | 3 |
| Trivedi 2003 | 100,000 |
|
|
|
| Four‐monthly | Oral | 5 | 5 |
| Witham 2010 | 100,000 |
|
|
| 10‐weekly | Oral | 0.38 | 0.38 | |
| Zhu 2008 |
| 1000 |
|
| 1200b | Daily | Oral | 5 | 5 |
| aEqual dose of calcium was administered to a control group | |||||||||
| Characteristic Study ID | Intervention(s) and control(s) | [N] screened / eligible | [N] randomised | [N] ITT | [N] finishing study | [%] of randomised participants |
| 1. Aloia 2005 | I: vitamin D3 plus calcium | 322 | 104 | 104 | 74 | 71 |
| C: placebo | 104 | 104 | 74 | 71 | ||
| total: | 208 | 208 | 148 | 71 | ||
| 2. Avenell 2004 | I: vitamin D3 | 180 | 70 | 70 | ‐ | ‐ |
| C: no intervention | 64 | 64 | ‐ | ‐ | ||
| total: | 134 | 134 | ‐ | ‐ | ||
| 3. Avenell 2012 | I: vitamin D3 | 15,024 | 2649 | 2649 | 1813 | 68 |
| C: matched placebo tablets | 2643 | 2643 | 1762 | 67 | ||
| total: | 5292 | 5292 | 3575 | 68 | ||
| 4. Baeksgaard 1998 | I: vitamin D3 plus calcium | ‐ | 80 | 80 | 65 | 81 |
| C: matched placebo tablets | 80 | 80 | 64 | 80 | ||
| total: | 160 | 160 | 129 | 80 | ||
| 5. Bischoff 2003 | I: vitamin D3 plus calcium | 130 | 62 | 62 | ‐ | ‐ |
| C: calcium | 60 | 60 | ‐ | ‐ | ||
| total: | 122 | 122 | 89 | 73 | ||
| 6. Bjorkman 2007 | I: vitamin D3 plus calcium | 1215 | 150 | 150 | 123 | 82 |
| C: calcium | 68 | 68 | 59 | 87 | ||
| total: | 218 | 218 | 182 | 83 | ||
| 7. Bolton‐Smith 2007 | I: vitamin D3 plus calcium | ‐ | 62 | 62 | 50 | 81 |
| C: matched placebo | 61 | 61 | 56 | 92 | ||
| total: | 123 | 123 | 106 | 86 | ||
| 8. Brazier 2005 | I: vitamin D3 plus calcium | 360 | 95 | 95 | 74 | 78 |
| C: matched placebo tablets | 97 | 97 | 68 | 70 | ||
| total: | 192 | 192 | 142 | 74 | ||
| 9. Broe 2007 | I: vitamin D2 | 126 | 99 | 99 | 96 | 97 |
| C: matched placebo tablets | 25 | 25 | 25 | 100 | ||
| total: | 124 | 124 | 121 | 98 | ||
| 10. Brohult 1973 | I: vitamin D3 | ‐ | 25 | 25 | 24 | 96 |
| C: placebo | 25 | 25 | 25 | 100 | ||
| total: | 50 | 50 | 49 | 98 | ||
| 11. Burleigh 2007 | I: vitamin D3 plus calcium | 515 | 101 | 101 | 98 | 97 |
| C: placebo | 104 | 104 | 101 | 97 | ||
| total: | 205 | 205 | 199 | 97 | ||
| 12. Campbell 2005 | I: home safety assessment and modification programme | 391 | 195 | 195 | 177 | 91 |
| C: social visits | 196 | 196 | 184 | 94 | ||
| total: | 391 | 391 | 361 | 92 | ||
| 13. Chapuy 1992 | I: vitamin D3 plus calcium | ‐ | 1634 | 1634 | 1590 | 97 |
| C: double placebo | 1636 | 1636 | 1573 | 96 | ||
| total: | 3270 | 3270 | 3163 | 96 | ||
| 14. Chapuy 2002 | I: vitamin D3 plus calcium | 639 | 393 | 393 | ‐ | ‐ |
| C: double placebo | 190 | 190 | ‐ | ‐ | ||
| total: | 583 | 583 | ‐ | ‐ | ||
| 15. Chel 2008 | I: vitamin D3 | 1006 | 166 | 166 | 139 | 84 |
| C: matched placebo tablets | 172 | 172 | 137 | 80 | ||
| total: | 338 | 338 | 276 | 82 | ||
| 16. Cherniack 2011 | I: vitamin D3 plus calcium | 52 | 23 | 23 | 17 | 74 |
| C: matched placebo plus calcium | 23 | 23 | 17 | 74 | ||
| total: | 46 | 46 | 34 | 74 | ||
| 17. Cooper 2003 | I: vitamin D2 plus calcium | ‐ | 93 | 93 | 73 | 78 |
| C: calcium | 94 | 94 | 80 | 85 | ||
| total: | 187 | 187 | 153 | 82 | ||
| 18. Coreless 1985 | I: vitamin D2 | 320 | 32 | 32 | 8 | 25 |
| C: placebo | 33 | 33 | 17 | 51 | ||
| total: | 65 | 65 | 25 | 38 | ||
| 19. Daly 2006 | I: calcium‐vitamin D3–fortified milk plus calcium | 422 | 85 | 85 | 76 | 89 |
| C: no intervention | 82 | 82 | 73 | 89 | ||
| total: | 167 | 167 | 149 | 89 | ||
| 20. Dawson‐Hughes 1997 | I: vitamin D3 plus calcium | 545 | 187 | 187 | 148 | 79 |
| C: placebo | 202 | 202 | 170 | 84 | ||
| total: | 389 | 389 | 318 | 82 | ||
| 21. Dukas 2004 | I: alfacalcidol | 410 | 192 | 192 | ‐ | ‐ |
| C: placebo | 186 | 186 | ‐ | ‐ | ||
| total: | 378 | 378 | ‐ | ‐ | ||
| 22. Flicker 2005 | I: vitamin D3 plus calcium | 1767 | 313 | 313 | 269 | 86 |
| C: calcium | 312 | 312 | 271 | 87 | ||
| total: | 625 | 625 | 540 | 86 | ||
| 23. Gallagher 2001 | I: calcitriol | 1905 | 123 | 123 | 101 | 82 |
| C: matched placebo | 123 | 123 | 112 | 91 | ||
| total: | 246 | 246 | 213 | 87 | ||
| 24. Glendenning 2012 | I: cholecalciferol 150,000 three‐monthly | 2110 | 353 | 353 | 331 | 94 |
| C: placebo vitamin D | 333 | 333 | 307 | 92 | ||
| total: | 686 | 686 | 638 | 93 | ||
| 25. Grady 1991 | I: calcitriol | 98 | 50 | 50 | 49 | 98 |
| C: placebo vitamin D | 48 | 48 | 47 | 98 | ||
| total: | 98 | 98 | 96 | 98 | ||
| 26. Grimnes 2011 | I: vitamin D3 | 108 | 51 | 51 | 49 | 96 |
| C: placebo | 53 | 53 | 45 | 85 | ||
| total: | 104 | 104 | 94 | 90 | ||
| 27. Harwood 004 | I: vitamin D plus calcium | 208 | 113 | 113 | ‐ | ‐ |
| C: no intervention | 37 | 37 | ‐ | ‐ | ||
| total: | 150 | 150 | ‐ | ‐ | ||
| 28. Jackson 2006 | I: vitamin D3 plus calcium | 68,132 | 18,176 | 18,176 | 16,936 | 93 |
| C: matched placebo | 18,106 | 18,106 | 16,815 | 93 | ||
| total: | 36,282 | 36,282 | 33,751 | 93 | ||
| 29. Janssen 2010 | I: vitamin D3 plus calcium | 91 | 36 | 36 | 18 | 50 |
| C: matched placebo vitamin D3 plus calcium | 34 | 34 | 31 | 91 | ||
| total: | 70 | 70 | 49 | 70 | ||
| 30. Komulainen 1999 | I: oestradiol valerate and cyproterone acetate | 13,100 | 116 | 116 | ‐ | ‐ |
| C: placebo | 116 | 116 | ‐ | ‐ | ||
| total: | 232 | 232 | ‐ | ‐ | ||
| 31. Krieg 1999 | I: vitamin D3 plus calcium | ‐ | 124 | 124 | 50 | 40 |
| C: no treatment | 124 | 124 | 53 | 43 | ||
| total: | 248 | 248 | 103 | 41 | ||
| 32. Kärkkäinen 2010 | I: vitamin D3 plus calcium | 5407 | 1718 | 1718 | 1566 | 91 |
| C: no treatment | 1714 | 1714 | 1573 | 92 | ||
| total: | 3432 | 3432 | 3139 | 91 | ||
| 33. Lappe 2007 | I: vitamin D3 plus calcium | 1180 | 446 | 446 | ‐ | ‐ |
| C: calcium plus placebo tablets | 733 | 733 | ‐ | ‐ | ||
| total: | 1179 | 1179 | ‐ | ‐ | ||
| 34. Larsen 2004 | I: home safety inspection, vitamin D3 plus calcium | 62,000 | 4957 | 4957 | ‐ | ‐ |
| C: no intervention | 4648 | 4648 | ‐ | ‐ | ||
| total: | 9605 | 9605 | ‐ | ‐ | ||
| 35. Latham 2003 | I: vitamin D3 | 3,028 | 121 | 121 | 108 | 89 |
| C: matched placebo tablets | 122 | 122 | 114 | 93 | ||
| total: | 243 | 243 | 222 | 91 | ||
| 36. Law 2006 | I: vitamin D2 | ‐ | 1762 | 1762 | 1366 | 77 |
| C: no intervention | 1955 | 1955 | 1569 | 80 | ||
| total: | 3717 | 3717 | 2935 | 79 | ||
| 37. Lehouck 2012 | I: vitamin D3 | 419 | 91 | 91 | 72 | 79 |
| C: matched placebo | 91 | 91 | 78 | 86 | ||
| total: | 182 | 182 | 150 | 82 | ||
| 38. Lips 1996 | I: vitamin D3 | ‐ | 1291 | 1291 | 1061 | 82 |
| C: matched placebo | 1287 | 1287 | 1029 | 80 | ||
| total: | 2578 | 2578 | 2090 | 81 | ||
| 39. Lips 2010 | I: vitamin D3 | 593 | 114 | 114 | 105 | 92 |
| C: matched placebo | 112 | 112 | 97 | 87 | ||
| total: | 226 | 226 | 202 | 89 | ||
| 40. Lyons 2007 | I: vitamin D2 | 5745 | 1725 | 1725 | 778 | 45 |
| C: matched placebo tablets | 1715 | 1715 | 762 | 44 | ||
| total: | 3440 | 3440 | 1540 | 44 | ||
| 41. Meier 2004 | I: vitamin D3 | ‐ | 30 | 30 | 27 | 90 |
| C: no intervention | 25 | 25 | 16 | 64 | ||
| total: | 55 | 55 | 43 | 78 | ||
| 42. Mochonis 2006 | I: vitamin D3 plus calcium | ‐ | 72 | 72 | 65 | 90 |
| C: no intervention | 40 | 40 | 36 | 90 | ||
| total: | 112 | 112 | 101 | 90 | ||
| 43. Ooms 1995 | I: vitamin D3 | ‐ | 177 | 177 | 126 | 71 |
| C: matched placebo | 171 | 171 | 118 | 69 | ||
| total: | 348 | 348 | 244 | 70 | ||
| 44. Ott 1989 | I: vitamin D3 plus calcium | ‐ | 43 | 43 | 39 | 91 |
| C: matched placebo vitamin D plus calcium | 43 | 43 | 37 | 86 | ||
| total: | 86 | 86 | 76 | 88 | ||
| 45. Porthouse 2005 | I: vitamin D3 plus calcium | 11,022 | 1321 | 1321 | 1212 | 92 |
| C: no intervention | 1993 | 1993 | 1862 | 93 | ||
| total: | 3454 | 3454 | 3074 | 92 | ||
| 46. Prince 2008 | I: vitamin D2 plus calcium | 827 | 151 | 151 | 144 | 95 |
| C: matched placebo tablets of vitamin D plus calcium | 151 | 151 | 145 | 96 | ||
| total: | 302 | 302 | 289 | 95 | ||
| 47. Sanders 2010 | I: vitamin D3 | 7204 | 1131 | 1131 | 1015 | 90 |
| C: matched placebo tablets | 1127 | 1127 | 1017 | 90 | ||
| total: | 2258 | 2258 | 1032 | 90 | ||
| 48. Sato 1997 | I: vitamin D (alfacalcidol) plus calcium | ‐ | 45 | 45 | 30 | 67 |
| C: matched placebo tablets of vitamin D and calcium | 39 | 39 | 34 | 87 | ||
| total: | 84 | 84 | 64 | 76 | ||
| 49. Sato 1999a | I: vitamin D (alfacalcidol) | ‐ | 43 | 43 | 40 | 93 |
| C: matched placebo tablets of vitamin D | 43 | 43 | 40 | 93 | ||
| total: | 86 | 86 | 80 | 93 | ||
| 50. Sato 1999b | I: vitamin D (alfacalcidol) | ‐ | 34 | 34 | 32 | 94 |
| C: matched placebo tablet of vitamin D | 35 | 35 | 32 | 91 | ||
| total: | 69 | 69 | 64 | 93 | ||
| 51. Sato 2005a | I: vitamin D2 | ‐ | 48 | 48 | 43 | 90 |
| C: matched placebo tablets of vitamin D | 48 | 48 | 42 | 87 | ||
| total: | 96 | 96 | 85 | 88 | ||
| 52. Schleithoff 2006 | I: vitamin D3 plus calcium | ‐ | 61 | 61 | 42 | 69 |
| C: matched placebo vitamin D plus calcium | 62 | 62 | 51 | 82 | ||
| total: | 103 | 103 | 93 | 90 | ||
| 53. Smith 2007 | I: vitamin D2 | 13,487 | 4727 | 4727 | 2304 | 49 |
| C: matched placebo intramuscular injection | 4713 | 4713 | 2266 | 48 | ||
| total: | 9440 | 9440 | 4570 | 48 | ||
| 54. Trivedi 2003 | I: vitamin D3 | ‐ | 1345 | 1345 | 1262 | 94 |
| C: matched placebo vitamin D | 1341 | 1341 | 1264 | 94 | ||
| total: | 2696 | 2696 | 2526 | 94 | ||
| 55. Witham 2010 | I: vitamin D2 | 173 | 53 | 53 | 48 | 91 |
| C: matched placebo tablets | 52 | 52 | 48 | 91 | ||
| total: | 105 | 105 | 96 | 91 | ||
| 56. Zhu 2008 | I: vitamin D2 plus calcium | ‐ | 39 | 39 | 33 | 85 |
| C: matched placebo vitamin D and calcium | 81 | 81 | 74 | 91 | ||
| total: | 120 | 120 | 107 | 89 | ||
| Grand total | All interventions | 47,472 | 45,351 | |||
| All controls | 47,814 | 45,278 | ||||
| All interventions and controls | 95,286 | 90,629a | ||||
| "‐" denotes not reported aNumbers not available for all studies C: control; I: intervention; ITT: intention‐to‐treat | ||||||
| Outcome or subgroup title | No. of studies | No. of participants | Statistical method | Effect size |
| 1 All‐cause mortality in trials with low or high risk of bias Show forest plot | 56 | 95286 | Risk Ratio (M‐H, Random, 95% CI) | 0.97 [0.94, 0.99] |
| 1.1 Trials with low risk of bias | 30 | 67516 | Risk Ratio (M‐H, Random, 95% CI) | 0.96 [0.92, 0.99] |
| 1.2 Trials with high risk of bias | 26 | 27770 | Risk Ratio (M‐H, Random, 95% CI) | 0.99 [0.92, 1.06] |
| 2 All‐cause mortality in individually randomised and cluster‐randomised trials Show forest plot | 56 | 95286 | Risk Ratio (M‐H, Random, 95% CI) | 0.97 [0.94, 0.99] |
| 2.1 Individually randomised trials | 54 | 81964 | Risk Ratio (M‐H, Random, 95% CI) | 0.96 [0.93, 0.99] |
| 2.2 Cluster‐randomised trials | 2 | 13322 | Risk Ratio (M‐H, Random, 95% CI) | 1.05 [0.82, 1.34] |
| 3 All‐cause mortality in placebo‐controlled and no intervention trials Show forest plot | 56 | 95286 | Risk Ratio (M‐H, Random, 95% CI) | 0.97 [0.94, 0.99] |
| 3.1 Placebo in the control group | 44 | 73892 | Risk Ratio (M‐H, Random, 95% CI) | 0.96 [0.93, 0.99] |
| 3.2 No intervention in the control group | 12 | 21394 | Risk Ratio (M‐H, Random, 95% CI) | 1.05 [0.91, 1.21] |
| 4 All‐cause mortality and risk of industry bias Show forest plot | 56 | 95286 | Risk Ratio (M‐H, Random, 95% CI) | 0.97 [0.94, 0.99] |
| 4.1 Trials without risk of industry bias | 7 | 7372 | Risk Ratio (M‐H, Random, 95% CI) | 0.97 [0.92, 1.03] |
| 4.2 Trials with risk of industry bias | 49 | 87914 | Risk Ratio (M‐H, Random, 95% CI) | 0.96 [0.93, 1.00] |
| 5 All‐cause mortality in primary and secondary prevention trials Show forest plot | 56 | 95286 | Risk Ratio (M‐H, Random, 95% CI) | 0.97 [0.94, 0.99] |
| 5.1 Primary prevention trials | 48 | 94491 | Risk Ratio (M‐H, Random, 95% CI) | 0.97 [0.94, 0.99] |
| 5.2 Secondary prevention trials | 8 | 795 | Risk Ratio (M‐H, Random, 95% CI) | 1.31 [0.73, 2.35] |
| 6 All‐cause mortality and vitamin D status Show forest plot | 56 | 95286 | Risk Ratio (M‐H, Random, 95% CI) | 0.97 [0.94, 0.99] |
| 6.1 Vitamin D insufficiency | 26 | 56697 | Risk Ratio (M‐H, Random, 95% CI) | 0.95 [0.91, 0.99] |
| 6.2 Vitamin D adequacy | 19 | 16283 | Risk Ratio (M‐H, Random, 95% CI) | 0.95 [0.87, 1.05] |
| 6.3 Unknown vitamin D status | 11 | 22306 | Risk Ratio (M‐H, Random, 95% CI) | 1.02 [0.92, 1.13] |
| 7 All‐cause mortality in ambulatory and institutionalised participants Show forest plot | 56 | 95286 | Risk Ratio (M‐H, Random, 95% CI) | 0.97 [0.94, 0.99] |
| 7.1 Ambulatory participants | 45 | 86071 | Risk Ratio (M‐H, Random, 95% CI) | 0.95 [0.92, 0.98] |
| 7.2 Institutionalised participants | 11 | 9215 | Risk Ratio (M‐H, Random, 95% CI) | 1.02 [0.92, 1.13] |
| 8 All‐cause mortality ('best‐worst case' and 'worst‐best case' scenario) Show forest plot | 53 | Risk Ratio (M‐H, Random, 95% CI) | Subtotals only | |
| 8.1 'Best‐worst' case scenario | 53 | 84418 | Risk Ratio (M‐H, Random, 95% CI) | 0.40 [0.32, 0.51] |
| 8.2 'Worst‐best' case scenario | 53 | 84418 | Risk Ratio (M‐H, Random, 95% CI) | 2.78 [2.13, 3.63] |
| 9 All‐cause mortality in trials using vitamin D3 (cholecalciferol) Show forest plot | 38 | 75927 | Risk Ratio (M‐H, Random, 95% CI) | 0.94 [0.91, 0.98] |
| 9.1 Vitamin D3 trials with low risk of bias | 20 | 52645 | Risk Ratio (M‐H, Random, 95% CI) | 0.93 [0.89, 0.98] |
| 9.2 Vitamin D3 trials with high risk of bias | 18 | 23282 | Risk Ratio (M‐H, Random, 95% CI) | 0.95 [0.91, 1.00] |
| 10 All‐cause mortality in trials using vitamin D3 singly or combined with calcium Show forest plot | 38 | Risk Ratio (M‐H, Random, 95% CI) | Subtotals only | |
| 10.1 Vitamin D3 singly | 13 | 12609 | Risk Ratio (M‐H, Random, 95% CI) | 0.92 [0.85, 1.00] |
| 10.2 Vitamin D3 combined with calcium | 27 | 63051 | Risk Ratio (M‐H, Random, 95% CI) | 0.96 [0.92, 0.99] |
| 11 All‐cause mortality in trials using low or high dose of vitamin D3 Show forest plot | 38 | Risk Ratio (M‐H, Random, 95% CI) | Subtotals only | |
| 11.1 Low dose of vitamin D3 (< 800 IU a day) | 13 | 50437 | Risk Ratio (M‐H, Random, 95% CI) | 0.92 [0.87, 0.97] |
| 11.2 High dose of vitamin D3 (≥ 800 IU a day) | 26 | 25558 | Risk Ratio (M‐H, Random, 95% CI) | 0.96 [0.92, 1.00] |
| 12 All‐cause mortality in trials applying vitamin D3 daily or intermittently Show forest plot | 38 | Risk Ratio (M‐H, Random, 95% CI) | Subtotals only | |
| 12.1 Vitamin D3 daily | 31 | 69168 | Risk Ratio (M‐H, Random, 95% CI) | 0.95 [0.91, 0.98] |
| 12.2 Vitamin D3 intermittently | 8 | 6871 | Risk Ratio (M‐H, Random, 95% CI) | 0.89 [0.77, 1.03] |
| 13 All‐cause mortality in trials using vitamin D3 and vitamin D status Show forest plot | 38 | 75927 | Risk Ratio (M‐H, Random, 95% CI) | 0.94 [0.91, 0.98] |
| 13.1 Vitamin D insufficiency | 20 | 55883 | Risk Ratio (M‐H, Random, 95% CI) | 0.95 [0.91, 0.99] |
| 13.2 Vitamin D adequacy | 10 | 4979 | Risk Ratio (M‐H, Random, 95% CI) | 0.92 [0.80, 1.07] |
| 13.3 Unknown vitamin D status | 8 | 15065 | Risk Ratio (M‐H, Random, 95% CI) | 0.95 [0.78, 1.16] |
| 14 All‐cause mortality in trials using vitamin D3 according to the participant's sex Show forest plot | 38 | 75927 | Risk Ratio (M‐H, Random, 95% CI) | 0.94 [0.91, 0.98] |
| 14.1 Vitamin D3 trialsincluding only women | 19 | 53062 | Risk Ratio (M‐H, Random, 95% CI) | 0.93 [0.84, 1.03] |
| 14.2 Vitamin D3 trials including men and women | 19 | 22865 | Risk Ratio (M‐H, Random, 95% CI) | 0.94 [0.89, 0.98] |
| 15 All‐cause mortality in trials using vitamin D2 (ergocalciferol) Show forest plot | 12 | 18349 | Risk Ratio (M‐H, Random, 95% CI) | 1.02 [0.96, 1.08] |
| 15.1 Vitamin D2 trials with low risk of bias | 9 | 14439 | Risk Ratio (M‐H, Random, 95% CI) | 0.98 [0.93, 1.04] |
| 15.2 Vitamin D2 trials with high risk of bias | 3 | 3910 | Risk Ratio (M‐H, Random, 95% CI) | 1.20 [1.05, 1.37] |
| 16 All‐cause mortality in trials using vitamin D2 singly or combined with calcium Show forest plot | 12 | Risk Ratio (M‐H, Random, 95% CI) | Subtotals only | |
| 16.1 Vitamin D2 singly | 8 | 17079 | Risk Ratio (M‐H, Random, 95% CI) | 1.03 [0.96, 1.12] |
| 16.2 Vitamin D2 combined with calcium | 5 | 1307 | Risk Ratio (M‐H, Random, 95% CI) | 1.00 [0.64, 1.57] |
| 17 All‐cause mortality in trials using low or high dose of vitamin D2 Show forest plot | 12 | Risk Ratio (M‐H, Random, 95% CI) | Subtotals only | |
| 17.1 Low dose of vitamin D2 | 1 | 101 | Risk Ratio (M‐H, Random, 95% CI) | 0.82 [0.17, 3.98] |
| 17.2 High dose of vitamin D2 | 12 | 18273 | Risk Ratio (M‐H, Random, 95% CI) | 1.02 [0.95, 1.10] |
| 18 All‐cause mortality in trials applying vitamin D2 daily or intermittently Show forest plot | 12 | Risk Ratio (M‐H, Random, 95% CI) | Subtotals only | |
| 18.1 Vitamin D2 daily | 6 | 1349 | Risk Ratio (M‐H, Random, 95% CI) | 0.88 [0.68, 1.12] |
| 18.2 Vitamin D2 intermittently | 6 | 17000 | Risk Ratio (M‐H, Random, 95% CI) | 1.06 [0.95, 1.18] |
| 19 All‐cause mortality in trials using vitamin D2 and vitamin D status Show forest plot | 12 | 18349 | Risk Ratio (M‐H, Random, 95% CI) | 1.02 [0.96, 1.08] |
| 19.1 Vitamin D insufficiency | 6 | 4413 | Risk Ratio (M‐H, Random, 95% CI) | 1.20 [1.05, 1.37] |
| 19.2 Vitamin D adequacy | 5 | 10496 | Risk Ratio (M‐H, Random, 95% CI) | 0.97 [0.86, 1.10] |
| 19.3 Unknown vitamin D status | 1 | 3440 | Risk Ratio (M‐H, Random, 95% CI) | 0.99 [0.93, 1.05] |
| 20 All‐cause mortality in trials using alfacalcidol (1α‐hydroxyvitamin D) Show forest plot | 4 | 617 | Risk Ratio (M‐H, Random, 95% CI) | 0.96 [0.22, 4.15] |
| 21 All‐cause mortality in trials using alfacalcidol and vitamin D status Show forest plot | 4 | 617 | Risk Ratio (M‐H, Random, 95% CI) | 0.96 [0.22, 4.15] |
| 21.1 Vitamin D insufficiency | 2 | 155 | Risk Ratio (M‐H, Random, 95% CI) | 1.01 [0.11, 9.52] |
| 21.2 Vitamin D adequacy | 1 | 378 | Risk Ratio (M‐H, Random, 95% CI) | 0.97 [0.06, 15.37] |
| 21.3 Unknown vitamin D status | 1 | 84 | Risk Ratio (M‐H, Random, 95% CI) | 0.87 [0.06, 13.40] |
| 22 All‐cause mortality in trials using calcitriol (1,25‐dihydroxyvitamin D) Show forest plot | 3 | 430 | Risk Ratio (M‐H, Random, 95% CI) | 1.37 [0.27, 7.03] |
| 23 All‐cause mortality in trials using calcitriol and vitamin D status Show forest plot | 3 | 430 | Risk Ratio (M‐H, Random, 95% CI) | 1.37 [0.27, 7.03] |
| 23.1 Vitamin D insufficiency | 1 | 86 | Risk Ratio (M‐H, Random, 95% CI) | 0.33 [0.01, 7.96] |
| 23.2 Vitamin D adequacy | 2 | 344 | Risk Ratio (M‐H, Random, 95% CI) | 2.28 [0.34, 15.39] |
| 24 Cancer mortality Show forest plot | 4 | 44492 | Risk Ratio (M‐H, Random, 95% CI) | 0.88 [0.78, 0.98] |
| 25 Cardiovascular mortality Show forest plot | 10 | 47267 | Risk Ratio (M‐H, Random, 95% CI) | 0.98 [0.90, 1.07] |
| 26 Adverse events Show forest plot | 35 | Risk Ratio (M‐H, Random, 95% CI) | Subtotals only | |
| 26.1 Hypercalcemia in trials using supplemental forms of vitamin D | 15 | 11323 | Risk Ratio (M‐H, Random, 95% CI) | 1.36 [0.85, 2.18] |
| 26.2 Hypercalcemia in trials using active forms of vitamin D | 3 | 710 | Risk Ratio (M‐H, Random, 95% CI) | 3.18 [1.17, 8.68] |
| 26.3 Nephrolithiasis in trials using vitamin D3 combined with calcium | 4 | 42876 | Risk Ratio (M‐H, Random, 95% CI) | 1.17 [1.02, 1.34] |
| 26.4 Nephrolithiasis in trials using calcitriol | 1 | 246 | Risk Ratio (M‐H, Random, 95% CI) | 0.33 [0.01, 8.10] |
| 26.5 Hypercalciuria | 3 | 695 | Risk Ratio (M‐H, Random, 95% CI) | 4.64 [0.99, 21.76] |
| 26.6 Renal insufficiency | 3 | 5495 | Risk Ratio (M‐H, Random, 95% CI) | 1.70 [0.27, 10.70] |
| 26.7 Cardiovascular disorders | 8 | 4495 | Risk Ratio (M‐H, Random, 95% CI) | 0.95 [0.86, 1.05] |
| 26.8 Gastrointestinal disorders | 16 | 9702 | Risk Ratio (M‐H, Random, 95% CI) | 1.36 [0.87, 2.13] |
| 26.9 Psychiatric disorders | 3 | 580 | Risk Ratio (M‐H, Random, 95% CI) | 1.44 [0.56, 3.73] |
| 26.10 Skin disorders | 2 | 3810 | Risk Ratio (M‐H, Random, 95% CI) | 3.27 [0.17, 62.47] |
| 26.11 Cancer | 14 | 49707 | Risk Ratio (M‐H, Random, 95% CI) | 0.99 [0.94, 1.06] |