Scolaris Content Display Scolaris Content Display

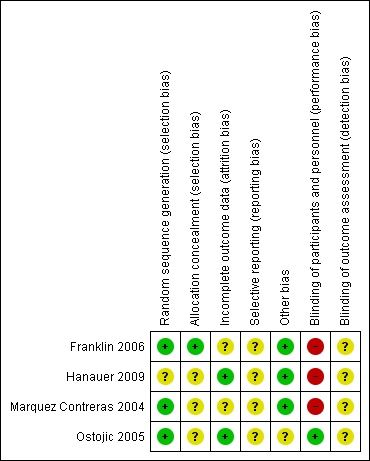
Risk of bias summary: review authors' judgements about each risk of bias item for each included study.
Figuras y tablas -
Figure 1

Risk of bias summary: review authors' judgements about each risk of bias item for each included study.

Comparison 1 Health outcomes, Outcome 1 Diabetes ‐ Glycaemic control (HbA1c).
Figuras y tablas -
Analysis 1.1

Comparison 1 Health outcomes, Outcome 1 Diabetes ‐ Glycaemic control (HbA1c).

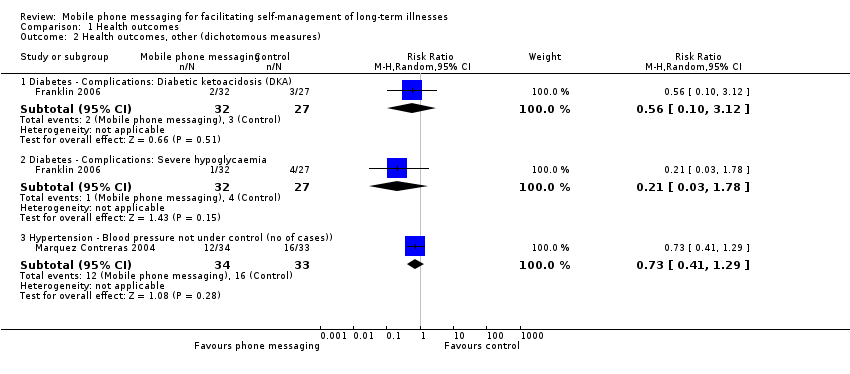
Comparison 1 Health outcomes, Outcome 2 Health outcomes, other (dichotomous measures).
Figuras y tablas -
Analysis 1.2

Comparison 1 Health outcomes, Outcome 2 Health outcomes, other (dichotomous measures).

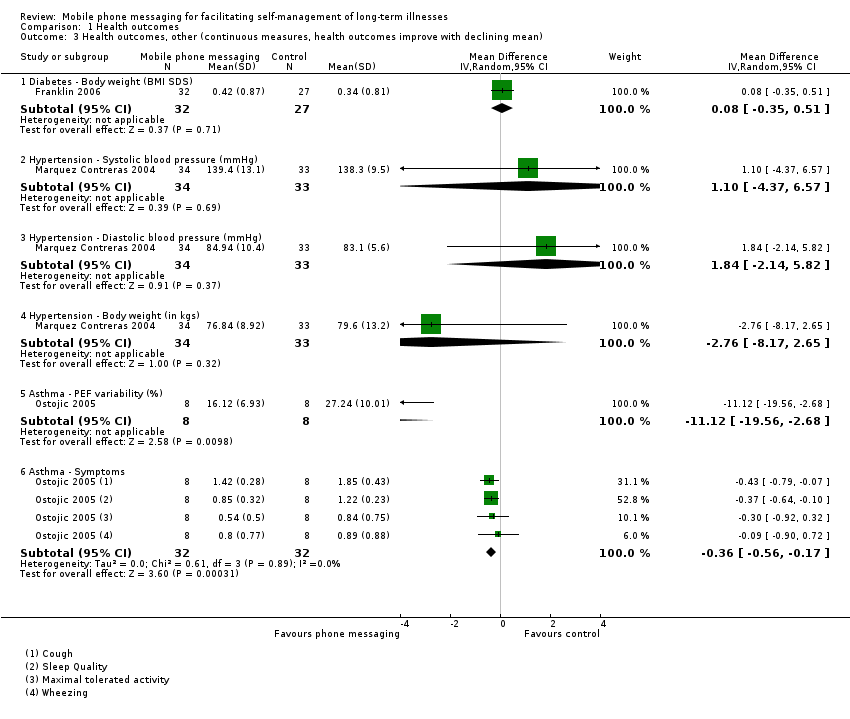
Comparison 1 Health outcomes, Outcome 3 Health outcomes, other (continuous measures, health outcomes improve with declining mean).
Figuras y tablas -
Analysis 1.3

Comparison 1 Health outcomes, Outcome 3 Health outcomes, other (continuous measures, health outcomes improve with declining mean).

Comparison 1 Health outcomes, Outcome 4 Health outcomes, other (continuous measures, health outcomes improve with increasing mean).
Figuras y tablas -
Analysis 1.4

Comparison 1 Health outcomes, Outcome 4 Health outcomes, other (continuous measures, health outcomes improve with increasing mean).

Comparison 2 Capacity to self‐manage the condition, Outcome 1 Knowledge and management of diabetes.
Figuras y tablas -
Analysis 2.1

Comparison 2 Capacity to self‐manage the condition, Outcome 1 Knowledge and management of diabetes.

Comparison 2 Capacity to self‐manage the condition, Outcome 2 Treatment compliance.
Figuras y tablas -
Analysis 2.2

Comparison 2 Capacity to self‐manage the condition, Outcome 2 Treatment compliance.

Comparison 3 Health service utilisation, Outcome 1 Diabetes ‐ Clinic visit.
Figuras y tablas -
Analysis 3.1

Comparison 3 Health service utilisation, Outcome 1 Diabetes ‐ Clinic visit.

Comparison 3 Health service utilisation, Outcome 2 Diabetes ‐ Hotline contact.
Figuras y tablas -
Analysis 3.2

Comparison 3 Health service utilisation, Outcome 2 Diabetes ‐ Hotline contact.

Study

Outcome

Mobile phone (n=8)

Control (n=8)

Ostojic 2005

Hospitalisations

2

7

Ostojic 2005

Office visits

21

15

Figuras y tablas -
Analysis 3.3

Comparison 3 Health service utilisation, Outcome 3 Asthma ‐ Utilisation.

Summary of findings for the main comparison. Mobile phone messaging for facilitating self‐management of long‐term illnesses

Patient or population: Patients with long‐term illnesses
Settings:  Outpatient services in Scotland, USA, Spain and Croatia
Intervention: Mobile phone messaging support for self‐management of diabetes, asthma or hypertension

Comparison: Usual care, or usual care with self‐management support delivered by email

Outcomes

Impact

No of Participants
(studies)

Quality of the evidence
(GRADE)

Health outcomes: Glycaemic control (HbA1c)

One study found no statistical difference on glycaemic control between groups receiving the intervention or usual care. The other study found mobile phone messaging no more effective than email reminders in achieving glycaemic control. Overall, mean pooled glycaemic control (HbA1C) for the control groups was 9.9 (SD 1.5). In the text messaging groups this was 0.15 units lower (0.77 lower to 0.47 higher).

88
(2 studies)

⊕⊕⊕⊝
moderate1

Health outcomes: Variety of measures

For diabetes and hypertension no statistically significant differences were found between the intervention and control groups on body mass index, weight or blood pressure. For asthma a significant improvement in the text messaging group was found for only 2 out of 4 outcome measures, that is peak expiratory flow variability and pooled symptom score.

142

(3 studies)

⊕⊕⊕⊝
moderate2

Capacity to self‐manage the condition:

Management and knowledge of diabetes

Patients receiving text messaging support showed significantly improved scores on the Self‐Efficacy for Diabetes test and the Diabetes Social Support Interview. It did not, however, result in improved knowledge of diabetes.

59

(1 study)

⊕⊕⊕⊝
moderate1


Capacity to self‐manage the condition:

Treatment compliance

Medication compliance in hypertension patients was 8.9% higher (0.18% higher to 17.62% higher) in the text messaging group as compared with the control group. There were no statistically significant effects on compliance with peak expiratory flow (PEF) measurement for asthma patients, or on self‐reported adherence in young people with diabetes. Text message prompts for diabetes patients initially also resulted in a higher number of blood glucose results (46.0) sent back than email prompts (23.5) did.

142

(3 studies)

⊕⊕⊕⊝
moderate2

Participants' evaluation of the intervention

Patients receiving mobile phone messaging support reported improvement in self‐management of diabetes, wanted to continue receiving messages, and preferred mobile phone messaging to email as a method to access the Computerised Automated Reminder Diabetes System.

72

(2 studies)

⊕⊝⊝⊝
very low3

Health service utilisation

Diabetes patients receiving text messaging support made a comparable number of clinic visits and calls to an emergency hotline as patients without the support. For asthma patients, the total number of office visits was higher in the text messaging group, whereas the number of hospital admissions was higher for the control group.

75

(2 studies)

⊕⊝⊝⊝
very low4

*The corresponding risk (and its 95% confidence interval) is based on the assumed risk in the comparison group and the relative effect of the intervention (and its 95% CI).
CI: Confidence interval; RR: Risk ratio.

GRADE Working Group grades of evidence
High quality: Further research is very unlikely to change our confidence in the estimate of effect.
Moderate quality: Further research is likely to have an important impact on our confidence in the estimate of effect and may change the estimate.
Low quality: Further research is very likely to have an important impact on our confidence in the estimate of effect and is likely to change the estimate.
Very low quality: We are very uncertain about the estimate.

1 Number of participants is low in both studies on diabetes.

2 All included trials have a low number of participants.

3 The number of participants is low in both included trials. The outcomes are not compared between the intervention and control groups.

4 Both included trials have a low number of participants. The reasons for clinic or clinic visits and hospitalisations were not known, so the causal link between the intervention and the outcome measures is not clear.

Figuras y tablas -
Summary of findings for the main comparison. Mobile phone messaging for facilitating self‐management of long‐term illnesses
Comparison 1. Health outcomes

Outcome or subgroup title

No. of studies

No. of participants

Statistical method

Effect size

1 Diabetes ‐ Glycaemic control (HbA1c) Show forest plot

2

88

Mean Difference (IV, Random, 95% CI)

‐0.15 [‐0.77, 0.47]

2 Health outcomes, other (dichotomous measures) Show forest plot

2

Risk Ratio (M‐H, Random, 95% CI)

Subtotals only

2.1 Diabetes ‐ Complications: Diabetic ketoacidosis (DKA)

1

59

Risk Ratio (M‐H, Random, 95% CI)

0.56 [0.10, 3.12]

2.2 Diabetes ‐ Complications: Severe hypoglycaemia

1

59

Risk Ratio (M‐H, Random, 95% CI)

0.21 [0.03, 1.78]

2.3 Hypertension ‐ Blood pressure not under control (no of cases))

1

67

Risk Ratio (M‐H, Random, 95% CI)

0.73 [0.41, 1.29]

3 Health outcomes, other (continuous measures, health outcomes improve with declining mean) Show forest plot

3

Mean Difference (IV, Random, 95% CI)

Subtotals only

3.1 Diabetes ‐ Body weight (BMI SDS)

1

59

Mean Difference (IV, Random, 95% CI)

0.08 [‐0.35, 0.51]

3.2 Hypertension ‐ Systolic blood pressure (mmHg)

1

67

Mean Difference (IV, Random, 95% CI)

1.10 [‐4.37, 6.57]

3.3 Hypertension ‐ Diastolic blood pressure (mmHg)

1

67

Mean Difference (IV, Random, 95% CI)

1.84 [‐2.14, 5.82]

3.4 Hypertension ‐ Body weight (in kgs)

1

67

Mean Difference (IV, Random, 95% CI)

‐2.76 [‐8.17, 2.65]

3.5 Asthma ‐ PEF variability (%)

1

16

Mean Difference (IV, Random, 95% CI)

‐11.12 [‐19.56, ‐2.68]

3.6 Asthma ‐ Symptoms

1

64

Mean Difference (IV, Random, 95% CI)

‐0.36 [‐0.56, ‐0.17]

4 Health outcomes, other (continuous measures, health outcomes improve with increasing mean) Show forest plot

1

Mean Difference (IV, Random, 95% CI)

Subtotals only

4.1 Asthma ‐ Pulmonary function test (FEV1)

1

16

Mean Difference (IV, Random, 95% CI)

3.00 [‐15.91, 21.91]

4.2 Asthma ‐ Forced vital capacity (%)

1

16

Mean Difference (IV, Random, 95% CI)

‐1.37 [‐16.33, 13.59]

Figuras y tablas -
Comparison 1. Health outcomes
Comparison 2. Capacity to self‐manage the condition

Outcome or subgroup title

No. of studies

No. of participants

Statistical method

Effect size

1 Knowledge and management of diabetes Show forest plot

1

Mean Difference (IV, Random, 95% CI)

Subtotals only

1.1 Self‐efficacy for diabetes (SED)

1

59

Mean Difference (IV, Random, 95% CI)

6.10 [0.45, 11.75]

1.2 Diabetes social support interview (DSSI)

1

236

Mean Difference (IV, Random, 95% CI)

4.39 [2.85, 5.92]

1.3 Diabetes knowledge scale (DKS)

1

59

Mean Difference (IV, Random, 95% CI)

‐0.5 [‐1.60, 0.60]

2 Treatment compliance Show forest plot

3

Mean Difference (IV, Random, 95% CI)

Subtotals only

2.1 Hypertension ‐ Compliance with medication at six months

1

67

Mean Difference (IV, Random, 95% CI)

8.90 [0.18, 17.62]

2.2 Asthma ‐ Compliance with PEF measurement

1

16

Mean Difference (IV, Random, 95% CI)

4.90 [‐14.82, 24.62]

2.3 Diabetes adherence (Visual analogue score)

1

59

Mean Difference (IV, Random, 95% CI)

6.80 [‐2.58, 16.18]

Figuras y tablas -
Comparison 2. Capacity to self‐manage the condition
Comparison 3. Health service utilisation

Outcome or subgroup title

No. of studies

No. of participants

Statistical method

Effect size

1 Diabetes ‐ Clinic visit Show forest plot

1

59

Mean Difference (IV, Random, 95% CI)

0.30 [‐0.22, 0.82]

2 Diabetes ‐ Hotline contact Show forest plot

1

59

Risk Ratio (M‐H, Random, 95% CI)

0.32 [0.09, 1.08]

3 Asthma ‐ Utilisation Show forest plot

Other data

No numeric data

Figuras y tablas -
Comparison 3. Health service utilisation