Eficacia hipotensora de los betabloqueantes selectivos beta 1 en la hipertensión primaria
Resumen
Antecedentes
Los betabloqueantes se utilizan habitualmente para tratar la hipertensión. La lectura de la presión arterial es la herramienta primaria de los médicos y los pacientes para evaluar la eficacia del tratamiento. Se desconoce el efecto hipotensor de los bloqueantes selectivos beta 1.
Objetivos
Cuantificar los efectos relacionados con los diversos tipos y dosis de betabloqueantes de receptores adrenérgicos selectivos beta 1 sobre la presión arterial sistólica y diastólica versus placebo en personas con hipertensión primaria.
Métodos de búsqueda
Se realizaron búsquedas en la Database of Abstracts of Reviews of Effectiveness (DARE) para obtener revisiones relacionadas.
Se realizaron búsquedas en las siguientes bases de datos de estudios primarios: registro especializado del Grupo Cochrane de Hipertensión (Cochrane Hypertension Specialised Register) (todos los años hasta 15 octubre 2015), CENTRAL vía Registro Cochrane de Estudios en línea (Cochrane Register of Studies Online) (2015, número 10), Ovid MEDLINE (1946 hasta 15 octubre 2015), Ovid EMBASE (1974 hasta 15 octubre 2015) y en ClinicalTrials.gov (todos los años hasta 15 octubre 2015).
El registro especializado del Grupo de Hipertensión incluye ensayos controlados a partir de búsquedas en CAB Abstracts, CINAHL, Registro Cochrane Central de Ensayos Controlados (Cochrane Central Register of Controlled Trials), EMBASE, Food Science and Technology Abstracts (FSTA), Global Health, LILACS, MEDLINE, ProQuest Dissertations & Theses, PsycINFO, Web of Science y en la Plataforma de registros internacionales de ensayos clínicos (ICTRP) de la OMS.
Las búsquedas en las bases de datos electrónicas utilizaron una estrategia que se combinó con la Estrategia de Búsqueda Cochrane de Alta Sensibilidad para identificar ensayos aleatorios en MEDLINE: la versión maximizadora de la sensibilidad (revisión de 2008) con términos MeSH seleccionados y términos de texto libre. No se utilizaron restricciones de idioma. La estrategia de búsqueda en MEDLINE se adaptó a CENTRAL, EMBASE, el Registro Especializado del Grupo Cochrane de Hipertensión (Cochrane Hypertension Group) y ClinicalTrials.gov mediante el vocabulario controlado apropiado según correspondió. Las estrategias completas están en el Apéndice 1.
Criterios de selección
Ensayos aleatorizados, doble ciego, controlados con placebo, paralelos o cruzados (crossover). Los estudios debían contener un grupo de monoterapia con betabloqueantes a dosis fijas. Las personas incluidas en los estudios debían presentar hipertensión primaria al inicio. La duración de los estudios debía ser de entre tres y 12 semanas. Los fármacos de esta clase de betabloqueantes son: atenolol, betaxolol, bevantolol, bisoprolol, esmolol, metoprolol, nebivolol, pafenolol y practolol.
Obtención y análisis de los datos
Dos autores de la revisión confirmaron la inclusión de los estudios y extrajeron los datos de forma independiente. Se utilizó Review Manager (RevMan) 5.3.5 para sintetizar los datos.
Resultados principales
Se identificaron 56 ECA (ensayos controlados aleatorizados) que examinaron la eficacia de la disminución de la presión arterial (PA) de los bloqueantes selectivos beta 1 (bloqueante beta 1) en 7812 pacientes con hipertensión primaria. Entre los ensayos incluidos, 26 ECA fueron estudios paralelos y 30 ECA fueron estudios cruzados que examinaron ocho bloqueantes beta 1. En general, la mayoría de los bloqueantes beta 1 estudiados disminuyeron significativamente la presión arterial sistólica (PAS) y la presión arterial diastólica (PAD). En las personas con hipertensión leve a moderada, los bloqueantes selectivos beta 1 redujeron la PA en un promedio de ‐10/‐8 mmHg y redujeron la frecuencia cardíaca en 11 latidos por minuto. La reducción máxima de la PA de los bloqueantes beta 1 ocurrió a dos veces la dosis inicial. Los bloqueantes beta 1 individuales no mostraron un efecto gradual de dosis‐respuesta sobre la PAS y la PAD con el rango de dosis recomendado.
La mayoría de los bloqueantes beta 1 estudiados redujeron significativamente la frecuencia cardíaca. Fue evidente una dosis‐respuesta gradual de los bloqueantes beta 1 sobre la frecuencia cardíaca. Las dosis mayores de los bloqueantes beta 1 redujeron la frecuencia cardíaca más que las dosis inferiores. Individualmente y en general, los bloqueantes beta 1 no afectaron a la presión del pulso, lo que los distingue de otras clases de fármacos.
Conclusiones de los autores
Esta revisión aporta evidencia de calidad muy baja de que en las personas con hipertensión leve a moderada los bloqueantes selectivos beta 1 redujeron la PA en un promedio de ‐10/‐8 mmHg y redujeron la frecuencia cardíaca en 11 latidos por minuto en comparación con placebo. El efecto de los bloqueantes beta 1 en las horas con niveles máximos en sangre, ‐12/‐9 mmHg, fue mayor que la reducción en las horas con niveles mínimos, ‐8/‐7 mmHg. Los bloqueantes selectivos beta 1 redujeron la PA en una magnitud mayor que los betabloqueantes de receptores duales y los betabloqueantes agonistas parciales, y redujeron la PA de manera similar que los betabloqueantes no selectivos. Los bloqueantes selectivos beta 1 redujeron la PAS a un grado similar y redujeron la PAD a un grado mayor que los diuréticos, los inhibidores de la enzima convertidora de angiotensina y los bloqueantes de los receptores de angiotensina. Debido a que la PAD se redujo a un grado similar a la PAS, los bloqueantes selectivos beta 1 no reducen la presión del pulso.
PICO
Resumen en términos sencillos
Bloqueantes selectivos beta 1 para el tratamiento de la hipertensión
Antecedentes
Los bloqueantes selectivos beta 1 son una subclase de betabloqueantes que se utilizan habitualmente para tratar la hipertensión. Los fármacos de esta clase incluyen atenolol (Tenormin), metoprolol (Lopressor), nebivolol (Bystolic) y bisoprolol (Zebeta, Monocor). Se desarrolló una metodología integral para examinar cómo diferentes dosis y fármacos de esta clase de fármacos reducen la tensión arterial.
Características de los estudios incluidos
Se encontraron e incluyeron 56 ensayos clínicos que examinaron el efecto de la disminución de la tesión arterial de ocho bloqueantes beta 1 en 7812 personas con hipertensión. Estos participantes se asignaron al azar a recibir una dosis fija de tratamiento con bloqueante beta 1 o placebo durante tres a 12 semanas.
Resultados clave
De media, los bloqueantes beta 1 redujeron la PA en ‐10 puntos de la presión sistólica y ‐8 puntos de la presión diastólica en las personas con hipertensión leve a moderada. En general, las dosis mayores de los bloqueantes beta 1 no mostraron una mayor reducción de la tensión arterial en comparación con las dosis inferiores. La reducción máxima de la tensión arterial se mostró a dos veces la dosis inicial recomendada.
Las dosis mayores de bloqueantes beta 1 redujeron la frecuencia cardíaca más que las dosis inferiores, por lo que es más probable que provoquen el efecto secundario frecuente de enlentecer la frecuencia cardíaca. Los bloqueantes selectivos beta 1 reducen la PAS y diastólica a un grado similar, como ocurre con otras subclases de betabloqueantes, por lo que tienen un efecto pequeño o ningún efecto sobre la tensión del pulso. Este hecho difiere con respecto a otras clases de fármacos antihipertensivos como los diuréticos tiazidas, los inhibidores de la enzima convertidora de angiotensina y los bloqueantes de los receptores de angiotensina.
Calidad de la evidencia
La calidad de la evidencia se consideró baja debido a diversos tipos de sesgo que podrían exagerar el efecto. Una baja calificación de la evidencia significa que es probable que la realización de más estudios de investigación tenga una marcada repercusión sobre la confianza en la estimación del efecto y pueda cambiarla.
Authors' conclusions
Summary of findings
| Blood pressure lowering effects of beta‐1 blockers compared with placebo for primary hypertension | |||
| Patient or population: People with primary hypertension Intervention: Beta‐1 selective blockers Comparison: Placebo | |||
| Outcomes | mean estimates of combining 1x and 2x starting dose | No of Participants | Quality of the evidence |
| Systolic blood pressure | ‐10.4 (‐11.1, ‐9.7)1,2,3 | 5246 (47) | Low4,5 |
| Diastolic blood pressure | ‐8.3 (‐8.7, ‐7.8)1,2,3 | 5316 (48) | Low4,5 |
| Heart rate | ‐10.9 (‐11.5, ‐10.4)1,2 | 3407 (33) | Low4,5 |
| Pulse pressure | ‐1.8 [‐2.3, ‐1.2]1,2 | 5246 (47) | Very low4,5,6 |
| WDAE | 0.9 (0.5, 1.5) | 2618 (3) | Low7,8 |
| 95% CI: 95% confident interval; WDAE: Withdrawal due to adverse effect. | |||
| GRADE Working Group grades of evidence | |||
| Footnotes | |||
|
| |||
Background
Description of the condition
Elevated blood pressure (hypertension) is a highly prevalent condition that is associated with an increased risk of adverse cardiovascular events including stroke, myocardial infarction, congestive heart failure and renal failure. Antihypertensive drug treatment has been shown to reduce the incidence of these adverse events. There are a number of classes of antihypertensive drugs used to treat elevated blood pressure. Beta adrenergic receptor blockers (beta‐blockers) are one such class of drug.
Description of the intervention
Beta‐blockers were originally marketed and used to treat angina. During their use in people with angina, it was discovered that they also lowered blood pressure. Since then, they have received clinical attention because of their established effectiveness for certain arrhythmias and their known preventative action in people who have had a myocardial infarction.
Five previous systematic reviews are relevant to this proposed review. Wright 2000 assessed the mortality and morbidity associated with different types of beta blockers. He found that patients treated with non‐selective beta blockers, post myocardial infarction, significantly reduced total mortality as compared to placebo, whereas beta‐1 selective beta blockers or partial agonist beta‐blockers did not. A recent review assessed the effects of beta adrenergic blocking agents on morbidity and mortality in adults with hypertension (Wiysonge 2012). This review concluded that beta blockers were not the best class of drugs to use as first‐line antihypertensive therapy. However, it is possible that this related to beta‐1 selective beta blockers, as atenolol was the beta‐blocker used in 75% of the trials.
Three systematic reviews have assessed the effects of beta‐blockers on blood pressure. A Cochrane systematic review on beta blockers in hypertension during pregnancy (Magee 2003) showed that oral beta‐blockers decreased the incidence of severe hypertension and the need for additional antihypertensive therapy. A systematic review of the dose‐response blood pressure lowering effect of beta blocker drugs and other antihypertensive drugs (Law 2005) did not differentiate between the different classes of beta‐blockers. Finally, a systematic review of the blood pressure lowering efficacy of beta‐blockers given as a second‐line drug did not differentiate between the different classes of beta‐blockers (Chen 2010).
How the intervention might work
Beta adrenergic receptors are present in many peripheral body systems including the heart, blood vessels, kidneys, and nervous system. At the present time, the mechanism whereby beta‐blockers lower blood pressure is not known, though many hypothetical mechanisms have been proposed. Beta blockers could lower blood pressure by decreasing cardiac output, reducing renin production, modulating the sympathetic nervous system or other mechanisms. It is likely to be a combination of mechanisms that lead to the blood pressure lowering effect.
Beta‐blockers were designed to competitively inhibit beta‐receptors and thus modulate sympathetic nervous system activity. There are three main classes of beta‐receptors: beta‐1, beta‐2 and beta‐3. Beta‐1 (cardioselective) receptor blockers have a greater specificity to block beta‐1 receptors than beta‐2 receptors. However, this selectivity diminishes as the dose of the beta‐blocker increases. Drugs in this class have no intrinsic sympathomimetic activity (partial agonist) or alpha blocking effects. Beta‐1 adrenergic receptors are the predominant adrenergic receptor in the heart. Activation of beta‐1 receptors opens L‐type calcium channels through the cAMP/protein kinase A pathway. Opening of L‐type calcium channels allows calcium ions to flow into the cells and produce a positive inotropic and chronotropic effect (Kamp 2000). Blocking of beta‐1 receptors decreases heart rate and cardiac contractility. This effect could contribute to the antihypertensive effect of beta‐1 blockers (Westfall 2011).
Why it is important to do this review
Since it is probable that beta‐blockers with different mechanisms of action have different effects to reduce morbidity and mortality, it is crucial to determine whether they have different abilities to lower blood pressure. No published review has compared the blood pressure lowering effect of beta blockers based on their mechanism of action. If beta‐blockers with different beta receptor selectivity lower blood pressure differently, it would provide useful information towards understanding the mechanism by which they lower blood pressure.
Furthermore since blood pressure measurement is used on a daily basis by physicians managing people with high blood pressure, it is important to accurately assess the average magnitude of blood pressure lowering effects of beta blockers both individually and as sub‐classes. The findings of this review will be compared to the results of the Cochrane reviews of the other the subclasses of beta blockers: non‐selective beta blockers (Wong 2014a), partial agonist beta blockers (Wong 2014b) dual alpha and beta blockers (Wong 2015). The information found in this review will be useful for clinicians, researchers designing future drug trials and authors of other systematic reviews.
Objectives
Primary objective
To quantify the dose‐related effects of various doses and types of beta‐1 selective adrenergic receptor blockers on systolic and diastolic blood pressure versus placebo in people with primary hypertension.
Secondary objectives
-
To determine the effects of beta‐1 selective adrenergic receptor blockers on variability of blood pressure.
-
To determine the effects of beta‐1 selective adrenergic receptor blockers on pulse pressure.
-
To quantify the dose‐related effects of beta‐1 selective adrenergic receptor blockers on heart rate.
-
To quantify the effects of beta‐1 selective adrenergic receptor blockers at various doses on withdrawals due to adverse events.
Methods
Criteria for considering studies for this review
Types of studies
Study design must meet the following criteria:
-
placebo‐controlled;
-
random allocation to beta adrenergic receptor blocker group and placebo group;
-
parallel or cross‐over design;
-
double‐blinded;
-
duration of follow‐up of at least three weeks;
-
blood pressure measurements at baseline (following washout) and at one or more time points between 3 weeks to 12 weeks after starting treatment.
Types of participants
Participants had to have a baseline blood pressure of at least 140 mmHg systolic or a diastolic blood pressure of at least 90 mmHg, or both, measured in a standard way. Participants must not have had creatinine levels greater than 1.5 times the normal level. Participants were not restricted by age, gender, baseline risk or any other co‐morbid conditions.
Types of interventions
Monotherapy with any beta‐1 selective adrenergic receptor blocker, including atenolol, betaxolol, bevantolol, bisoprolol, esmolol, metoprolol and nebivolol, pafenolol, practolol.
Data from trials in which titration to a higher dose was based on blood pressure response were not eligible.
Types of outcome measures
Primary outcomes
Change in trough (13 hours to 26 hours after the dose) or peak (1 hour to 12 hours after the dose), or both, systolic and diastolic blood pressure compared to placebo. If blood pressure measurements were available at more than one time within the acceptable window, we used the mean differences (MD) of blood pressures taken in the 3 week to 12 week range.
Secondary outcomes
-
Change in standard deviation compared to placebo.
-
Change in pulse pressure compared to placebo.
-
Change in heart rate compared to placebo.
-
Number of participants who withdrew due to adverse events compared to placebo.
Search methods for identification of studies
Electronic searches
We searched the Hypertension Group Specialised Register, the Cochrane Central Register of Controlled Trials (CENTRAL) (2015 Issue 9), Ovid MEDLINE (1946 to October 2015), Ovid EMBASE (1974 to October 2015) and ClinicalTrials.gov (all years to October 2015) for randomised controlled trials. We searched the Database of Abstracts of Reviews of Effects (DARE) for related reviews (October 2015). No language restrictions were applied. The WHO International Clinical Trials Registry Platform (ICTRP) is searched for inclusion in the Group's Specialised Register.
We used a modified, expanded version of the standard search strategy of the Hypertension Group with additional terms related to beta adrenergic receptor blockers in general and all the specific drugs listed above to identify the relevant articles. The MEDLINE strategy was translated into CENTRAL, EMBASE, ClinicalTrials.gov, and the Hypertension Group Specialised Register (Appendix 1) .
Searching other resources
We used previously published meta‐analyses on dose‐response of beta adrenergic receptor blockers to help identify references to trials.
We searched the bibliographies of pertinent articles, reviews and texts for additional citations.
Data collection and analysis
Selection of studies
We performed the initial search of all the databases to identify citations with potential relevance. The initial screen of these abstracts excluded articles whose titles or abstracts, or both were clearly irrelevant. We retrieved the full text of the remaining articles and translated them into English where required. We imported the references and abstracts identified by our search into Reference Manager 11 software. Two independent reviewers assessed the eligibility of the trials using a trial selection form based on the criteria listed above. A third reviewer resolved discrepancies.
Data extraction and management
Two review authors independently extracted data using a standard form and then cross‐checked them. A second person confirmed all numeric calculations and graphic interpolations.
Assessment of risk of bias in included studies
We assessed the risk of bias with the standard Cochrane 'Risk of bias' tool (Higgins 2011a). The domains assessed included allocation sequence generation, allocation concealment, blinding of participants, personnel and outcome assessors, completeness of participant follow‐up, handling of incomplete outcome data and protection against selective outcome reporting.
Measures of treatment effect
The position of the patient during blood pressure measurement might affect the blood pressure reading or true lowering effect. However, in order not to lose valuable data, we used data reported from any single position, regardless of the position. When blood pressure measurement data were available from more than one position, sitting blood pressure was the first preference. If both standing and supine were available, we used standing blood pressure. We reported effect measures as the mean difference (MD) in BP, heart rate and pulse pressure between the treatment and placebo groups with 95% confidence interval (CI). We reported risk ratio (RR) for withdrawal due to adverse effects.
Dealing with missing data
In the case of missing information in the included studies, we contacted the investigators (using email, letter, fax or a combination) to obtain the missing information.
In the case of missing standard deviations (SD) of the change in blood pressure, we imputed the standard deviation, based on the information in the same study or from other studies using the same drug. We used the following hierarchy (listed from high to low preference) to impute standard deviation values:
-
standard deviation of change in blood pressure taken in a different position than that of the blood pressure data used;
-
standard deviation of blood pressure at the end of treatment;
-
standard deviation of blood pressure at the end of treatment measured in a different position than that of the blood pressure data used;
-
standard deviation of blood pressure at baseline (unless this measure was used for entry criteria);
-
mean standard deviation of change in blood pressure from other studies using the same drug.
Assessment of heterogeneity
We tested for heterogeneity of treatment effect between the trials using a standard Chi2 statistic for heterogeneity. We applied the fixed‐effect model to obtain summary statistics of pooled trials, unless significant between‐study heterogeneity was present, in which case we used the random‐effects model (Deeks 2011).
Data synthesis
We carried out data synthesis and analysis using the Cochrane Review Manager software, RevMan 5.3.5 (RevMan 2014).
We combined data for changes in blood pressure and heart rate using mean difference (MD). We analysed drop‐outs due to side effects by using risk ratio (RR). When we found statistically significant RR, we calculated risk difference (RD), and number needed to treat for an additional harmful outcome (NNTH).
When we used the generic inverse variance method to incorporate cross‐over studies into meta‐analysis, we used the formula listed in the Cochrane Handbook for Systematic Reviews of Interventions, section 16.4.6.1 (Higgins 2011b) to calculate the standard deviation of the difference between treatment and placebo. In order to minimise the loss of statistical power for the estimates we did not adjust the standard error and sample sizes shown in the 'Data and analyses' tables for subgroup comparisons. To avoid double counting of participants when comparing multiple subgroups or combining two subgroups for overall estimates, we adjusted the standard error or the sample size in analyses for studies containing multiple dosage subgroups.
Subgroup analysis and investigation of heterogeneity
If possible, subgroup analyses included:
-
different regimens of the same active chemical entity;
-
gender, age and race;
-
co‐morbid conditions: ischaemic heart disease, peripheral vascular disease, diabetes;
-
baseline severity of hypertension: mild, moderate, severe.
Sensitivity analysis
We tested the robustness of the results using several sensitivity analyses, including:
-
trials that were industry‐sponsored versus non‐industry sponsored;
-
trials with blood pressure data measured in the sitting position versus other measurement positions;
-
trials with reported standard deviations of blood pressure change versus imputed standard deviations.
Results
Description of studies
Results of the search
In order to save time and effort, the trial search coordinator from Cochrane Hypertension group developed a comprehensive search strategy (Appendix 1) so that all four subclasses of beta blockers were searched simultaneously. We used the same study inclusion criteria for the other three beta blocker reviews (Wong 2014a; Wong 2014b; Wong 2015). Citations were then sorted according to their respective subclasses afterward. Please refer to Figure 1 for the flow diagram of study selection.

PRISMA study flow diagram
The search was first run in May 2010, and subsequent searches have been performed up to October 2015. A total of 22,480 citations have been identified in all searches since May 2010, of which 8353 were confirmed to be duplicates. The reviewers then screened 14,127 titles and abstracts, of which 13,514 citations were excluded. We judged 613 citations to potentially meet the inclusion criteria based on title and abstract and retrieved them for detailed review. We excluded 498 full text articles which did not meet our inclusion criteria. One hundred and fifteen trials met our inclusion criteria for all four subclasses. In total, 56 trials were included in this review.
Included studies
We included 56 RCTs that examined the BP lowering efficacy of eight beta‐1 blockers in 7812 primary hypertensive patients. Twenty six RCTs were parallel studies and the other 30 RCTs were cross‐over studies with duration of treatment ranging from 3 weeks to 16 weeks. When study duration was longer than 12 weeks, we used only the data obtained between 3 weeks to 12 weeks. The mean baseline BP of the randomised participants in the studies was 155.6/101.1 mmHg. Please refer to Characteristics of included studies for details of included studies.
Excluded studies
We excluded one RCT that met the inclusion criteria because it reported data from non‐hypertensive participants mixed with hypertensive participants. This RCT was listed in the Characteristics of excluded studies.
Risk of bias in included studies
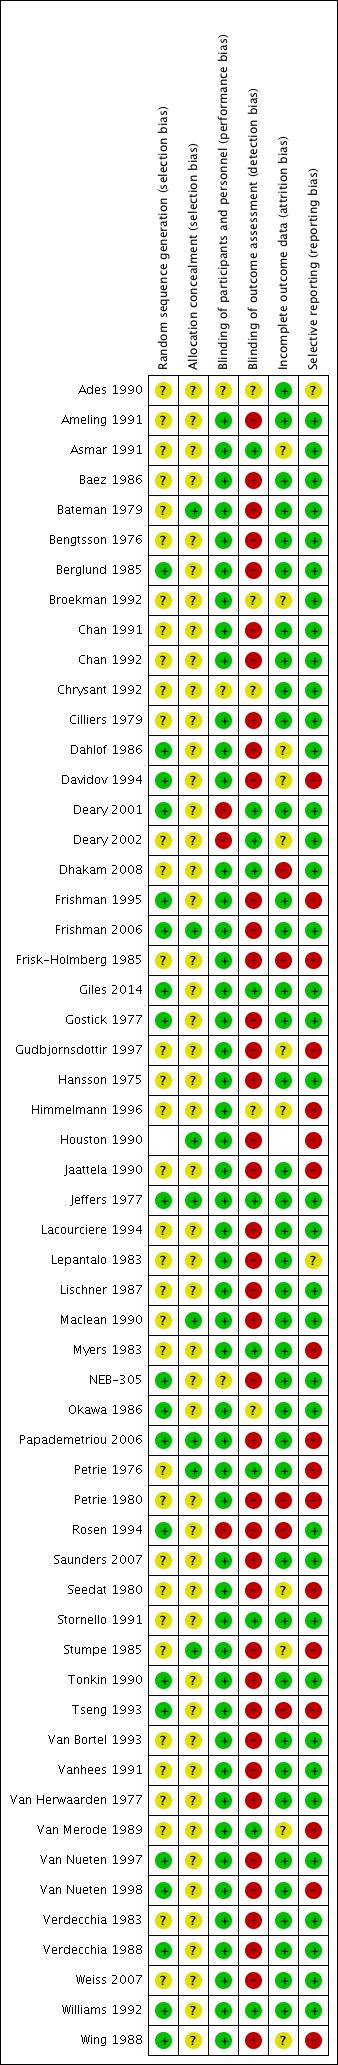
Figure 2 shows the 'Risk of bias' summary of each included study.

Risk of bias summary: review authors' judgements about each risk of bias item for each included study.
Allocation
Details regarding random sequence generation and allocation concealment were poorly reported in many of the included studies. This information was important in determining the potential of selection bias in this review. Because of poor reporting, it was difficult to judge the potential for selection bias. In the parallel studies, we examined the baseline characteristics of participants in each intervention group. We did not find any significant difference in baseline characteristics between the intervention groups which would raise concerns regarding selection bias. Hence, we did not find any evidence that suggested a high risk of selection bias in the parallel studies. It was impossible to assess whether randomisation was conducted properly in cross‐over studies, thus there is an unclear risk of selection bias in cross‐over trials.
Blinding
Beta blockers are well known for their ability to lower heart rate. The assessor could detect the difference in heart rate when measuring blood pressure. Using an automated machine to measure BP would mitigate this risk of detection bias. However this was not done in most of the included trials in this review. Therefore, the risk of detection and performance bias is high in this review.
Incomplete outcome data
Most of the studies reported the method by which they handled dropouts. The dropout rates were low and most of studies used an ITT analysis. Therefore, we judged that the risk of attrition bias in this review was low.
Selective reporting
All the studies included reported the SBP, DBP and heart rate as outcomes of the participants. Withdrawal due to adverse effects is an important outcome in clinical trials. Only two studies reported useful data on withdrawal due to adverse effects. The risk of reporting bias was high because most of the studies failed to report withdrawal due to adverse effects.
Other potential sources of bias
Funnel plots of the pooled data showed a paucity of small and less effective studies and positive outliers. The asymmetry of funnel plots indicated the high potential for publication bias (Sterne 2011). Some of the extreme outliers were large studies with a large effect that was questionable. It was not possible to prove that these trials were flawed, therefore we kept them in the review, however, they add to the suspicion of a high risk of bias. As a result, BP lowering estimates of the group combining the starting dose and twice the starting dose are likely to be overestimated.
Effects of interventions
See: Summary of findings for the main comparison
The primary outcomes and some key secondary outcomes are summarized in the summary of findings Table for the main comparison.
The results below are presented in descending order according to the sample size.
Blood pressure lowering efficacy of nebivolol
Nebivolol is a beta‐1 selective blocker which has been marketed in Canada since early 2013. Nebivolol is indicated for treatment of hypertension in Canada and the United States of America (USA) (eCPS; FDA). The recommended doses of nebivolol are 5 mg to 20 mg daily (eCPS). Twelve RCTs examining the blood pressure lowering efficacy of 1 mg to 40 mg per day nebivolol in 3209 hypertensive participants were included in this review. Eight of them were parallel studies and the other four were cross‐over studies. In addition, NEB‐305 was an unpublished RCT from an FDA report. The mean baseline BP of the participants in the included studies was 154.6/100.4 mmHg.
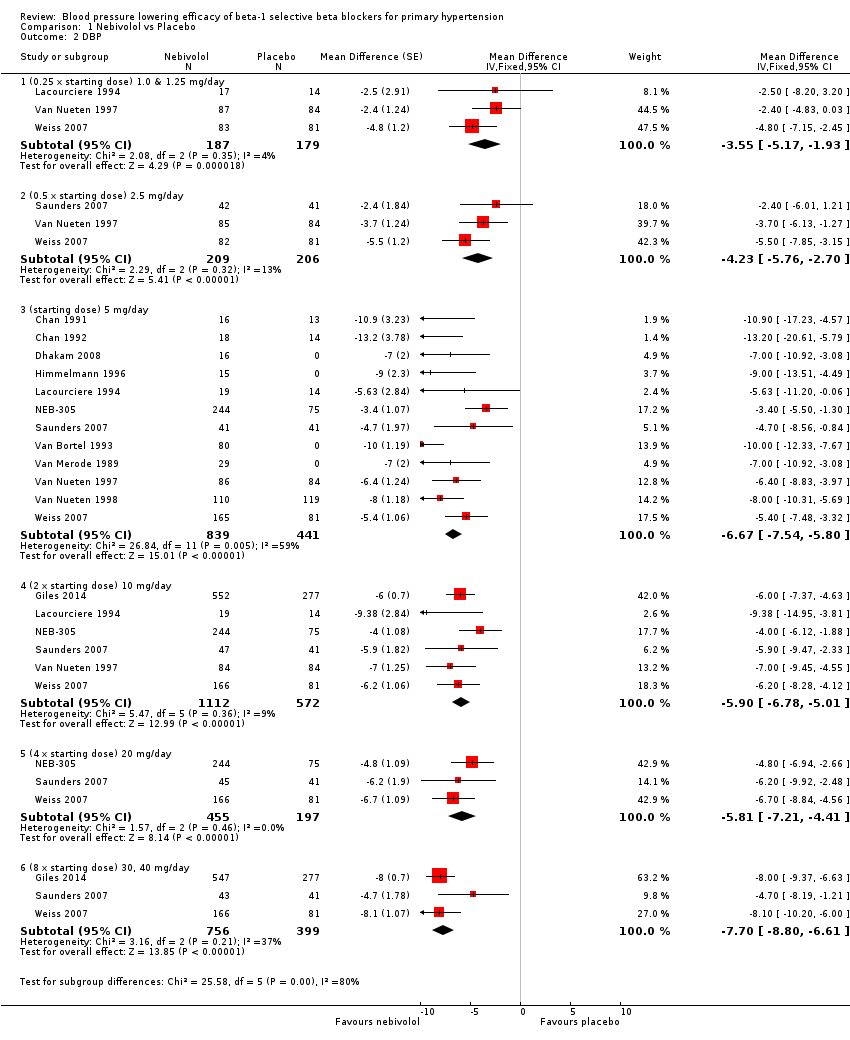
Please refer to Analysis 1.1, Analysis 1.2, Analysis 1.3 and Analysis 1.4 for the results of nebivolol. All nebivolol doses significantly lowered trough SBP and DBP compared to placebo. The test for subgroup differences by direct comparison included five large RCTs with multiple dosage subgroups. There was no dose‐related effect within the recommended dose range (starting dose, twice the starting dose, four times the starting dose) for SBP (P = 0.47) and DBP (P = 0.52). The maximum BP lowering effect was seen at 5 mg/day (starting dose). Since there was no dose response within the recommended doses, we pooled the three dosages into subgroups (5 mg, 10 mg and 20 mg) to calculate the estimates for blood pressure lowering efficacy. The estimate for blood pressure lowering efficacy for nebivolol is ‐8/‐6 mmHg. Heterogeneity was significant in these subgroups and we discuss the validity of this estimate further in the Discussion.
Nebivolol 1.25 mg/day did not significantly lower heart rate. Starting from 2.5 mg/day, nebivolol significantly lowered heart rate compared to placebo. Heterogeneity in the 5 mg/day subgroup was significant. The test of subgroup differences by direct comparison was significant (P = 0.0004) for heart rate. Only nebivolol 5 mg/day significantly lowered pulse pressure. However, the 5 mg/day subgroup was also the only subgroup in which heterogeneity was significant.
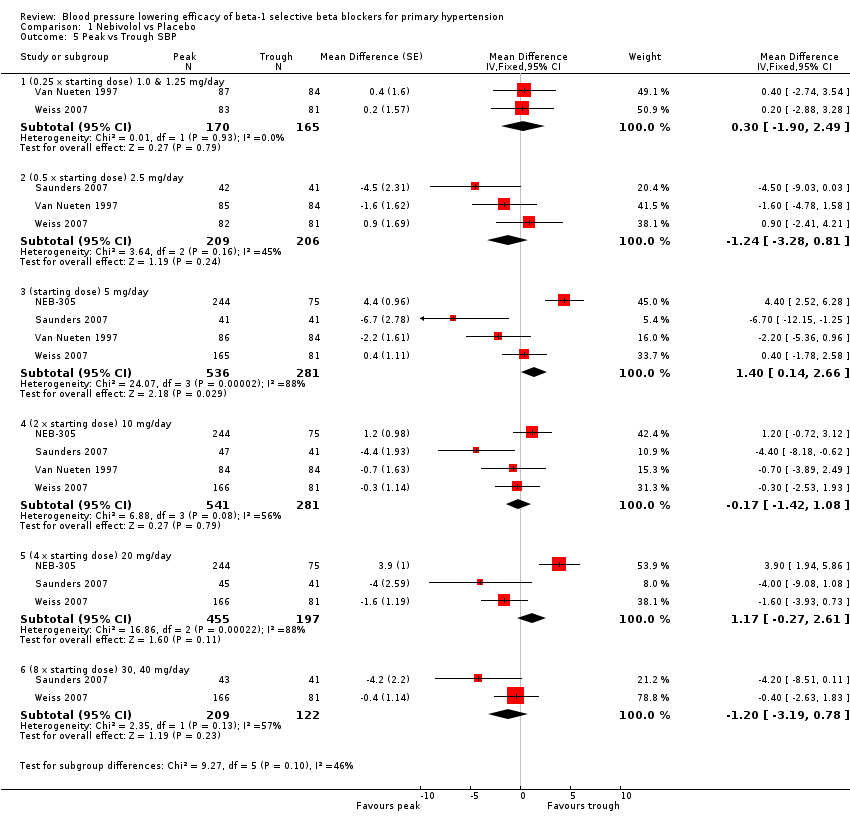
Four RCTs, NEB‐305; Saunders 2007; Van Nueten 1997; Weiss 2007, provided both peak and trough data in the same participants. We compared the difference in peak and trough effect for SBP and DBP. Peak measurements were not significantly different from trough measurements in SBP (Analysis 1.5). The BP lowering effect at peak was significantly greater than trough measurements for DBP, averaging 2 mmHg difference (Analysis 1.6).
The blood pressure variability was not significantly different between nebivolol and placebo for SBP (P = 0.61) and DBP (P = 0.52).
Blood pressure lowering efficacy of atenolol
Atenolol is indicated for the treatment of hypertension and angina in Canada and the USA (eCPS; FDA). The recommended doses for hypertension are 50 mg to 100 mg daily (FDA). Twenty‐three RCTs examining the blood pressure lowering efficacy of 25 mg to 200 mg per day atenolol in 1119 hypertensive participants were included in this review. Seven of the included studies were parallel studies and the other 16 were cross‐over studies. The mean baseline BP for the atenolol studies was 162.3/104.2 mmHg.
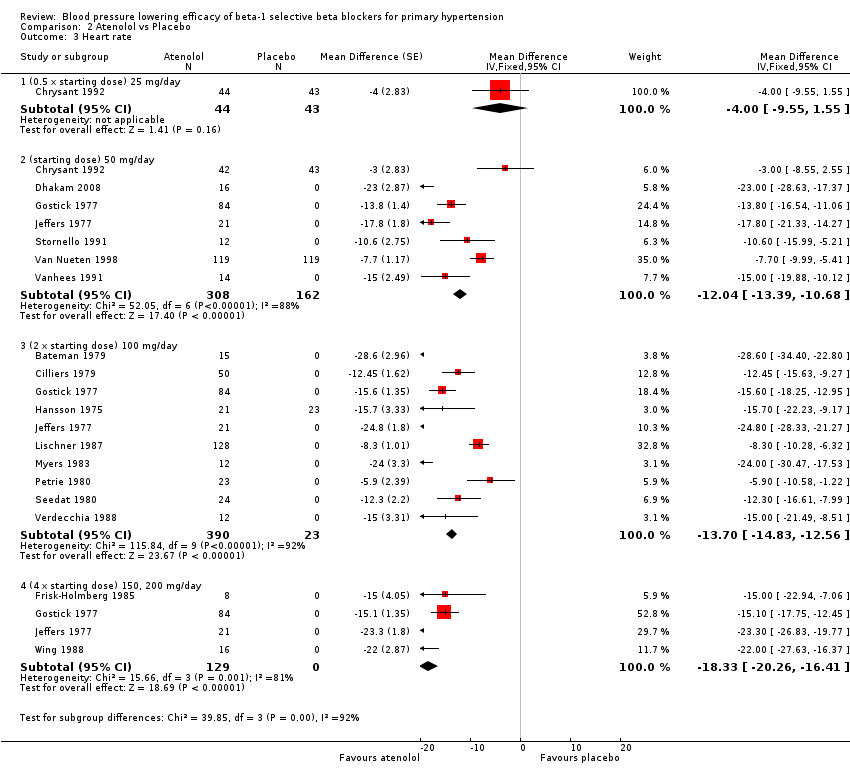
Please refer to Analysis 2.1, Analysis 2.2, Analysis 2.3 and Analysis 2.4 for the atenolol results. All atenolol doses significantly lowered SBP and DBP compared to placebo. The maximum BP lowering effect was shown at 100 mg/day (twice the starting dose). The test for subgroup differences within the recommended dose range (starting dose, twice the starting dose and four times the starting dose) by direct comparison was not significant for SBP (P = 0.56) and DBP (P = 0.22). However, only two small studies provided information for direct comparison. The test for subgroup differences by indirect comparison was not significant for SBP (P = 0.31) but significant for DBP (P = 0.04). Given this inconsistency, the evidence remains inconclusive that atenolol exhibits a dose‐response effect.
We found significant heterogeneity in both 50 mg/day and 100 mg/day subgroups in SBP and DBP. We discuss the probable reasons for heterogeneity in the Discussion. These two subgroups contained the largest sample size. The estimate of blood pressure lowering efficacy combining the starting dose and twice the starting dose was ‐13/‐11 mmHg.
Atenolol 25 mg/day did not significantly lower heart rate. Starting from 50 mg/day and higher, atenolol significantly lowered heart rate compared to placebo. The test for subgroup differences in the recommended dose range by direct comparison was significant for heart rate (P = 0.008).
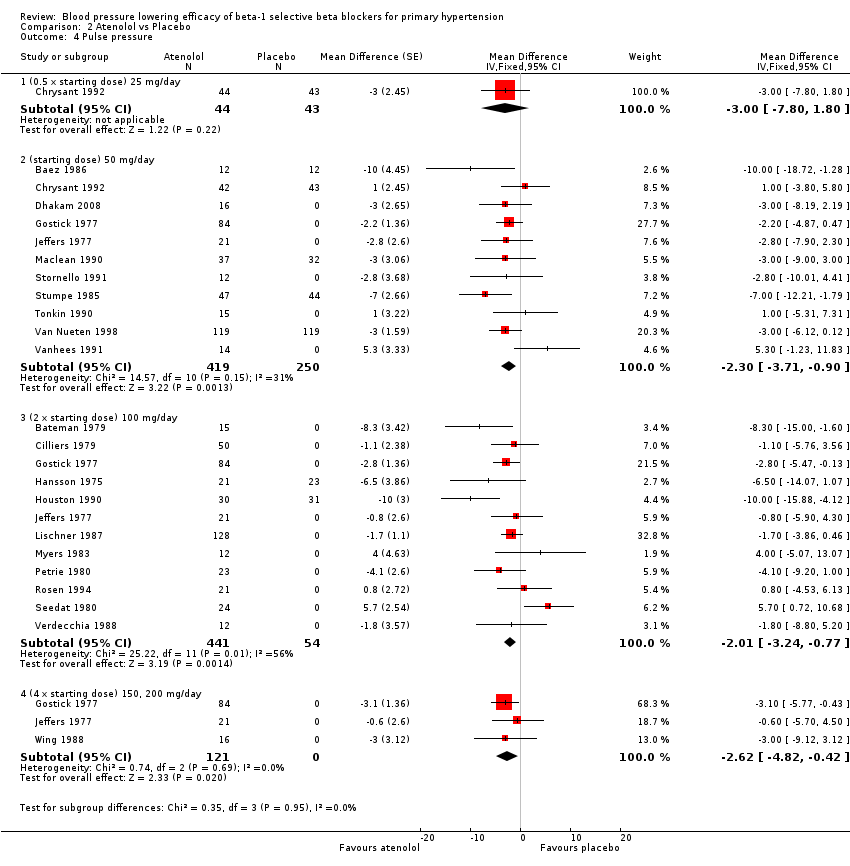
Atenolol 50 mg/day and higher significantly lowered pulse pressure compared to placebo. There were no differences between 50 mg/day, 100 mg/day and 200 mg/day by direct comparison for pulse pressure.
Blood pressure variability was not significantly different between the treatment and placebo groups for SBP (P = 0.3) and DBP (P = 0.13).
Blood pressure lowering efficacy of metoprolol
Metoprolol is indicated for the treatment of hypertension, angina and stable acute myocardial infarction (MI) in Canada and the USA. The recommended doses for hypertension are 100 mg to 200 mg daily in Canada and 100 mg to 450 mg daily in the USA (eCPS; FDA). Nine RCTs examining the blood pressure lowering efficacy of 25 mg to 400 mg per day metoprolol in 1004 hypertensive participants were included in this review. Four of the included studies were parallel studies and the other five were cross‐over studies. The mean baseline BP of the metoprolol studies was 154.4/100.3 mmHg.
Please refer to Analysis 3.1, Analysis 3.2, Analysis 3.3 and Analysis 3.4 for the metoprolol results. All metoprolol doses significantly lowered SBP and DBP compared to placebo. The maximum BP lowering effect was seen at 200 mg/day (twice the starting dose). The test for subgroup differences in the recommended dose range (100 mg/day to 400 mg/day) by direct comparison was not significant for both SBP (P = 0.12) and DBP (P = 0.12). Significant heterogeneity was present in the SBP 400 mg/day and DBP 200 mg/day subgroups. Since there was no definitive dose‐response within the recommended range, we pooled all the recommended doses, 100 mg, 200 mg/day and 400 mg/day, to estimate the blood pressure lowering effects. The estimate of blood pressure lowering effect of metoprolol was ‐9/‐8 mmHg.
Only five RCTs reported heart rate, therefore the sample size for heart rate was fairly small. However, all metoprolol doses significantly lowered heart rate compared to placebo. The test for subgroup differences by indirect comparison was significant in heart rate (P = 0.0007).
Metoprolol did not significantly change pulse pressure.
Metoprolol did not significantly change blood pressure variability compared to placebo for SBP (P = 0.56) or DBP (P = 0.86).
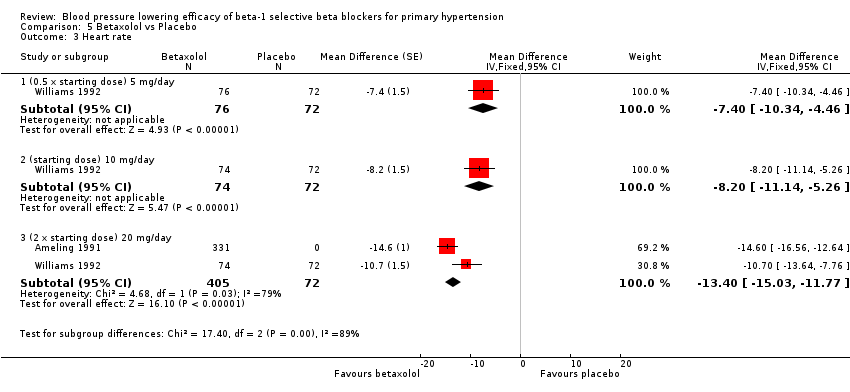
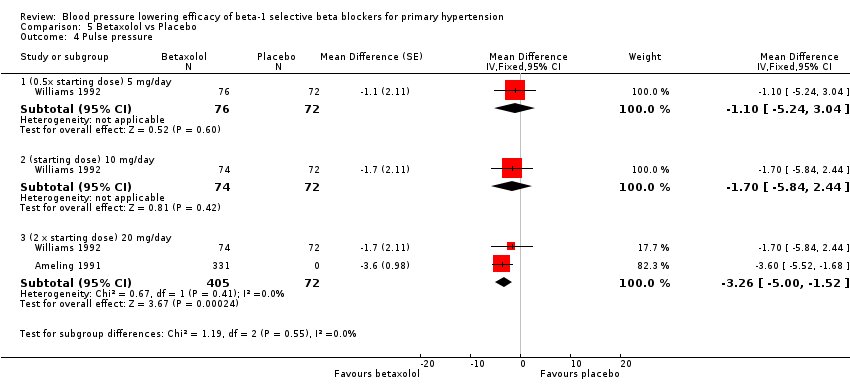
Blood pressure lowering efficacy of betaxolol
Please refer to the Analysis 5.1 to Analysis 5.4 for the results for betaxolol. Betaxolol is indicated for treatment of hypertension in the USA (FDA). The recommended daily doses of betaxolol are 10 mg/day to 20 mg/day. Two RCTs examined the BP lowering efficacy of betaxolol at dosage of 5 mg/day to 20 mg/day in hypertensive 627 participants were included in this review. The duration of both studies was four weeks. Ameling 1991 was a cross‐over study and Williams 1992 was a parallel study. Both studies measured BP using a mercury sphygmomanometer. Williams 1992 reported that they measured BP 24 hours after the last dose (trough). Ameling 1991 did not report the time of the measurement. The mean baseline BP of the included studies was 158.9/102.8 mmHg.
All doses of betaxolol significantly lowered SBP, DBP and heart rate. Williams 1992 provided data for direct comparison between the dose subgroup. There was no significant difference in BP lowering effect between the dose subgroups. Since there was no significant difference between the dosages, we pooled all three doses to estimate the mean effect. The estimated BP lowering effect of betaxolol is ‐11/‐8 mmHg.
Only 20 mg/day betaxolol also significantly lowered pulse pressure.
We were not able to perform analysis on BP variability because neither of the two included studies reported SD.
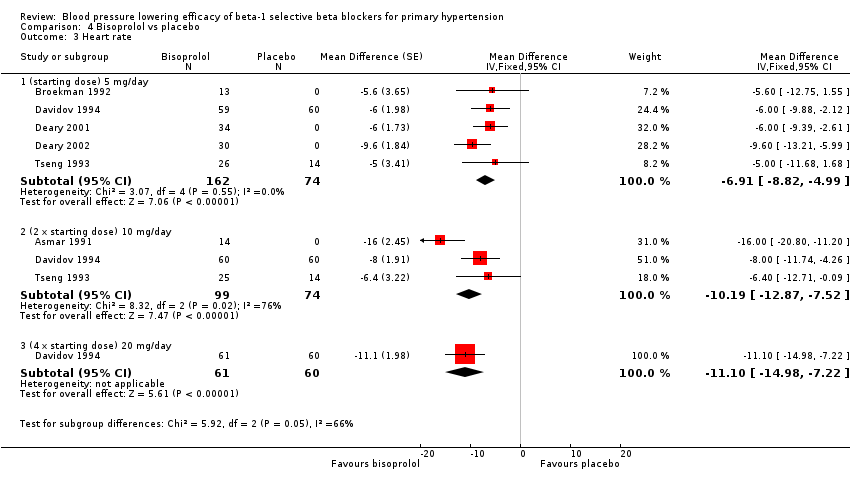
Blood pressure lowering efficacy of bisoprolol
Bisoprolol is indicated for the treatment of hypertension in Canada and the USA. The recommended doses for hypertension are 5 mg to 20 mg/day in Canada and the USA (eCPS; FDA). Seven RCTs examining the blood pressure lowering efficacy of 5 mg to 20 mg/day bisoprolol in 622 people with hypertension were included in this review. Three of the included studies were parallel design and the other four were cross‐over design. The mean baseline BP was 151.2/100.1 mmHg.
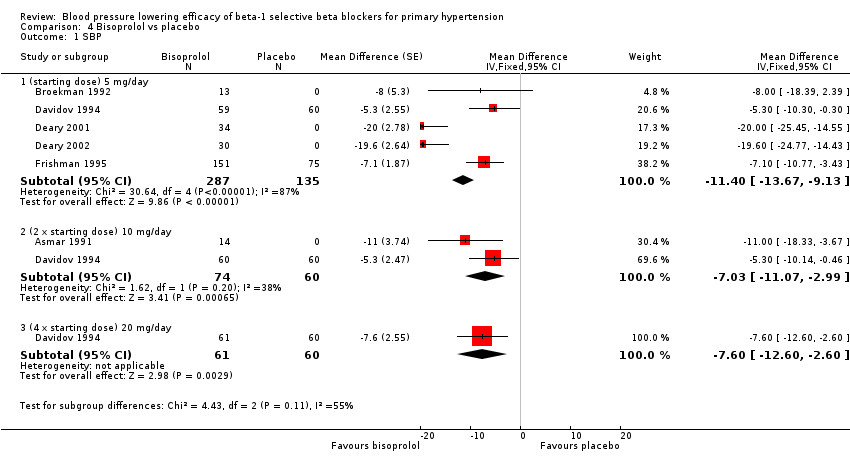
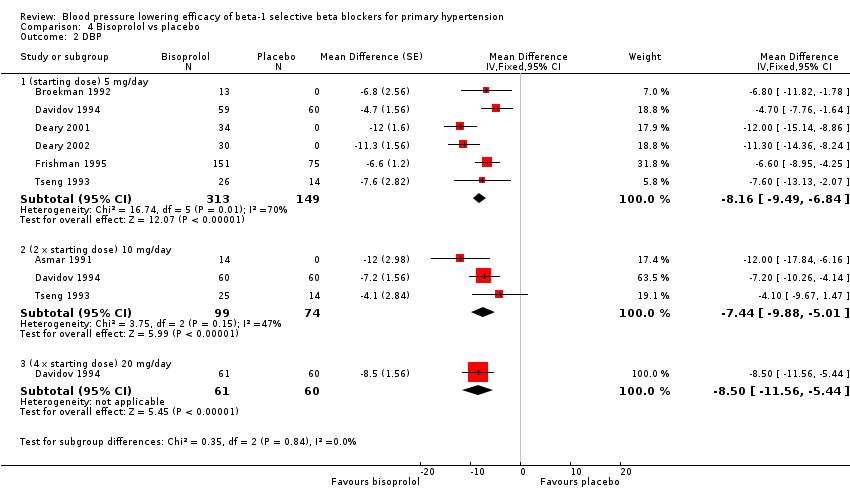
Please refer to Analysis 4.1, Analysis 4.2, Analysis 4.3 and Analysis 4.4 for the results of bisoprolol. All doses of bisoprolol significantly lowered SBP and DBP compared to placebo. There was significant heterogeneity for 5 mg/day (starting dose) subgroup for both outcomes. The test for subgroup differences in the recommended dose range by direct comparison was not significant in SBP (P = 0.76) and DBP (P = 0.32). Since there was no significant difference between the subgroups, we combined the three subgroups to obtain the estimate of BP lowering of bisoprolol, ‐10/‐8 mmHg.
All doses of bisoprolol significantly lowered heart rate compared to placebo. The test for subgroup differences by direct comparison was not significant in heart rate (P = 0.12).
Only 5 mg/day (starting dose) bisoprolol significantly lowered pulse pressure. This effect was not seen in other subgroups.
There was no significant difference in blood pressure variability between treatment and placebo for SBP (P = 0.66) or DBP (P = 0.96).
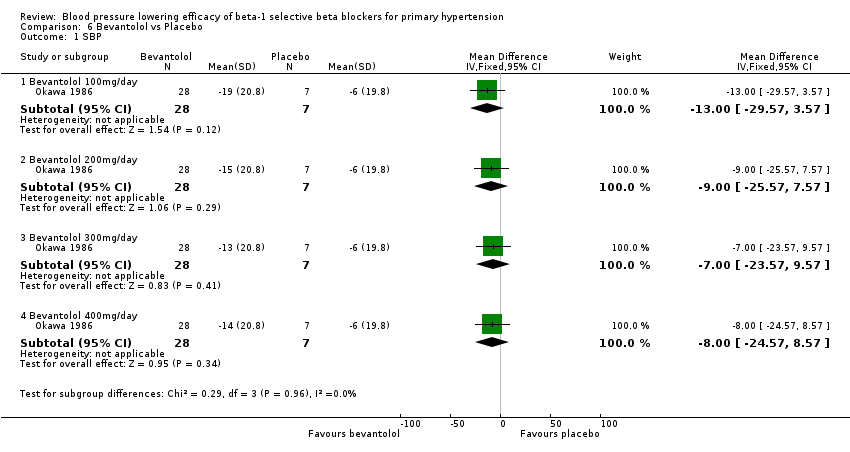
Blood pressure lowering efficacy of bevantolol
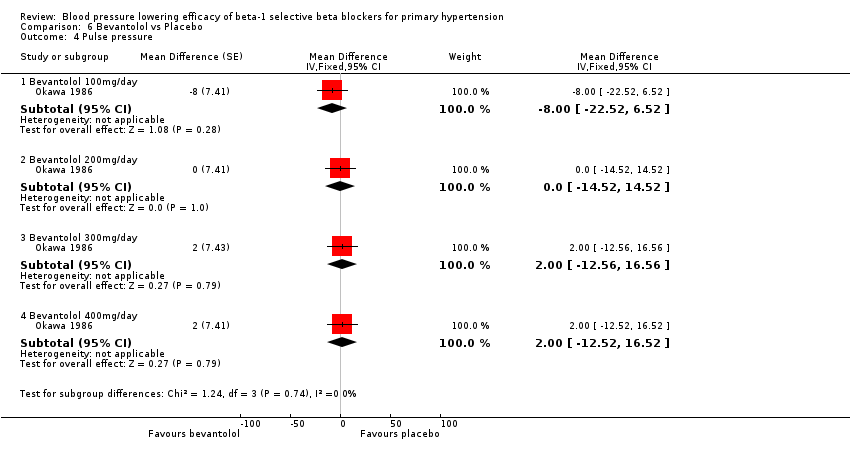
Please refer to Analysis 6.1, Analysis 6.2, Analysis 6.3, and Analysis 6.4 for the results for bevantolol. Bevantolol is not available in Canada, the USA or the European Union (EU). We did not find the product monograph or recommended starting dose for bevantolol from these government agencies. We included one parallel study (Okawa 1986) examining the BP lowering efficacy of 100 mg/day to 400 mg/day bevantolol in 139 hypertensive patients for six weeks in this review.
Bevantolol did not significantly lower SBP, DBP, heart rate or pulse pressure compared to placebo. Bevantolol did not significantly change BP variability. The end treatment SD for SBP was 20.8 for the bevantolol group and 19.8 for the placebo group. The end treatment SD for DBP was 13.1 for the bevantolol group and 12.6 for the placebo group.
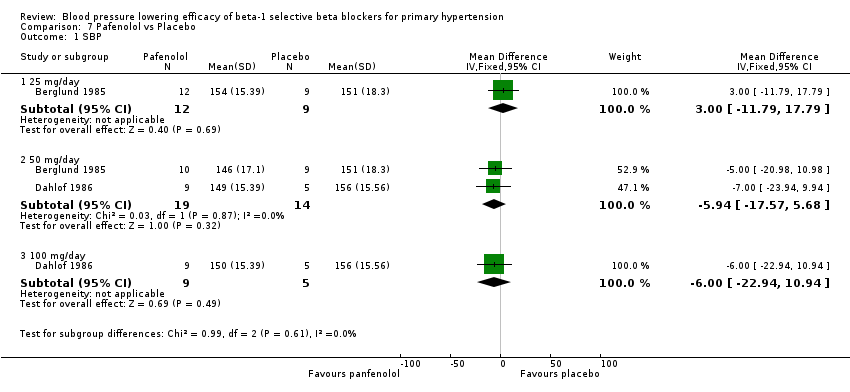
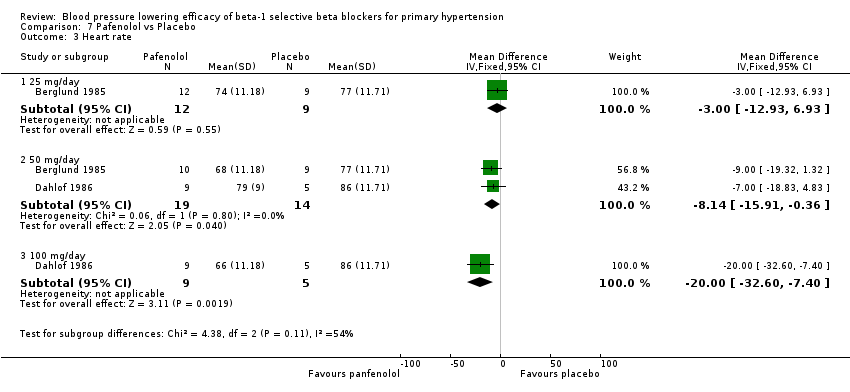
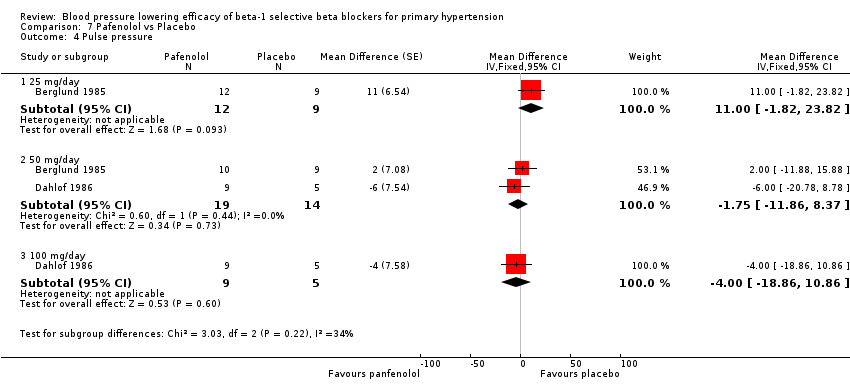
Blood pressure lowering efficacy of pafenolol
Please refer to Analysis 7.1, Analysis 7.2, Analysis 7.3 and Analysis 7.4 for the results of pafenolol. Pafenolol is not available in Canada, the USA or the EU. We did not find the product monograph or recommended starting dose for pafenolol on the websites of these government agencies. Two RCTs examining the blood pressure lowering efficacy of 25 mg/day to 100 mg/day pafenolol in 161 hypertensive participants were included. Both studies were parallel studies with treatment periods of four weeks. The mean baseline BP was 161.1/109.6 mmHg.
Pafenolol did not significantly lower SBP, DBP or pulse pressure. Pafenolol 50 mg/day and 100 mg/day significantly lowered heart rate.
Blood pressure lowering efficacy of practolol
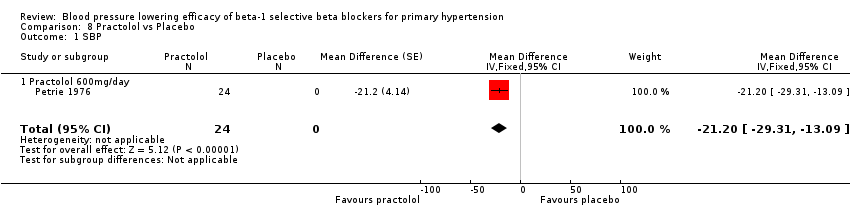
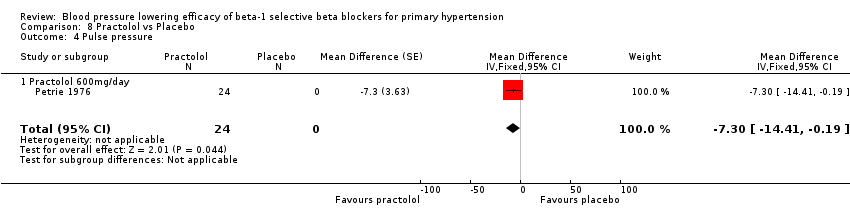
Please refer to Analysis 8.1, Analysis 8.2, Analysis 8.3 and Analysis 8.4 for the results of practolol. Practolol is not available in Canada, the USA or the E.U. We did not find the product monograph or recommended starting dose for practolol on the websites of these government agencies. We included one cross‐over study examining the blood pressure lowering effect of 600 mg/day practolol in 24 hypertensive participants for four weeks in this review. The baseline BP was 182.9/123.3 mmHg.
Practolol 600 mg/day significantly lowered SBP, DBP, heart rate and pulse pressure compared to placebo.
Pooled haemodynamic effect of beta‐1 selective blockers
We pooled the data for all available beta‐1 selective blockers, based on the recommended starting doses. This allowed us to estimate the blood pressure lowering effect of beta‐1 selective blockers as a whole subclass, as well as to compare it to other classes of antihypertensive drugs. Please refer to Analysis 9.1, Analysis 9.2, Analysis 9.3 and Analysis 9.4 for the results of beta‐1 blockers.
All pooled beta‐1 blocker doses significantly lowered SBP and DBP compared to placebo. The starting dose and twice the starting dose subgroups each contained over 2000 participants, which provided good estimates to represent this subclass of beta blockers. Heterogeneity was significant in these two subgroups. The source of heterogeneity is explored in the Discussion. The test for subgroup differences in the starting dose, twice the starting dose, four times the starting dose and eight times the starting dose subgroups by direct comparison was not significant for SBP (P = 0.23) and DBP (P = 0.11). The BP lowering estimate (SBP/DBP) combining the starting dose and twice the starting dose subgroups was ‐10/‐8 mmHg.
All doses of beta‐1 blockers significantly lowered heart rate. Beta‐1 selective blockers significantly lowered pulse pressure at the starting dose, twice the starting dose and four times the starting dose compared to placebo. The test for subgroup differences by direct comparison in pulse pressure was not significant.
Blood pressure variability
We tested the overall effect of beta‐1 blockers on BP variability using an unpaired t‐test. We extracted end treatment SD from parallel studies for the beta‐1 blocker group and the placebo group. Beta‐1 blockers did not significantly change BP variability in SBP (P = 0.83) or DBP (P = 0.52). The overall mean of end treatment SD for beta‐1 blockers (SBP/DBP) was 14.5/8.6 and placebo group was 14.9/8.5.
Withdrawal due to adverse effects
We pooled the data for withdrawal due to adverse effects (Analysis 9.5). Out of the 56 RCTs, only three RCTs reported withdrawal due to adverse effects data that could be used for the analysis. In these three RCTs, there was no significant difference in withdrawal due to adverse effects between treatment and placebo (RR 0.85 [0.50, 1.45]).
Discussion
Summary of main results
Nebivolol
The maximum blood pressure lowering effect of nebivolol occurred at 5 mg/day. Doses higher than 5 mg/day did not provide additional BP lowering effects. The data from 5 mg/day, 10 mg/day and 20 mg/day (starting dose, twice the starting dose and four times the starting dose) were pooled to estimate the average BP lowering effect of nebivolol, which was ‐8/‐6 mmHg. The funnel plots for nebivolol showed a paucity of small negative studies (Figure 3; Figure 4). This suggested that small negative studies were not published. The estimate above was likely an over estimation of the true effect. The funnel plots also showed several outliers on the left hand side of the graph. These positive outliers would exaggerate the effect.

Funnel plot of nebivolol 5 mg to 20 mg (SBP)

Funnel plot of nebivolol 5 mg to 20 mg (DBP)
Nebivolol lowered systolic and diastolic BP to a similar degree, and therefore it had only a small effect on pulse pressure. Heterogeneity in the 5 mg/day subgroup suggested that the statistically significant effect on pulse pressure could be caused by variation, as no other dose of nebivolol showed a similar effect.
Peak to trough difference
Only four nebivolol studies reported both peak and trough measurements. If there was a greater effect at peak (seen with some diastolic BP measurements) the effect was small (2 mmHg).
Atenolol
Both the recommended starting dose (50 mg daily) subgroup and twice the starting dose (100 mg daily) subgroup contained a large number of subjects and provided a good estimate of the blood pressure lowering efficacy of atenolol. Funnel plots were used to identify extreme outliers and assessment of bias. The funnel plots of the starting dose did not show any extreme outliers or provide evidence of asymmetry which would suggest publication bias.
In the twice the starting dose subgroup, the funnel plot identified Lischner 1987 as an extreme outlier for both SBP and DBP. Another RCT (Ravid 1985) from the same laboratory was also identified as an extreme outlier in the Cochrane review on non‐selective beta blockers (Wong 2014a). These data are therefore of questionable validity. This represented a common problem in performing the systematic review and meta‐analysis, as such studies lead to an overestimation of the magnitude of blood pressure lowering effect. If we removed the extreme outlier, the estimate of twice the starting dose decreased from ‐15/‐13 mmHg to ‐12/‐10 mmHg. Removing it would also decrease the overall estimate of the pooled atenolol starting dose and twice the starting dose subgroups from ‐13/‐11 mmHg to ‐11/‐9 mmHg, which was closer to the overall estimates of the class.
Atenolol was the only beta‐1 blocker that significantly lowered pulse pressure across several doses. The combined estimate of the pulse pressure effect of starting dose, twice and four times the starting dose atenolol was small (‐2 mmHg [1‐3]). It did not show a dose‐response effect and is unlikely to be clinically significant.
Metoprolol
Most of the data for metoprolol came from two studies which tested the dose‐response effect of the drug at several doses (Frishman 2006, Papademetriou 2006). These two RCTs showed a greater BP lowering in the recommended dose range compared to lower doses (25 mg/day and 50 mg/day). However, the different doses within the recommended dose range did not show a significant dose response effect. The mean BP lowering effect of the 100 mg/day, 200 mg/day and 400 mg/day (starting dose, twice and four times the starting dose) was ‐9/‐8 mmHg.
Bisoprolol
No additional BP lowering effect was seen for doses higher than the recommended starting dose of bisoprolol. The mean BP lowering effect of the 5 mg/day, 10 mg/day and 20 mg/day (starting dose, twice the starting dose and four times the starting dose) was ‐11/‐8 mmHg. This was likely to be exaggerated because of the presence of two extreme positive outliers (Deary 2001, Deary 2002) in the data.
Betaxolol, bevantolol, pafenolol and practolol
The sample sizes of these four beta‐1 blockers were small. They contributed little weight to the overall pooled estimates. Their estimates are reported in the Main results.
Overall pooled blood pressure lowering effect of beta‐1 blockers
The sample size for the beta‐1 selective blockers was the largest of the four subclasses of beta blockers. The pooled data included 6313 participants from 51 RCTs and multiple dosages. The data set provided the best opportunity to explore whether there was a graded dose‐response effect. The findings showed a similar and smaller BP lowering effect at a quarter of the starting dose and half the starting dose, but then a flat and similar BP lowering for the starting dose, twice, four times and eight times the starting dose (see Analysis 9.1; Analysis 9.2.). Twice the starting dose subgroups had the most data and exhibited considerable heterogeneity, which we explore below. The lack of a dose‐response effect above twice the starting dose suggests that higher doses of beta‐1 blockers were not more effective in lowering BP.
In Analysis 9.10 and Analysis 9.11, we demonstrated that the primary source of heterogeneity in the twice the starting dose subgroup was the difference in BP lowering effect between the individual beta‐1 blockers. Atenolol showed the largest effect size among the five beta‐1 blockers. In the discussion for atenolol, we explained that the estimate of the twice the starting dose subgroup of atenolol could be exaggerated due to an extreme outlier. The effect size of this atenolol subgroup would change from ‐15/‐13 mmHg to ‐12/‐10 mmHg if we removed the extreme outlier from the analysis. We also considered the fact that mean baseline BP of atenolol studies (162/104 mmHg) was higher than the other beta‐1 blockers. In addition, most studies for atenolol, metoprolol and betaxolol measured BP at peak hours. Peak measurements would also contribute to a greater effect size.
Difference in pharmacodynamic properties could also have contributed to the difference in BP lowering efficacy. Heart rate reduction during exercise was used for many beta‐1 blockers to test the potency of beta‐1 blockade. Bisoprolol 10 mg (at twice the starting dose) had equivalent exercise heart rate percentage change from baseline compared to 50 mg atenolol (starting dose) and 100 mg metoprolol (starting dose) (Lancaster 1988). Five mg nebivolol (starting dose) had an equivalent effect compared to 100 mg atenolol (twice the starting dose) (Veverka 2006). If beta‐1 blockade was the dominant mechanism by which blood pressure was lowered by beta blockers, nebivolol should have lowered BP the most and bisoprolol the least. As this did not fit with the data, potency of beta‐1 blocking ability did not explain the difference in blood pressure lowering effect.
Beta‐1 selectivity also might explain the differences. Both nebivolol and bisoprolol are highly beta‐1 selective. The beta‐1/beta‐2 selectivity ratios were 321 fold for nebivolol and 100 fold for bisoprolol (Lancaster 1988; Veverka 2006). The selectivity ratios for atenolol, metoprolol and betaxolol were much less, at 35 fold, 40 fold and 20 fold respectively (Lancaster 1988). In this case, it appeared that beta blockers with less beta‐1 selectivity lower BP by a greater magnitude.
The mechanism by which beta blockers lower blood pressure is the most likely explanation for differences in BP lowering effect. However, studying the pharmacodynamic properties of beta blockers is notoriously difficult. The methods to test pharmacodynamic properties vary between research groups. The outcomes are often not comparable to each other (Fitzgerald 1991). It is thus difficult to fully explain the observed differences in BP lowering effect between different beta‐1 blockers.
The starting dose and twice the starting dose subgroups contained the largest sample size. The best estimate of BP lowering efficacy for beta‐1 blockers was determined by combining the results from all the starting dose and twice the starting doses. It was ‐10/‐8 mmHg.
Pulse pressure
Atenolol was the only beta‐1 blocker that consistently lowered pulse pressure at different doses. This effect was also seen in the pooled analysis. Since no other beta‐1 blocker exhibited a similar effect on pulse pressure it is more likely that the atenolol data are incorrect.
Overall completeness and applicability of evidence
This review provides the most up‐to‐date assessment of the blood pressure lowering efficacy of beta‐1 selective blockers. All the studies included had the same primary objective which was to compare the blood pressure effect of beta‐1 blockers and placebo. This review contains a fairly large sample size for the continuous outcomes that we examined.
Quality of the evidence
summary of findings Table for the main comparison summarises the important findings based on combining the data from the starting dose and twice the starting dose of beta‐1 selective blockers, and incorporates the quality of evidence in this review.
We have included 56 RCTs examining the BP lowering efficacy of eight beta‐1 blockers in 7812 people with hypertension in this review. The large sample size provided adequate power to draw robust conclusions. The risk of detection bias was of concern in beta blocker studies. Most of the included studies did not use automated machines when measuring BP, which would be the best way to mitigate the risk of detection bias. Therefore, the risk of detection bias by loss of blinding was high. Nebivolol and atenolol contributed a large portion of data to our pooled analyses. Both of the beta‐1 blockers showed high risk of publication bias either due to skewed funnel plots or the presence of extreme outliers.
Pulse pressure data was seldom reported in the trials. We calculated pulse pressure by subtracting the reduction in DBP from the reduction in SBP. Indirectness of this outcome was the reason the evidence was further downgraded for pulse pressure. For these reasons, the quality of evidence was judged to be low to very low in the 'Summary of findings' table.
Potential biases in the review process
The rigid methodology and comprehensive search strategy minimised the potential for bias in selection of included studies. The search of citations in the three databases was performed by the Cochrane Hypertension Information Specialist. Once we had the set of citations, we sorted through them following the inclusion criteria. This process minimised any grey areas that may have introduced bias.
On the occasions that data had to be obtained from figures, two reviewers extracted data independently and then the average of the two values was used. This minimised the potential of human error during the data extraction process. We are confident that the potential for bias during the review process was low.
Agreements and disagreements with other studies or reviews
Two published reviews (Chen 2010; Law 2005) reported the blood pressure lowering efficacy of beta blockers. Chen 2010 examined the additional effect of beta blockers in combination with other antihypertensive drugs. Law 2005 examined the BP lowering effect of antihypertensive drugs, including beta‐blockers, as monotherapy. Both reviews pooled all the subclasses of beta blockers and doses together, assuming that they had similar effects. We were able to show that beta‐1 selective blockers could have significantly different BP lowering effects from the other sub‐classes of beta blockers. Our review is unique in the sense that we did not assume that all beta blockers lowered blood pressure similarly.
When compared to the other subclasses, beta‐1 selective blockers appeared to lower BP more than dual receptor blockers (Wong 2015) and partial agonists (Wong 2014b). Nonselective beta blockers and beta‐1 selective blockers appeared to lower blood pressure similarly (Wong 2014a), however most trials included in the nonselective beta blocker review measured BP at peak effect. These are indirect comparisons, but represent fairly strong evidence that the BP lowering efficacy of different subclasses of beta blockers are not the same. Direct head‐to‐head RCTs would be the best way to determine whether the differences between the subclasses is real.
There are a number of reasons why the pooled estimate of BP lowering for beta‐1 selective beta blockers (‐10/8 mmHg) is greater than the real effect. One of these reasons is that about half of the trials measured the effect at peak rather than trough. The estimate of BP lowering at trough (‐8/‐7 mmHg) is less than the overall pooled estimate and is the number that is best compared to other drug classes.
Other Cochrane reviews have compared antihypertensive drug classes with placebo and used similar inclusion/exclusion criteria to this review. Based on indirect comparison, the pooled trough SBP lowering effect of beta‐1 selective blockers (‐8 mmHg) is similar to the average SBP reduction for thiazide diuretics (‐9 mmHg) (Musini 2014), angiotensin converting enzyme (ACE) inhibitors (‐8 mmHg) (Heran 2008a), angiotension receptor blockers (ARBs) (‐9 mmHg) (Heran 2008b) and renin inhibitors (‐8 mmHg) (Musini 2008). In contrast the trough DBP lowering of beta‐1 selective blockers (‐7 mmHg) is greater than that for thiazide diuretics (‐4 mmHg) (Musini 2014), ACE inhibitors (‐5 mmHg) (Heran 2008a), ARBs (‐5 mmHg) (Heran 2008b) and renin inhibitors (‐5 mmHg) (Musini 2008). This provides fairly strong evidence that the BP lowering effect of different classes of drugs is not the same as has been assumed by others (Law 2005).
The property of beta‐blockers to lower DBP to a similar extent to SBP explains the fact that beta‐1 selective blockers have no effect on pulse pressure. This finding is similar to the other beta blocker subclasses and is substantially less than the average reduction of pulse pressure seen with thiazides (‐5 mmHg) (Musini 2014) and drugs that inhibit renin angiotensin system (‐3 mmHg) (Heran 2008a; Heran 2008b; Musini 2008). This finding is important and might be the explanation as to why first‐line beta blockers (Wiysonge 2012) do not reduce mortality and morbidity as much as first‐line thiazides; Wright 2000; Wright 2009), first‐line calcium channel blockers (Chen 2010b), and first‐line drugs inhibiting the renin angiotensin system (Xue 2015).

PRISMA study flow diagram
Risk of bias summary: review authors' judgements about each risk of bias item for each included study.
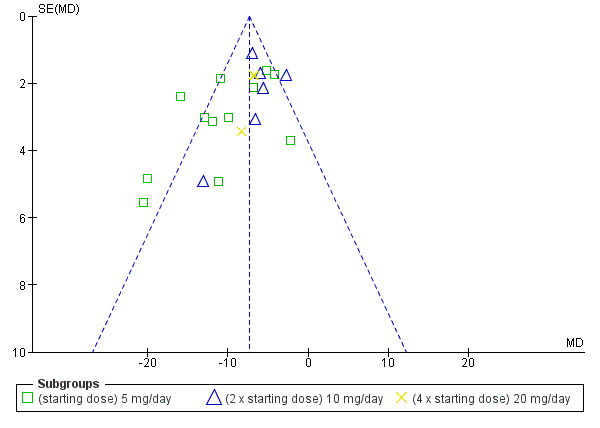
Funnel plot of nebivolol 5 mg to 20 mg (SBP)

Funnel plot of nebivolol 5 mg to 20 mg (DBP)

Comparison 1 Nebivolol vs Placebo, Outcome 1 SBP.
Comparison 1 Nebivolol vs Placebo, Outcome 2 DBP.

Comparison 1 Nebivolol vs Placebo, Outcome 3 Heart rate.

Comparison 1 Nebivolol vs Placebo, Outcome 4 Pulse Pressure.
Comparison 1 Nebivolol vs Placebo, Outcome 5 Peak vs Trough SBP.

Comparison 1 Nebivolol vs Placebo, Outcome 6 Peak vs Trough DBP.

Comparison 2 Atenolol vs Placebo, Outcome 1 SBP.

Comparison 2 Atenolol vs Placebo, Outcome 2 DBP.
Comparison 2 Atenolol vs Placebo, Outcome 3 Heart rate.
Comparison 2 Atenolol vs Placebo, Outcome 4 Pulse pressure.

Comparison 3 Metoprolol vs Placebo, Outcome 1 SBP.

Comparison 3 Metoprolol vs Placebo, Outcome 2 DBP.

Comparison 3 Metoprolol vs Placebo, Outcome 3 Heart rate.

Comparison 3 Metoprolol vs Placebo, Outcome 4 Pulse pressure.
Comparison 4 Bisoprolol vs placebo, Outcome 1 SBP.
Comparison 4 Bisoprolol vs placebo, Outcome 2 DBP.
Comparison 4 Bisoprolol vs placebo, Outcome 3 Heart rate.

Comparison 4 Bisoprolol vs placebo, Outcome 4 Pulse pressure.

Comparison 5 Betaxolol vs Placebo, Outcome 1 SBP.

Comparison 5 Betaxolol vs Placebo, Outcome 2 DBP.
Comparison 5 Betaxolol vs Placebo, Outcome 3 Heart rate.
Comparison 5 Betaxolol vs Placebo, Outcome 4 Pulse pressure.
Comparison 6 Bevantolol vs Placebo, Outcome 1 SBP.

Comparison 6 Bevantolol vs Placebo, Outcome 2 DBP.

Comparison 6 Bevantolol vs Placebo, Outcome 3 Heart rate.
Comparison 6 Bevantolol vs Placebo, Outcome 4 Pulse pressure.
Comparison 7 Pafenolol vs Placebo, Outcome 1 SBP.

Comparison 7 Pafenolol vs Placebo, Outcome 2 DBP.
Comparison 7 Pafenolol vs Placebo, Outcome 3 Heart rate.
Comparison 7 Pafenolol vs Placebo, Outcome 4 Pulse pressure.
Comparison 8 Practolol vs Placebo, Outcome 1 SBP.

Comparison 8 Practolol vs Placebo, Outcome 2 DBP.

Comparison 8 Practolol vs Placebo, Outcome 3 Heart rate.
Comparison 8 Practolol vs Placebo, Outcome 4 Pulse pressure.

Comparison 9 Pooled overall effect, Outcome 1 SBP.

Comparison 9 Pooled overall effect, Outcome 2 DBP.

Comparison 9 Pooled overall effect, Outcome 3 Heart rate.

Comparison 9 Pooled overall effect, Outcome 4 Pulse pressure.
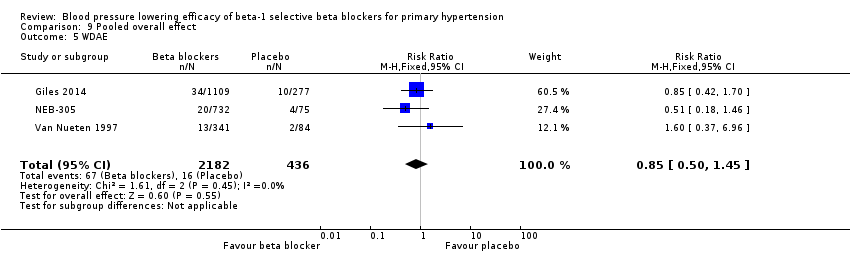
Comparison 9 Pooled overall effect, Outcome 5 WDAE.

Comparison 9 Pooled overall effect, Outcome 6 SBP combined starting dose and 2 x starting dose.
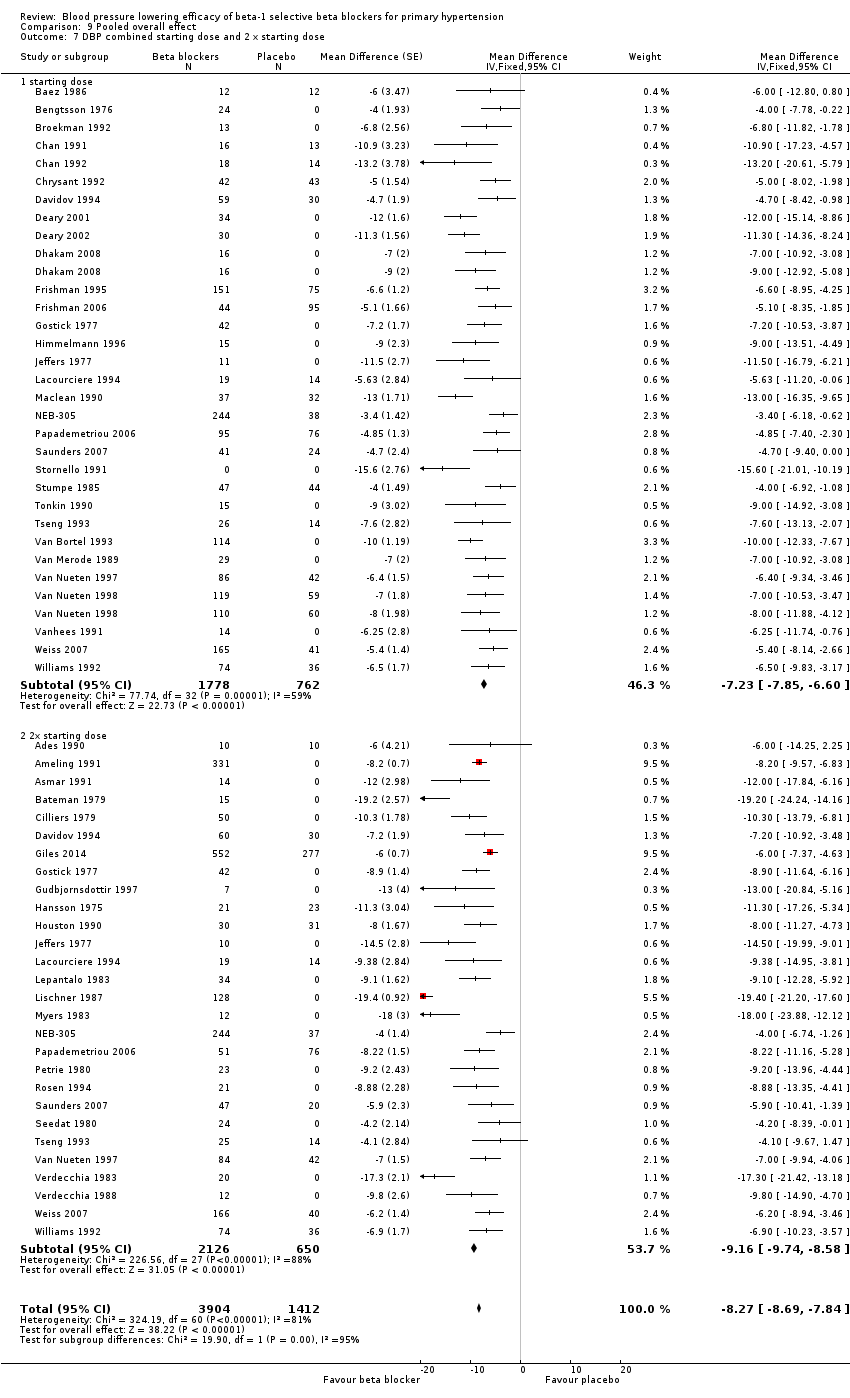
Comparison 9 Pooled overall effect, Outcome 7 DBP combined starting dose and 2 x starting dose.

Comparison 9 Pooled overall effect, Outcome 8 Heart rate combined starting dose and 2 x starting dose.

Comparison 9 Pooled overall effect, Outcome 9 Pulse pressure combined starting dose and 2 x starting dose.
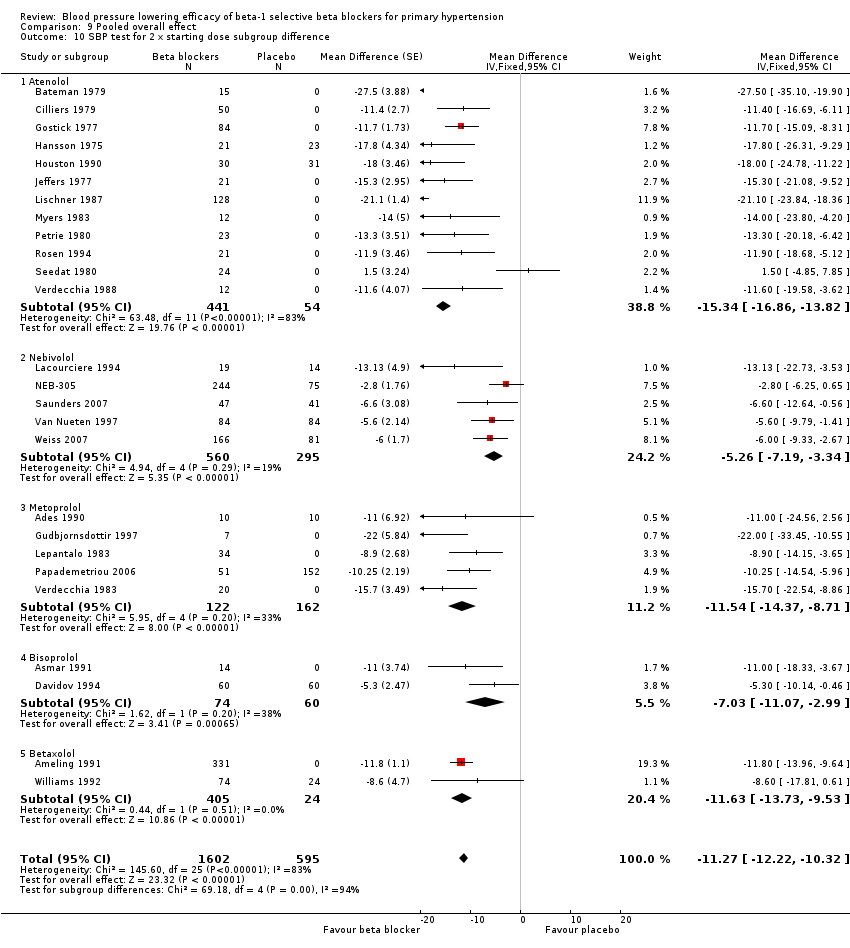
Comparison 9 Pooled overall effect, Outcome 10 SBP test for 2 x starting dose subgroup difference.

Comparison 9 Pooled overall effect, Outcome 11 DBP test for 2 x starting dose subgroup difference.
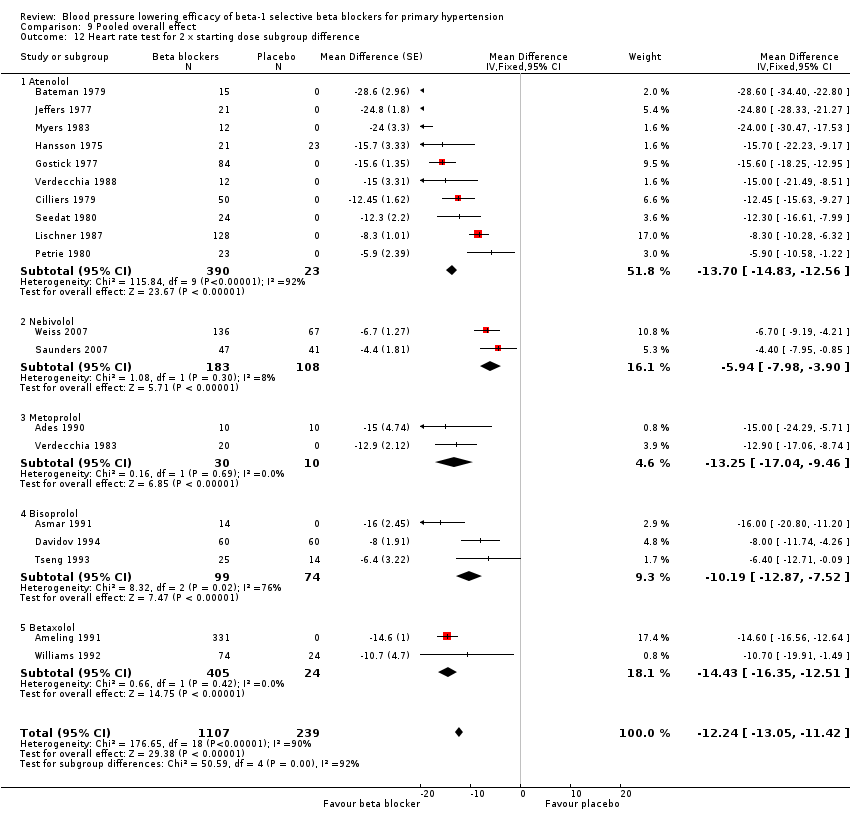
Comparison 9 Pooled overall effect, Outcome 12 Heart rate test for 2 x starting dose subgroup difference.
| Blood pressure lowering effects of beta‐1 blockers compared with placebo for primary hypertension | |||
| Patient or population: People with primary hypertension Intervention: Beta‐1 selective blockers Comparison: Placebo | |||
| Outcomes | mean estimates of combining 1x and 2x starting dose | No of Participants | Quality of the evidence |
| Systolic blood pressure | ‐10.4 (‐11.1, ‐9.7)1,2,3 | 5246 (47) | Low4,5 |
| Diastolic blood pressure | ‐8.3 (‐8.7, ‐7.8)1,2,3 | 5316 (48) | Low4,5 |
| Heart rate | ‐10.9 (‐11.5, ‐10.4)1,2 | 3407 (33) | Low4,5 |
| Pulse pressure | ‐1.8 [‐2.3, ‐1.2]1,2 | 5246 (47) | Very low4,5,6 |
| WDAE | 0.9 (0.5, 1.5) | 2618 (3) | Low7,8 |
| 95% CI: 95% confident interval; WDAE: Withdrawal due to adverse effect. | |||
| GRADE Working Group grades of evidence | |||
| Footnotes | |||
|
| |||
| Outcome or subgroup title | No. of studies | No. of participants | Statistical method | Effect size |
| 1 SBP Show forest plot | 13 | Mean Difference (Fixed, 95% CI) | Subtotals only | |
| 1.1 (0.25 x starting dose) 1.0 & 1.25 mg/day | 3 | 366 | Mean Difference (Fixed, 95% CI) | ‐4.49 [‐7.15, ‐1.83] |
| 1.2 (0.5 x starting dose) 2.5 mg/day | 3 | 415 | Mean Difference (Fixed, 95% CI) | ‐4.96 [‐7.66, ‐2.26] |
| 1.3 (starting dose) 5 mg/day | 12 | 1280 | Mean Difference (Fixed, 95% CI) | ‐8.81 [‐10.23, ‐7.40] |
| 1.4 (2 x starting dose) 10 mg/day | 6 | 1684 | Mean Difference (Fixed, 95% CI) | ‐6.04 [‐7.47, ‐4.60] |
| 1.5 (4 x starting dose) 20 mg/day | 3 | 652 | Mean Difference (Fixed, 95% CI) | ‐6.95 [‐9.26, ‐4.63] |
| 1.6 (8 x starting dose) 30, 40 mg/day | 3 | 1155 | Mean Difference (Fixed, 95% CI) | ‐8.10 [‐9.84, ‐6.36] |
| 2 DBP Show forest plot | 13 | Mean Difference (Fixed, 95% CI) | Subtotals only | |
| 2.1 (0.25 x starting dose) 1.0 & 1.25 mg/day | 3 | 366 | Mean Difference (Fixed, 95% CI) | ‐3.55 [‐5.17, ‐1.93] |
| 2.2 (0.5 x starting dose) 2.5 mg/day | 3 | 415 | Mean Difference (Fixed, 95% CI) | ‐4.23 [‐5.76, ‐2.70] |
| 2.3 (starting dose) 5 mg/day | 12 | 1280 | Mean Difference (Fixed, 95% CI) | ‐6.67 [‐7.54, ‐5.80] |
| 2.4 (2 x starting dose) 10 mg/day | 6 | 1684 | Mean Difference (Fixed, 95% CI) | ‐5.90 [‐6.78, ‐5.01] |
| 2.5 (4 x starting dose) 20 mg/day | 3 | 652 | Mean Difference (Fixed, 95% CI) | ‐5.81 [‐7.21, ‐4.41] |
| 2.6 (8 x starting dose) 30, 40 mg/day | 3 | 1155 | Mean Difference (Fixed, 95% CI) | ‐7.70 [‐8.80, ‐6.61] |
| 3 Heart rate Show forest plot | 8 | Mean Difference (Fixed, 95% CI) | Subtotals only | |
| 3.1 (0.25 x starting dose) 1.25 mg/day | 1 | 136 | Mean Difference (Fixed, 95% CI) | ‐2.9 [‐5.86, 0.06] |
| 3.2 (0.5 x starting dose) 2.5 mg/day | 2 | 218 | Mean Difference (Fixed, 95% CI) | ‐3.89 [‐6.18, ‐1.61] |
| 3.3 (starting dose) 5 mg/day | 7 | 487 | Mean Difference (Fixed, 95% CI) | ‐8.21 [‐9.66, ‐6.76] |
| 3.4 (2 x starting dose) 10 mg/day | 3 | 1120 | Mean Difference (Fixed, 95% CI) | ‐7.23 [‐8.48, ‐5.99] |
| 3.5 (4 x starting dose) 20 mg/day | 2 | 298 | Mean Difference (Fixed, 95% CI) | ‐8.43 [‐10.48, ‐6.38] |
| 3.6 (8 x starting dose) 30, 40 mg/day | 3 | 1155 | Mean Difference (Fixed, 95% CI) | ‐10.94 [‐12.18, ‐9.71] |
| 4 Pulse Pressure Show forest plot | 13 | Mean Difference (Fixed, 95% CI) | Subtotals only | |
| 4.1 (0.25 x starting dose) 1.0 & 1.25 mg/day | 3 | 366 | Mean Difference (Fixed, 95% CI) | ‐0.88 [‐3.21, 1.45] |
| 4.2 (0.5 x starting dose) 2.5 mg/day | 3 | 415 | Mean Difference (Fixed, 95% CI) | ‐0.95 [‐3.32, 1.41] |
| 4.3 (starting dose) 5 mg/day | 12 | 1314 | Mean Difference (Fixed, 95% CI) | ‐1.62 [‐2.83, ‐0.41] |
| 4.4 (2 x starting dose) 10 mg/day | 6 | 1684 | Mean Difference (Fixed, 95% CI) | ‐0.19 [‐1.47, 1.08] |
| 4.5 (4 x starting dose) 20 mg/day | 3 | 652 | Mean Difference (Fixed, 95% CI) | ‐1.25 [‐3.38, 0.89] |
| 4.6 (8 x starting dose) 30, 40 mg/day | 3 | 1155 | Mean Difference (Fixed, 95% CI) | ‐0.37 [‐1.94, 1.20] |
| 5 Peak vs Trough SBP Show forest plot | 4 | Mean Difference (Fixed, 95% CI) | Subtotals only | |
| 5.1 (0.25 x starting dose) 1.0 & 1.25 mg/day | 2 | 335 | Mean Difference (Fixed, 95% CI) | 0.30 [‐1.90, 2.49] |
| 5.2 (0.5 x starting dose) 2.5 mg/day | 3 | 415 | Mean Difference (Fixed, 95% CI) | ‐1.24 [‐3.28, 0.81] |
| 5.3 (starting dose) 5 mg/day | 4 | 817 | Mean Difference (Fixed, 95% CI) | 1.40 [0.14, 2.66] |
| 5.4 (2 x starting dose) 10 mg/day | 4 | 822 | Mean Difference (Fixed, 95% CI) | ‐0.17 [‐1.42, 1.08] |
| 5.5 (4 x starting dose) 20 mg/day | 3 | 652 | Mean Difference (Fixed, 95% CI) | 1.17 [‐0.27, 2.61] |
| 5.6 (8 x starting dose) 30, 40 mg/day | 2 | 331 | Mean Difference (Fixed, 95% CI) | ‐1.20 [‐3.19, 0.78] |
| 6 Peak vs Trough DBP Show forest plot | 4 | 3372 | Mean Difference (Fixed, 95% CI) | ‐1.53 [‐1.95, ‐1.11] |
| 6.1 (0.25 x starting dose) 1.0 & 1.25 mg/day | 2 | 335 | Mean Difference (Fixed, 95% CI) | ‐0.95 [‐2.38, 0.48] |
| 6.2 (0.5 x starting dose) 2.5 mg/day | 3 | 415 | Mean Difference (Fixed, 95% CI) | ‐1.88 [‐3.12, ‐0.64] |
| 6.3 (starting dose) 5 mg/day | 4 | 817 | Mean Difference (Fixed, 95% CI) | ‐1.54 [‐2.52, ‐0.57] |
| 6.4 (2 x starting dose) 10 mg/day | 4 | 822 | Mean Difference (Fixed, 95% CI) | ‐1.06 [‐1.86, ‐0.26] |
| 6.5 (4 x starting dose) 20 mg/day | 3 | 652 | Mean Difference (Fixed, 95% CI) | ‐1.53 [‐2.41, ‐0.65] |
| 6.6 (8 x starting dose) 30, 40 mg/day | 2 | 331 | Mean Difference (Fixed, 95% CI) | ‐2.73 [‐3.98, ‐1.49] |
| Outcome or subgroup title | No. of studies | No. of participants | Statistical method | Effect size |
| 1 SBP Show forest plot | 22 | Mean Difference (Fixed, 95% CI) | Subtotals only | |
| 1.1 (0.5 x starting dose) 25 mg/day | 1 | 87 | Mean Difference (Fixed, 95% CI) | ‐7.0 [‐12.55, ‐1.45] |
| 1.2 (starting dose) 50 mg/day | 11 | 669 | Mean Difference (Fixed, 95% CI) | ‐10.28 [‐11.94, ‐8.62] |
| 1.3 (2 x starting dose) 100 mg/day | 12 | 495 | Mean Difference (Fixed, 95% CI) | ‐15.34 [‐16.86, ‐13.82] |
| 1.4 (4 x starting dose) 150 & 200 mg/day | 3 | 121 | Mean Difference (Fixed, 95% CI) | ‐11.29 [‐14.03, ‐8.55] |
| 2 DBP Show forest plot | 22 | Mean Difference (Fixed, 95% CI) | Subtotals only | |
| 2.1 (0.5 x starting dose) 25 mg/day | 1 | 87 | Mean Difference (Fixed, 95% CI) | ‐4.0 [‐6.76, ‐1.24] |
| 2.2 (starting dose) 50 mg/day | 11 | 657 | Mean Difference (Fixed, 95% CI) | ‐7.78 [‐8.80, ‐6.76] |
| 2.3 (2 x starting dose) 100 mg/day | 12 | 495 | Mean Difference (Fixed, 95% CI) | ‐12.91 [‐13.89, ‐11.93] |
| 2.4 (4 x starting dose) 150, 200 mg/day | 3 | 121 | Mean Difference (Fixed, 95% CI) | ‐8.76 [‐10.56, ‐6.95] |
| 3 Heart rate Show forest plot | 17 | Mean Difference (Fixed, 95% CI) | Subtotals only | |
| 3.1 (0.5 x starting dose) 25 mg/day | 1 | 87 | Mean Difference (Fixed, 95% CI) | ‐4.0 [‐9.55, 1.55] |
| 3.2 (starting dose) 50 mg/day | 7 | 470 | Mean Difference (Fixed, 95% CI) | ‐12.04 [‐13.39, ‐10.68] |
| 3.3 (2 x starting dose) 100 mg/day | 10 | 413 | Mean Difference (Fixed, 95% CI) | ‐13.70 [‐14.83, ‐12.56] |
| 3.4 (4 x starting dose) 150, 200 mg/day | 4 | 129 | Mean Difference (Fixed, 95% CI) | ‐18.33 [‐20.26, ‐16.41] |
| 4 Pulse pressure Show forest plot | 22 | Mean Difference (Fixed, 95% CI) | Subtotals only | |
| 4.1 (0.5 x starting dose) 25 mg/day | 1 | 87 | Mean Difference (Fixed, 95% CI) | ‐3.0 [‐7.80, 1.80] |
| 4.2 (starting dose) 50 mg/day | 11 | 669 | Mean Difference (Fixed, 95% CI) | ‐2.30 [‐3.71, ‐0.90] |
| 4.3 (2 x starting dose) 100 mg/day | 12 | 495 | Mean Difference (Fixed, 95% CI) | ‐2.01 [‐3.24, ‐0.77] |
| 4.4 (4 x starting dose) 150, 200 mg/day | 3 | 121 | Mean Difference (Fixed, 95% CI) | ‐2.62 [‐4.82, ‐0.42] |
| Outcome or subgroup title | No. of studies | No. of participants | Statistical method | Effect size |
| 1 SBP Show forest plot | 9 | Mean Difference (Fixed, 95% CI) | Subtotals only | |
| 1.1 (0.25 x starting dose) 25 mg/day | 2 | 424 | Mean Difference (Fixed, 95% CI) | ‐6.33 [‐9.22, ‐3.44] |
| 1.2 (0.5 x starting dose) 50 mg/day | 2 | 339 | Mean Difference (Fixed, 95% CI) | ‐6.30 [‐9.47, ‐3.13] |
| 1.3 (starting dose) 100 mg/day | 3 | 410 | Mean Difference (Fixed, 95% CI) | ‐5.35 [‐8.12, ‐2.58] |
| 1.4 (2 x starting dose) 200 mg/day | 5 | 284 | Mean Difference (Fixed, 95% CI) | ‐11.54 [‐14.37, ‐8.71] |
| 1.5 (4 x starting dose) 400 mg/day | 2 | 193 | Mean Difference (Fixed, 95% CI) | ‐10.91 [‐15.42, ‐6.40] |
| 2 DBP Show forest plot | 9 | Mean Difference (Fixed, 95% CI) | Subtotals only | |
| 2.1 (0.25 x starting dose) 25 mg/day | 2 | 424 | Mean Difference (Fixed, 95% CI) | ‐3.64 [‐5.44, ‐1.85] |
| 2.2 (0.5 x starting dose) 50 mg/day | 2 | 339 | Mean Difference (Fixed, 95% CI) | ‐4.56 [‐6.42, ‐2.70] |
| 2.3 (starting dose) 100 & 120 mg/day | 3 | 410 | Mean Difference (Fixed, 95% CI) | ‐4.74 [‐6.50, ‐2.98] |
| 2.4 (2 x starting dose) 200 mg/day | 5 | 284 | Mean Difference (Fixed, 95% CI) | ‐10.25 [‐11.99, ‐8.51] |
| 2.5 (4 x starting dose) 400 mg/day | 2 | 193 | Mean Difference (Fixed, 95% CI) | ‐7.71 [‐10.72, ‐4.69] |
| 3 Heart rate Show forest plot | 5 | Mean Difference (Fixed, 95% CI) | Subtotals only | |
| 3.1 (0.5 x starting dose) 50 mg/day | 1 | 94 | Mean Difference (Fixed, 95% CI) | ‐5.6 [‐10.03, ‐1.17] |
| 3.2 (starting dose) 100 & 120 mg/day | 1 | 24 | Mean Difference (Fixed, 95% CI) | ‐15.0 [‐18.92, ‐11.08] |
| 3.3 (2 x starting dose) 200 mg/day | 2 | 40 | Mean Difference (Fixed, 95% CI) | ‐13.25 [‐17.04, ‐9.46] |
| 3.4 (4 x starting dose) 400 mg/day | 1 | 8 | Mean Difference (Fixed, 95% CI) | ‐20.00 [‐25.88, ‐14.12] |
| 4 Pulse pressure Show forest plot | 9 | Mean Difference (Fixed, 95% CI) | Subtotals only | |
| 4.1 (0.25 x starting dose) 25 mg/day | 2 | 424 | Mean Difference (Fixed, 95% CI) | ‐2.70 [‐5.23, ‐0.17] |
| 4.2 (0.5 x starting dose) 50 mg/day | 2 | 339 | Mean Difference (Fixed, 95% CI) | ‐1.74 [‐4.52, 1.04] |
| 4.3 (starting dose) 100 mg/day | 3 | 410 | Mean Difference (Fixed, 95% CI) | ‐0.58 [‐3.01, 1.85] |
| 4.4 (2 x starting dose) 200 mg/day | 5 | 284 | Mean Difference (Fixed, 95% CI) | ‐1.22 [‐3.62, 1.18] |
| 4.5 (4 x starting dose) 400 mg/day | 2 | 193 | Mean Difference (Fixed, 95% CI) | ‐3.30 [‐7.29, 0.69] |
| Outcome or subgroup title | No. of studies | No. of participants | Statistical method | Effect size |
| 1 SBP Show forest plot | 6 | Mean Difference (Fixed, 95% CI) | Subtotals only | |
| 1.1 (starting dose) 5 mg/day | 5 | 422 | Mean Difference (Fixed, 95% CI) | ‐11.40 [‐13.67, ‐9.13] |
| 1.2 (2 x starting dose) 10 mg/day | 2 | 134 | Mean Difference (Fixed, 95% CI) | ‐7.03 [‐11.07, ‐2.99] |
| 1.3 (4 x starting dose) 20 mg/day | 1 | 121 | Mean Difference (Fixed, 95% CI) | ‐7.6 [‐12.60, ‐2.60] |
| 2 DBP Show forest plot | 7 | Mean Difference (Fixed, 95% CI) | Subtotals only | |
| 2.1 (starting dose) 5 mg/day | 6 | 462 | Mean Difference (Fixed, 95% CI) | ‐8.16 [‐9.49, ‐6.84] |
| 2.2 (2 x starting dose) 10 mg/day | 3 | 173 | Mean Difference (Fixed, 95% CI) | ‐7.44 [‐9.88, ‐5.01] |
| 2.3 (4 x starting dose) 20 mg/day | 1 | 121 | Mean Difference (Fixed, 95% CI) | ‐8.5 [‐11.56, ‐5.44] |
| 3 Heart rate Show forest plot | 6 | Mean Difference (Fixed, 95% CI) | Subtotals only | |
| 3.1 (starting dose) 5 mg/day | 5 | 236 | Mean Difference (Fixed, 95% CI) | ‐6.91 [‐8.82, ‐4.99] |
| 3.2 (2 x starting dose) 10 mg/day | 3 | 173 | Mean Difference (Fixed, 95% CI) | ‐10.19 [‐12.87, ‐7.52] |
| 3.3 (4 x starting dose) 20 mg/day | 1 | 121 | Mean Difference (Fixed, 95% CI) | ‐11.1 [‐14.98, ‐7.22] |
| 4 Pulse pressure Show forest plot | 6 | Mean Difference (Fixed, 95% CI) | Subtotals only | |
| 4.1 (starting dose) 5 mg/day | 5 | 422 | Mean Difference (Fixed, 95% CI) | ‐3.35 [‐5.32, ‐1.38] |
| 4.2 (2 x starting dose) 10 mg/day | 2 | 134 | Mean Difference (Fixed, 95% CI) | 1.65 [‐1.96, 5.26] |
| 4.3 (4 x starting dose) 20 mg/day | 1 | 121 | Mean Difference (Fixed, 95% CI) | 0.9 [‐3.45, 5.25] |
| Outcome or subgroup title | No. of studies | No. of participants | Statistical method | Effect size |
| 1 SBP Show forest plot | 2 | Mean Difference (Fixed, 95% CI) | Subtotals only | |
| 1.1 (0.5 x starting dose) 5 mg/day | 1 | 148 | Mean Difference (Fixed, 95% CI) | ‐5.81 [‐10.55, ‐1.07] |
| 1.2 (starting dose) 10 mg/day | 1 | 146 | Mean Difference (Fixed, 95% CI) | ‐8.2 [‐12.94, ‐3.46] |
| 1.3 (2 x starting dose) 20 mg/day | 2 | 477 | Mean Difference (Fixed, 95% CI) | ‐11.25 [‐13.21, ‐9.29] |
| 2 DBP Show forest plot | 2 | Mean Difference (Fixed, 95% CI) | Subtotals only | |
| 2.1 (0.5 x starting dose) 5 mg/day | 1 | 148 | Mean Difference (Fixed, 95% CI) | ‐3.8 [‐6.54, ‐1.06] |
| 2.2 (starting dose) 10 mg/day | 1 | 146 | Mean Difference (Fixed, 95% CI) | ‐6.5 [‐9.24, ‐3.76] |
| 2.3 (2 x starting dose) 20 mg/day | 2 | 477 | Mean Difference (Fixed, 95% CI) | ‐7.94 [‐9.17, ‐6.71] |
| 3 Heart rate Show forest plot | 2 | Mean Difference (Fixed, 95% CI) | Subtotals only | |
| 3.1 (0.5 x starting dose) 5 mg/day | 1 | 148 | Mean Difference (Fixed, 95% CI) | ‐7.4 [‐10.34, ‐4.46] |
| 3.2 (starting dose) 10 mg/day | 1 | 146 | Mean Difference (Fixed, 95% CI) | ‐8.2 [‐11.14, ‐5.26] |
| 3.3 (2 x starting dose) 20 mg/day | 2 | 477 | Mean Difference (Fixed, 95% CI) | ‐13.40 [‐15.03, ‐11.77] |
| 4 Pulse pressure Show forest plot | 2 | Mean Difference (Fixed, 95% CI) | Subtotals only | |
| 4.1 (0.5x starting dose) 5 mg/day | 1 | 148 | Mean Difference (Fixed, 95% CI) | ‐1.1 [‐5.24, 3.04] |
| 4.2 (starting dose) 10 mg/day | 1 | 146 | Mean Difference (Fixed, 95% CI) | ‐1.7 [‐5.84, 2.44] |
| 4.3 (2 x starting dose) 20 mg/day | 2 | 477 | Mean Difference (Fixed, 95% CI) | ‐3.26 [‐5.00, ‐1.52] |
| Outcome or subgroup title | No. of studies | No. of participants | Statistical method | Effect size |
| 1 SBP Show forest plot | 1 | Mean Difference (IV, Fixed, 95% CI) | Subtotals only | |
| 1.1 Bevantolol 100mg/day | 1 | 35 | Mean Difference (IV, Fixed, 95% CI) | ‐13.0 [‐29.57, 3.57] |
| 1.2 Bevantolol 200mg/day | 1 | 35 | Mean Difference (IV, Fixed, 95% CI) | ‐9.0 [‐25.57, 7.57] |
| 1.3 Bevantolol 300mg/day | 1 | 35 | Mean Difference (IV, Fixed, 95% CI) | ‐7.0 [‐23.57, 9.57] |
| 1.4 Bevantolol 400mg/day | 1 | 35 | Mean Difference (IV, Fixed, 95% CI) | ‐8.0 [‐24.57, 8.57] |
| 2 DBP Show forest plot | 1 | Mean Difference (IV, Fixed, 95% CI) | Subtotals only | |
| 2.1 Bevantolol 100mg/day | 1 | 35 | Mean Difference (IV, Fixed, 95% CI) | ‐5.0 [‐15.52, 5.52] |
| 2.2 Bevantolol 200mg/day | 1 | 35 | Mean Difference (IV, Fixed, 95% CI) | ‐9.0 [‐19.52, 1.52] |
| 2.3 Bevantolol 300mg/day | 1 | 35 | Mean Difference (IV, Fixed, 95% CI) | ‐9.0 [‐19.52, 1.52] |
| 2.4 Bevantolol 400mg/day | 1 | 35 | Mean Difference (IV, Fixed, 95% CI) | ‐10.0 [‐20.52, 0.52] |
| 3 Heart rate Show forest plot | 1 | Mean Difference (IV, Fixed, 95% CI) | Subtotals only | |
| 3.1 Bevantolol 100mg/day | 1 | 35 | Mean Difference (IV, Fixed, 95% CI) | ‐13.0 [‐29.57, 3.57] |
| 3.2 Bevantolol 200mg/day | 1 | 35 | Mean Difference (IV, Fixed, 95% CI) | ‐9.0 [‐25.57, 7.57] |
| 3.3 Bevantolol 300mg/day | 1 | 35 | Mean Difference (IV, Fixed, 95% CI) | ‐7.0 [‐23.57, 9.57] |
| 3.4 Bevantolol 400mg/day | 1 | 35 | Mean Difference (IV, Fixed, 95% CI) | ‐8.0 [‐24.57, 8.57] |
| 4 Pulse pressure Show forest plot | 1 | Mean Difference (Fixed, 95% CI) | Subtotals only | |
| 4.1 Bevantolol 100mg/day | 1 | Mean Difference (Fixed, 95% CI) | ‐8.0 [‐22.52, 6.52] | |
| 4.2 Bevantolol 200mg/day | 1 | Mean Difference (Fixed, 95% CI) | 0.0 [‐14.52, 14.52] | |
| 4.3 Bevantolol 300mg/day | 1 | Mean Difference (Fixed, 95% CI) | 2.0 [‐12.56, 16.56] | |
| 4.4 Bevantolol 400mg/day | 1 | Mean Difference (Fixed, 95% CI) | 2.0 [‐12.52, 16.52] | |
| Outcome or subgroup title | No. of studies | No. of participants | Statistical method | Effect size |
| 1 SBP Show forest plot | 2 | Mean Difference (IV, Fixed, 95% CI) | Subtotals only | |
| 1.1 25 mg/day | 1 | 21 | Mean Difference (IV, Fixed, 95% CI) | 3.0 [‐11.79, 17.79] |
| 1.2 50 mg/day | 2 | 33 | Mean Difference (IV, Fixed, 95% CI) | ‐5.94 [‐17.57, 5.68] |
| 1.3 100 mg/day | 1 | 14 | Mean Difference (IV, Fixed, 95% CI) | ‐6.0 [‐22.94, 10.94] |
| 2 DBP Show forest plot | 2 | Mean Difference (IV, Fixed, 95% CI) | Subtotals only | |
| 2.1 25 mg/day | 1 | 21 | Mean Difference (IV, Fixed, 95% CI) | ‐8.0 [‐16.73, 0.73] |
| 2.2 50 mg/day | 2 | 33 | Mean Difference (IV, Fixed, 95% CI) | ‐4.41 [‐11.22, 2.40] |
| 2.3 100 mg/day | 1 | 14 | Mean Difference (IV, Fixed, 95% CI) | ‐2.0 [‐12.75, 8.75] |
| 3 Heart rate Show forest plot | 2 | Mean Difference (IV, Fixed, 95% CI) | Subtotals only | |
| 3.1 25 mg/day | 1 | 21 | Mean Difference (IV, Fixed, 95% CI) | ‐3.0 [‐12.93, 6.93] |
| 3.2 50 mg/day | 2 | 33 | Mean Difference (IV, Fixed, 95% CI) | ‐8.14 [‐15.91, ‐0.36] |
| 3.3 100 mg/day | 1 | 14 | Mean Difference (IV, Fixed, 95% CI) | ‐20.0 [‐32.60, ‐7.40] |
| 4 Pulse pressure Show forest plot | 2 | Mean Difference (Fixed, 95% CI) | Subtotals only | |
| 4.1 25 mg/day | 1 | 21 | Mean Difference (Fixed, 95% CI) | 11.0 [‐1.82, 23.82] |
| 4.2 50 mg/day | 2 | 33 | Mean Difference (Fixed, 95% CI) | ‐1.75 [‐11.86, 8.37] |
| 4.3 100 mg/day | 1 | 14 | Mean Difference (Fixed, 95% CI) | ‐4.0 [‐18.86, 10.86] |
| Outcome or subgroup title | No. of studies | No. of participants | Statistical method | Effect size |
| 1 SBP Show forest plot | 1 | 24 | Mean Difference (Fixed, 95% CI) | ‐21.2 [‐29.31, ‐13.09] |
| 1.1 Practolol 600mg/day | 1 | 24 | Mean Difference (Fixed, 95% CI) | ‐21.2 [‐29.31, ‐13.09] |
| 2 DBP Show forest plot | 1 | 24 | Mean Difference (Fixed, 95% CI) | ‐13.9 [‐17.00, ‐8.80] |
| 2.1 Practolol 600mg/day | 1 | 24 | Mean Difference (Fixed, 95% CI) | ‐13.9 [‐17.00, ‐8.80] |
| 3 Heart rate Show forest plot | 1 | 24 | Mean Difference (Fixed, 95% CI) | ‐14.0 [‐21.45, ‐6.55] |
| 3.1 Practolol 600mg/day | 1 | 24 | Mean Difference (Fixed, 95% CI) | ‐14.0 [‐21.45, ‐6.55] |
| 4 Pulse pressure Show forest plot | 1 | 24 | Mean Difference (Fixed, 95% CI) | ‐7.30 [‐14.41, ‐0.19] |
| 4.1 Practolol 600mg/day | 1 | 24 | Mean Difference (Fixed, 95% CI) | ‐7.30 [‐14.41, ‐0.19] |
| Outcome or subgroup title | No. of studies | No. of participants | Statistical method | Effect size |
| 1 SBP Show forest plot | 50 | Mean Difference (Fixed, 95% CI) | Subtotals only | |
| 1.1 0.25 x starting dose | 5 | 790 | Mean Difference (Fixed, 95% CI) | ‐5.34 [‐7.29, ‐3.38] |
| 1.2 0.5 x starting dose | 7 | 941 | Mean Difference (Fixed, 95% CI) | ‐5.71 [‐7.59, ‐3.82] |
| 1.3 starting dose | 30 | 2879 | Mean Difference (Fixed, 95% CI) | ‐9.29 [‐10.21, ‐8.38] |
| 1.4 2 x starting dose | 27 | 3026 | Mean Difference (Fixed, 95% CI) | ‐10.58 [‐11.45, ‐9.71] |
| 1.5 4 x starting dose | 9 | 1087 | Mean Difference (Fixed, 95% CI) | ‐8.90 [‐10.47, ‐7.34] |
| 1.6 8 x starting dose | 2 | 331 | Mean Difference (Fixed, 95% CI) | ‐8.29 [‐11.24, ‐5.35] |
| 2 DBP Show forest plot | 51 | Mean Difference (Fixed, 95% CI) | Subtotals only | |
| 2.1 0.25 x starting dose | 5 | 790 | Mean Difference (Fixed, 95% CI) | ‐3.59 [‐4.79, ‐2.39] |
| 2.2 0.5 x starting dose | 7 | 941 | Mean Difference (Fixed, 95% CI) | ‐4.27 [‐5.31, ‐3.22] |
| 2.3 starting dose | 31 | 2907 | Mean Difference (Fixed, 95% CI) | ‐7.06 [‐7.62, ‐6.51] |
| 2.4 2 x starting dose | 28 | 3065 | Mean Difference (Fixed, 95% CI) | ‐8.92 [‐9.47, ‐8.38] |
| 2.5 4 x starting dose | 9 | 1087 | Mean Difference (Fixed, 95% CI) | ‐7.17 [‐8.15, ‐6.18] |
| 2.6 8 x starting dose | 2 | 331 | Mean Difference (Fixed, 95% CI) | ‐7.20 [‐8.99, ‐5.40] |
| 3 Heart rate Show forest plot | 37 | Mean Difference (Fixed, 95% CI) | Subtotals only | |
| 3.1 0.25 x starting dose | 1 | 136 | Mean Difference (Fixed, 95% CI) | ‐2.9 [‐5.86, 0.06] |
| 3.2 0.5 x starting dose | 5 | 499 | Mean Difference (Fixed, 95% CI) | ‐4.34 [‐6.21, ‐2.47] |
| 3.3 starting dose | 20 | 1315 | Mean Difference (Fixed, 95% CI) | ‐9.80 [‐10.65, ‐8.94] |
| 3.4 2 x starting dose | 20 | 2175 | Mean Difference (Fixed, 95% CI) | ‐11.33 [‐12.06, ‐10.61] |
| 3.5 4 x starting dose | 8 | 556 | Mean Difference (Fixed, 95% CI) | ‐13.71 [‐15.00, ‐12.43] |
| 3.6 8 x starting dose | 2 | 331 | Mean Difference (Fixed, 95% CI) | ‐9.19 [‐11.21, ‐7.18] |
| 4 Pulse pressure Show forest plot | 50 | Mean Difference (Fixed, 95% CI) | Subtotals only | |
| 4.1 0.25 x starting dose | 5 | 790 | Mean Difference (Fixed, 95% CI) | ‐1.72 [‐3.43, ‐0.00] |
| 4.2 0.5 x starting dose | 7 | 941 | Mean Difference (Fixed, 95% CI) | ‐1.48 [‐3.13, 0.17] |
| 4.3 starting dose | 30 | 2913 | Mean Difference (Fixed, 95% CI) | 0.00 [‐2.78, ‐1.22] |
| 4.4 2 x starting dose | 27 | 3026 | Mean Difference (Fixed, 95% CI) | ‐1.39 [‐2.14, ‐0.65] |
| 4.5 4 x starting dose | 9 | 1087 | Mean Difference (Fixed, 95% CI) | ‐1.80 [‐3.16, ‐0.44] |
| 4.6 8 x starting dose | 2 | 331 | Mean Difference (Fixed, 95% CI) | ‐1.04 [‐3.67, 1.60] |
| 5 WDAE Show forest plot | 3 | 2618 | Risk Ratio (M‐H, Fixed, 95% CI) | 0.85 [0.50, 1.45] |
| 6 SBP combined starting dose and 2 x starting dose Show forest plot | 47 | 5246 | Mean Difference (Fixed, 95% CI) | ‐10.42 [‐11.11, ‐9.72] |
| 6.1 starting dose | 30 | 2509 | Mean Difference (Fixed, 95% CI) | ‐9.71 [‐10.75, ‐8.67] |
| 6.2 2 x starting dose | 27 | 2737 | Mean Difference (Fixed, 95% CI) | ‐10.99 [‐11.93, ‐10.06] |
| 7 DBP combined starting dose and 2 x starting dose Show forest plot | 48 | 5316 | Mean Difference (Fixed, 95% CI) | ‐8.27 [‐8.69, ‐7.84] |
| 7.1 starting dose | 31 | 2540 | Mean Difference (Fixed, 95% CI) | ‐7.23 [‐7.85, ‐6.60] |
| 7.2 2x starting dose | 28 | 2776 | Mean Difference (Fixed, 95% CI) | ‐9.16 [‐9.74, ‐8.58] |
| 8 Heart rate combined starting dose and 2 x starting dose Show forest plot | 33 | 3407 | Mean Difference (Fixed, 95% CI) | ‐10.93 [‐11.48, ‐10.37] |
| 8.1 starting dose | 20 | 1268 | Mean Difference (Fixed, 95% CI) | ‐10.03 [‐10.90, ‐9.17] |
| 8.2 2 x starting dose | 20 | 2139 | Mean Difference (Fixed, 95% CI) | ‐11.57 [‐12.30, ‐10.84] |
| 9 Pulse pressure combined starting dose and 2 x starting dose Show forest plot | 47 | 5246 | Mean Difference (Fixed, 95% CI) | ‐1.76 [‐2.34, ‐1.19] |
| 9.1 starting dose | 30 | 2509 | Mean Difference (Fixed, 95% CI) | ‐2.09 [‐2.94, ‐1.23] |
| 9.2 2 x starting dose | 27 | 2737 | Mean Difference (Fixed, 95% CI) | ‐1.49 [‐2.27, ‐0.71] |
| 10 SBP test for 2 x starting dose subgroup difference Show forest plot | 26 | 2197 | Mean Difference (Fixed, 95% CI) | ‐11.27 [‐12.22, ‐10.32] |
| 10.1 Atenolol | 12 | 495 | Mean Difference (Fixed, 95% CI) | ‐15.34 [‐16.86, ‐13.82] |
| 10.2 Nebivolol | 5 | 855 | Mean Difference (Fixed, 95% CI) | ‐5.26 [‐7.19, ‐3.34] |
| 10.3 Metoprolol | 5 | 284 | Mean Difference (Fixed, 95% CI) | ‐11.54 [‐14.37, ‐8.71] |
| 10.4 Bisoprolol | 2 | 134 | Mean Difference (Fixed, 95% CI) | ‐7.03 [‐11.07, ‐2.99] |
| 10.5 Betaxolol | 2 | 429 | Mean Difference (Fixed, 95% CI) | ‐11.63 [‐13.73, ‐9.53] |
| 11 DBP test for 2 x starting dose subgroup difference Show forest plot | 27 | 2236 | Mean Difference (Fixed, 95% CI) | ‐9.47 [‐10.06, ‐8.88] |
| 11.1 Atenolol | 12 | 495 | Mean Difference (Fixed, 95% CI) | ‐12.91 [‐13.89, ‐11.93] |
| 11.2 Nebivolol | 5 | 855 | Mean Difference (Fixed, 95% CI) | ‐5.82 [‐6.99, ‐4.65] |
| 11.3 Metoprolol | 5 | 284 | Mean Difference (Fixed, 95% CI) | ‐10.25 [‐11.99, ‐8.51] |
| 11.4 Bisoprolol | 3 | 173 | Mean Difference (Fixed, 95% CI) | ‐7.44 [‐9.88, ‐5.01] |
| 11.5 Betaxolol | 2 | 429 | Mean Difference (Fixed, 95% CI) | ‐8.08 [‐9.39, ‐6.77] |
| 12 Heart rate test for 2 x starting dose subgroup difference Show forest plot | 19 | 1346 | Mean Difference (Fixed, 95% CI) | ‐12.24 [‐13.05, ‐11.42] |
| 12.1 Atenolol | 10 | 413 | Mean Difference (Fixed, 95% CI) | ‐13.70 [‐14.83, ‐12.56] |
| 12.2 Nebivolol | 2 | 291 | Mean Difference (Fixed, 95% CI) | ‐5.94 [‐7.98, ‐3.90] |
| 12.3 Metoprolol | 2 | 40 | Mean Difference (Fixed, 95% CI) | ‐13.25 [‐17.04, ‐9.46] |
| 12.4 Bisoprolol | 3 | 173 | Mean Difference (Fixed, 95% CI) | ‐10.19 [‐12.87, ‐7.52] |
| 12.5 Betaxolol | 2 | 429 | Mean Difference (Fixed, 95% CI) | ‐14.43 [‐16.35, ‐12.51] |