| 1 SBP Show forest plot | 3 | | Mean Difference (Fixed, 95% CI) | Subtotals only |
|
| 1.1 (starting dose) 200 mg/day | 3 | 171 | Mean Difference (Fixed, 95% CI) | ‐7.86 [‐11.88, ‐3.84] |
| 1.2 (2x starting) 400 mg/day | 2 | 120 | Mean Difference (Fixed, 95% CI) | ‐8.59 [‐13.41, ‐3.77] |
| 1.3 (4x starting) 600 mg/day | 1 | 90 | Mean Difference (Fixed, 95% CI) | ‐10.0 [‐16.47, ‐3.53] |
| 2 DBP Show forest plot | 3 | | Mean Difference (Fixed, 95% CI) | Subtotals only |
|
| 2.1 (starting dose) 200 mg/day | 3 | 171 | Mean Difference (Fixed, 95% CI) | ‐4.57 [‐6.62, ‐2.53] |
| 2.2 (2x starting) 400 mg/day | 2 | 120 | Mean Difference (Fixed, 95% CI) | ‐4.88 [‐7.25, ‐2.52] |
| 2.3 (4x starting) 600 mg/day | 1 | 90 | Mean Difference (Fixed, 95% CI) | ‐6.0 [‐9.49, ‐2.51] |
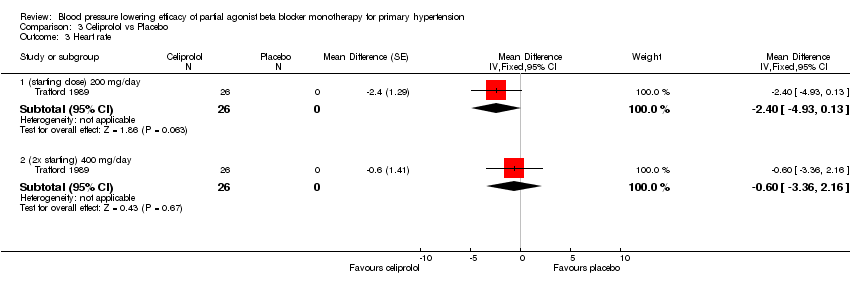
| 3 Heart rate Show forest plot | 1 | | Mean Difference (Fixed, 95% CI) | Subtotals only |
|
| 3.1 (starting dose) 200 mg/day | 1 | 26 | Mean Difference (Fixed, 95% CI) | ‐2.4 [‐4.93, 0.13] |
| 3.2 (2x starting) 400 mg/day | 1 | 26 | Mean Difference (Fixed, 95% CI) | ‐0.6 [‐3.36, 2.16] |
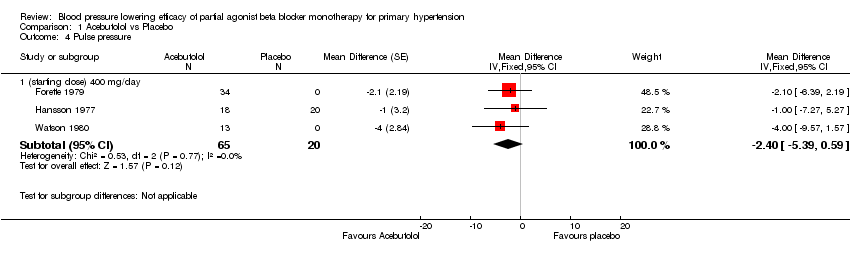
| 4 Pulse pressure Show forest plot | 3 | | Mean Difference (Fixed, 95% CI) | Subtotals only |
|
| 4.1 (starting dose) 200 mg/day | 3 | 171 | Mean Difference (Fixed, 95% CI) | ‐3.76 [‐7.26, ‐0.25] |
| 4.2 (2x starting) 400 mg/day | 2 | 120 | Mean Difference (Fixed, 95% CI) | ‐3.89 [‐8.09, 0.32] |
| 4.3 (4x starting) 600 mg/day | 1 | 90 | Mean Difference (Fixed, 95% CI) | ‐4.0 [‐9.59, 1.59] |
| 5 SBP dose comparison Show forest plot | 2 | | Mean Difference (Fixed, 95% CI) | Subtotals only |
|
| 5.1 200 mg/day | 2 | 80 | Mean Difference (Fixed, 95% CI) | ‐7.42 [‐12.15, ‐2.69] |
| 5.2 400 mg/day | 2 | 85 | Mean Difference (Fixed, 95% CI) | ‐8.59 [‐13.41, ‐3.77] |
| 6 DBP dose comparison Show forest plot | 2 | | Mean Difference (Fixed, 95% CI) | Subtotals only |
|
| 6.1 200 mg/day | 2 | 80 | Mean Difference (Fixed, 95% CI) | ‐5.09 [‐7.34, ‐2.85] |
| 6.2 400 mg/day | 2 | 85 | Mean Difference (Fixed, 95% CI) | ‐4.88 [‐7.25, ‐2.52] |