Eficacia hipotensora de la monoterapia con betabloqueantes agonistas parciales para la hipertensión primaria
Información
- DOI:
- https://doi.org/10.1002/14651858.CD007450.pub2Copiar DOI

- Base de datos:
-
- Cochrane Database of Systematic Reviews
- Versión publicada:
-
- 27 noviembre 2014see what's new
- Tipo:
-
- Intervention
- Etapa:
-
- Review
- Grupo Editorial Cochrane:
-
Grupo Cochrane de Hipertensión
- Copyright:
-
- Copyright © 2014 The Cochrane Collaboration. Published by John Wiley & Sons, Ltd.
Cifras del artículo
Altmetric:
Citado por:
Autores
Contributions of authors
James Wright formulated the idea for the review and developed the basis for the protocol.
Gavin Wong took the lead role in searching, identifying and assessing studies, in data extraction and analyses, and in writing up the review.
Heidi Boyda aided in the data extraction process and approved the final draft of the manuscript.
Sources of support
Internal sources
-
University of British Columbia, Department of Anesthesiology, Pharmacology & Therapeutics, Canada.
External sources
-
Canadian Institutes of Health Research, Canada.
Declarations of interest
James Wright: nothing to declare.
Gavin Wong: nothing to declare.
Heidi Boyda: nothing to declare.
Acknowledgements
The authors would like to acknowledge the help provided by the Cochrane Hypertension Group. Research assistant of Therapeutics Initiative, Stephen Adams, retrieved the full text from library for the authors.
Version history
| Published | Title | Stage | Authors | Version |
| 2014 Nov 27 | Blood pressure lowering efficacy of partial agonist beta blocker monotherapy for primary hypertension | Review | Gavin WK Wong, Heidi N Boyda, James M Wright | |
| 2008 Oct 08 | Blood pressure lowering efficacy of partial agonist beta blockers for primary hypertension | Protocol | Gavin WK Wong, Alexandra Laugerotte, James M Wright | |
Keywords
MeSH
Medical Subject Headings (MeSH) Keywords
Medical Subject Headings Check Words
Humans;
PICO

Study flow diagram

'Risk of bias' summary: review authors' judgements about each risk of bias item for each included study

Comparison 1 Acebutolol vs Placebo, Outcome 1 SBP.

Comparison 1 Acebutolol vs Placebo, Outcome 2 DBP.

Comparison 1 Acebutolol vs Placebo, Outcome 3 Heart rate.
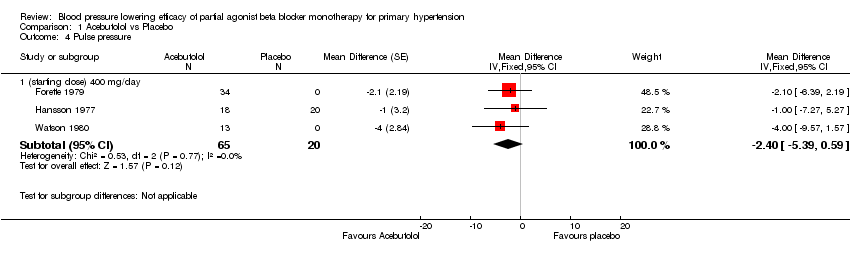
Comparison 1 Acebutolol vs Placebo, Outcome 4 Pulse pressure.

Comparison 2 Pindolol vs Placebo, Outcome 1 SBP.

Comparison 2 Pindolol vs Placebo, Outcome 2 DBP.

Comparison 2 Pindolol vs Placebo, Outcome 3 Heart rate.

Comparison 2 Pindolol vs Placebo, Outcome 4 Pulse pressure.

Comparison 3 Celiprolol vs Placebo, Outcome 1 SBP.

Comparison 3 Celiprolol vs Placebo, Outcome 2 DBP.
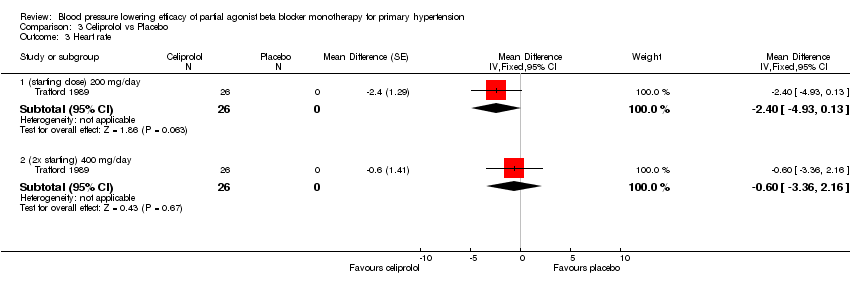
Comparison 3 Celiprolol vs Placebo, Outcome 3 Heart rate.

Comparison 3 Celiprolol vs Placebo, Outcome 4 Pulse pressure.

Comparison 3 Celiprolol vs Placebo, Outcome 5 SBP dose comparison.

Comparison 3 Celiprolol vs Placebo, Outcome 6 DBP dose comparison.

Comparison 4 Alprenolol vs Placebo, Outcome 1 SBP.

Comparison 4 Alprenolol vs Placebo, Outcome 2 DBP.

Comparison 4 Alprenolol vs Placebo, Outcome 3 Heart rate.

Comparison 4 Alprenolol vs Placebo, Outcome 4 Pulse pressure.

Comparison 5 Bopindolol vs Placebo, Outcome 1 SBP.

Comparison 5 Bopindolol vs Placebo, Outcome 2 DBP.

Comparison 5 Bopindolol vs Placebo, Outcome 3 Heart rate.

Comparison 5 Bopindolol vs Placebo, Outcome 4 Pulse pressure.

Comparison 5 Bopindolol vs Placebo, Outcome 5 WDAE.

Comparison 6 Oxprenolol vs Placebo, Outcome 1 SBP.

Comparison 6 Oxprenolol vs Placebo, Outcome 2 DBP.

Comparison 6 Oxprenolol vs Placebo, Outcome 3 Pulse pressure.

Comparison 7 Pooled partial agonist effects, Outcome 1 SBP.

Comparison 7 Pooled partial agonist effects, Outcome 2 DBP.

Comparison 7 Pooled partial agonist effects, Outcome 3 Heart rate.

Comparison 7 Pooled partial agonist effects, Outcome 4 Pulse Pressure.

Comparison 7 Pooled partial agonist effects, Outcome 5 WDAE.

Comparison 7 Pooled partial agonist effects, Outcome 6 Combined starting and twice the starting dose.
| Blood pressure lowering effects of partial agonists compared with placebo for primary hypertension | |||
| Patient or population: Adults with primary hypertension Intervention: Partial agonists Comparison: Placebo | |||
| Outcomes | Mean estimates of 1x and 2x starting dose | No of Participants | Quality of the evidence |
| Decrease in systolic blood pressure | ‐8.1 [‐10.1 to ‐6.1]1,2,3,4 | 490 (10) | Very low5,6,7 |
| Decrease in diastolic blood pressure | ‐4.0 [‐5.1 to ‐2.9]1,2,3,4 | 490 (10) | Very low5,6,7 |
| Decrease in heart rate | ‐4.9 [‐6.2 to ‐3.7]2,3 | 256 (7) | Very low5,6,7 |
| Decrease in pulse pressure | ‐3.6 [‐5.3 to ‐1.9]1,2 | 490 (10) | Very low5,6,7,8 |
| Withdrawal due to adverse effect | RR [95%CI]: 0.72 [0.07 to 7.67]9 | 117 (1) | Very low5,6,10 |
| 95% CI: 95% confidence interval; RR: relative risk | |||
| GRADE Working Group grades of evidence | |||
| Footnotes | |||
|
| |||
| Outcome or subgroup title | No. of studies | No. of participants | Statistical method | Effect size |
| 1 SBP Show forest plot | 3 | Mean Difference (Fixed, 95% CI) | Subtotals only | |
| 1.1 (starting dose) 400mg/day | 3 | 85 | Mean Difference (Fixed, 95% CI) | ‐5.12 [‐8.85, ‐1.40] |
| 2 DBP Show forest plot | 3 | Mean Difference (Fixed, 95% CI) | Subtotals only | |
| 2.1 (starting dose) 400mg/day | 3 | 85 | Mean Difference (Fixed, 95% CI) | ‐1.77 [‐3.88, 0.34] |
| 3 Heart rate Show forest plot | 3 | Mean Difference (Fixed, 95% CI) | Subtotals only | |
| 3.1 (starting dose) 400mg/day | 3 | 85 | Mean Difference (Fixed, 95% CI) | ‐8.68 [‐10.85, ‐6.51] |
| 4 Pulse pressure Show forest plot | 3 | Mean Difference (Fixed, 95% CI) | Subtotals only | |
| 4.1 (starting dose) 400 mg/day | 3 | 85 | Mean Difference (Fixed, 95% CI) | ‐2.40 [‐5.39, 0.59] |
| Outcome or subgroup title | No. of studies | No. of participants | Statistical method | Effect size |
| 1 SBP Show forest plot | 3 | Mean Difference (Fixed, 95% CI) | Subtotals only | |
| 1.1 (starting dose) 10 mg/day | 2 | 29 | Mean Difference (Fixed, 95% CI) | ‐14.46 [‐19.84, ‐9.08] |
| 1.2 (4x starting) 30 mg/day | 1 | 16 | Mean Difference (Fixed, 95% CI) | ‐12.5 [‐20.16, ‐4.84] |
| 2 DBP Show forest plot | 3 | Mean Difference (Fixed, 95% CI) | Subtotals only | |
| 2.1 (starting dose) 10 mg/day | 2 | 29 | Mean Difference (Fixed, 95% CI) | ‐6.88 [‐10.15, ‐3.61] |
| 2.2 (4x starting) 30 mg/day | 1 | 16 | Mean Difference (Fixed, 95% CI) | ‐8.8 [‐14.80, ‐2.80] |
| 3 Heart rate Show forest plot | 2 | Mean Difference (Fixed, 95% CI) | Subtotals only | |
| 3.1 (starting dose) 10 mg/day | 2 | 29 | Mean Difference (Fixed, 95% CI) | ‐5.91 [‐9.50, ‐2.32] |
| 4 Pulse pressure Show forest plot | 3 | Mean Difference (Fixed, 95% CI) | Subtotals only | |
| 4.1 (starting dose)10 mg/day | 2 | 29 | Mean Difference (Fixed, 95% CI) | ‐8.01 [‐12.74, ‐3.29] |
| 4.2 (4x starting) 30 mg/day | 1 | 16 | Mean Difference (Fixed, 95% CI) | ‐3.70 [‐10.34, 2.94] |
| Outcome or subgroup title | No. of studies | No. of participants | Statistical method | Effect size |
| 1 SBP Show forest plot | 3 | Mean Difference (Fixed, 95% CI) | Subtotals only | |
| 1.1 (starting dose) 200 mg/day | 3 | 171 | Mean Difference (Fixed, 95% CI) | ‐7.86 [‐11.88, ‐3.84] |
| 1.2 (2x starting) 400 mg/day | 2 | 120 | Mean Difference (Fixed, 95% CI) | ‐8.59 [‐13.41, ‐3.77] |
| 1.3 (4x starting) 600 mg/day | 1 | 90 | Mean Difference (Fixed, 95% CI) | ‐10.0 [‐16.47, ‐3.53] |
| 2 DBP Show forest plot | 3 | Mean Difference (Fixed, 95% CI) | Subtotals only | |
| 2.1 (starting dose) 200 mg/day | 3 | 171 | Mean Difference (Fixed, 95% CI) | ‐4.57 [‐6.62, ‐2.53] |
| 2.2 (2x starting) 400 mg/day | 2 | 120 | Mean Difference (Fixed, 95% CI) | ‐4.88 [‐7.25, ‐2.52] |
| 2.3 (4x starting) 600 mg/day | 1 | 90 | Mean Difference (Fixed, 95% CI) | ‐6.0 [‐9.49, ‐2.51] |
| 3 Heart rate Show forest plot | 1 | Mean Difference (Fixed, 95% CI) | Subtotals only | |
| 3.1 (starting dose) 200 mg/day | 1 | 26 | Mean Difference (Fixed, 95% CI) | ‐2.4 [‐4.93, 0.13] |
| 3.2 (2x starting) 400 mg/day | 1 | 26 | Mean Difference (Fixed, 95% CI) | ‐0.6 [‐3.36, 2.16] |
| 4 Pulse pressure Show forest plot | 3 | Mean Difference (Fixed, 95% CI) | Subtotals only | |
| 4.1 (starting dose) 200 mg/day | 3 | 171 | Mean Difference (Fixed, 95% CI) | ‐3.76 [‐7.26, ‐0.25] |
| 4.2 (2x starting) 400 mg/day | 2 | 120 | Mean Difference (Fixed, 95% CI) | ‐3.89 [‐8.09, 0.32] |
| 4.3 (4x starting) 600 mg/day | 1 | 90 | Mean Difference (Fixed, 95% CI) | ‐4.0 [‐9.59, 1.59] |
| 5 SBP dose comparison Show forest plot | 2 | Mean Difference (Fixed, 95% CI) | Subtotals only | |
| 5.1 200 mg/day | 2 | 80 | Mean Difference (Fixed, 95% CI) | ‐7.42 [‐12.15, ‐2.69] |
| 5.2 400 mg/day | 2 | 85 | Mean Difference (Fixed, 95% CI) | ‐8.59 [‐13.41, ‐3.77] |
| 6 DBP dose comparison Show forest plot | 2 | Mean Difference (Fixed, 95% CI) | Subtotals only | |
| 6.1 200 mg/day | 2 | 80 | Mean Difference (Fixed, 95% CI) | ‐5.09 [‐7.34, ‐2.85] |
| 6.2 400 mg/day | 2 | 85 | Mean Difference (Fixed, 95% CI) | ‐4.88 [‐7.25, ‐2.52] |
| Outcome or subgroup title | No. of studies | No. of participants | Statistical method | Effect size |
| 1 SBP Show forest plot | 2 | Mean Difference (Fixed, 95% CI) | Subtotals only | |
| 1.1 400 mg/day | 2 | 27 | Mean Difference (Fixed, 95% CI) | ‐16.94 [‐23.86, ‐10.01] |
| 2 DBP Show forest plot | 2 | Mean Difference (Fixed, 95% CI) | Subtotals only | |
| 2.1 400 mg/day | 2 | 27 | Mean Difference (Fixed, 95% CI) | ‐6.73 [‐10.06, ‐3.39] |
| 3 Heart rate Show forest plot | 1 | Mean Difference (Fixed, 95% CI) | Subtotals only | |
| 3.1 400 mg/day | 1 | 16 | Mean Difference (Fixed, 95% CI) | ‐8.0 [‐15.45, ‐0.55] |
| 4 Pulse pressure Show forest plot | 2 | Mean Difference (Fixed, 95% CI) | Subtotals only | |
| 4.1 400 mg/day | 2 | 27 | Mean Difference (Fixed, 95% CI) | ‐8.71 [‐14.77, ‐2.65] |
| Outcome or subgroup title | No. of studies | No. of participants | Statistical method | Effect size |
| 1 SBP Show forest plot | 1 | Mean Difference (IV, Fixed, 95% CI) | Subtotals only | |
| 1.1 0.5 mg/day | 1 | 55 | Mean Difference (IV, Fixed, 95% CI) | ‐5.90 [‐15.77, 3.97] |
| 1.2 1 mg/day | 1 | 60 | Mean Difference (IV, Fixed, 95% CI) | ‐6.10 [‐15.58, 3.38] |
| 1.3 2 mg/day | 1 | 60 | Mean Difference (IV, Fixed, 95% CI) | ‐5.80 [‐14.64, 3.04] |
| 2 DBP Show forest plot | 1 | Mean Difference (IV, Fixed, 95% CI) | Subtotals only | |
| 2.1 0.5 mg/day | 1 | 55 | Mean Difference (IV, Fixed, 95% CI) | ‐1.5 [‐6.84, 3.84] |
| 2.2 1 mg/day | 1 | 60 | Mean Difference (IV, Fixed, 95% CI) | ‐4.0 [‐9.05, 1.05] |
| 2.3 2 mg/day | 1 | 60 | Mean Difference (IV, Fixed, 95% CI) | ‐2.40 [‐7.24, 2.44] |
| 3 Heart rate Show forest plot | 1 | Mean Difference (IV, Fixed, 95% CI) | Subtotals only | |
| 3.1 0.5 mg/day | 1 | 55 | Mean Difference (IV, Fixed, 95% CI) | ‐2.23 [‐7.33, 2.87] |
| 3.2 1 mg/day | 1 | 60 | Mean Difference (IV, Fixed, 95% CI) | ‐5.57 [‐10.13, ‐1.01] |
| 3.3 2 mg/day | 1 | 60 | Mean Difference (IV, Fixed, 95% CI) | ‐6.06 [‐10.21, ‐1.91] |
| 4 Pulse pressure Show forest plot | 1 | Mean Difference (Fixed, 95% CI) | Subtotals only | |
| 4.1 0.5 mg/day | 1 | 55 | Mean Difference (Fixed, 95% CI) | ‐4.8 [‐13.35, 3.75] |
| 4.2 1 mg/day | 1 | 60 | Mean Difference (Fixed, 95% CI) | ‐2.1 [‐10.39, 6.19] |
| 4.3 2 mg/day | 1 | 60 | Mean Difference (Fixed, 95% CI) | ‐3.4 [‐11.06, 4.26] |
| 5 WDAE Show forest plot | 1 | 117 | Risk Ratio (M‐H, Fixed, 95% CI) | 0.72 [0.07, 7.67] |
| Outcome or subgroup title | No. of studies | No. of participants | Statistical method | Effect size |
| 1 SBP Show forest plot | 1 | Mean Difference (IV, Fixed, 95% CI) | Subtotals only | |
| 1.1 (0.25x starting) 20 mg/day | 1 | 26 | Mean Difference (IV, Fixed, 95% CI) | 3.40 [‐8.57, 15.37] |
| 1.2 (0.5x starting) 40 mg/day | 1 | 27 | Mean Difference (IV, Fixed, 95% CI) | ‐6.20 [‐17.93, 5.53] |
| 1.3 (starting dose) 60 & 80 mg/day | 1 | 39 | Mean Difference (IV, Fixed, 95% CI) | ‐11.50 [‐21.60, ‐1.40] |
| 2 DBP Show forest plot | 1 | Mean Difference (IV, Fixed, 95% CI) | Subtotals only | |
| 2.1 (0.25x starting) 20 mg/day | 1 | 26 | Mean Difference (IV, Fixed, 95% CI) | 4.2 [‐2.33, 10.73] |
| 2.2 (0.5x starting) 40 mg/day | 1 | 27 | Mean Difference (IV, Fixed, 95% CI) | 0.40 [‐6.02, 6.82] |
| 2.3 (starting dose) 60 & 80 mg/day | 1 | 39 | Mean Difference (IV, Fixed, 95% CI) | ‐3.30 [‐8.94, 2.34] |
| 3 Pulse pressure Show forest plot | 1 | Mean Difference (Fixed, 95% CI) | Subtotals only | |
| 3.1 (0.25x starting) 20 mg/day | 1 | 26 | Mean Difference (Fixed, 95% CI) | 5.3 [‐5.11, 15.71] |
| 3.2 (0.5x starting) 40 mg/day | 1 | 27 | Mean Difference (Fixed, 95% CI) | 0.7 [‐9.51, 10.91] |
| 3.3 (starting dose) 60 & 80 mg/day | 1 | 39 | Mean Difference (Fixed, 95% CI) | 2.7 [‐7.71, 13.11] |
| Outcome or subgroup title | No. of studies | No. of participants | Statistical method | Effect size |
| 1 SBP Show forest plot | 11 | Mean Difference (Fixed, 95% CI) | Subtotals only | |
| 1.1 0.25x starting dose | 1 | 26 | Mean Difference (Fixed, 95% CI) | 3.4 [‐8.58, 15.38] |
| 1.2 0.5x starting dose | 2 | 82 | Mean Difference (Fixed, 95% CI) | ‐6.12 [‐11.36, ‐0.87] |
| 1.3 starting dose | 10 | 384 | Mean Difference (Fixed, 95% CI) | ‐8.11 [‐10.41, ‐5.81] |
| 1.4 2x starting dose | 3 | 180 | Mean Difference (Fixed, 95% CI) | ‐7.95 [‐12.18, ‐3.72] |
| 1.5 4x starting dose | 2 | 106 | Mean Difference (Fixed, 95% CI) | ‐11.04 [‐15.98, ‐6.10] |
| 2 DBP Show forest plot | 11 | 778 | Mean Difference (Fixed, 95% CI) | ‐3.89 [‐4.87, ‐2.91] |
| 2.1 0.25x starting dose | 1 | 26 | Mean Difference (Fixed, 95% CI) | 4.2 [‐2.33, 10.73] |
| 2.2 0.5x starting dose | 2 | 82 | Mean Difference (Fixed, 95% CI) | ‐0.73 [‐4.83, 3.38] |
| 2.3 starting dose | 10 | 384 | Mean Difference (Fixed, 95% CI) | ‐3.81 [‐5.08, ‐2.55] |
| 2.4 2x starting dose | 3 | 180 | Mean Difference (Fixed, 95% CI) | ‐4.41 [‐6.53, ‐2.28] |
| 2.5 4x starting dose | 2 | 106 | Mean Difference (Fixed, 95% CI) | ‐6.71 [‐9.72, ‐3.69] |
| 3 Heart rate Show forest plot | 7 | Mean Difference (Fixed, 95% CI) | Subtotals only | |
| 3.1 0.5x starting dose | 1 | 55 | Mean Difference (Fixed, 95% CI) | ‐2.23 [‐7.33, 2.87] |
| 3.2 1x starting dose | 7 | 200 | Mean Difference (Fixed, 95% CI) | ‐5.96 [‐7.38, ‐4.53] |
| 3.3 2x starting dose | 2 | 86 | Mean Difference (Fixed, 95% CI) | ‐2.27 [‐4.58, 0.03] |
| 4 Pulse Pressure Show forest plot | 11 | 765 | Mean Difference (Fixed, 95% CI) | ‐3.40 [‐4.94, ‐1.87] |
| 4.1 0.25x starting dose | 1 | 26 | Mean Difference (Fixed, 95% CI) | 5.3 [‐5.11, 15.71] |
| 4.2 0.5x starting dose | 2 | 82 | Mean Difference (Fixed, 95% CI) | ‐2.53 [‐9.09, 4.02] |
| 4.3 1x starting dose | 10 | 371 | Mean Difference (Fixed, 95% CI) | ‐3.58 [‐5.54, ‐1.63] |
| 4.4 2x starting dose | 3 | 180 | Mean Difference (Fixed, 95% CI) | ‐3.76 [‐7.39, ‐0.14] |
| 4.5 4x starting dose | 2 | 106 | Mean Difference (Fixed, 95% CI) | ‐3.88 [‐8.15, 0.40] |
| 5 WDAE Show forest plot | 1 | 117 | Risk Ratio (M‐H, Fixed, 95% CI) | 0.72 [0.07, 7.67] |
| 6 Combined starting and twice the starting dose Show forest plot | 10 | Mean Difference (Fixed, 95% CI) | Subtotals only | |
| 6.1 SBP | 10 | 564 | Mean Difference (Fixed, 95% CI) | ‐8.07 [‐10.09, ‐6.05] |
| 6.2 DBP | 10 | 564 | Mean Difference (Fixed, 95% CI) | ‐3.97 [‐5.05, ‐2.88] |
| 6.3 Heart rate | 7 | 286 | Mean Difference (Fixed, 95% CI) | ‐4.94 [‐6.15, ‐3.73] |
| 6.4 Pulse pressure | 10 | 551 | Mean Difference (Fixed, 95% CI) | ‐3.62 [‐5.34, ‐1.90] |