Scolaris Content Display Scolaris Content Display

Flow of studies through the selection process
Figuras y tablas -
Figure 1

Flow of studies through the selection process

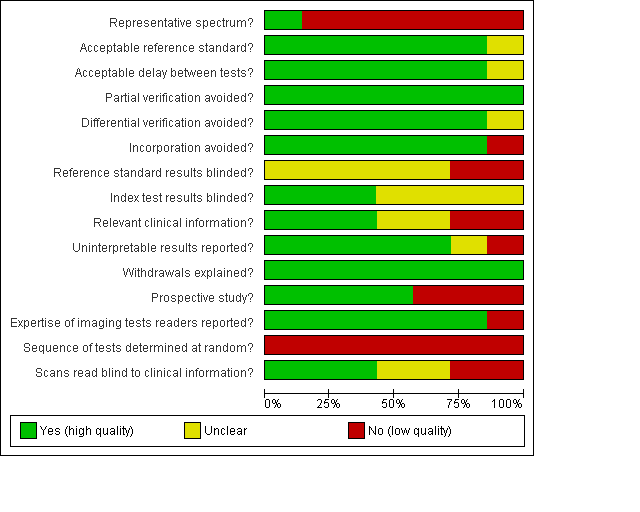
Methodological quality of the seven included studies on ischaemic stroke
Figuras y tablas -
Figure 2

Methodological quality of the seven included studies on ischaemic stroke

Methodological quality summary: review authors' judgment on each individual QUADAS item for the seven included studies on ischaemic stroke.
Figuras y tablas -
Figure 3

Methodological quality summary: review authors' judgment on each individual QUADAS item for the seven included studies on ischaemic stroke.

Methodological quality summary: review authors' judgment on each individual QUADAS item for the two included studies on haemorrhagic stroke.
Figuras y tablas -
Figure 4

Methodological quality summary: review authors' judgment on each individual QUADAS item for the two included studies on haemorrhagic stroke.

Forest plots of DWI and CT results for ischaemic stroke
Figuras y tablas -
Figure 5

Forest plots of DWI and CT results for ischaemic stroke

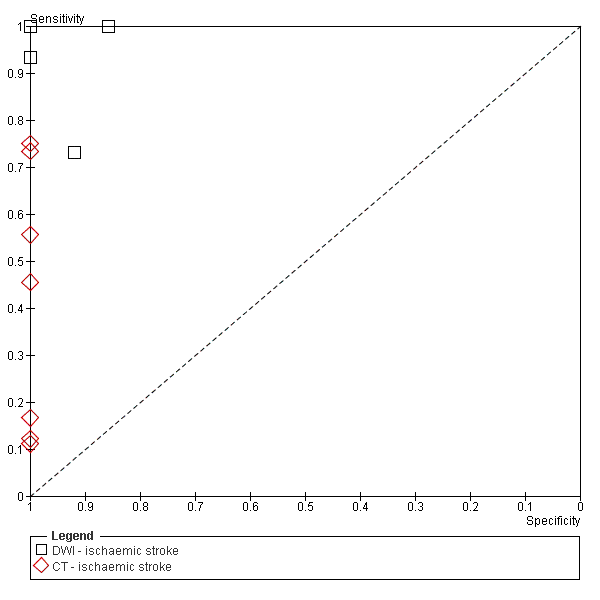
ROC plot for the seven studies that compared DWI with CT for the early detection of ischaemic stroke
Figuras y tablas -
Figure 6

ROC plot for the seven studies that compared DWI with CT for the early detection of ischaemic stroke

MRI results for haemorrhagic stroke
Figuras y tablas -
Figure 7

MRI results for haemorrhagic stroke

DWI ‐ ischaemic stroke.
Figuras y tablas -
Test 1

DWI ‐ ischaemic stroke.

CT ‐ ischaemic stroke.
Figuras y tablas -
Test 2

CT ‐ ischaemic stroke.

GRE/DWI.
Figuras y tablas -
Test 3

GRE/DWI.

DWI.
Figuras y tablas -
Test 4

DWI.

GRE.
Figuras y tablas -
Test 5

GRE.

Summary of findings Results of studies on ischaemic stroke

Review question: Comparison of diffusion‐weighted magnetic resonance imaging with conventional computer tomography for the early detection of ischaemic brain lesions in patients suspected of stroke

Patient population: adults suspected of acute stroke

Setting: hospital departments

Geographical location: studies were conducted in Europe (3 studies), the USA (3 studies), and in Australia (1 study)

Index test: diffusion‐weighted magnetic resonance imaging (DWI) performed within 12 hours of stroke onset

Alternative test: computer tomography (CT) performed within 12 hours of stroke onset

Reference standard: clinical assessment and imaging follow up

Included studies: 7 comparative studies that evaluated DWI and CT in the same patients

Total number of patients assessed: 226


Limitations of included studies

  • Limited number of included studies (7 studies); small sample sizes; presence of incorporation bias

  • DWI and CT were evaluated in highly selected patient samples (patients with high probability of stroke), which therefore are not representative of the typical population of patients presenting with 'suspected acute stroke' to an emergency department (poor generalisability of results)

  • The stroke vascular territory was not reported in the majority of included studies although it is likely that they enrolled patients with typical anterior circulation stroke

  • Only a minority of the studied patients had severe strokes (in whom DWI might be contraindicated)

  • The high proportion of mild strokes and reclassification of TIA cases with a positive DWI lesion as strokes might have inflated the DWI sensitivity estimate

  • In most of the studies stroke mimics were not included

  • In all but one study CT was performed before DWI (reducing the sensitivity of CT to detect ischaemia)

CT results

TP       73

FP        0

FN       88

TN       65

Total   226


DWI results 

TP       147

FP        5

FN       14

TN       60

Total   226

Summary effect (95% CI)

DWI sensitivity 0.99 (0.23 to 1.00)

DWI specificity 0.92 (0.83 to 0.97)

CT sensitivity 0.39 (0.16 to 0.69)

CT specificity 1.00 (0.94 to 1.00)


Conclusions and comments
In the small cohort of included studies, DWI is more sensitive than CT ‐ but not more specific ‐ for the early detection of ischaemic stroke.

The small amount of data and the presence of methodological biases preclude any reliable calculation ‐ from the sensitivity and specificity estimates of CT and DWI ‐ of a positive or negative stroke diagnosis at different rates of stroke prevalence. 

Applicability of tests in clinical practice
None of the studies addressed practicality. CT is known to be quicker to perform and more readily available in most emergency care settings than magnetic resonance imaging (MRI). MRI is contraindicated in patients with pacemakers and some metal implants. In acutely ill stroke patients it may be difficult to monitor the patient's condition while being MR scanned (and this increases the risk of any respiratory difficulty or cardiovascular compromise that develops during the scan which passes undetected and may have adverse effects for the patient). If the patient is confused or restless as a result of the stroke, the patient may not be able to co‐operate for the longer scan times of MRI. 

Costs
None of the studies included a cost‐effectiveness evaluation. MRI is known to be more expensive than CT. 

CI: confidence interval
CT: computed tomography
DWI: diffusion‐weighted magnetic resonance imaging
FN: false negative
FP: false positive
MR/MRI: magnetic resonance imaging
TN: true negative
TP: true positive

Figuras y tablas -
Summary of findings Results of studies on ischaemic stroke
Table 1. Characterisitcs and diagnostic results of the two included studies on haemorrhagic stroke

Study

Participants (% men)

Participants assessed

Age (range)

Stroke severity

Time of imaging

MRI results (95% CI)

Chalela 2007 *

450

(unknown)

90

Median 76 years

(21 t0 100 years)

Median score at NIHSS = 3 (range 0 to 37)

Within 3 hours of stroke onset

GRE and DWI sensitivity 0.83 (0.52 to 0.98)

GRE and DWI specificity 1.00 (0.95 to 1.00)

Oppenheim 2005 **

86

(64)

82

Mean 68.8 years

Mean score at NIHSS = 11.25

Within 6 hours of stroke onset (mean time 2.6 hours)

DWI sensitivity 1.00 (0.91 to 1.00)

DWI specificity 1.00 (0.91 to 1.00)

GRE sensitivity 1.00 (0.91 to 1.00)

GRE specificity 0.98 (0.87 to 1.00)

*: prospective
**: retrospective
95% CI: 95% confidence intervals
DWI: diffusion‐weighted imaging
GRE: gradient‐echo
MRI: magnetic resonance imaging
NIHSS: National Institute of Health Stroke Scale

Figuras y tablas -
Table 1. Characterisitcs and diagnostic results of the two included studies on haemorrhagic stroke
Table Tests. Data tables by test

Test

No. of studies

No. of participants

1 DWI ‐ ischaemic stroke Show forest plot

7

226

2 CT ‐ ischaemic stroke Show forest plot

7

226

3 GRE/DWI Show forest plot

1

90

4 DWI Show forest plot

1

82

5 GRE Show forest plot

1

82

Figuras y tablas -
Table Tests. Data tables by test