Antiangiogenic therapy with anti‐vascular endothelial growth factor modalities for diabetic macular oedema
Referencias
References to studies included in this review
References to studies excluded from this review
References to ongoing studies
Additional references
References to other published versions of this review
Characteristics of studies
Characteristics of included studies [ordered by study ID]
| Methods | Randomisation was performed using a random block permutation method according to a computer‐generated randomisation list. The block lengths varied randomly. A random allocation sequence was performed by a biostatistician. Details of the series were unknown to the investigators. | |
| Participants | Country: Iran. Number randomised: 101 participants, 115 eyes. Age: 59.7 ± 8.3 (39 to 74) years. Sex: 50 (49.5%) M, 51 (50.5%) F. Exclusion criteria: Visual acuity > 20/40, history of cataract surgery within the past 6 months, prior intraocular injection or vitrectomy, glaucoma or ocular hypertension, PDR with high‐risk characteristics, vitreous haemorrhage, significant media opacity, and presence of traction on the macula. Monocular patients were excluded. Pregnancy and serum creatinine level > 3 mg/100 were also among the exclusion criteria. | |
| Interventions | Treatment: Participants were randomly assigned to one of the three study arms: 1) three injections of IVB (1.25 mg/0.05 mL) at 6‐week intervals, 2) combined IVB and IVT (1.25 mg/0.05 mL and 2 mg/0.05 mL respectively) followed by two injections of IVB at 6‐week intervals. Control: 3) sham injection (control group). Duration: 24 weeks. | |
| Outcomes | The primary outcome measure was change in CMT compared to baseline. CMT was defined by the average thickness of a central macular region 1,000 µm in diameter centred on the patientÍs foveola. Secondary outcome measures included change in best‐corrected logMAR visual acuity, IOP rise, cataract progression, intraocular inflammation, and any other serious adverse effect. | |
| Notes | None | |
| Risk of bias | ||
| Bias | Authors' judgement | Support for judgement |
| Random sequence generation (selection bias) | Low risk | See 'Characteristics of included studies' table. |
| Allocation concealment (selection bias) | Low risk | See 'Characteristics of included studies' table. |
| Blinding (performance bias and detection bias) | Low risk | See 'Characteristics of included studies' table. |
| Incomplete outcome data (attrition bias) | Unclear risk | No incomplete outcome data were reported, but number of patients at 24 weeks follow‐up was not specified. |
| Selective reporting (reporting bias) | High risk | The study protocol is mentioned. However, dichotomous visual acuity outcomes are not provided. |
| Other bias | High risk | 28 eyes of 14 patients (14%) with bilateral CSMO were included in the analysis. |
| Methods | Patients were randomised into 2 groups by means of an in‐house computerised randomisation program. The research investigator was not involved in the randomisation process. Patients were stratified for BCVA, with the aim being that both groups would have comparable mean baseline BCVAs. If both eyes were eligible for enrolment, the eye with the worst VA was randomised. | |
| Participants | Country: UK. Number randomised: 80 patients (42 bevacizumab group, 38 laser). Age: 64.9 ± 9.4 yrs bevacizumab group; 63.5 ± 8.1 yrs laser group. Sex:M/F 30/12 bevacizumab group; 25/13 laser group. Inclusion criteria: 1) patients of either gender aged >18 years; (2) diabetes mellitus (type 1 or 2); (3) BCVA in the study eye between 35 and 69 ETDRS letters at 4 m (Snellen equivalent ≥ 6/60 or ≤ 6/12); (4) centre‐involving CSMO with CMT on optical coherence tomography (OCT) of > 270 mm; (5) media clarity, pupillary dilation, and participant co‐operation sufficient for adequate fundus imaging; (6) at least 1 prior macular laser; (7) IOP > 30 mmHg; (8) ability to return for regular study visits; (9) fellow eye BCVA ≥ 3/60; and 10) fellow eye has received no anti‐VEGF treatment within the previous 3 months and no expectation of such treatment during the study. Exclusion criteria: (1) macular ischaemia (foveal avascular zone [FAZ] ≥ 1000 mm GLD or severe perifoveal intercapillary loss on FFA); (2) MO due to a cause other than DMO; (3) coexistent ocular disease: (i) a pre‐existing ocular condition that was likely to preclude VA improvement despite resolution of macular oedema (e.g., foveal atrophy, dense subfoveal hard exudates, marked cataract, amblyopia) or (ii) an ocular condition that may affect macular oedema or alter VA during the course of the study (e.g., retinal vascular occlusion, ocular inflammatory disease, neovascular glaucoma, Irvine‐Gass syndrome); (4) any treatment for DMO in the preceding 3 months; (5) panretinal photocoagulation within 3 months of enrolment or anticipated 6 months thereafter; (6) proliferative diabetic retinopathy except for tufts of new vessels elsewhere < 1 disc in area with no vitreous haemorrhage; (7) haemoglobin A1c (HbA1c) > 11.0%; (8) medical history of chronic renal failure requiring dialysis or kidney transplantation; (9) BP > 170/100 mmHg; (10) any thromboembolic event within 6 months, unstable angina, or evidence of active ischaemia on ECG at time of screening; (11) major surgery within 28 days of randomisation or planned during the subsequent 12 months; (12) participation in an investigational drug trial within 30 days of randomisation (or any time during the study); (13) systemic anti‐VEGF or pro‐VEGF treatment within 3 months of enrolment; (14) pregnancy, breast feeding, or intention to become pregnant within the study period; (15) intraocular surgery within 3 months of randomisation; (16) aphakia; (17) uncontrolled glaucoma; and (18) significant external ocular disease. | |
| Interventions | Participants were randomly assigned to bevacizumab or laser treatment. Duration: 12 months. | |
| Outcomes | The primary outcome measure of the trial was a comparison of the mean ETDRS BCVA at 12 months between the iv bevacizumab and laser arms. The secondary outcome measures relating to efficacy were a comparison between both groups at 12 months with regard to (i) mean CMT; (ii) mean change in CMT; (iii) mean change in ETDRS BCVA; (iv) the proportion of patients who gained > 15 and > 10 ETDRS letters (improvement); (v) the proportion of patients who lost < 15 ETDRS letters (stabilisation); (vi) the proportion of patients who lost > 30 ETDRS letters; and (vii) ETDRS grading of retinopathy severity. The secondary outcome measures relating to safety were a comparison between both arms at 12 months with regard to (i) GLD of the FAZ, area of the FAZ, and PFCL (the methodology of determining these parameters has been previously described in detail); 24 (ii) RNFL thickness; (iii) other ocular side effects; and (iv) systemic side effects, including thromboembolic events, BP, and ECG findings. | |
| Notes | None | |
| Risk of bias | ||
| Bias | Authors' judgement | Support for judgement |
| Random sequence generation (selection bias) | Low risk | Sequence generated by means of in‐house computerised randomisation program. |
| Allocation concealment (selection bias) | Low risk | The doctor had to phone the CTU in order to obtain a randomisation from the statistician. |
| Blinding (performance bias and detection bias) | Low risk | Quote: "Although the patient and the study physician were not masked to the therapeutic modality, the study optometrist, OCT technician, photographer, graders performing assessment of the FAZ and ETDRS retinopathy grading, and study statistician were all masked to the patient randomization." Comment: masking outcome assessors should suffice to avoid bias. |
| Incomplete outcome data (attrition bias) | Low risk | Quote: "Two patients in the laser group did not complete 12 months of follow‐up (1 patient moved away, and 1 patient could not be contacted). They were last reviewed at the 32‐week time point,with these data being carried forward and an intention‐to‐treat analysis undertaken. All 42 patients in the ivB group completed the study." |
| Selective reporting (reporting bias) | Low risk | We could not find a protocol but primary outcomes were stated in the methods and were those routinely used in the field. |
| Other bias | Low risk | No other bias identified. |
| Methods | Quote: "Randomized, double‐masked, active controlled multicenter phase 2 clinical trial. Thirty‐nine sites in the United States, Canada, and Austria participated in the trial, and patients were enrolled between December 2008 and June 2009. The primary objective was to assess the efficacy of various doses and dose intervals of intravitreal VEGF Trap‐Eye (aflibercept injection) on BCVA." | |
| Participants | Quote: "The study enrolled adult patients 18 years of age or older with type 1 or 2 diabetes mellitus with clinically significant DME with center involvement of the fovea, defined as a central subfield measurement of 250 micron or more on time‐domain OCT (Stratus OCT)". "In addition, patients had an ETDRS BCVA letter score at 4m of 73 to 24 (20/40 to 20/320) in the study eye." Patients were excluded for a number of ocular comorbidities and recent ocular treatment, as well as uncontrolled diabetes. | |
| Interventions | Quote: "Eyes were assigned randomly using a 1:1:1:1:1 ratio to one of the following treatment regimens: (1) 0.5 mg VEGF Trap‐Eye every 4 weeks (0.5q4); (2) 2 mg VEGF Trap‐Eye every 4 weeks (2q4); (3) 2 mg VEGF Trap‐Eye every 8 weeks after 3 initial monthly doses (2q8); (4) 2 mg VEGF Trap‐Eye, with dosing as needed after 3 initial monthly doses (2PRN); (5) laser photocoagulation using a modified ETDRS protocol at baseline and then as needed (but no more frequently than every 16 weeks). Eyes in the laser group also received a sham injection every 4 weeks." | |
| Outcomes | Quote: "The primary end point was the change inBCVA from baseline to week 24. Secondary objectives were to assess the effects of intravitreal VEGF Trap‐Eye on retinal thickness assessed by optical coherence tomography (OCT) and to assess safety and tolerability of intravitreal VEGF Trap‐Eye in eyes with DME. Secondary outcomes were the change in BCVA from baseline at week 52, the proportion of eyes that gained at least 15 ETDRS letters in BCVA compared with baseline at weeks24 and 52, the change in central retinal thickness (CRT; central subfield on OCT) from baseline to weeks 24 and 52, and the number of focal laser treatments given." | |
| Notes | ||
| Risk of bias | ||
| Bias | Authors' judgement | Support for judgement |
| Random sequence generation (selection bias) | Low risk | Quoted text provided by the producer: "The randomization was handled by an IVRS vendor. The study statistician at REGENERON provided the randomization plan and reviewed and approved the dummy rand table. Study Data Management at REGENERON tested the randomization function extensively along with the Clinical team." |
| Allocation concealment (selection bias) | Low risk | Quoted text provided by the producer: "Sites called into IVRS to randomize patients and received the randomization number and drug kit assignment at the completion of the call. The site also received a confirmation email. Neither of these contained the actual randomization assignment. The randomization assignments were kept by the IVRS vendor in a secure, access‐controlled database and were delivered to REGENERON by the IVRS vendor at the primary endpoint database lock." |
| Blinding (performance bias and detection bias) | Low risk | Quote: "Treatments (study drug injection, sham injection, laser or sham laser photocoagulation) were performed by an unmasked physician. A separate masked physician was assigned to assess adverse events (AEs) and retreatment and rescue criteria and to supervise the masked assessment of efficacy. Every effort was made to ensure that all other study site personnel remained masked to treatment assignment to facilitate an unbiased assessment of efficacy and safety." |
| Incomplete outcome data (attrition bias) | Low risk | Quote: "Forty‐three patients discontinued the study after receiving at least 1 treatment for the following reasons: lost to follow‐up (n 11), withdrew consent (n 11), death (n 6), treatment failures (n 2), AE (n 7), protocol deviation (n 2), other (n 4). Discontinuations were distributed evenly among all the treatment groups." Comment: LOCF used. |
| Selective reporting (reporting bias) | Low risk | Primary outcome declared and consistent with our review. |
| Other bias | Low risk | No other bias identified. |
| Methods | Study participants with 1 study eye were assigned randomly on the DRCR.net study website (using a permuted blocks design stratified by study eye visual acuity) with equal probability to 1 of 4 treatment groups. For study participants with 2 study eyes, the right eye was assigned randomly with equal probability to 1 of the 4 groups as indicated above. If the right eye was assigned to a treatment group other than the sham + prompt laser group, then the left eye was assigned to the sham + prompt laser group. If the right eye was assigned to the sham + prompt laser group, then the left eye was assigned randomly to 1 of the other 3 groups. Thus, there were more eyes in the sham + prompt laser group than in the other 3 groups. | |
| Participants | Country: multicentre. Number randomised: 854 eyes (691 patients). Age: 63 (57‐69) sham + prompt laser 62 (56‐70) ranibizumab + prompt laser 64 (58‐70) ranibizumab + deferred laser 62 (55‐70) triamcinolone + prompt laser Sex: Females 123 (42%) sham + prompt laser 85 (45%) ranibizumab + prompt laser 78 (41%) ranibizumab + deferred laser 86 (46%) triamcinolone + prompt laser Inclusion criteria: eligible patients were at least 18 years old with type 1 or 2 diabetes. The major eligibility criteria for a study eye included the following: (1) best‐corrected Electronic‐Early Treatment Diabetic Retinopathy Study (E‐ETDRS Visual Acuity Test11) visual acuity letter score 78 to 24 (20/32 to 20/320), (2) definite retinal thickening due to DME on clinical examination involving the centre of the macula assessed to be the main cause of visual loss, and (3) retinal thickness measured on time domain optical coherence tomography (OCT) ≥ 250 mm in the central subfield. Exclusion criteria: Principal exclusion criteria included the following: (1) treatment for DMO within the prior 4 months, (2) panretinal photocoagulation within the prior 4 months or anticipated need for panretinal photocoagulation within the next 6 months, (3) major ocular surgery within the prior 4 months, (4) history of open‐angle glaucoma or steroid‐induced IOP elevation that required IOP‐lowering treatment, and (5) IOP > 25 mmHg. Patients were excluded if their systolic blood pressure was > 180 mmHg or diastolic blood pressure was > 110 mmHg, or if a myocardial infarction, other cardiac event requiring hospitalisation, cerebrovascular accident, transient Ischaemic attack, or treatment for acute congestive heart failure occurred within 4 months before randomisation. | |
| Interventions | Treatment: (1) sham injection plus prompt (within 3‐10 days after injection) focal/grid photocoagulation (sham + prompt laser group). (2) 0.5 mg intravitreal ranibizumab plus prompt (within 3‐10 days after injection) focal/grid photocoagulation (ranibizumab + prompt laser group). (3) 0.5 mg intravitreal ranibizumab with deferred (≥ 24 weeks) focal/grid photocoagulation (ranibizumab + deferred laser group). (4) 4 mg intravitreal triamcinolone plus prompt (within 3 to 10 days after injection) focal/ grid photocoagulation (triamcinolone + prompt laser group. Duration: 12 months (24 months). | |
| Outcomes | BCVA and safety at 1 year. | |
| Notes | ||
| Risk of bias | ||
| Bias | Authors' judgement | Support for judgement |
| Random sequence generation (selection bias) | Low risk | The randomisation sequence was computer‐generated by the DRCR.net coordinating centre. |
| Allocation concealment (selection bias) | Low risk | Randomisation assignments were obtained through the DRCR.net study website, therefore no study personnel had access to the list or to the next assignment before it was assigned. |
| Blinding (performance bias and detection bias) | Low risk | Participants: masked to treatment assignment. Outcome assessor: VA assessment and OCT were performed by certified examiners masked for treatments. Treating physician: unmasked |
| Incomplete outcome data (attrition bias) | Low risk | Patients randomised in each group were: 293 laser, 187 ranibizumab + prompt laser, 188 ranibizumab + deferred laser and 186 IVTA + laser. At 1 year complete patients were 274, 171, 178, 176 respectively (91‐95%). At 2 years complete patients were 211, 136, 139, 142 respectively (72‐76%). Causes of missing were balanced across groups. |
| Selective reporting (reporting bias) | Low risk | We could not find a protocol but primary outcomes were stated in the methods and were those routinely used in the field. |
| Other bias | Low risk | No other source of bias identified. |
| Methods | Method of allocation: Dynamic minimisation procedure using a stochastic treatment allocation algorithm based on the variance method. Randomisation was stratified by study site, size of the thickened retina area (< 2.5 disc areas versus > 2.5 disc areas), and baseline BCVA (letter score > 58 versus letter score < 58). An independent fundus photograph and angiogram reading centre confirmed eligibility and appropriate retinal thickness classification both for study entry and for randomisation and stratification using baseline fluorescein angiography and OCT. | |
| Participants | Country: USA | |
| Interventions | Treatments: Patients were allocated to 0.3 mg, 1 mg, or 3 mg iv pegaptanib group. | |
| Outcomes | Efficacy: VA, central retinal thickness on OCT, change in retinal thickness derived by comparing measurements at baseline with those at week 36 or final examination if before week 36. The proportion of participants for whom focal photocoagulation was applied at week 12 or later, size of the area of retinal thickness measured by photography, and fluorescein angiographic findings concerning macular capillary leakage and cystoid spaces also were determined. | |
| Notes | Sponsored by Eyetech Pharmaceuticals, Inc., New York, New York, and Pfizer Inc., New York, New York | |
| Risk of bias | ||
| Bias | Authors' judgement | Support for judgement |
| Random sequence generation (selection bias) | Low risk | Dynamic minimisation procedure using a stochastic treatment allocation algorithm based on the variance method. |
| Allocation concealment (selection bias) | Low risk | An independent fundus photograph and angiogram reading centre confirmed eligibility and appropriate retinal thickness classification both for study entry and for randomisation and stratification using baseline fluorescein angiography and OCT. |
| Blinding (performance bias and detection bias) | Low risk | Patients, investigators and outcome assessors were masked for all outcome measures. |
| Incomplete outcome data (attrition bias) | Low risk | Also see Results section, Risk of bias in included studies. Nine participants were discontinued from the study before week 36. None in pegaptanib groups 0.3 mg and 1 mg, 3 in pegaptanib 3 mg group (3 mg subgroup: 2 patients by request at weeks 12 and 16 and 1 by other reason at week 1), 6 in sham group (5 patients by request at weeks 6, 11, 18, 30, and 33 and 1 due to death at week 8). |
| Selective reporting (reporting bias) | Low risk | The study protocol is available and all (primary and secondary) outcomes that are of interest in the study have been reported in the pre‐specified way. |
| Other bias | Low risk | No other source of bias identified. |
| Methods | Method of allocation: patients were centrally allocated to receive either pegaptanib 0.3 mg or sham injections (1:1) using a dynamic minimization procedure stratified by the site, haemoglobin A1c (7.6% versus 7.6%), systolic BP (140 versus 140 mmHg), diastolic BP (80 versus 80 mmHg), and baseline BCVA (54 versus 54 letters); the dynamic minimisation used a stochastic treatment allocation algorithm based on the variance method. The study investigator remained masked to treatment and responsible for the patient's care. BCVA was measured at 4 m by the study refractionist/ophthalmologist, who was masked to the patient's treatment and to the patient's previous VA assessments. Exclusions after randomisation: None reported. | |
| Participants | Country: USA. Age: 62.3 ± 9.3 pegaptanib 0.3 mg group 62.5 ± 10.2 sham group. Male/female: 81/52 pegaptanib 0.3 mg group 68/59 sham group. Inclusion criteria: 18 years of age of either gender with type 1 or 2 diabetes and DMO involving the centre of the macula not associated with ischaemia. A foveal thickness of 250 micron (centre point thickness measured on OCT; BCVA with a letter score of 65 through 35 (20/50 –20/200 Snellen equivalents); intraocular pressure (IOP) 21 mmHg; and clear ocular media and adequate pupillary dilation to allow good quality stereoscopic fundus photography were required in the study eye. Additionally, eligible patients could not have undergone yttrium‐aluminum‐garnet laser, peripheral retinal cryoablation, laser retinopexy for retinal tears, or focal or grid photocoagulation within the prior 16 weeks or scatter (panretinal) photocoagulation 6 months before baseline or likely to be needed within 9 months. Only patients for whom focal or grid laser photocoagulation could be deferred in the study eye for 18 weeks in the opinion of the treating ophthalmologist could be entered in the study. Exclusion criteria: Patients with macular ischaemia were excluded if there was a nonperfusion area of 1 disc area involving the foveal avascular zone (2 quadrants centred around the foveal avascular zone). | |
| Interventions | Treatment: Patients received pegaptanib 0.3 mg or sham injections every 6 weeks in year 1 (total 9 injections) and could receive focal/grid photocoagulation beginning at week 18. During year 2, patients received injections as often as every 6 weeks per prespecified criteria. Control: sham. Duration: 12 months (24 months). | |
| Outcomes | The primary efficacy endpoint of the trial was the proportion of patients with a 10‐letter (2‐line) improvement from baseline in VA at week 54. Secondary efficacy endpoints included the proportion of patients with a 10‐letter improvement from baseline in VA at week 102; changes from baseline in mean VA over time; and, at weeks 54 and 102, the proportion of patients with a 15‐letter (3‐line) improvement in VA, the proportion of patients with a change in degree of retinopathy of 2 steps based on the 12‐step scale of retinopathy, the proportion of patients with a decrease in retinal thickness at the centre point by 25% and 50%, the proportion of patients requiring focal or grid laser, and change in NEIVFQ‐25 and EQ‐5D from baseline. | |
| Notes | No other source of bias identified. | |
| Risk of bias | ||
| Bias | Authors' judgement | Support for judgement |
| Random sequence generation (selection bias) | Low risk | |
| Blinding (performance bias and detection bias) | Low risk | |
| Incomplete outcome data (attrition bias) | Unclear risk | At 1 year 116/144 treated patients and 114/142 controls completed the 54 week visit (80%). Adverse events led to discontinuation of 5 treated and 7 control patients. At 2 years 66 patients in each group completed the 102 week visit. ITT analysis with LOCF was used leading to the analysis of 133 treated and 127 control patients. |
| Selective reporting (reporting bias) | Low risk | |
| Other bias | Low risk | |
| Methods | Randomised study but randomisation sequence generation and methods for its allocation not reported. | |
| Participants | Country: Multicentre USA. Number:126 participants. Age: 62 yrs in the 3 groups. Sex: Female % 69 F (group 1), 55 F (group 2), 52 F (group 3). Inclusion criteria: Patients (aged >18 years) with type 1 or 2 diabetes and DMO were eligible if they had reduction in visual acuity between 20/40 and 20/320 and met the following criteria: (1) centre subfield thickness measured by OCT ≥ 250 mm, (2) glycosylated haemoglobin ≥ 6% within 12 months before randomisation, (3) no potential contributing causes to reduced VA other than DMO, (4) reasonable expectation that scatter laser photocoagulation would not be required for the next 6 months. Exclusion criteria: Patients were excluded if they had received focal/grid laser treatment within 3 months, intraocular injection of steroid within 3 months, or intraocular injection of a VEGF antagonist within 2 months. If both eyes were eligible, the eye with the greater centre subfield thickness was entered. | |
| Interventions | Patients were randomised 1:1:1 to receive 0.5 mg ranibizumab at baseline and months 1, 3, and 5 (group 1), focal or grid laser photocoagulation at baseline and month 3 if needed (group 2), or a combination of 0.5 mg ranibizumab and focal or grid laser at baseline and month 3 (group 3). Starting at month 6, if retreatment criteria were met, all patients could be treated with ranibizumab. Duration: primary outcome at 6 months, extension to 24 months. | |
| Outcomes | The primary outcome measure was the change in BCVA between baseline and month 24. Secondary vision‐related outcome measures were the change in BCVA between baseline and month 24 and the percentage of patients with 3 or more lines or 2 or more lines improvement at month 24. Secondary anatomic outcomes were the change in foveal thickness between baseline and month 24 and the percentage of patients with elimination of 90% or 50% excess foveal thickness. | |
| Notes | ||
| Risk of bias | ||
| Bias | Authors' judgement | Support for judgement |
| Random sequence generation (selection bias) | Unclear risk | Unclear method of sequence generation and information could not be obtained from the authors. |
| Allocation concealment (selection bias) | Unclear risk | Unclear method of allocation concealment and information could not be obtained from the authors. |
| Blinding (performance bias and detection bias) | Unclear risk | Unclear if masked and who was masked and information could not be obtained from the authors. |
| Incomplete outcome data (attrition bias) | Unclear risk | Patients randomised in each group were: 33 ranibizumab, 34 ranibizumab + laser, 34 laser. At 1 year complete patients were 29, 29, 30 (85‐88%). At 2 years complete patients were 24, 26, 24 (71‐76%). Causes of missing were balanced across groups. |
| Selective reporting (reporting bias) | Unclear risk | We could not find a protocol but primary outcomes were stated in the methods and were those routinely used in the field. |
| Other bias | Unclear risk | No other source of bias identified |
| Methods | Eligible patients were randomised 1:1:1 to either ranibizumab (0.3 mg or 0.5 mg) or sham treatment according to a computer‐generated randomised allocation schedule (kept at a secure site and accessible only to the injecting physician; stratification by centre and by the thickness of MO as assessed by the central reading centre at Visit 1 (< 400 μm versus > 400 μm). Based on the patient strata the injecting physician would take the treatment allocation card and tear‐off the cover and follow instructions to choose vial from the box as indicated (3 boxes, randomisation block size 3). The randomisation data were kept strictly confidential until database lock; not accessible to anyone involved in the study with the exception of injecting physician(s) and drug accountability monitor. | |
| Participants | Country: Multicentre Europe. Number randomised: 207 screened; 151 patients randomised. Age: 63 (32‐85) yrs ranibizumab; 65 (41‐82) sham. Sex: 56 M (54.9%) ranibizumab, 25 M (51%) sham, 46 F (45.1%) ranibizumab, 24 F (49%) sham. Inclusion criteria: Patients (aged >18 years) with type 1 or 2 diabetes and DMO were eligible if they had a VA between 20/40 and 20/160, CRT ≥ 300 μm, HbA1C < 12%, decreased vision attributed to foveal thickening from DMO, that was not explained by any other cause, and clinically significant DMO in at least one eye confirmed by a central reading centre (Bern Photographic Reading Centre, University Bern, Bern, Switzerland) using stereoscopic fundus photographs, fluorescein angiography, and OCT (Stratus OCT; Carl Zeiss Meditec, Jena, Germany). Eyes were deemed eligible if, in the judgment of the investigator, laser photocoagulation could be safely withheld in the study eye for at least 3 months after random assignment. Exclusion criteria: Patients were excluded if they had unstable medical status including glycaemic control and blood pressure or panretinal laser photocoagulation performed within 6 months before study entry, and grid/central laser photocoagulation was excluded except for patients with only mild laser burns at least 1,000 μm from the centre of the fovea performed > 6 months preceding day 1. | |
| Interventions | Ranibizumab (0.3 mg, n 51 or 0.5 mg, n 51) or sham treatment (n 49). Duration: 12 months. | |
| Outcomes | The primary end point was the mean average change in BCVA from baseline to month 1 through month 12 (chosen as the primary end point because it is less sensitive to monthly variations and reflects the treatment impact over the entire treatment period). Secondary end points included mean change in BCVA and CMT from baseline to month 12, categorised BCVA outcome, and safety. | |
| Notes | ||
| Risk of bias | ||
| Bias | Authors' judgement | Support for judgement |
| Random sequence generation (selection bias) | Low risk | Quote: "Computer generated randomised allocation schedule" |
| Allocation concealment (selection bias) | Low risk | See 'Characteristics of included studies' table. |
| Blinding (performance bias and detection bias) | Low risk | Masked patients, physician and outcome assessor |
| Incomplete outcome data (attrition bias) | Unclear risk | Complete patients at 1 year were 92/102 ranibizumab and 40/49 sham. Causes of missingness were balanced. ITT analysis with LOCF was used. |
| Selective reporting (reporting bias) | Unclear risk | We could not find a protocol but primary outcomes were stated in the methods and were those routinely used in the field. |
| Other bias | Low risk | No other source of bias identified. |
| Methods | A randomisation list was produced by, or under the responsibility of, Novartis Drug Supply Management using a validated system that automated the random assignment of treatment arms to randomisation numbers in the specified ratio. | |
| Participants | Country: multicentre (Europe, Australia, Canada, Turkey). Number of patients: 345. Mean age: 62.9 ±.9.29 yrs ranibizumab 0.5 mg 64.0 ± 8.15 yrs ranibizumab 0.5 mg + laser 63.5 ± 8.81 yrs laser. Women 43 (37.1) ranibizumab 0.5 mg 48 (40.7) ranibizumab 0.5 mg + laser 53 (47.7) laser Inclusion criteria: patients 18 years of age with either type 1 or 2 diabetes mellitus (as per American Diabetes Association or World Health Organization guidelines), glycosylated haemoglobin (HbA1c) 10%, and visual impairment due to DMO. The key inclusion criteria were (1) stable medication for the management of diabetes within 3 months before randomisation and expected to remain stable during the study; (2) visual impairment due to focal or diffuse DMO (definition in Table 1) in at least 1 eye that was eligible for laser treatment in the opinion of the investigator; (3) BCVA letter score between 78 and 39, both inclusive, based on ETDRS‐like VA testing charts administered at a starting distance of 4 metres (approximate Snellen equivalent 20/32–20/160); and (4) decreased vision due to DMO and not other causes, in the investigator’s opinion (at visit 1). Exclusion criteria: concomitant conditions in the study eye that could prevent the improvement in VA on the study treatment in the investigator’s opinion; (2) active intraocular inflammation or infection in either eye; (3) uncontrolled glaucoma in either eye (e.g., IOP 24 mmHg on medication, or from the investigator’s judgment); (4) panretinal laser photocoagulation (within 6 months) or focal/grid laser photocoagulation (within 3 months) before study entry; (5) treatment with antiangiogenic drugs in the study eye within 3 months before randomisation; (6) history of stroke; and (7) systolic BP 160 mmHg or diastolic BP 100 mmHg, untreated hypertension, or change in antihypertensive treatment within 3 months preceding baseline. | |
| Interventions | 3 treatment arms: Intravitreal ranibizumab (0.5 mg) injection sham laser, adjunctive administration of intravitreal ranibizumab (0.5 mg) injection active laser, or laser treatment sham injections for 12 months. | |
| Outcomes | The primary objective of this study was to demonstrate superiority of ranibizumab 0.5 mg as monotherapy or combined with laser therapy over laser alone (the current standard of care) with respect to mean average change in BCVA from baseline over 12 months. Secondary objectives were to evaluate (1) if ranibizumab 0.5 mg as monotherapy or adjunctive to laser was superior to laser alone in the proportion of patients with VA improvement and with BCVA letter score 73 (20/40 Snellen equivalent) at month 12; (2) the time course of mean change in BCVA letter score and central retinal (subfield) thickness (CRT); (3) patient‐reported outcomes relative to those associated with laser treatment; and (4) the safety of intravitreal injections of ranibizumab 0.5 mg, as monotherapy or adjunctive to laser therapy relative to laser treatment. | |
| Notes | ||
| Risk of bias | ||
| Bias | Authors' judgement | Support for judgement |
| Random sequence generation (selection bias) | Low risk | A randomisation list was produced by, or under the responsibility of, Novartis Drug Supply Management using a validated system that automated the random assignment of treatment arms to randomisation numbers in the specified ratio. |
| Allocation concealment (selection bias) | Low risk | Central randomisation using an eCRF after each patient was included by study investigators. |
| Blinding (performance bias and detection bias) | Low risk | Masked patients, physician and outcome assessor. |
| Incomplete outcome data (attrition bias) | Low risk | Patients randomised in each group were: 116 ranibizumab, 118 ranibizumab + laser, 111 laser. At 1 year complete patients were 87.9%, 87.3% and 88.3% respectively. There were 2 deaths in each of the 3 treatment arms. ITT analysis with LOCF was used. |
| Selective reporting (reporting bias) | Low risk | We could not find a protocol but primary outcomes were stated in the methods and were those routinely used in the field. |
| Other bias | Unclear risk | No other source of bias identified. |
| Methods | Multicentre study in USA and South America. Quote: "Randomization was stratified by study eye BCVA (55 versus 55 ETDRS letters), baseline HbA1c (8% versus 8%), prior DME therapy in the study eye (yes versus no), and study site. Dynamic randomization was used to obtain approximately a 1:1:1 ratio among groups. Randomization was done via interactive phone system. The sponsor developed the specifications for the randomization, and a third party programmed and held the randomization algorithm. " Quote: "Ocular assessments, including the need for macular laser, were made by evaluating ophthalmologists masked to patients’ treatment assignments. Study treatments were administered by treating ophthalmologists unmasked to treatment assignments but masked to ranibizumab dose. To improve patient masking, all patients received subconjunctival anesthesia before sham or active injections. Study site personnel (except treating physicians and assistants), central reading centre personnel, and the sponsor and its agents (except drug accountability monitors) were masked to treatment assignment. Treating physicians were masked to the assigned dose of ranibizumab. An independent statistical coordinating center performed the unmasked interim analyses for the data monitoring committee." | |
| Participants | 759 patients were enrolled and randomised to study treatment (377 in RISE and 382 in RIDE; sham 257, ranibizumab 0.3 mg 250, ranibizumab 0.5 mg 250. | |
| Interventions | Quote: "The median number of ranibizumab injections was 24. The mean number of macular laser treatments over 24 months was 1.8 and 1.6 in the sham groups and 0.3 to 0.8 in the ranibizumab groups. Substantially more sham‐treated patients received macular laser under the protocol‐specified criteria or underwent panretinal photocoagulation for proliferative diabetic retinopathy." | |
| Outcomes | Quote: "The primary efficacy measure was the proportion of patients gaining 15 ETDRS letters in BCVA score from baseline at 24 months (corresponding to 3 lines on the eye chart). Secondary outcomes at 24 months were mean change from baseline BCVA score over time, proportion of patients with BCVA Snellen equivalent of 20/40, mean change from baseline BCVA score over time in patients with focal edema as assessed on FA, proportion of patients losing 15 letters in BCVA score from baseline, mean change from baseline in OCT CFT over time, proportion of patients with a 3‐step progression from baseline in ETDRS retinopathy severity on FP, proportion of patients with resolution of | |
| Notes | ||
| Risk of bias | ||
| Bias | Authors' judgement | Support for judgement |
| Random sequence generation (selection bias) | Low risk | See 'Characteristics of included studies' table |
| Allocation concealment (selection bias) | Low risk | See 'Characteristics of included studies' table |
| Blinding (performance bias and detection bias) | Low risk | Patients and outcome assessors masked, unmasked treating physician. |
| Incomplete outcome data (attrition bias) | Unclear risk | The 2‐year study period was completed by 83.3% of patients in RISE and by 84.6% in RIDE. Causes of missingness not reported. |
| Selective reporting (reporting bias) | High risk | All visual acuity cut‐offs and secondary outcomes available at 2 years, but not at 1 year. |
| Other bias | Low risk | No other bias identified. |
| Methods | Randomisation was performed using random block permutation method according to a computer‐generated randomisation list. The block length varied randomly. Random allocation sequence was performed by a biostatistician. The detail of series was unknown by the study investigators. Masking of participant: A sham laser procedure (20 seconds) was performed by aiming the laser beam on the macula for the eyes in the IVB and IVB/IVT groups. In the MPC group, a sham injection was done by a needleless syringe pressed against the conjunctiva. To keep the masking process, patients were prevented from seeing the syringes. Outcome assessor: Yes; best‐corrected VA measurement and OCT were performed by certified examiners masked both to the randomisation and to the findings of previous measurements. Provider: Yes; all procedures were run by staff members other than the study investigators to preserve investigator masking. Exclusions after randomisation: None. Losses to follow‐up: 1) at 9 months, 25 participants, 6 in the IVB group (4 high‐risk retinopathy, 2 lost); 12 patients IVB/IVTA (3 high risk retinopathy, 4 cataract, 1 neovascular glaucoma; 2 deceased providing 3 eyes, 1 lost); 7 patients in photocoagulation group (3 high risk retinopathy, 1 cataract, 2 deaths, 1 lost). 2) at 24 months, in a subsequent publication in 2012, the authors reported 39 (78%), 36 (72%) and 38 (76%) eyes in the three arms; 8 patients (12 eyes) missing were dead for causes unrelated to treatment, but other causes of death were not reported. | |
| Participants | Country: Iran Number randomised: 129 participants, 150 eyes. Age: 60.5 ± 5.9: IVB group, 62.3 ± 6.8 IVB/IVTA, 61.0 ± 5.3 photocoagulation group. Sex: F/M 27/23 IVB, 22/28 IVB/IVTA, 22/28 macular laser. Inclusion criteria: Eligible cases were 150 eyes of 129 patients with clinically significant DMO based on ETDRS criteria. Exclusion criteria: Previous panretinal or focal laser photocoagulation, prior intraocular surgery or injection, history of glaucoma or ocular hypertension, VA of 20/40 or better or worse than 20/300, presence of iris neovascularisation, high‐risk proliferative diabetic retinopathy, and significant media opacity. Monocularity, pregnancy, serum creatinine 3 mg/dL, and uncontrolled diabetes mellitus were also among the exclusion criteria. | |
| Interventions | Treatment: IVB group, patients who received 1.25 mg IVB (50 eyes); the IVB/IVT group, patients who received 1.25 mg of IVB and 2 mg of IVT (50 eyes); and the photocoagulation group, patients who underwent focal or modified grid laser (50 eyes). Control: The photocoagulation group, patients who underwent focal or modified grid laser (50 eyes). Retreatment was performed at 12‐week intervals whenever indicated. Duration: 36 weeks. | |
| Outcomes | Primary outcome measure was change in best‐corrected VA (logMAR) at week 24 (data available at 36 weeks). Secondary outcomes were VA change, central macular thickness change by optical coherence tomography and potential injection‐related complications. | |
| Notes | ||
| Risk of bias | ||
| Bias | Authors' judgement | Support for judgement |
| Random sequence generation (selection bias) | Low risk | Computer‐generated sequence. |
| Allocation concealment (selection bias) | Unclear risk | Investigatior concealment mentioned but not described. |
| Blinding (performance bias and detection bias) | Low risk | Masked participants, investigator and outcome assessors. |
| Incomplete outcome data (attrition bias) | Unclear risk | There were 6, 7 and 12 missing patients out of 50 at 36 weeks in the IVB, IVB/IVTA and photocoagulation groups and causes where not clearly unrelated to visual acuity outcome, except for 2 deaths. In a subsequent publication in 2012 the authors reported 39 (78%), 36 (72%) and 38 (76%) eyes in the three arms; 8 patients (12 eyes) missing were dead for causes unrelated to treatment, but other causes of death were not reported. |
| Selective reporting (reporting bias) | Low risk | The primary outcomes are continuous measures and no arbitrary cut‐point were used. |
| Other bias | High risk | There was an imbalance of baseline visual acuity in the three group (IVB: 0.71 logMAR, IVB/IVTA 0.73 logMAR, photocoagulation 0.55 logMAR). Although there was a potential unit of analysis issue (150 eyes of 129 patients, 16% of patients with both eyes included), comparisons were made in a marginal regression model (based on generalised estimating equation methods) adjusted for the baseline values and to eliminate any possible correlation effects between the 2 eyes of patients in bilateral enrolled cases. However, we could not take correlation into account when analysing dichotomous visual acuity definitions. |
BCVA: best‐corrected visual acuity
BP: blood pressure
CMT: central macular thickness
CRT: central retinal thicknessCSMO: clinically significant macular oedema
CTU:
DMO: diabetic macular oedema (DME:US spelling edema)
ECG: electrocardiogram
ETDRS: Early Treatment Diabetic Retinopathy Study
FAZ: foveal avascular zone
GLD: greatest linear dimension
IOP: intraocular pressure
ITT: intention‐to‐treat
iv: intravenous
IVB: intravitreal bevacizumab
IVT: intravitreal triamcinolone
LOCF: last observation carried forward
OCT: optical coherence tomography
PDR: proliferative diabetic retinopathy
PFCL: perifoveal capillary loss
VA: visual acuity
VEGF: vascular endothelial growth factor
Characteristics of excluded studies [ordered by study ID]
| Study | Reason for exclusion |
| Follow‐up at 12 weeks only. | |
| Follow‐up at 14 weeks only. RCT comparing ranibizumab (2 injections), triamcinolone (1 injection) to sham in patients with DMO undergoing grid and panretinal laser photocoagulation. | |
| Follow‐up of DRCRnet comparing prompt to deferred laser in patients treated for ranibizumab for DMO: does not report on comparison of ranibizumab with laser. | |
| Follow‐up at 16 weeks only. | |
| Bevacizumab compared to intravitreal triamcinolone. | |
| Single injection of intravitreal triamcinolone acetonide (4 mg/0.1 mL) compared to single injection of intravitreal bevacizumab (1.5 mg/0.06 mL). Duration: 24 weeks. | |
| Single intravitreal injection of bevacizumab (inadequate dose); follow‐up 6 months. |
DMO: diabetic macular oedema
RCT: randomised controlled trial
Characteristics of ongoing studies [ordered by study ID]
| Trial name or title | Lucentis in the Treatment of Macular Edema ‐ A Phase II, Single Center, Randomized Study to Evaluate the Efficacy of Ranibizumab Versus Focal Laser Treatment in Subjects With Diabetic Macular Edema |
| Methods | Allocation: Randomised |
| Participants | 49, country: USA |
| Interventions | Experimental: I Active Comparator: II |
| Outcomes | Primary Outcome Measures [Time Frame: 6 and 12 months]: |
| Starting date | Study Start Date:July 2006 |
| Contact information | Roy A. Goodart, M.D., Principal Investigator, Rocky Mountain Retina Consultants |
| Notes |
| Trial name or title | A Randomized, Open Label, Multicenter, Laser‐controlled Phase II Study Assessing the Efficacy and Safety of Ranibizumab (Intravitreal Injections) vs. Laser Treatment in Patients With Visual Impairment Due to Diabetic Macular Edema |
| Methods | Allocation: Randomised |
| Participants | 84, country: Spain |
| Interventions | Drug: Ranibizumab |
| Outcomes | Primary Outcome Measures: |
| Starting date | Study First Received:May 11, 2009 |
| Contact information | Novartis (Novartis Pharmaceuticals) |
| Notes | Sponsor: Novartis (Novartis Pharmaceuticals) |
| Trial name or title | Efficacy and Safety of Ranibizumab (Intravitreal Injections) in Patients With Visual Impairment Due to Diabetic Macular Edema (REVEAL) |
| Methods | Allocation: Randomised |
| Participants | 395, country: China, Hong Kong, Korea, Japan, Singapore, Taiwan |
| Interventions | Experimental: Group 1‐ adjunctive group Drug: ranibizumab Procedure: laser photocoagulation |
| Outcomes | Primary Outcome Measures: Secondary Outcome Measures: |
| Starting date | Study Start Date:September 2009 |
| Contact information | Novartis |
| Notes |
| Trial name or title | Intravitreal Bevacizumab and Intravitreal Triamcinolone Associated to Laser Photocoagulation for Diabetic Macular Edema (IBeTA) |
| Methods | Allocation: Randomised |
| Participants | 12, country: Brasil |
| Interventions | Procedure: Laser photocoagulation |
| Outcomes | Primary Outcome Measures [Time Frame: One Year]: |
| Starting date | Study Start Date:October 2009 |
| Contact information | Bianka Yukari Nakase Yamasato Katayama, Faculdade de Medicina de Ribeirão Preto da Universidade de São Paulo |
| Notes |
| Trial name or title | A Phase 3, Randomized, Controlled, Double‐Masked, Multi‐Center, Comparative, In Parallel Groups (For 24 Weeks), To Compare The Efficacy And Safety Of 0.3 MG Pegaptanib Sodium, With Sham Injections, And Open Study (For 30 Weeks) To Confirm The Safety Of 0.3 MG Pegaptanib Sodium In Subjects With Diabetic Macular Edema (DME) |
| Methods | Allocation: Randomised |
| Participants | NA |
| Interventions | Drug: pegaptanib sodium |
| Outcomes | NA |
| Starting date | |
| Contact information | |
| Notes |
| Trial name or title | Ranibizumab for Edema of the Macula in Diabetes: Protocol 3 With High Dose ‐ the READ 3 Study |
| Methods | Allocation: Randomised Endpoint Classification: Safety/Efficacy StudyIntervention Model: Parallel AssignmentMasking: Double Masked |
| Participants | 92, country: USA |
| Interventions | Drug: pegaptanib sodium |
| Outcomes | Primary Outcome Measures [Time Frame: 3,6, 9 and 12 months]: Adverse events |
| Starting date | Study Start Date:February 2010 |
| Contact information | Dr. Diana V. Do, Johns Hopkins University |
| Notes | Sponsor: Johns Hopkins University |
| Trial name or title | MIcrodoses of raNIbizumab in Diabetic MAcular Edema (MINIMA‐2) |
| Methods | Allocation: Randomised |
| Participants | Estimated Enrollment:72, country: Mexico |
| Interventions | Experimental: Ranibizumab 0.05 mg. Intravitreal injections of 0.05 mg ranibizumab over 6 months then additional treatment with ranibizumab 0.05 mg as needed (according to re‐treatment criteria) Experimental: Ranibizumab 0.5 mg. Intravitreal injections of 0.5 mg ranibizumab over 6 months then additional treatment with ranibizumab 0.5 mg as needed (according to re‐treatment criteria) |
| Outcomes | Primary Outcome Measures [Time Frame: 6 months and 12 months]: |
| Starting date | Study Start Date:April 2010 |
| Contact information | Fundación Mexicana de Retina |
| Notes | Sponsor: Especialistas en Retina Medica y Quirurgica Grupo de Investigacion |
| Trial name or title | Safety and Efficacy of Ranibizumab in Diabetic Macular Edema (RELATION) |
| Methods | Allocation: Randomised |
| Participants | 128, country: Germany |
| Interventions | Experimental: Active laser photocoagulation and ranibizumab Active Comparator: Active laser photocoagulation and sham injection |
| Outcomes | Primary Outcome Measures: |
| Starting date | Study Start Date: June 2010 |
| Contact information | Novartis (Novartis Pharmaceuticals) |
| Notes | Sponsor: Novartis Pharmaceuticals |
| Trial name or title | Efficacy and Safety of Ranibizumab in Two "Treat and Extend" Treatment Algorithms Versus Ranibizumab As Needed in Patients With Macular Edema and Visual Impairment Secondary to Diabetes Mellitus (RETAIN) |
| Methods | Allocation: Randomised |
| Participants | 374, 52 centres in Europe |
| Interventions | Experimental: 0.5 mg ranibizumab "Treat and Extend" + laser |
| Outcomes | Primary Outcome Measures: |
| Starting date | Study Start Date:September 2010 |
| Contact information | Novartis Pharmaceuticals |
| Notes | Sponsor: Novartis Pharmaceuticals |
| Trial name or title | Lucentis (Ranibizumab) in Diabetic Macular Oedema: a Treatment Evaluation (LUCIDATE) |
| Methods | Study Start Date:October 2010 |
| Participants | 36, country: UK |
| Interventions | Drug: Ranibizumab Procedure: Modified ETDRS laser |
| Outcomes | Patients will undergo detailed baseline evaluation which will include: |
| Starting date | Study Start Date:October 2010 |
| Contact information | Mrs Sue Lydeard, Moorfields Eye Hospital NHS Foundation Trust |
| Notes | Sponsor: Moorfields Eye Hospital NHS Foundation Trust |
| Trial name or title | An Open‐Label Dose Escalation Study of PF‐04523655 (Stratum I) Combined With a Prospective, Randomized, Double‐Masked, Multi‐Center, Controlled Study (Stratum II) Evaluating the Efficacy and Safety of PF‐04523655 Alone and in Combination With Ranibizumab Versus Ranibizumab Alone in Diabetic Macular Edema (MATISSE STUDY) |
| Methods | Allocation: Randomised |
| Participants | 264, countries:USA, Israel |
| Interventions | Drug: PF‐04523655 (Stratum I) |
| Outcomes | Primary Outcome Measures: ‐ To determine the safety and dose‐limiting toxicities of a single intravitreal (IVT) injection of PF‐04523655 in people with low vision |
| Starting date | Study Start Date:February 2012 |
| Contact information | Quark Pharmaceuticals |
| Notes | Sponsor: Quark Pharmaceuticals |
| Trial name or title | Monthly Ranibizumab Versus Treat and Extend Ranibizumab for Diabetic Macular Edema |
| Methods | Allocation: Randomised |
| Participants | 20, country:USA |
| Interventions | Active Comparator: Monthly ranibizumab |
| Outcomes | NA |
| Starting date | Study Start Date:November 2011 |
| Contact information | Retina Vitreous Associates of Florida |
| Notes |
| Trial name or title | Bevacizumab Versus Ranibizumab for the Treatment of Diabetic Macular Edema (IBERA‐DME) |
| Methods | Allocation: Randomised |
| Participants | 53, country: Brasil |
| Interventions | Drug: Bevacizumab |
| Outcomes | Primary Outcome Measures: |
| Starting date | Study Start Date:April 2010 |
| Contact information | Rodrigo Jorge, Principal investigator, University of Sao Paulo |
| Notes | Sponsor: University of Sao Paulo |
| Trial name or title | A Phase I/II, Randomized, Study for Diabetic Macular Edema Using 0.5mg Ranibizumab Combined With Targeted PRP Monthly for 4 Months,Then PRN vs. 0.5mg Ranibizumab 4 Months Monotherapy, Then as Needed(DME‐AntiVEgf) DAVE |
| Methods | Allocation: Randomised |
| Participants | 40. country: USA |
| Interventions | Active Comparator: 0.50mg ranibizumab |
| Outcomes | NA |
| Starting date | Study Start Date:March 2012 |
| Contact information | David M. Brown, M.D., Director Greater Houston Retina Research, Greater Houston Retina Research |
| Notes | Sponsor: David M. Brown, M.D. |
| Trial name or title | A Randomized, Multi‐center, Phase II Study of the Safety, Tolerability and Bioactivity of Repeated Intravitreal Injections of iCo‐007 as Monotherapy or in Combination With Ranibizumab or Laser Photocoagulation in the Treatment of Diabetic Macular Edema (the iDEAL Study) |
| Methods | Allocation: Randomised |
| Participants | 208, country: USA |
| Interventions | Experimental: Group 1 Drug: iCo‐007 350 mcg Experimental: Group 4 Drug: ranibizumab Plus iCo‐007 350 mcg |
| Outcomes | Primary Outcome Measures: |
| Starting date | Study Start Date:February 2012 |
| Contact information | Quan Dong Nguyen, MD, Johns Hopkins University |
| Notes | Sponsors and Collaborators |
| Trial name or title | Safety and Efficacy of Triamcinolone Acetonide Combined With Laser, Bevacizumab Combined With Laser Versus Laser Alone for the Treatment of Diffuse Non‐tractional Diabetic Macular Edema (ALBA) |
| Methods | Allocation: Randomised |
| Participants | 105, country: Spain |
| Interventions | Other: Grid laser |
| Outcomes | Primary Outcome Measures: |
| Starting date | Study Start Date:October 2010 |
| Contact information | Alicia Pareja, MD, Hospital Universitario de Canarias |
| Notes | Sponsor: Hospital Universitario de Canarias |
| Trial name or title | A Phase II Randomized Study to Compare Anti‐VEGF Agents in the Treatment of Diabetic Macular Edema (CADME) |
| Methods | Allocation: Randomised |
| Participants | 60, country: USA |
| Interventions | Drug: Ranibizumab and Bevacizumab |
| Outcomes | Primary Outcome Measures: |
| Starting date | Study Start Date:May 2012 |
| Contact information | Henry E. Wiley IV, M.D./National Eye Institute, National Institutes of Health |
| Notes | Sponsor: National Eye Institute (NEI) |
| Trial name or title | Comparative Effectiveness Study of Intravitreal Aflibercept, Bevacizumab, and Ranibizumab for DME (Protocol T) |
| Methods | Allocation: Randomised |
| Participants | 660 |
| Interventions | Drug: 0.5 mg intravitreal ranibizumab Experimental: Aflibercept Drug: 2.0 mg intravitreal aflibercept Experimental: Bevacizumab Drug: 1.25 mg intravitreal bevacizumab |
| Outcomes | Allocation: Randomized |
| Starting date | Study Start Date: August 2012 |
| Contact information | Diabetic Retinopathy Clinical Research Network |
| Notes | Sponsor: |
BCVA: best‐corrected visual acuity
CMT: central macular thickness
CRT: central retinal thicknessCSMO: clinically significant macular oedema
DMO: diabetic macular oedema (DME:US spelling edema)
ETDRS: Early Treatment Diabetic Retinopathy Study
IOP: intraocular pressure
OCT: optical coherence tomography
VA: visual acuity
Data and analyses
| Outcome or subgroup title | No. of studies | No. of participants | Statistical method | Effect size |
| 1 Gain 2+ lines of visual acuity at 1 year Show forest plot | 5 | 556 | Risk Ratio (M‐H, Fixed, 95% CI) | 2.76 [2.02, 3.76] |
| Analysis 1.1  Comparison 1 Anti‐VEGF versus laser, Outcome 1 Gain 2+ lines of visual acuity at 1 year. | ||||
| 1.1 Bevacizumab | 2 | 167 | Risk Ratio (M‐H, Fixed, 95% CI) | 3.06 [1.54, 6.05] |
| 1.2 Ranibizumab | 2 | 300 | Risk Ratio (M‐H, Fixed, 95% CI) | 3.06 [1.93, 4.87] |
| 1.3 Aflibercept | 1 | 89 | Risk Ratio (M‐H, Fixed, 95% CI) | 2.11 [1.26, 3.51] |
| 2 Gain 3+ lines of visual acuity at 1 year Show forest plot | 5 | 556 | Risk Ratio (M‐H, Fixed, 95% CI) | 3.20 [2.07, 4.95] |
| Analysis 1.2  Comparison 1 Anti‐VEGF versus laser, Outcome 2 Gain 3+ lines of visual acuity at 1 year. | ||||
| 2.1 Bevacizumab | 2 | 167 | Risk Ratio (M‐H, Fixed, 95% CI) | 2.52 [1.20, 5.29] |
| 2.2 Ranibizumab | 2 | 300 | Risk Ratio (M‐H, Fixed, 95% CI) | 3.51 [1.78, 6.92] |
| 2.3 Aflibercept | 1 | 89 | Risk Ratio (M‐H, Fixed, 95% CI) | 3.72 [1.52, 9.08] |
| 3 Loss 2+ lines of visual acuity at 1 year Show forest plot | 4 | 481 | Risk Ratio (M‐H, Fixed, 95% CI) | 0.23 [0.12, 0.44] |
| Analysis 1.3  Comparison 1 Anti‐VEGF versus laser, Outcome 3 Loss 2+ lines of visual acuity at 1 year. | ||||
| 3.1 Bevacizumab | 2 | 167 | Risk Ratio (M‐H, Fixed, 95% CI) | 0.19 [0.07, 0.52] |
| 3.2 Ranibizumab | 1 | 225 | Risk Ratio (M‐H, Fixed, 95% CI) | 0.27 [0.09, 0.80] |
| 3.3 Aflibercept | 1 | 89 | Risk Ratio (M‐H, Fixed, 95% CI) | 0.24 [0.05, 1.09] |
| 4 Loss 3+ lines of visual acuity at 1 year Show forest plot | 4 | 481 | Risk Ratio (M‐H, Fixed, 95% CI) | 0.13 [0.05, 0.34] |
| Analysis 1.4  Comparison 1 Anti‐VEGF versus laser, Outcome 4 Loss 3+ lines of visual acuity at 1 year. | ||||
| 4.1 Bevacizumab | 2 | 167 | Risk Ratio (M‐H, Fixed, 95% CI) | 0.16 [0.05, 0.51] |
| 4.2 Ranibizumab | 1 | 225 | Risk Ratio (M‐H, Fixed, 95% CI) | 0.11 [0.01, 0.83] |
| 4.3 Aflibercept | 1 | 89 | Risk Ratio (M‐H, Fixed, 95% CI) | 0.08 [0.00, 1.30] |
| 5 Mean difference in logMAR visual acuity at 1 year Show forest plot | 5 | 554 | Mean Difference (IV, Fixed, 95% CI) | ‐0.13 [‐0.16, ‐0.10] |
| Analysis 1.5  Comparison 1 Anti‐VEGF versus laser, Outcome 5 Mean difference in logMAR visual acuity at 1 year. | ||||
| 5.1 Bevacizumab | 2 | 165 | Mean Difference (IV, Fixed, 95% CI) | ‐0.20 [‐0.28, ‐0.12] |
| 5.2 Ranibizumab | 2 | 300 | Mean Difference (IV, Fixed, 95% CI) | ‐0.10 [‐0.14, ‐0.07] |
| 5.3 Aflibercept | 1 | 89 | Mean Difference (IV, Fixed, 95% CI) | ‐0.27 [‐0.40, ‐0.13] |
| 6 Mean difference in (change of) OCT central macular thickness at 1 year Show forest plot | 4 | 477 | Mean Difference (IV, Fixed, 95% CI) | ‐60.71 [‐83.87, ‐37.54] |
| Analysis 1.6  Comparison 1 Anti‐VEGF versus laser, Outcome 6 Mean difference in (change of) OCT central macular thickness at 1 year. | ||||
| 6.1 Bevacizumab | 2 | 165 | Mean Difference (IV, Fixed, 95% CI) | ‐43.61 [‐82.11, ‐5.11] |
| 6.2 Ranibizumab | 1 | 225 | Mean Difference (IV, Fixed, 95% CI) | ‐57.40 [‐89.86, ‐24.94] |
| 6.3 Aflibercept | 1 | 87 | Mean Difference (IV, Fixed, 95% CI) | ‐121.9 [‐186.47, ‐57.33] |
| 7 Mean difference in logMAR visual acuity at 2 years Show forest plot | 1 | Mean Difference (IV, Fixed, 95% CI) | Totals not selected | |
| Analysis 1.7  Comparison 1 Anti‐VEGF versus laser, Outcome 7 Mean difference in logMAR visual acuity at 2 years. | ||||
| 7.1 Bevacizumab | 1 | Mean Difference (IV, Fixed, 95% CI) | 0.0 [0.0, 0.0] | |
| 8 Mean difference in (change of) OCT Central Macular Thickness at 2 years Show forest plot | 1 | Mean Difference (IV, Fixed, 95% CI) | Totals not selected | |
| Analysis 1.8  Comparison 1 Anti‐VEGF versus laser, Outcome 8 Mean difference in (change of) OCT Central Macular Thickness at 2 years. | ||||
| 8.1 Bevacizumab | 1 | Mean Difference (IV, Fixed, 95% CI) | 0.0 [0.0, 0.0] | |
| 9 Sensitivity analysis excluding studies with eyes as unit (Soheillian 2007): gain 3+ Show forest plot | 3 | 380 | Risk Ratio (M‐H, Fixed, 95% CI) | 3.29 [1.77, 6.13] |
| Analysis 1.9  Comparison 1 Anti‐VEGF versus laser, Outcome 9 Sensitivity analysis excluding studies with eyes as unit (Soheillian 2007): gain 3+. | ||||
| 10 Sensitivity analysis excluding studies with eyes as unit (Soheillian 2007): loss 3+ Show forest plot | 2 | 305 | Risk Ratio (M‐H, Fixed, 95% CI) | 0.10 [0.02, 0.41] |
| Analysis 1.10  Comparison 1 Anti‐VEGF versus laser, Outcome 10 Sensitivity analysis excluding studies with eyes as unit (Soheillian 2007): loss 3+. | ||||
| Outcome or subgroup title | No. of studies | No. of participants | Statistical method | Effect size |
| 1 Gain 2+ lines of visual acuity at 8 to 12 months Show forest plot | 3 | 497 | Risk Ratio (M‐H, Fixed, 95% CI) | 2.46 [1.77, 3.40] |
| Analysis 2.1  Comparison 2 Anti‐VEGF versus sham, Outcome 1 Gain 2+ lines of visual acuity at 8 to 12 months. | ||||
| 1.1 Pegaptanib | 2 | 346 | Risk Ratio (M‐H, Fixed, 95% CI) | 2.11 [1.43, 3.09] |
| 1.2 Ranibizumab | 1 | 151 | Risk Ratio (M‐H, Fixed, 95% CI) | 3.31 [1.80, 6.09] |
| 2 Gain 3+ lines of visual acuity at 8 to 12 months Show forest plot | 3 | 497 | Risk Ratio (M‐H, Fixed, 95% CI) | 2.19 [1.36, 3.53] |
| Analysis 2.2  Comparison 2 Anti‐VEGF versus sham, Outcome 2 Gain 3+ lines of visual acuity at 8 to 12 months. | ||||
| 2.1 Pegaptanib | 2 | 346 | Risk Ratio (M‐H, Fixed, 95% CI) | 1.79 [1.01, 3.16] |
| 2.2 Ranibizumab | 1 | 151 | Risk Ratio (M‐H, Fixed, 95% CI) | 3.17 [1.32, 7.62] |
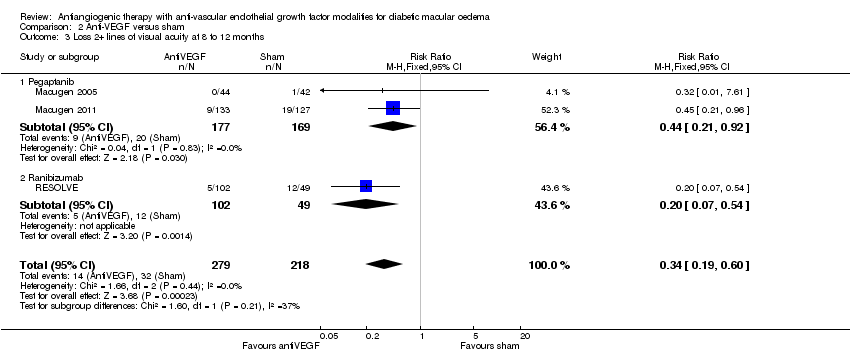
| 3 Loss 2+ lines of visual acuity at 8 to 12 months Show forest plot | 3 | 497 | Risk Ratio (M‐H, Fixed, 95% CI) | 0.34 [0.19, 0.60] |
| Analysis 2.3  Comparison 2 Anti‐VEGF versus sham, Outcome 3 Loss 2+ lines of visual acuity at 8 to 12 months. | ||||
| 3.1 Pegaptanib | 2 | 346 | Risk Ratio (M‐H, Fixed, 95% CI) | 0.44 [0.21, 0.92] |
| 3.2 Ranibizumab | 1 | 151 | Risk Ratio (M‐H, Fixed, 95% CI) | 0.20 [0.07, 0.54] |
| 4 Loss 3+ lines of visual acuity at 8 to 12 months Show forest plot | 2 | 411 | Risk Ratio (M‐H, Fixed, 95% CI) | 0.28 [0.13, 0.59] |
| Analysis 2.4  Comparison 2 Anti‐VEGF versus sham, Outcome 4 Loss 3+ lines of visual acuity at 8 to 12 months. | ||||
| 4.1 Pegaptanib | 1 | 260 | Risk Ratio (M‐H, Fixed, 95% CI) | 0.43 [0.16, 1.21] |
| 4.2 Ranibizumab | 1 | 151 | Risk Ratio (M‐H, Fixed, 95% CI) | 0.14 [0.04, 0.50] |
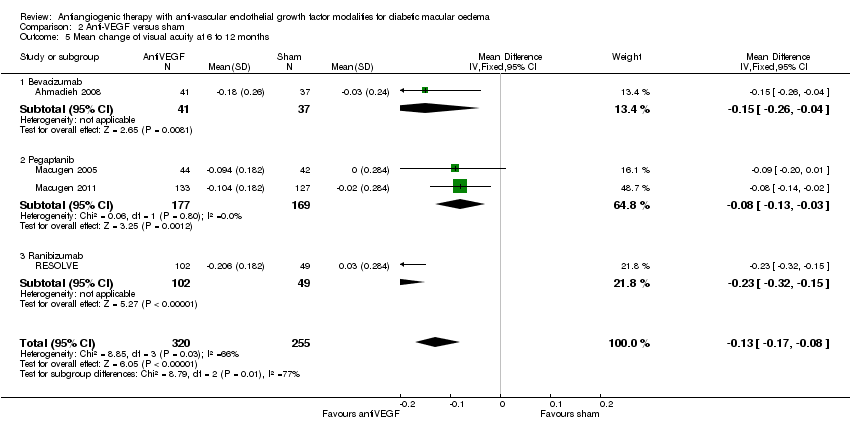
| 5 Mean change of visual acuity at 6 to 12 months Show forest plot | 4 | 575 | Mean Difference (IV, Fixed, 95% CI) | ‐0.13 [‐0.17, ‐0.08] |
| Analysis 2.5  Comparison 2 Anti‐VEGF versus sham, Outcome 5 Mean change of visual acuity at 6 to 12 months. | ||||
| 5.1 Bevacizumab | 1 | 78 | Mean Difference (IV, Fixed, 95% CI) | ‐0.15 [‐0.26, ‐0.04] |
| 5.2 Pegaptanib | 2 | 346 | Mean Difference (IV, Fixed, 95% CI) | ‐0.08 [‐0.13, ‐0.03] |
| 5.3 Ranibizumab | 1 | 151 | Mean Difference (IV, Fixed, 95% CI) | ‐0.23 [‐0.32, ‐0.15] |
| 6 Mean difference in (change of) OCT central macular thickness at 6 to 12 months Show forest plot | 3 | 315 | Mean Difference (IV, Fixed, 95% CI) | ‐126.38 [‐160.27, ‐92.49] |
| Analysis 2.6  Comparison 2 Anti‐VEGF versus sham, Outcome 6 Mean difference in (change of) OCT central macular thickness at 6 to 12 months. | ||||
| 6.1 Bevacizumab | 1 | 78 | Mean Difference (IV, Fixed, 95% CI) | ‐130.6 [‐187.27, ‐73.93] |
| 6.2 Pegaptanib | 1 | 86 | Mean Difference (IV, Fixed, 95% CI) | ‐71.7 [‐149.71, 6.31] |
| 6.3 Ranibizumab | 1 | 151 | Mean Difference (IV, Fixed, 95% CI) | ‐145.80 [‐196.12, ‐95.48] |
| 7 Gain 2+ lines of visual acuity at 2 years Show forest plot | 2 | 716 | Risk Ratio (M‐H, Fixed, 95% CI) | 1.99 [1.64, 2.40] |
| Analysis 2.7  Comparison 2 Anti‐VEGF versus sham, Outcome 7 Gain 2+ lines of visual acuity at 2 years. | ||||
| 7.1 Pegaptanib | 1 | 207 | Risk Ratio (M‐H, Fixed, 95% CI) | 1.28 [0.87, 1.88] |
| 7.2 Ranibizumab | 1 | 509 | Risk Ratio (M‐H, Fixed, 95% CI) | 2.30 [1.85, 2.86] |
| 8 Gain 3+ lines of visual acuity at 2 years Show forest plot | 2 | 716 | Risk Ratio (M‐H, Fixed, 95% CI) | 2.44 [1.85, 3.23] |
| Analysis 2.8  Comparison 2 Anti‐VEGF versus sham, Outcome 8 Gain 3+ lines of visual acuity at 2 years. | ||||
| 8.1 Pegaptanib | 1 | 207 | Risk Ratio (M‐H, Fixed, 95% CI) | 1.56 [0.87, 2.78] |
| 8.2 Ranibizumab | 1 | 509 | Risk Ratio (M‐H, Fixed, 95% CI) | 2.80 [2.03, 3.86] |
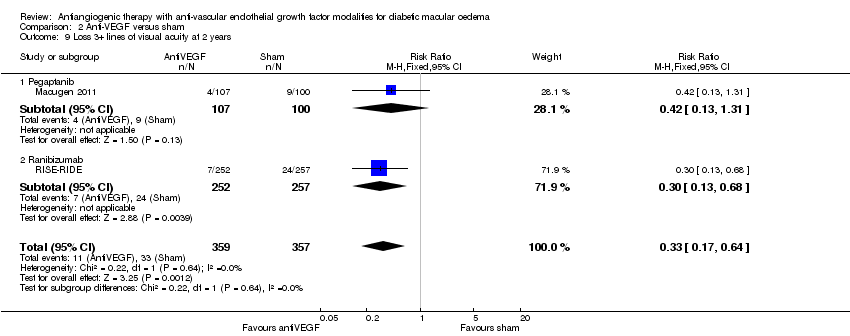
| 9 Loss 3+ lines of visual acuity at 2 years Show forest plot | 2 | 716 | Risk Ratio (M‐H, Fixed, 95% CI) | 0.33 [0.17, 0.64] |
| Analysis 2.9  Comparison 2 Anti‐VEGF versus sham, Outcome 9 Loss 3+ lines of visual acuity at 2 years. | ||||
| 9.1 Pegaptanib | 1 | 207 | Risk Ratio (M‐H, Fixed, 95% CI) | 0.42 [0.13, 1.31] |
| 9.2 Ranibizumab | 1 | 509 | Risk Ratio (M‐H, Fixed, 95% CI) | 0.30 [0.13, 0.68] |
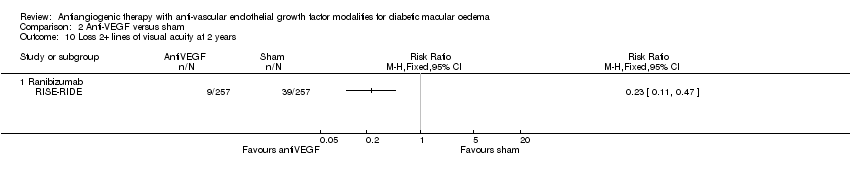
| 10 Loss 2+ lines of visual acuity at 2 years Show forest plot | 1 | Risk Ratio (M‐H, Fixed, 95% CI) | Totals not selected | |
| Analysis 2.10  Comparison 2 Anti‐VEGF versus sham, Outcome 10 Loss 2+ lines of visual acuity at 2 years. | ||||
| 10.1 Ranibizumab | 1 | Risk Ratio (M‐H, Fixed, 95% CI) | 0.0 [0.0, 0.0] | |
| 11 Mean change of visual acuity at 2 years Show forest plot | 2 | 716 | Mean Difference (IV, Fixed, 95% CI) | ‐0.16 [‐0.20, ‐0.12] |
| Analysis 2.11  Comparison 2 Anti‐VEGF versus sham, Outcome 11 Mean change of visual acuity at 2 years. | ||||
| 11.1 Pegaptanib | 1 | 207 | Mean Difference (IV, Fixed, 95% CI) | ‐0.10 [‐0.17, ‐0.02] |
| 11.2 Ranibizumab | 1 | 509 | Mean Difference (IV, Fixed, 95% CI) | ‐0.19 [‐0.23, ‐0.14] |
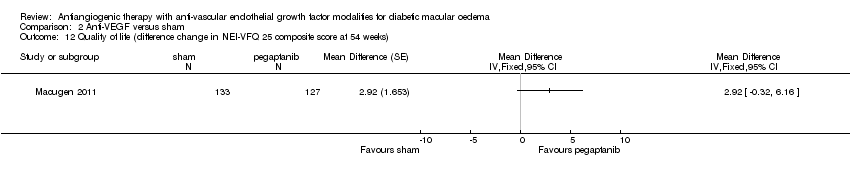
| 12 Quality of life (difference change in NEI‐VFQ 25 composite score at 54 weeks) Show forest plot | 1 | Mean Difference (Fixed, 95% CI) | Totals not selected | |
| Analysis 2.12  Comparison 2 Anti‐VEGF versus sham, Outcome 12 Quality of life (difference change in NEI‐VFQ 25 composite score at 54 weeks). | ||||
| 13 Quality of life (difference change in NEI‐VFQ 25 composite score at 102 weeks) Show forest plot | 1 | Mean Difference (Fixed, 95% CI) | Totals not selected | |
| Analysis 2.13  Comparison 2 Anti‐VEGF versus sham, Outcome 13 Quality of life (difference change in NEI‐VFQ 25 composite score at 102 weeks). | ||||
| Outcome or subgroup title | No. of studies | No. of participants | Statistical method | Effect size |
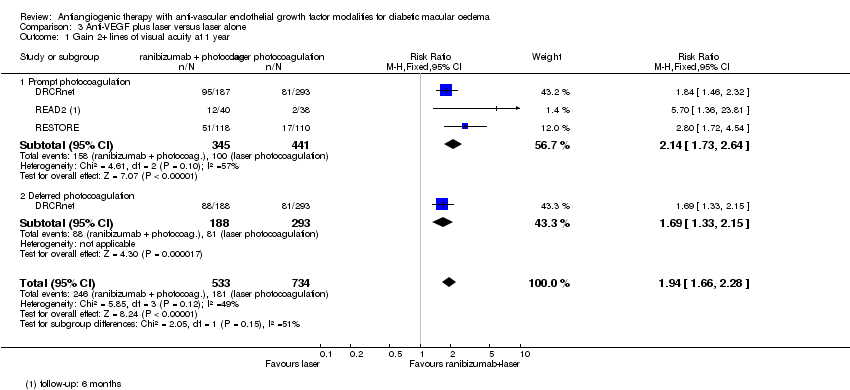
| 1 Gain 2+ lines of visual acuity at 1 year Show forest plot | 3 | 1267 | Risk Ratio (M‐H, Fixed, 95% CI) | 1.94 [1.66, 2.28] |
| Analysis 3.1  Comparison 3 Anti‐VEGF plus laser versus laser alone, Outcome 1 Gain 2+ lines of visual acuity at 1 year. | ||||
| 1.1 Prompt photocoagulation | 3 | 786 | Risk Ratio (M‐H, Fixed, 95% CI) | 2.14 [1.73, 2.64] |
| 1.2 Deferred photocoagulation | 1 | 481 | Risk Ratio (M‐H, Fixed, 95% CI) | 1.69 [1.33, 2.15] |
| 2 Gain 3+ lines of visual acuity at 1 year Show forest plot | 3 | 1267 | Risk Ratio (M‐H, Fixed, 95% CI) | 2.11 [1.67, 2.67] |
| Analysis 3.2  Comparison 3 Anti‐VEGF plus laser versus laser alone, Outcome 2 Gain 3+ lines of visual acuity at 1 year. | ||||
| 2.1 Prompt photocoagulation | 3 | 786 | Risk Ratio (M‐H, Fixed, 95% CI) | 2.29 [1.67, 3.13] |
| 2.2 Deferred photocoagulation | 1 | 481 | Risk Ratio (M‐H, Fixed, 95% CI) | 1.88 [1.31, 2.70] |
| 3 Loss 2+ lines of visual acuity at 1 year Show forest plot | 2 | 1189 | Risk Ratio (M‐H, Fixed, 95% CI) | 0.26 [0.15, 0.43] |
| Analysis 3.3  Comparison 3 Anti‐VEGF plus laser versus laser alone, Outcome 3 Loss 2+ lines of visual acuity at 1 year. | ||||
| 3.1 Prompt photocoagulation | 2 | 708 | Risk Ratio (M‐H, Fixed, 95% CI) | 0.27 [0.14, 0.51] |
| 3.2 Deferred photocoagulation | 1 | 481 | Risk Ratio (M‐H, Fixed, 95% CI) | 0.24 [0.10, 0.56] |
| 4 Loss 3+ lines of visual acuity at 1 year Show forest plot | 2 | 1189 | Risk Ratio (M‐H, Random, 95% CI) | 0.29 [0.15, 0.55] |
| Analysis 3.4  Comparison 3 Anti‐VEGF plus laser versus laser alone, Outcome 4 Loss 3+ lines of visual acuity at 1 year. | ||||
| 4.1 Prompt photocoagulation | 2 | 708 | Risk Ratio (M‐H, Random, 95% CI) | 0.29 [0.13, 0.67] |
| 4.2 Deferred photocoagulation | 1 | 481 | Risk Ratio (M‐H, Random, 95% CI) | 0.27 [0.10, 0.77] |
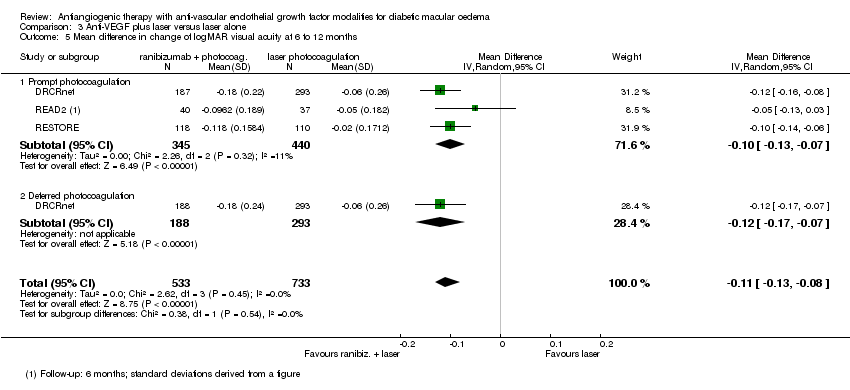
| 5 Mean difference in change of logMAR visual acuity at 6 to 12 months Show forest plot | 3 | 1266 | Mean Difference (IV, Random, 95% CI) | ‐0.11 [‐0.13, ‐0.08] |
| Analysis 3.5  Comparison 3 Anti‐VEGF plus laser versus laser alone, Outcome 5 Mean difference in change of logMAR visual acuity at 6 to 12 months. | ||||
| 5.1 Prompt photocoagulation | 3 | 785 | Mean Difference (IV, Random, 95% CI) | ‐0.10 [‐0.13, ‐0.07] |
| 5.2 Deferred photocoagulation | 1 | 481 | Mean Difference (IV, Random, 95% CI) | ‐0.12 [‐0.17, ‐0.07] |
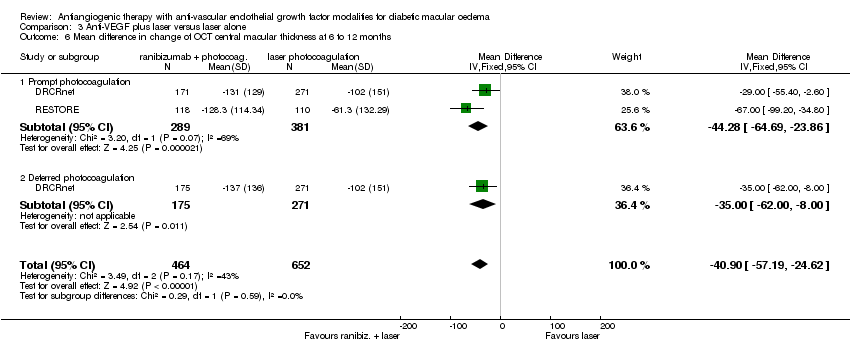
| 6 Mean difference in change of OCT central macular thickness at 6 to 12 months Show forest plot | 2 | 1116 | Mean Difference (IV, Fixed, 95% CI) | ‐40.90 [‐57.19, ‐24.62] |
| Analysis 3.6  Comparison 3 Anti‐VEGF plus laser versus laser alone, Outcome 6 Mean difference in change of OCT central macular thickness at 6 to 12 months. | ||||
| 6.1 Prompt photocoagulation | 2 | 670 | Mean Difference (IV, Fixed, 95% CI) | ‐44.28 [‐64.69, ‐23.86] |
| 6.2 Deferred photocoagulation | 1 | 446 | Mean Difference (IV, Fixed, 95% CI) | ‐35.0 [‐62.00, ‐6.00] |
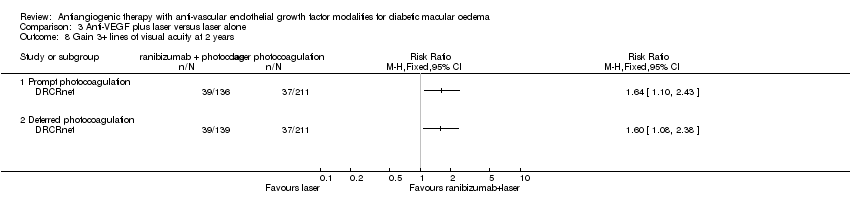
| 7 Gain 2+ lines of visual acuity at 2 years Show forest plot | 1 | Risk Ratio (M‐H, Fixed, 95% CI) | Totals not selected | |
| Analysis 3.7  Comparison 3 Anti‐VEGF plus laser versus laser alone, Outcome 7 Gain 2+ lines of visual acuity at 2 years. | ||||
| 7.1 Prompt photocoagulation | 1 | Risk Ratio (M‐H, Fixed, 95% CI) | 0.0 [0.0, 0.0] | |
| 7.2 Deferred photocoagulation | 1 | Risk Ratio (M‐H, Fixed, 95% CI) | 0.0 [0.0, 0.0] | |
| 8 Gain 3+ lines of visual acuity at 2 years Show forest plot | 1 | Risk Ratio (M‐H, Fixed, 95% CI) | Totals not selected | |
| Analysis 3.8  Comparison 3 Anti‐VEGF plus laser versus laser alone, Outcome 8 Gain 3+ lines of visual acuity at 2 years. | ||||
| 8.1 Prompt photocoagulation | 1 | Risk Ratio (M‐H, Fixed, 95% CI) | 0.0 [0.0, 0.0] | |
| 8.2 Deferred photocoagulation | 1 | Risk Ratio (M‐H, Fixed, 95% CI) | 0.0 [0.0, 0.0] | |
| 9 Loss 2+ lines of visual acuity at 2 years Show forest plot | 1 | Risk Ratio (M‐H, Random, 95% CI) | Totals not selected | |
| Analysis 3.9  Comparison 3 Anti‐VEGF plus laser versus laser alone, Outcome 9 Loss 2+ lines of visual acuity at 2 years. | ||||
| 9.1 Prompt photocoagulation | 1 | Risk Ratio (M‐H, Random, 95% CI) | 0.0 [0.0, 0.0] | |
| 9.2 Deferred photocoagulation | 1 | Risk Ratio (M‐H, Random, 95% CI) | 0.0 [0.0, 0.0] | |
| 10 Loss 3+ lines of visual acuity at 2 years Show forest plot | 1 | Risk Ratio (M‐H, Fixed, 95% CI) | Totals not selected | |
| Analysis 3.10  Comparison 3 Anti‐VEGF plus laser versus laser alone, Outcome 10 Loss 3+ lines of visual acuity at 2 years. | ||||
| 10.1 Prompt photocoagulation | 1 | Risk Ratio (M‐H, Fixed, 95% CI) | 0.0 [0.0, 0.0] | |
| 10.2 Deferred photocoagulation | 1 | Risk Ratio (M‐H, Fixed, 95% CI) | 0.0 [0.0, 0.0] | |
| 11 Mean difference in change of logMAR visual acuity at 2 years Show forest plot | 1 | Mean Difference (IV, Fixed, 95% CI) | Totals not selected | |
| Analysis 3.11  Comparison 3 Anti‐VEGF plus laser versus laser alone, Outcome 11 Mean difference in change of logMAR visual acuity at 2 years. | ||||
| 11.1 Prompt photocoagulation | 1 | Mean Difference (IV, Fixed, 95% CI) | 0.0 [0.0, 0.0] | |
| 11.2 Deferred photocoagulation | 1 | Mean Difference (IV, Fixed, 95% CI) | 0.0 [0.0, 0.0] | |
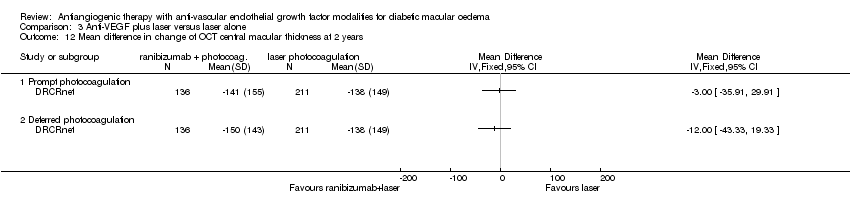
| 12 Mean difference in change of OCT central macular thickness at 2 years Show forest plot | 1 | Mean Difference (IV, Fixed, 95% CI) | Totals not selected | |
| Analysis 3.12  Comparison 3 Anti‐VEGF plus laser versus laser alone, Outcome 12 Mean difference in change of OCT central macular thickness at 2 years. | ||||
| 12.1 Prompt photocoagulation | 1 | Mean Difference (IV, Fixed, 95% CI) | 0.0 [0.0, 0.0] | |
| 12.2 Deferred photocoagulation | 1 | Mean Difference (IV, Fixed, 95% CI) | 0.0 [0.0, 0.0] | |
| Outcome or subgroup title | No. of studies | No. of participants | Statistical method | Effect size |
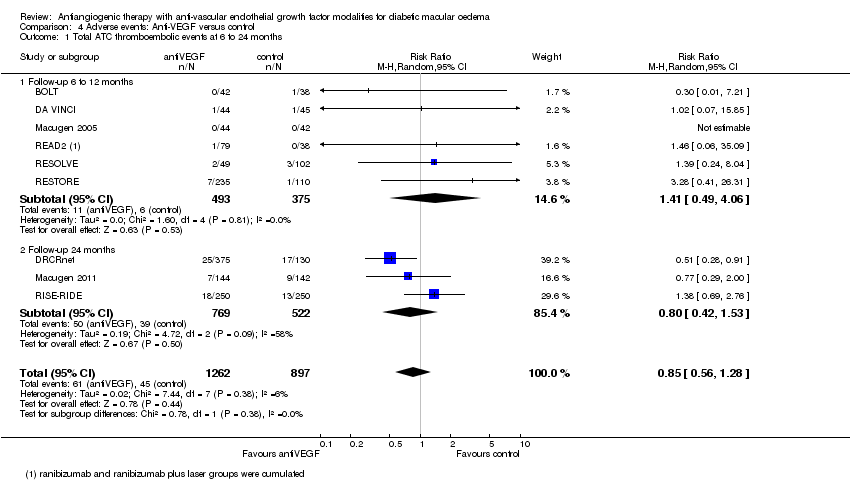
| 1 Total ATC thromboembolic events at 6 to 24 months Show forest plot | 9 | 2159 | Risk Ratio (M‐H, Random, 95% CI) | 0.85 [0.56, 1.28] |
| Analysis 4.1  Comparison 4 Adverse events: Anti‐VEGF versus control, Outcome 1 Total ATC thromboembolic events at 6 to 24 months. | ||||
| 1.1 Follow‐up 6 to 12 months | 6 | 868 | Risk Ratio (M‐H, Random, 95% CI) | 1.41 [0.49, 4.06] |
| 1.2 Follow‐up 24 months | 3 | 1291 | Risk Ratio (M‐H, Random, 95% CI) | 0.80 [0.42, 1.53] |
| 2 Death Show forest plot | 9 | 2159 | Risk Ratio (M‐H, Random, 95% CI) | 0.95 [0.52, 1.74] |
| Analysis 4.2  Comparison 4 Adverse events: Anti‐VEGF versus control, Outcome 2 Death. | ||||
| 2.1 Follow‐up 6 to 12 months | 6 | 868 | Risk Ratio (M‐H, Random, 95% CI) | 0.82 [0.24, 2.83] |
| 2.2 Follow‐up 24 months | 3 | 1291 | Risk Ratio (M‐H, Random, 95% CI) | 1.11 [0.36, 3.45] |

Methodological quality summary: review authors' judgements about each methodological quality item for each included study.
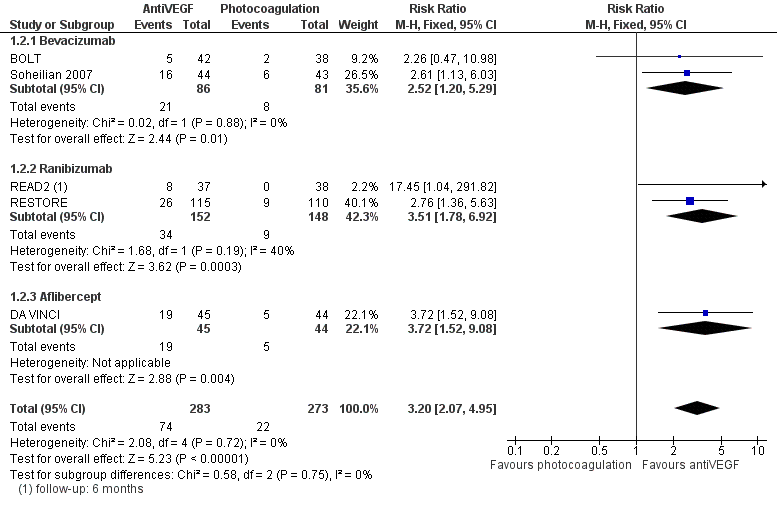
Forest plot of comparison: 2 AntiVEGF versus Laser, outcome: 2.2 Gain 3+ lines of visual acuity at 1 year.

Forest plot of comparison: 2 AntiVEGF versus laser, outcome: 2.4 Loss 3+ lines of visual acuity at 1 year.
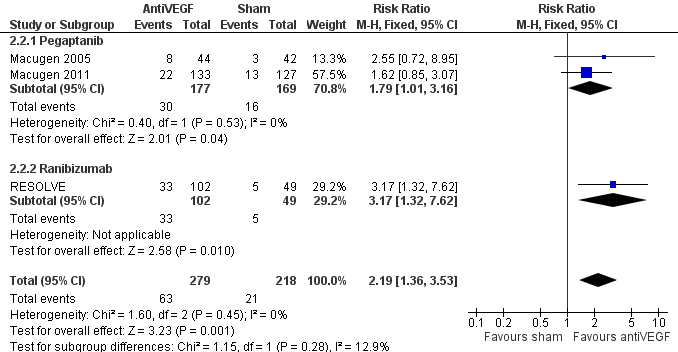
Forest plot of comparison: 1 AntiVEGF versus sham, outcome: 1.2 Gain 3+ lines of visual acuity at 8 to 12 months.
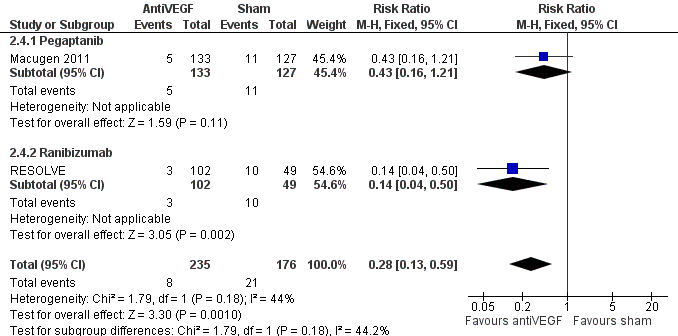
Forest plot of comparison: 1 AntiVEGF versus sham, outcome: 1.4 Loss 3+ lines of visual acuity at 8 to 12 months.
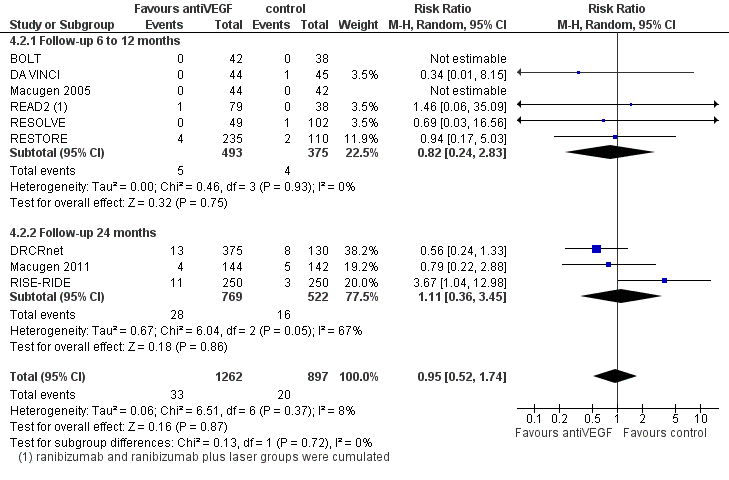
Forest plot of comparison: 4 Adverse events: antiVEGF versus control at 6 to 24 months, outcome: 4.2 Death.
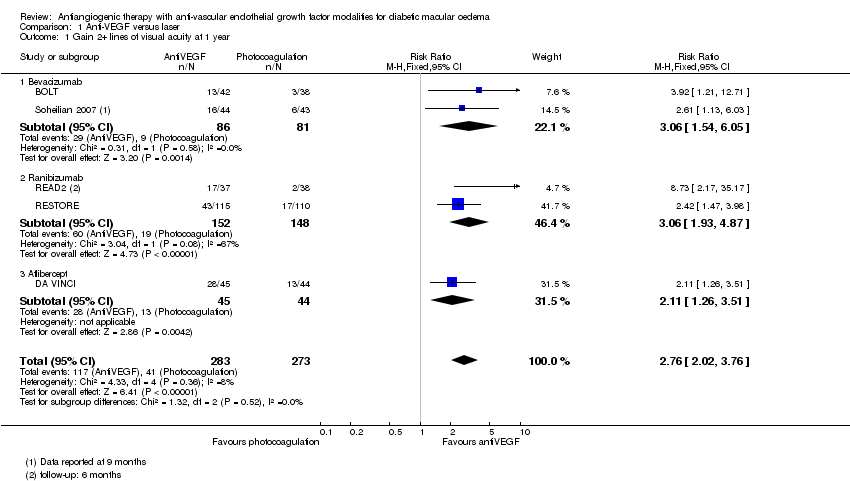
Comparison 1 Anti‐VEGF versus laser, Outcome 1 Gain 2+ lines of visual acuity at 1 year.

Comparison 1 Anti‐VEGF versus laser, Outcome 2 Gain 3+ lines of visual acuity at 1 year.

Comparison 1 Anti‐VEGF versus laser, Outcome 3 Loss 2+ lines of visual acuity at 1 year.
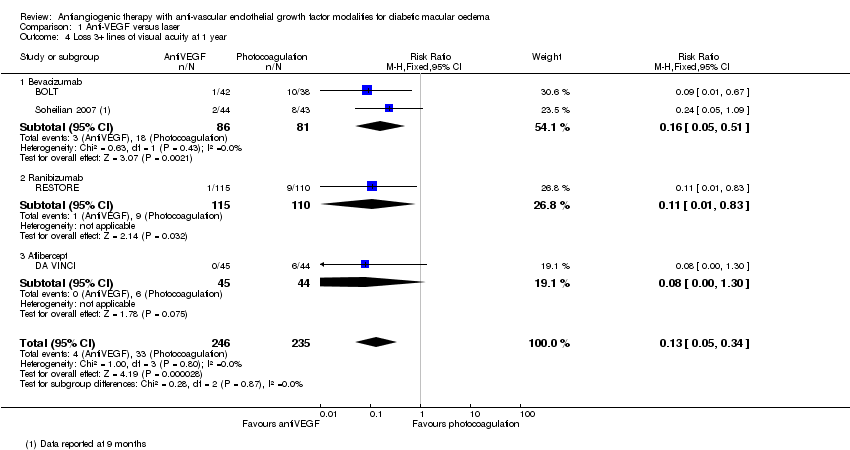
Comparison 1 Anti‐VEGF versus laser, Outcome 4 Loss 3+ lines of visual acuity at 1 year.

Comparison 1 Anti‐VEGF versus laser, Outcome 5 Mean difference in logMAR visual acuity at 1 year.

Comparison 1 Anti‐VEGF versus laser, Outcome 6 Mean difference in (change of) OCT central macular thickness at 1 year.

Comparison 1 Anti‐VEGF versus laser, Outcome 7 Mean difference in logMAR visual acuity at 2 years.

Comparison 1 Anti‐VEGF versus laser, Outcome 8 Mean difference in (change of) OCT Central Macular Thickness at 2 years.

Comparison 1 Anti‐VEGF versus laser, Outcome 9 Sensitivity analysis excluding studies with eyes as unit (Soheillian 2007): gain 3+.

Comparison 1 Anti‐VEGF versus laser, Outcome 10 Sensitivity analysis excluding studies with eyes as unit (Soheillian 2007): loss 3+.
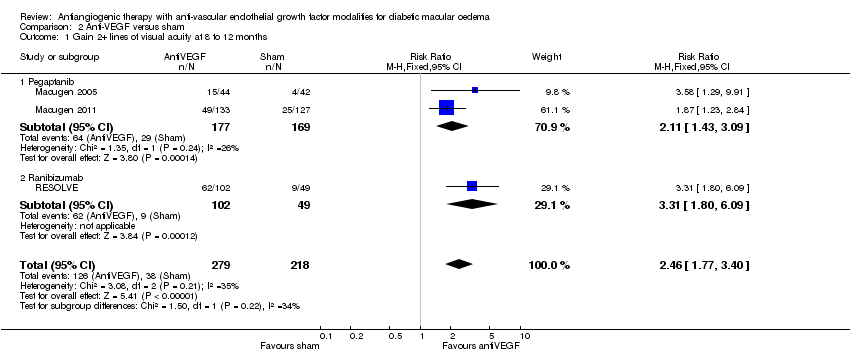
Comparison 2 Anti‐VEGF versus sham, Outcome 1 Gain 2+ lines of visual acuity at 8 to 12 months.
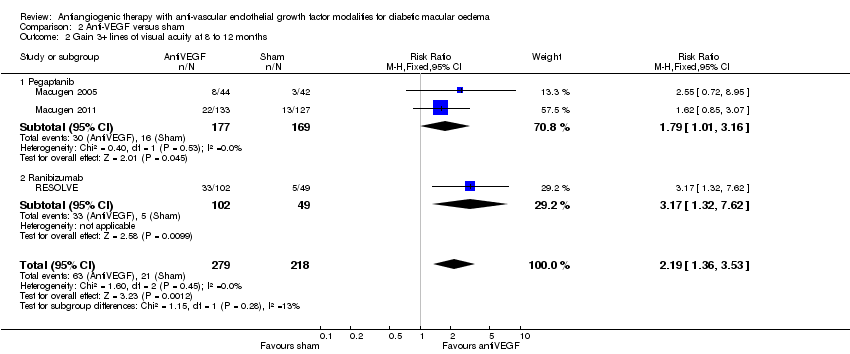
Comparison 2 Anti‐VEGF versus sham, Outcome 2 Gain 3+ lines of visual acuity at 8 to 12 months.
Comparison 2 Anti‐VEGF versus sham, Outcome 3 Loss 2+ lines of visual acuity at 8 to 12 months.

Comparison 2 Anti‐VEGF versus sham, Outcome 4 Loss 3+ lines of visual acuity at 8 to 12 months.
Comparison 2 Anti‐VEGF versus sham, Outcome 5 Mean change of visual acuity at 6 to 12 months.

Comparison 2 Anti‐VEGF versus sham, Outcome 6 Mean difference in (change of) OCT central macular thickness at 6 to 12 months.

Comparison 2 Anti‐VEGF versus sham, Outcome 7 Gain 2+ lines of visual acuity at 2 years.

Comparison 2 Anti‐VEGF versus sham, Outcome 8 Gain 3+ lines of visual acuity at 2 years.
Comparison 2 Anti‐VEGF versus sham, Outcome 9 Loss 3+ lines of visual acuity at 2 years.
Comparison 2 Anti‐VEGF versus sham, Outcome 10 Loss 2+ lines of visual acuity at 2 years.

Comparison 2 Anti‐VEGF versus sham, Outcome 11 Mean change of visual acuity at 2 years.
Comparison 2 Anti‐VEGF versus sham, Outcome 12 Quality of life (difference change in NEI‐VFQ 25 composite score at 54 weeks).

Comparison 2 Anti‐VEGF versus sham, Outcome 13 Quality of life (difference change in NEI‐VFQ 25 composite score at 102 weeks).
Comparison 3 Anti‐VEGF plus laser versus laser alone, Outcome 1 Gain 2+ lines of visual acuity at 1 year.

Comparison 3 Anti‐VEGF plus laser versus laser alone, Outcome 2 Gain 3+ lines of visual acuity at 1 year.

Comparison 3 Anti‐VEGF plus laser versus laser alone, Outcome 3 Loss 2+ lines of visual acuity at 1 year.

Comparison 3 Anti‐VEGF plus laser versus laser alone, Outcome 4 Loss 3+ lines of visual acuity at 1 year.
Comparison 3 Anti‐VEGF plus laser versus laser alone, Outcome 5 Mean difference in change of logMAR visual acuity at 6 to 12 months.
Comparison 3 Anti‐VEGF plus laser versus laser alone, Outcome 6 Mean difference in change of OCT central macular thickness at 6 to 12 months.

Comparison 3 Anti‐VEGF plus laser versus laser alone, Outcome 7 Gain 2+ lines of visual acuity at 2 years.
Comparison 3 Anti‐VEGF plus laser versus laser alone, Outcome 8 Gain 3+ lines of visual acuity at 2 years.

Comparison 3 Anti‐VEGF plus laser versus laser alone, Outcome 9 Loss 2+ lines of visual acuity at 2 years.

Comparison 3 Anti‐VEGF plus laser versus laser alone, Outcome 10 Loss 3+ lines of visual acuity at 2 years.

Comparison 3 Anti‐VEGF plus laser versus laser alone, Outcome 11 Mean difference in change of logMAR visual acuity at 2 years.
Comparison 3 Anti‐VEGF plus laser versus laser alone, Outcome 12 Mean difference in change of OCT central macular thickness at 2 years.
Comparison 4 Adverse events: Anti‐VEGF versus control, Outcome 1 Total ATC thromboembolic events at 6 to 24 months.

Comparison 4 Adverse events: Anti‐VEGF versus control, Outcome 2 Death.
| Anti‐VEGF versus laser for diabetic macular oedema | ||||||
| Patient or population: patients with diabetic macular oedema Comparison: laser | ||||||
| Outcomes | Illustrative comparative risks* (95% CI) | Relative effect | No of participants | Quality of the evidence | Comments | |
| Assumed risk | Corresponding risk | |||||
| Control | Anti‐VEGF versus laser | |||||
| Gain 3+ lines of visual acuity at 1 year | 81 per 1000 | 258 per 1000 | RR 3.2 | 556 | ⊕⊕⊕⊝ | BOLT; DA VINCI; READ2; RESTORE; Soheilian 2007 no overall or drug subgroup heterogeneity (I2 = 0%) |
| Loss 3+ lines of visual acuity at 1 year | 140 per 1000 | 18 per 1000 | RR 0.13 | 481 | ⊕⊕⊕⊝ | BOLT; DA VINCI; RESTORE; Soheilian 2007 no overall or drug subgroup heterogeneity (I2 = 0%) |
| Adverse events: seesummary of findings Table 4 | ||||||
| Cost‐effectiveness studies, UK setting | Incremental cost | Incremental QALY | ICER (cost per QALY gained) Base‐case | Main sensitivity analyses | Criticism | Comments |
| not available | not available | £30,277 | 1) 35% of people treated in both eyes: £44,400 2) Utilities source Brazier 20086: £23,664 2) Utilities source Lloyd 2008: £24,779 | Bilateral treatment not considered. Assumption that no treatment is needed beyond year 3. | Manufacturer's submission to NICE. Several assumptions were criticised by the NICE Appraisal Committee that estimated higher ICER under different assumptions. | |
| £4191 | 0.17 | £24,028 | 1) 14 total ranibizumab injections: £38,836 2) Utilities source Lloyd 2008: £19,238 | Bilateral treatment not considered. Assumption that no treatment is needed beyond year 2. | Manufacturer's sponsored study. Main difference versus NICE 2011 likely related to lower number of injections (10 in years 1 to 2 for both NICE 2011 and Mitchell 2012, but 3 versus 0 injections in year 3, respectively (total 13 versus 10). | |
| *The basis for the assumed risk (e.g. the median control group risk across studies) is provided in footnotes. The corresponding risk (and its 95% confidence interval) is based on the assumed risk in the comparison group and the relative effect of the intervention (and its 95% CI). | ||||||
| GRADE Working Group grades of evidence | ||||||
| 1 One small study had problems of baseline imbalance and loss to follow‐up, but we did not downgrade quality because the consequences are not known. 4 Large effect measured precisely (+1). 6Referenced in NICE 2011 but could not find the reference. | ||||||
| Anti‐VEGF compared with sham for diabetic macular oedema | ||||||
| Patient or population: patients with diabetic macular oedema | ||||||
| Outcomes | Illustrative comparative risks* (95% CI) | Relative effect | No of participants | Quality of the evidence | Comments | |
| Assumed risk | Corresponding risk | |||||
| Sham | Anti‐VEGF | |||||
| Gain 3+ lines of visual acuity at 6 to 12 months | 96 per 1000 | 203 per 1000 | RR 2.19 | 497 | ⊕⊕⊕⊝ | Macugen 2005; Macugen 2011; RESOLVE heterogeneity: overall I2 = 0% drug subgroup I2 = 12.9% (P = 0.28) |
| Loss 3+ lines of visual acuity at 6 to 12 months | 119 per 1000 | 33 per 1000 | RR 0.28 | 411 | ⊕⊕⊕⊝ | heterogeneity: overall I2 = 44% drug subgroup I2 = 44.2% (P = 0.18) |
| Adverse events: seesummary of findings Table 4 | ||||||
| *The basis for the assumed risk (e.g. the median control group risk across studies) is provided in footnotes. The corresponding risk (and its 95% confidence interval) is based on the assumed risk in the comparison group and the relative effect of the intervention (and its 95% CI). | ||||||
| GRADE Working Group grades of evidence | ||||||
| 1 Heterogeneity difficult to estimate with few trials in the analysis, two of which are relatively small. Also, data collected at variable follow‐up (‐1). | ||||||
| Ranibizumab plus laser compared with laser alone for diabetic macular oedema | ||||||
| Patient or population: patients with diabetic macular oedema | ||||||
| Outcomes | Illustrative comparative risks* (95% CI) | Relative effect | No of participants | Quality of the evidence | Comments | |
| Assumed risk | Corresponding risk | |||||
| Laser alone | Ranibizumab plus laser | |||||
| Gain 3+ lines of visual acuity at 1 year ‐ Prompt photocoagulation | 118 per 1000 | 249 per 1000 | RR 2.11 | 786 | ⊕⊕⊕⊝ | |
| Gain 3+ lines of visual acuity at 1 year ‐ Deferred photocoagulation | 147 per 1000 | 276 per 1000 | RR 1.88 | 481 | ⊕⊕⊕⊝ | |
| Loss 3+ lines of visual acuity at 1 year ‐ Prompt photocoagulation | 79 per 1000 | 23 per 1000 | RR 0.29 | 708 | ⊕⊕⊕⊝ | no heterogeneity: I2 = 0% |
| Loss 3+ lines of visual acuity at 1 year ‐ Deferred photocoagulation | 78 per 1000 | 21 per 1000 | RR 0.27 | 481 | ⊕⊕⊕⊝ | |
| Adverse events: seesummary of findings Table 4 | ||||||
| *The basis for the assumed risk (e.g. the median control group risk across studies) is provided in footnotes. The corresponding risk (and its 95% confidence interval) is based on the assumed risk in the comparison group and the relative effect of the intervention (and its 95% CI). | ||||||
| GRADE Working Group grades of evidence | ||||||
| 1 Unclear quality for most items in READ‐2, which did not provide loss data; however, no overall quality penalty was applied since READ‐2 received little weight in the meta‐analysis. | ||||||
| Adverse events: Anti‐VEGF compared with control for diabetic macular oedema | ||||||
| Patient or population: patients with diabetic macular oedema | ||||||
| Outcomes | Illustrative comparative risks* (95% CI) | Relative effect | No of participants | Quality of the evidence | Comments | |
| Assumed risk | Corresponding risk | |||||
| Control | Adverse events: anti‐VEGF | |||||
| Total ATC thromboembolic events | 50 per 1000 | 43 per 1000 | RR 0.85 | 2159 | ⊕⊕⊝⊝ | heterogeneity: I2 = 6% |
| Death | 22 per 1000 | 21 per 1000 | RR 0.95 [0.52 to 1.74] | 2159 | ⊕⊕⊝⊝ | heterogeneity: I2 = 8% |
| *The basis for the assumed risk (e.g. the median control group risk across studies) is provided in footnotes. The corresponding risk (and its 95% confidence interval) is based on the assumed risk in the comparison group and the relative effect of the intervention (and its 95% CI). | ||||||
| GRADE Working Group grades of evidence | ||||||
| 1 Variable follow‐up (6 to 24 months) (‐1). 2 Large 95% confidence intervals, including effects that are clinically relevant (‐1). 3 Antiplatelet Trialists' Collaboration (ATC) events definition not fully met for studies Macugen 2011; RISE‐RIDE and problem with extracting data in many studies (‐1). | ||||||
| Outcome | Gain 3+ lines | Loss 3+ lines | Gain 3+ lines | Loss 3+ lines | |
| Study | antiangiogenic drug | 6 to 12 months | 2 years | ||
| bevacizumab | yes | yes | yes | yes | |
| bevacizumab | E | E | E | E | |
| bevacizumab | yes | yes | NA | NA | |
| pegaptanib | yes | E | NA | NA | |
| pegaptanib | yes | yes | yes | yes | |
| ranibizumab | yes | yes | yes | yes | |
| ranibizumab | yes | E | NA | NA | |
| ranibizumab | yes | yes | NA | NA | |
| ranibizumab | yes | yes | NA | NA | |
| ranibizumab | E | E | yes | yes | |
| aflibercept | yes | yes | NA | NA | |
| yes: outcome analysed and fully reported allowing its inclusion in the meta‐analysis. E: clear that outcome was measured (for example, includes structurally related outcomes) but not necessarily analysed. (adapted from list provided by Paula Williamson at Cochrane training workshop on selective outcome reporting bias, Edinburgh March 2009). NA: not applicable since follow‐up shorter than 2 years | |||||
| study | follow‐up | sham | ranibizumab | bevacizumab | pegaptanib | laser | antiVEGF + laser (prompt) | ranibizumab + laser (deferred) | aflibercept 2 mg PRN§ |
| 36 weeks (reported at 30 weeks) | 4.5 (1.5) | 5 (1.2) | |||||||
| 2 years |
|
| 3.1 (1.6) |
| 1 (0.1) | ||||
| 24 weeks | 3 | 3 | |||||||
| 1 year |
|
|
|
|
| 8 (7,11)* | 9 (7,11)* | ||
| year 2 only |
|
|
|
|
| 2 (0,4)* | 3 (1,7)* | ||
| 1 year |
| 7 (2.81) |
|
| 7.3 (3.22) | 6.8 (2.95) |
| ||
| 1 year | 8.9 (3.5) | 10.2 (2.5) |
|
|
|
| |||
| 1.5 years |
| 5.3 |
|
| 4.4 | 2.9 |
| ||
| 1 year |
|
| 9 (8,9)* |
| 3 (2, 4)* | ||||
| 1 year | 8.4 (1.4) |
|
| 8.3 (1.7) | |||||
| 2 years | 12.9 (4.4) |
|
| 12.7 (4.6) | |||||
| RISE‐RIDE (two studies) | 2 years | 20 (7.5) 20.8 (7.1) | 20.9 (6.3) 21.9 (5.8) |
| |||||
| 1 year | 7.4 (3.19) | ||||||||
| (*): median (interquartile range) number of injection; mean otherwise (§): only regimen 2q8 included: loading dose of 3 initial injection and then as needed (PRN: Pro Re Nata) | |||||||||
| Cut‐off | Studies | Patients | Control | Absolute effect | RR | NNT |
| pegaptanib versus sham (1 year) | ||||||
| Gain 3+ | 2 | 346 | 9% | +7% (0, +20%) | 1.79 (1.01, 3.16) | 13 (5, 1056) |
| Gain 2+ | 2 | 346 | 17% | +19% (+7%, +36%) | 2.11 (1.43, 3.09) | 5 (3, 14) |
| Stable | 2 | 346 | 78% |
|
|
|
| Loss 2+ | 2 | 346 | 12% | ‐7% (‐1%, ‐9%) | 0.44 (0.21, 0.92) | 15 (11, 106) |
| Loss 3+ | 1 | 260 | 9% | ‐5% (+2%, ‐7%) | 0.43 (0.16, 1.21) | 20 (14, 55) |
| ranibizumab versus sham (1 year) | ||||||
| Gain 3+ | 1 | 151 | 10% | +22% (3%, +68%) | 3.17 (1.32, 7.62) | 5 (1, 31) |
| Gain 2+ | 1 | 151 | 18% | +42% (+15%, +93%) | 3.31 (1.80, 6.09) | 2 (1, 7) |
| Stable | 1 | 151 | 57% |
|
|
|
| Loss 2+ | 1 | 151 | 24% | ‐20% (‐11%, ‐23%) | 0.20 (0.07, 0.54) | 5 (4, 9) |
| Loss 3+ | 1 | 151 | 20% | ‐18% (‐10%, ‐20%) | 0.14 (0.04, 0.50) | 6 (5, 10) |
| bevacizumab versus laser (1 year) | ||||||
| Gain 3+ | 2 | 167 | 10% | +15% (2%, +42%) | 2.52 (1.20, 5.29) | 7 (2, 51) |
| Gain 2+ | 2 | 167 | 11% | +22% (+6%, +56%) | 3.06 (1.54, 6.05) | 4 (2, 17) |
| Stable | 2 | 167 | 64% |
|
|
|
| Loss 2+ | 2 | 167 | 25% | ‐20% (‐11%, ‐23%) | 0.19 (0.07, 0.52) | 5 (4, 9) |
| Loss 3+ | 2 | 167 | 22% | ‐17% (‐11%, ‐21%) | 0.16 (0.05, 0.51) | 5 (5, 9) |
| ranibizumab versus laser (1 year) | ||||||
| Gain 3+ | 1 | 225 | 8% | +21% (6%, +48%) | 3.51 (1.78, 6.92) | 7 (3, 34) |
| Gain 2+ | 1 | 225 | 15% | +32% (+14%, +60%) | 3.06 (1.93, 4.87) | 5 (2, 14) |
| Stable | 1 | 225 | 72% |
|
|
|
| Loss 2+ | 1 | 225 | 13% | ‐9% (‐3%, ‐12%) | 0.27 (0.09, 0.80) | 11 (9, 39) |
| Loss 3+ | 1 | 225 | 8% | ‐7% (‐1%, ‐8%) | 0.11 (0.01, 0.83) | 14 (12, 72) |
| ranibizumab plus prompt laser versus laser (1 year) | ||||||
| Gain 3+ | 3 | 786 | 12% | +15% (8%, +25%) | 2.29 [1.67, 3.13) | 7 (4, 13) |
| Gain 2+ | 3 | 786 | 23% | +26% (+17%, +37%) | 2.14 [1.73, 2.64) | 4 (3, 6) |
| Stable | 2 | 708 | 63% |
|
|
|
| Loss 2+ | 2 | 708 | 13% | ‐10% (‐6%, ‐11%) | 0.27 (0.14, 0.51) | 10 (9, 16) |
| Loss 3+ | 2 | 708 | 8% | ‐6% (‐3%, ‐7%) | 0.29 [0.13, 0.67) | 17 (14, 38) |
| aflibercept (2PRN§) versus laser (1 year) | ||||||
| Gain 3+ | 1 | 89 | 11% | 31% (6%, 92%) | 3.72 (1.52, 9.08) | 3 (1, 17) |
| Gain 2+ | 1 | 89 | 30% | 33% (8%, 74%) | 2.11 (1.26, 3.51) | 3 (1, 13) |
| Stable | 1 | 89 | 52% |
|
|
|
| Loss 2+ | 1 | 89 | 18% | ‐14% (‐17%, 2%) | 0.24 (0.05, 1.09) | 7 (6, 61) |
| Loss 3+ | 1 | 89 | 14% | ‐13% (‐14%,4%) | 0.08 (0.00, 1.30) | 8 (7, 24) |
| (*) NNT not presented because difference not statistically significant and both benefit and harm are possible according to 95% confidence limits. (§): data extracted from only 1 of 4 active drug comparison groups (loading dose of 3 initial 2 mg injection, then as needed; PRN: Pro Re Nata) | ||||||
| study | treatment | gain 2+ | gain 3+ | total |
| laser | 3 | 2 | 38 | |
| bevacizumab | 13 | 5 | 42 | |
| laser | 81 | 43 | 293 | |
| ranibizumab/laser | 95 | 57 | 187 | |
| sham | 4 | 3 | 42 | |
| pegaptanib | 15 | 8 | 44 | |
| sham | 25 | 13 | 127 | |
| pegaptanib | 49 | 22 | 133 | |
| laser | 2 | 0 | 38 | |
| ranibizumab | 17 | 8 | 37 | |
| ranibizumab/laser | 12 | 3 | 40 | |
| sham | 9 | 5 | 49 | |
| ranibizumab | 62 | 33 | 102 | |
| laser | 17 | 9 | 110 | |
| ranibizumab | 43 | 26 | 115 | |
| ranibizumab/laser | 51 | 27 | 118 | |
| laser | 6 | 6 | 43 | |
| bevacizumab | 16 | 16 | 44 | |
| laser | 28 | 5 | 44 | |
| aflibercept* | 13 | 19 | 45 | |
| (*): only 1 of 4 aflibercept regimens was selected, based on similarity to current clinical practice | ||||
| study | follow‐up | sham | ranibizumab | bevacizumab | pegaptanib | laser | ranibizumab + laser (prompt) | ranibizumab + laser (deferred) | aflibercept 2 mg PRN§ |
| 36 weeks | 0/42 | 1/44 | |||||||
| 2 years |
|
| 0/48 |
| 0/48 | ||||
| Ahmadieh 2008 (#) | 24 weeks | 0 | 0 | ||||||
| 2 years |
|
|
|
| 1/293 | 2/187 | 2/188 | ||
| 1 year |
| 0/115 |
|
| 0/110 | 0/120 |
| ||
| 1 year | 0/49 | 2/102 |
|
|
|
|
| ||
| 2 years |
|
|
|
|
|
| |||
| 1 year |
|
| 0/42 |
| 0/40 |
|
| ||
| 2 years | 0/127 |
|
| 0/133 |
|
|
| ||
| 2 years | 0/250 | 3/250* | |||||||
| 1 year | 0/44 | 1/45 | |||||||
| (*): denominator is total number of patients at mean follow‐up (#): no cases mentioned but number of eyes, not patients, given for each group (§): loading dose of 3 initial injection and then as needed (PRN: Pro Re Nata) | |||||||||
| study | follow‐up | sham | ranibizumab | bevacizumab | pegaptanib | laser | ranibizumab + laser (prompt) | ranibizumab + laser (deferred) | aflibercept 2 mg PRN§ |
| 36 weeks | 0/42 | 0/44 | |||||||
| 36 weeks | 0/48 |
| 0/48 | ||||||
| Ahmadieh 2008 (#) | 24 weeks | 0 | 0 | ||||||
| 2 years |
|
|
|
| 1/293 | 0/187 | 1/188 | ||
| 1 year |
| 0/115 |
|
| 0/110 | 0/120 |
| ||
| 1 year | 1/49 | 0/102 |
|
|
|
|
| ||
| 2 years |
|
|
|
|
|
| |||
| 1 year |
|
| 0/42 |
| 0/40 |
|
| ||
| 2 years | 0/127 |
|
| 0/133 |
|
|
| ||
| 2 years | 1/250 | 1/250* | |||||||
| 0/44 | 0/45 | ||||||||
| (#): no cases mentioned but number of eyes, not patients, given for each group (§): loading dose of 3 initial injection and then as needed (PRN: Pro Re Nata) | |||||||||
| study | follow‐up | sham | ranibizumab | bevacizumab | pegaptanib | laser | ranibizumab + laser (prompt) | ranibizumab + laser (deferred) | aflibercept 2 mg PRN§ |
| 36 weeks | 0/42 | 0/44 | |||||||
| Soheilian 2007 (*) | 36 weeks |
|
| 0/48 | 0/48 | ||||
| Ahmadieh 2008 (*) | 24 weeks | 1 | 0 | ||||||
| 2 years |
| NA |
|
| NA | NA | NA | ||
| 1 year |
| 23/115 |
|
| 15/110 | 17/120 |
| ||
| 1 year | 8/49 | 14/102 |
|
|
|
|
| ||
| 2 years |
|
|
|
| |||||
| 1 year |
|
| 3/42 |
| 7/38 |
|
| ||
| 2 years | 27/142 |
|
| 28/144 |
|
|
| ||
| RISE‐RIDE (#) | 2 years | 25/250 | 22/250* | ||||||
| 1 year | 10/44 | 6/45 | |||||||
| (*): eyes, not patients, as unit of analysis (§): loading dose of 3 initial injection and then as needed (PRN: Pro Re Nata) (#): only 0.5 mg dose NA: not available in the manuscript | |||||||||
| study | follow‐up | sham | ranibizumab | bevacizumab | pegaptanib | laser | ranibizumab + laser | aflibercept 2 mg PRN§ |
| 36 weeks | 0/42 | 0/44 | ||||||
| Soheilian 2007 (*) | 36 weeks | 0/44 | 2/43 | |||||
| Ahmadieh 2008 (*) | 24 weeks | 1/? | 0/? | |||||
| 6 months | 0/39 |
|
| 0/40 | 1/38 | |||
| 2 years |
|
|
|
| 17/130 | 25/375 | ||
| 1 year |
| 6/115 |
|
| 1/110 | 1/120 | ||
| 1 year | 2/49 | 3/102 |
|
|
|
| ||
| 1 year |
|
| 0/42 |
| 1/38 |
| ||
| Macugen 2011 (#) | 2 years | 9/142 |
|
| 7/144 |
|
| |
| RISE‐RIDE (#) | 2 years | 13/250 | 18/250 | |||||
| 1 year | 1/44 | 1/45 | ||||||
| (*): eyes, not patients, as unit of analysis (§): loading dose of 3 initial injection and then as needed (PRN: Pro Re Nata) (#) approved dose only (0.5 mg ranibizumab, 0.3 mg pegaptanib) | ||||||||
| study | follow‐up | sham | ranibizumab | bevacizumab | pegaptanib | laser | ranibizumab + laser | aflibercept 2 mg PRN§ |
| 36 weeks | 0/42 | 0/44 | ||||||
| Soheilian 2007 (*) | 36 weeks |
|
| 0/44 |
| 2/43 | ||
| Ahmadieh 2008 (*) | 24 weeks | 1/? | 0/? | |||||
| 6 months | 0/39 |
|
| 0/40 | 1/38 | |||
| 1 year |
| 2/115 |
|
| 2/110 | 2/120 | ||
| 1 year | 0/49 | 1/102 |
|
|
|
| ||
| 1 year |
|
| 0/42 | 0/38 | ||||
| 2 years |
|
|
|
| 8/130 | 13/375 | ||
| Macugen 2011 (#) | 2 years | 5/142 |
| 4/144 |
|
| ||
| RISE‐RIDE (#) | 2 years | 3/250 | 11/250 |
| ||||
| 1 year | 1/44 | 0/45 | ||||||
| (*): eyes, not patients, as unit of analysis (§): loading dose of 3 initial injection and then as needed (PRN: Pro Re Nata) | ||||||||
| Form of economic analysis
| Cost‐effectiveness analysis (cost per unit line of vision saved).
|
| Population
| Patients with macular oedema due to diabetic retinopathy enrolled in phase I/III RCTs |
| Interventions
| Laser grid photocoagulation, intravitreal triamcinolone, dexamethasone implant, pegaptanib, bevacizumab, ranibizumab
|
| Comparators
| Not defined a priori
|
| Perspective, time horizon
| 6 to 12 months in included studies, life‐long horizon.
|
| Modelling used and Key assumptions
| Quote: “Most index studies offered 1‐year follow‐up data, but resource use data were conservatively extrapolated to 1 year when shorter, assuming a durable result at 1 year, and until death for line‐year calculations. […] By design, costs were generally underestimated and benefits were overestimated for more expensive modalities; the converse was applied to less expensive modalities. Quote: “By using the estimate of lines saved, cost/line saved was calculated. The mean age of each study cohort was used to calculate a life expectancy, by consulting the actuarial table of the Social Security Administration, and to calculate cost/line years saved.”
|
| Effectiveness data
| Single randomised trial comparing any listed intervention to any control. Non comparative studies also used (natural course of all conditions, outcome of bevacizumab treatment for DMO).
|
| Health state valuations (utilities)
| Cost‐benefit analysis, but [quote] “A cost utility analysis was performed by using the lines saved estimate and ascribing 0.03 marginal quality‐adjusted life years (QALYs) for each line gained, a reasonable estimate from previously published data in the VA range of the index study cohorts, albeit for a “better eye,” which was not usually the case in the index study cohorts.”
|
| Unit cost data, price year, resource use data
| Direct cost only, including follow‐up visits, OCT, fluorescein angiography, treatment. Quote: “The Medicare allowable amounts for hospital‐based use (in South Florida as of June 1, 2010) were applied as costs (including hospital facility usage allowable) for the hypothetic 1 year of treatment. All costs were calculated in US dollars; present value adjustments were not included in cost calculations.”
|
| Discounting
| Not mentioned.
|
| Results and sensitivity analyses
| Not reported because we judged study quality was insufficient.
|
| DMO: diabetic macular oedema | |
|
| yes | no | quote/comment |
| Item |
|
| |
| 1. Is the study population clearly described? | Y |
| Quote: "Purpose: To relate costs and treatment benefits for diabetic macular edema, branch retinal vein occlusion, and central retinal vein occlusion." Comment: very general statement including macular oedema due to several diseases. |
| 2. Are competing alternatives clearly described? |
| N | Quote: "For each of the 3 diagnostic groups, an index study (usually a collaborative, randomized, controlled study with 6‐month to 1‐year follow‐up information) was chosen for natural history, focal laser, intravitreal triamcinolone acetonide, intravitreal dexamethasone implant, pegaptanib, bevacizumab, and ranibizumab, and a surgical series for DMO only". Comment: treatments listed, but reasons for this choice are not reported. A discussion of the appropriate comparator was not made. |
| 3. Is a well‐defined research question posed in answerable form? | Y |
| Quote: "Purpose: To relate costs and treatment benefits for diabetic macular edema, branch retinal vein occlusion, and central retinal vein occlusion." Comment: same quotation as above, very general, broad purpose economic study. |
| 4. Is the economic study design appropriate to the stated objective? |
| N | Comment: calculation of cost per line of vision saved for each treatment, as well as of QALYs, made with no probabilistic modelling of transition probabilities between health states, including benefits and adverse events; non probabilistic sensitivity analyses were performed. |
| 5. Is the chosen time horizon appropriate to include relevant costs and consequences? | Y |
| Quote: ""Most index studies offered 1‐year follow‐up data, but resource use data were conservatively extrapolated to 1 year when shorter, assuming a durable result at 1 year, and until death for line‐year calculations". Comment: life‐long time horizon appropriate. |
| 6. Is the actual perspective chosen appropriate? | ? | ? | Comment: perspective not declared. Given the measurement of benefits and direct costs, the perspective should be that of the public health care provider. |
| 7. Are all important and relevant costs for each alternative identified? |
| N | Comment: Costs of treatment, follow‐up visits, OCT and fluorescein angiography considered, but not cost of adverse events. |
| 8. Are all costs measured appropriately in physical units? | Y |
| Quote: "The Medicare allowable amounts for hospital‐based use (in South Florida as of June 1, 2010) were applied as costs (including hospital facility usage allowable) for the hypothetic 1 year of treatment". |
| 9. Are costs valued appropriately? | N | Quote: "By design, costs were generally underestimated and benefits were overestimated for more expensive modalities; the converse was applied to less expensive modalities." "All costs were calculated in US dollars; present value adjustments were not included in cost calculations." Comment: cost assumptions neither justified nor checked in sensitivity analyses; no discount rate applied. | |
| 10. Are all important and relevant outcomes for each alternative identified? |
| N | Comment: adverse events not considered. |
| 11. Are all outcomes measured appropriately? |
| N | See above. |
| 12. Are outcomes valued appropriately? |
| N | See above. |
| 13. Is an incremental analysis of costs and outcomes of alternatives performed? | Y |
| Quote: "By using the estimate of lines saved, cost/line saved was calculated." Comment: cost and outcomes were combined, however the comparator generating the incremental cost‐effectiveness was insufficiently reported. |
| 14. Are all future costs and outcomes discounted appropriately? |
| N | Comment: no discount rate applied. |
| 15. Are all important variables, whose values are uncertain, appropriately subjected to sensitivity analysis? |
| N | Comment: no sensitivity analysis. |
| 16. Do the conclusions follow from the data reported? | Y |
| Comment: conclusions are coherent with results, but the methodology is inappropriate. |
| 17. Does the study discuss the generalizability of the results to other settings and patient/ client groups? |
| N | Quote: "Certainly, selection biases and application differences may apply not only to the index study patient cohorts but also, more important, to the patients actually treated in the clinic on the basis of the results of these studies. Thus, the “real world” differential may be even less. Furthermore, most index studies report up to 1‐year results; the durability and amount of additional costs necessary to maximize longer‐term results are even more conjectural." Comment: the study acknowledges that included RCTs may not be pragmatic and reflect routine clinical practice. |
| 18. Does the article indicate that there is no potential conflict of interest of study researcher(s) and funder(s)? | N |
| Comment: no conflict of interest explicitly declared. |
| 19. Are ethical and distributional issues discussed appropriately? |
| N | Quote: "Although physicians have historically been committed to making treatment decisions independently of treatment costs, at least for distinctly important medical problems, the 15‐fold cost differences, the high prevalence of these conditions, and the ongoing nature of treatment make the issue of costs inescapable. It would seem good stewardship for the physician, the traditional gatekeeper of medical care, to be cognizant of the magnitude of the cost differential and to consider it in some manner in formulating treatment regimens. A problem is that there is no policy basis or even short‐term motivation for the physician to act on these findings. This difficult ethical problem is even more difficult for an individual patient, payor, or health policy maker." Comment: the perspective taken is that of the physician, which does not completely overlap with the perspective of policy‐maker. |
| OCT: optical coherence tomography; RCT: randomised controlled trial | |||
| Form of economic analysis
| Cost‐utility analysis.
|
| Population
| Patients with macular oedema due to diabetic retinopathy enrolled in phase III RCTs RESTORE and DRCRnet. READ2 was excluded because follow‐up was short and treatment schedule was inadequate. |
| Interventions
| Ranibizumab alone or added to laser grid photocoagulation.
|
| Comparators
| Laser grid photocoagulation. |
| Perspective, time horizon
| Perspective of health care provider; follow‐up 12‐24 months in included studies,15 years horizon in modelling.
|
| Modelling used and Key assumptions
| The key section of the original manufacturer's submission is presented here: 1) transition probabilities between three health states in year 1 were drew from changes in best corrected visual acuity (BCVA) in RESTORE for treated and control patients; treatment effect was modelled as stable in year 2 based on DRCRnet and no treatment effect was assumed thereafter, meaning that BCVA would remain constant and decline at the same rate in the two groups after year 1. 2) to estimate the HRQoL associated with each health state corresponding to vision, EQ‐5D data from RESTORE were transformed to utility values using standard social tariffs and then related to BCVA in the treated eye using linear regression. The original manufacturer's submission was revised following the Evidence Review Group comments. Manufacturer's revised assumptions are presented here. 1) patients receiving ranibizumab would receive an average of two injections in a third year of treatment and one injection in a fourth year of treatment. In the laser photocoagulation arm, the model assumed once‐yearly treatments for years 3 and 4. 2) following criticisms, the manufacturer provided a scenario analysis, using its revised model, which simulated treatment in both eyes for 35% of people. This analysis assumed that, in people with bilateral disease, both eyes would be treated and monitored at the same visit, with ranibizumab drug and treatment costs doubled. The analysis applied reduced costs associated with severe visual impairment because fewer people would go blind in both eyes. The analysis assumed that treating the second eye would result in utility gains one quarter the magnitude of those achieved by treating the first eye; this is because the HRQoL of people who can see well with both eyes is only a little better than the HRQoL of people who can see well with one eye. The model calculated this figure by applying a 25% uplift to the QALYs generated by ranibizumab. 3) the revised model predicted that 43% of the cohort would remain alive after 15 whereas the original model had suggested that 65% of people would be alive at that time. 4) had concluded that, by assuming people whose BCVA rose to 76 letters or higher would stop receiving ranibizumab, the manufacturer's original model had not reflected likely clinical practice. Acknowledging this view, the manufacturer removed the stopping rule from the base case of its revised model. 5) [quote] "a further series of scenario analyses adopted alternative estimates of utility drawn from various published sources. When utility values from the better seeing eye study by Lloyd et al. were used, the ICER was £24,779 per QALY gained. When utility was estimated according to an equation published by Sharma et al., associating visual acuity in the better‐seeing eye with HRQoL, the ICER was between £12,312 and £12,610 per QALY gained, depending on the version of the equation used. A final analysis adopted utility values estimated in a study by Brazier et al., in which members of the general public valued levels of visual impairment that were simulated by custom‐made contact lenses, using the time trade‐off method. Participants wore the same lenses in both eyes, so the resulting utility values reflected bilateral impairment of vision. This was the source of utility values the Committee had judged most accurately reflected the HRQoL associated with visual impairment in NICE technology appraisal guidance 155. When these values were used in the revised ranibizumab model, the ICER was £23,664 per QALY gained." Conclusive comments by the Appraisal Commitee are presented here. Quote: “In summary, the Committee considered that amendments to the manufacturer's model made during the consultation process had resulted in a more robust analysis. However, the Committee believed that the manufacturer's revised base‐case model still provided an inaccurate reflection of likely clinical practice in at least six respects:
|
| Effectiveness data
|
|
| Health state valuations (utilities)
| See above.
|
| Unit cost data, price year, resource use data
| Treatment costs:
Costs of low vision:
|
| Discounting
| Not mentioned.
|
| Results and sensitivity analyses
| Results, description of ICER for base‐case scenario and sensitivity analyses:
Quote: “The Committee considered that the manufacturer's model, as revised during consultation, resulted in an ICER for ranibizumab monotherapy compared with laser photocoagulation of £30,277 per QALY gained, which was at the upper limit of the range it could consider to represent an effective use of NHS resources. However, the Committee concluded that this revised model underestimated the ICER because, despite improvements made in response to the Committee's comments in the appraisal consultation document, the model remained reliant on several implausible assumptions. Where the effect of using individual alternative assumptions was quantifiable, the ICER rose by an appreciable amount; for example the ICER increased to £44,400 per QALY gained when 35% of people were assumed to be treated in both eyes. The Committee concluded that a model that relied on a combined set of plausible assumptions would be certain to produce an ICER that substantially exceeded the acceptable range. Therefore, ranibizumab could not be recommended as a treatment for people with diabetic macular oedema. [...] The Committee heard conflicting evidence about the extent to which bevacizumab is currently used to treat diabetic macular oedema in England and Wales for this indication. It concluded that, although bevacizumab is not in routine use throughout the NHS, it is among the treatments adopted by some clinicians and is funded by some NHS trusts. The Committee was mindful that some consultees and commentators supported the evaluation of bevacizumab as a comparator and others opposed it. Because of this, the Committee agreed that, in order to evaluate bevacizumab as a comparator consider a cost‐effectiveness analysis of ranibizumab compared with bevacizumab. However, because it had not been provided with plausible evidence that ranibizumab represents an effective use of NHS resources when compared with laser photocoagulation, the Committee did not believe that considering evidence about the costs and effects of bevacizumab would alter its decision. For this reason, given the current model and its assumptions, the Committee concluded that it could make recommendations on the use of ranibizumab for diabetic macular oedema without requiring additional evidence comparing it with bevacizumab." |
| Form of economic analysis
| Cost‐utility analysis.
|
| Population
| Patients with macular oedema due to diabetic retinopathy enrolled in phase III RCTs RESTORE and DRCRnet. |
| Interventions
| Ranibizumab alone or added to laser grid photocoagulation.
|
| Comparators
| Laser grid photocoagulation. |
| Perspective, time horizon
| 12‐24 months in included studies, 15‐year horizon.
|
| Modelling used and Key assumptions
| Quote: “The model also assumed the same baseline BCVA distribution [asRESTORE], but excluded patients with BCVA >75 letters, consistent with guidance from the ranibizumab summary of product characteristics that such patients may benefit less from treatment than those with baseline BCVA ≤75 letters. The model framework allocated eight linear health states defined by BCVA in the treated eye using a set of 10‐letter (two‐line) categories. Movement of patients from one health state to another was determined by transition probabilities that depended on the effectiveness of treatment and natural BCVA changes over time Costs and outcomes were accrued over 3‐month cycles, applying half‐cycle corrections. The time horizon in the base case was 15 years; although a lifetime horizon could be justified given the chronic nature of the condition, we selected a more conservative approach for the base case because of the lack of evidence on long‐term prognosis. […] Patients were assumed to receive ranibizumab treatment in year 1 at the frequency observed in RESTORE. In year 2, patients were assumed to need fewer injections, as observed in the Diabetic Retinopathy Clinical Research Network (DRCR.net) protocol I study (which included patients with comparable baseline demographics to RESTORE).1 A proportionately smaller number of monitoring visits was therefore assumed in year 2. After year 2, laser therapy was assumed to be administered as required in all arms, with no further need for ranibizumab; the assumed number of monitoring visits was further reduced accordingly. The average BCVA achieved in year 1 was assumed to be maintained during year 2, as was observed in the DRCR.net protocol I study.1 After year 2, all arms of the model followed natural disease history based on 4‐year health state transition outcomes modelled from the Wisconsin Epidemiologic Study of Diabetic Retinopathy (WESDR) reports, the Diabetes Control and Complications Trial and UK Prospective Diabetes Study. Transition probabilities were calibrated to adjust for the improvement in diabetes management since the WESDR reports, and predicted that around 30% of patients would be expected to exhibit a worsening in BCVA of at least 10 letters and 20% of patients would show an improvement of at least 10 letters over a 4‐year time horizon. […] Mortality was estimated by adjusting general UK population death rates according to the increased RR of death in patients with DME. Mulnier et al estimated an increased mortality (HR 1.93) in a UK type 2 diabetes population relative to patients without diabetes, while Hirai et al estimated an HR of 1.27 for death in patients with clinically significant macular oedema (CSME) and diabetes relative to diabetic patients without CSME. We calculated a 2.45 RR of death in a DME population by multiplying these two ratios.
Utility scores were calculated based on patient‐reported outcomes data from RESTORE […], in which patients completed the EuroQoL (EQ‐5D) questionnaire at baseline and months 3, 6 and 12. Individual EQ‐5D health scores were converted into utility scores using preferences from a UK population survey; mean utility scores were calculated for each health state […]. As these states were defined by BCVA in the treated eye, of which 67.2% were the worse‐seeing eye at baseline, this method established an association between utility and BCVA changes in the treated eye.
Health state costs included the costs of treatment and monitoring (Supplementary tables 3–6), and the costs associated with blindness (Supplementary table 2). Treatment costs included the costs of ranibizumab (Novartis UK, personal communication) and its administration, laser therapy and investigative procedures. Monitoring costs, including consultation and procedure costs, were estimated from the UK National Health Service Reference Costs. Costs of blindness included those incurred by the UK National Health Service for items such as low‐vision aids, low‐vision rehabilitation, residential or home care, depression and hip fracture/replacement as listed in the costing study by Meads and Hyde. Where older cost estimates were used, these were inflated to 2010 prices using the Hospital and Community Health Services index.26 The cost of blindness would be incurred only in patients reaching health states with BCVA ≤35 letters (Snellen ≤6/60) in the better‐seeing eye. However, as the study assesses treatment response according to the enrolled eye, the proportion of patients reaching this level within the time horizon of the model is therefore uncertain. As such, the base case model adjusts for the cost of blindness on the basis of treated eyes reaching the BCVA ≤35‐letter threshold. As with other model parameters subject to uncertainty, deviations from this assumption were explored in sensitivity analyses (Supplementary table 7).
[…] An annual 3.5% discount rate was applied for future costs and utilities, consistent with the standard UK approach. |
| Effectiveness data
|
|
| Health state valuations (utilities)
| See above.
|
| Unit cost data, price year, resource use data
| Cost of treatment Ranibizumab injection (0.5 mg vial [x1]) ) £742.17, 7 injections year 1, 3 in year 2. Novartis UK, personal communication. Laser treatment per session (weighted average of day cases and outpatient procedures for vitreous retinal procedures category 1) £274.19, 2 treatments year1, 1 in year 2. NHS Reference Costs 2008–09 – NHS Trusts and PCTs combined (unless otherwise stated). Ophthalmologist visit (weighted first attendance and follow‐up attendance) £84.42, 12 visits ranibizumab, 5 visits laser both in year 1 and 2. NHS Reference Costs 2008–09 – NHS Trusts and PCTs combined (unless otherwise stated) Additional ophthalmologist visit £73.16. Pre‐injection VA and BCVA assessment (first attendance for ophthalomology non‐consultant‐led, non‐admitted visit) £83.97 NHS Reference Costs 2008–09 – NHS Trusts and PCTs combined (unless otherwise stated) Optometrist visit (follow‐up attendance for ophthalomology non‐consultant‐led, non‐admitted visit) £60.92, 12 visits ranibizumab, 5 visits laser. NHS Reference Costs 2008–09 – NHS Trusts and PCTs combined (unless otherwise stated). VA and BCVA checks £55.59 NHS Reference Costs 2008–09 – NHS Trusts and PCTs. combined (unless otherwise stated). Cost of low vision Low vision aids annual cost £194.16 £ in 33% of blind patients Inflated to base year 2008–09. Low vision rehabilitation (occupational health therapist): annual cost £221.00 in 11% of blind patients. Section 7.2: NHS community occupational therapist. Residential care (homecare) – 30% private payer: annual cost £16,998.80 in 30% blind patients. Section 1.2: Private residential care for older people: fees (A) only. Community care £12,064.00 annual cost in 6% of blind patients. £723.84 Section 9.5: Local authority home care worker. Depression annual cost: £558.24in 39% blind patients. Inflated to base year 2008–09. Hip replacement annual cost: £6952.93 in 5% blind patients. Weighted average of major hip. procedures category – 12B and 12C TPCTEI.
|
| Discounting
| 3.5%
|
| Results and sensitivity analyses
| Base Case: ICER £24,028. Discount rate 0‐5% (vs 3.5%): ICER £17,051‐27,042. Time horizon 10‐20 years (vs 15 years): ICER £33,139‐21,343. Cost of blindness (base £6477) ‐25%‐+25%: ICER £27,907‐20,150. Long term progression of visual acuity (vs declining) stable or improved: ICER £26,198‐28,4131. Total n. ranibizumab injections (vs 10) 6‐14: ICER £12,446‐38,836. Baseline age (vs 63 years) 58 years: ICER £19,259. Source of utilities (vs RESTORE) Brazier: ICER £21,953.
|
| QUALITY CRITERION: question | Study | Response | Comments |
| STRUCTURE: Statement of decision problem/objective | |||
| Is there a clear statement of the decision problem? | Yes | Clinical effectiveness and cost effectiveness of ranibizumab monotherapy and ranibizumab in combination with laser photocoagulation compared with laser photocoagulation alone. | |
| Yes | |||
| Is the objective of the evaluation and model specified and consistent with the stated decision problem? | Yes | See above. | |
| Yes | |||
| Is the primary decision‐maker specified? | Yes | Not reported, but models submitted to NICE should take the perspective of the health service provider. | |
| Yes | UK healthcare payer perspective. | ||
| STRUCTURE: Statement of scope/perspective | |||
| Is the perspective of the model stated clearly?
| Yes | Ranibizumab manufacturer’s submission to NICE including an effectiveness review of two RCTs (RESTORE and DRCRnet), costs of treatment and visits and of some of its complications, as well as costs of low vision. Bevacizumab was not included in the submission but was considered a comparator by the Appraisal Committee. | |
| Yes | Manufacturer’s sponsored study on cost‐effectiveness of ranibizumab adopting similar model boundaries as NICE 2011. Bevacizumab not mentioned as a potential comparator. | ||
| Are the model inputs consistent with the stated perspective? | Yes | See above. | |
| Yes | See above. | ||
| Has the scope of the model been stated and justified? | Yes | See above. | |
| Yes | See above. | ||
| Are the outcomes of the model consistent with the perspective, scope and overall objective of the model? | Yes | Utility‐based health‐related quality‐of‐life associated to visual acuity data from RCTs and costs of disease and treatment. | |
| Yes | |||
| STRUCTURE: Rationale for structure | |||
| Is the structure of the model consistent with a coherent theory of the health condition under evaluation? | Yes | Health states and transition probabilities based on changes of best corrected visual acuity changes, although treatment of better‐seeing vs. worse eye or both eyes is a problem. | |
| Yes | |||
| Are the sources of data used to develop the structure of the model specified? | Yes | EQ‐5D data from RESTORE related to visual acuity, NHS reference cost of treatment and visits. Cost of low vision from a published cost study. | |
| Yes | Same as above, plus Wisconsin study (WESDR) data for natural disease history. | ||
| Are the causal relationships described by the model structure justified appropriately? | Unclear | Treatment effect and adverse events are based on RCTs, but costs, and not utility decrement, related to adverse events considered. Although adverse events associated with the treatments were low, unclear if they impact on cost‐effectiveness. | |
| No | Adverse events assumed to have negligible impact on cost‐effectiveness, but no demonstration given. | ||
| STRUCTURE: Structural assumptions | |||
| Are the structural assumptions transparent and justified? | No | See Table 12. We accept the criticism of the Appraisal committee, including the fact that treatment in better‐seeing, worse‐seeing eye or both eyes s not considered. | |
| No | Same as for NICE 2011. | ||
| Are the structural assumptions reasonable given the overall objective, perspective and scope of the model?
| No | See above. | |
| No | |||
| STRUCTURE: Strategies/comparators | |||
| Is there a clear definition of the options under evaluation? | Yes | The manufacturer considered bevacizumab as a potential comparator but concluded that significant methodological and clinical differences between studies precluded a valid analysis. | |
| No | Options under evaluation not discussed. | ||
| Have all feasible and practical options been evaluated? | No | See above. Bevacizumab is used off‐label for treatment of DMO in several countries. | |
| No | See above. | ||
| Is there justification for the exclusion of feasible options? | No | See above. | |
| No | See above. | ||
| STRUCTURE: Model type | |||
| Is the chosen model type appropriate given the decision problem and specified causal relationships within the model? | Yes | Appropriate given what reported above. | |
| Yes | |||
| STRUCTURE: Time horizon | |||
| Is the time horizon of the model sufficient to reflect all important differences between options? | Yes | 15‐year horizon. | |
| Yes | |||
| Are the time horizon of the model, the duration of treatment and the duration of treatment effect described and justified? | No | The model’s assumption that the relative benefit achieved during the treatment phase lasts indefinitely is unrealistic. | |
| No | |||
| STRUCTURE: Disease states/pathways | |||
| Do the disease states (state transition model) or the pathways (decision tree model) reflect the underlying biological process of the disease in question and the impact of interventions? | Yes | Course of visual acuity change after treatment for diabetic macular oedema. | |
| Yes | |||
| STRUCTURE: Cycle length | |||
| Is the cycle length defined and justified in terms of the natural history of disease? | Yes | 3‐monthly cycles. | |
| Yes | |||
| DATA: Data identification | |||
| Are the data identification methods transparent and appropriate given the objectives of the model? | Unclear | A discussion of the choices of the sources is given but a systematic search is not mentioned. | |
| No | No discussion of the choices of the sources. | ||
| Where choices have been made between data sources, are these justified appropriately?
| Yes | RESTORE and DRCRnet data used. The choice of excluding RESOLVE and READ2 is discussed. | |
| No | No discussion of the choices of the sources. | ||
| Has particular attention been paid to identifying data for the important parameters in the model? | Yes | Model revised following ERG comments considered all relevant parameters. | |
| Yes | We believe all the important parameters have been considered. | ||
| Has the quality of the data been assessed appropriately?
| Yes | Unclear, but NICE comment, quoted above, uses standard quality assessments methods, and assessments correspond to our review. | |
| No | No discussion of data quality. | ||
| Where expert opinion has been used, are the methods described and justified?
| NA |
| |
| NA |
| ||
| DATA: Data modelling | |||
| Is the data modelling methodology based on justifiable statistical and epidemiological techniques? | Yes | Markov model using RCT data.
| |
| Yes | |||
| DATA: Data modelling ‐ Baseline data | |||
| Is the choice of baseline data described and justified? | Yes | See above: data from two RCTs. | |
| Yes | |||
| Are transition probabilities calculated appropriately? | Yes | Extraction of transition probabilities were revised and agreed with NICE, see Table 12. | |
| Unclear | Insufficient details. | ||
| Has a half‐cycle correction been applied to both cost and outcome? | Unclear | Not specified. | |
| Yes | |||
| If not, has this omission been justified? | NA |
| |
| NA |
| ||
| DATA: Data modelling ‐ Treatment effect | |||
| If relative treatment effects have been derived from trial data, have they been synthesised using appropriate techniques? | NA | Effects from individual studies. | |
| NA | |||
| Have the methods and assumptions used to extrapolate short‐term results to final outcomes been documented and justified? | Yes | Explanation given: no change in treatment effect during year 2, according to DRCRnet, and from year 2 to 15. Mortality data from UK‐based literature (2.45 RR for diabetics with DMO). | |
| Yes | Same as NICE 2011, plus decline of visual acuity after year 2 modelled according to Wisconsin study (WESDR), the Diabetes Control and Complications Trial and UK Prospective Diabetes Study. | ||
| Have alternative assumptions been explored through sensitivity analysis? | Yes | The manufacturer presented a series of deterministic sensitivity analyses in which parameters were varied across plausible ranges, including: number of ranibizumab injections during year 3 and 4; retreatment need and treatment of both eyes in 35% of patients. | |
| No | Sensitivity analyses on number of injections performed. Sensitivity analysis regarding treatment need after 2 years and treatment in better vs. worse seeing eye or both eyes not presented. | ||
| Have assumptions regarding the continuing effect of treatment once treatment is complete been documented and justified? Have alternative assumptions been explored through sensitivity analysis? | No | See previous comments and Table 12. | |
| No | See previous comments and Table 12. | ||
| DATA: Data modelling ‐ Costs | |||
| Are the costs incorporated into the model justified? | Yes | All sources of costs considered, UK setting. Cost of adverse events not considered but suggested to be minimal due to the very low rate. | |
| Yes | |||
| Has the source for all costs been described? | Yes | See Table 12. | |
| Yes | See Table 10. | ||
| Have discount rates been described and justified given the target decision‐maker? | Unclear | Cannot find it in the report. | |
| Yes | 3.5% discount rate. | ||
| DATA: Data modelling ‐ Quality of life weights (utilities) | |||
| Are the utilities incorporated into the model appropriate? | No | Utility gain for treatment in the better‐seeing vs. worse‐seeing eye or in both eyes still a problem in the revised model. | |
| No | Utility gain for treatment in the better‐seeing vs. worse‐seeing eye or in both eyes still not considered. | ||
| Is the source for the utility weights referenced? | Yes | EQ‐5D data from RESTORE were transformed to utility values using standard social tariffs and then related to BCVA in the treated eye using linear regression. Covariate adjustment used in revised submission. sensitivity analyses based on other sources available. | |
| Yes | EQ‐5D data from RESTORE were transformed to utility values using standard social tariffs and then related to BCVA in the treated eye using linear regression. | ||
| Are the methods of derivation for the utility weights justified? | No | See above. | |
| No | See above. | ||
| DATA: Data incorporation | |||
| Have all data incorporated into the model been described and referenced in sufficient detail? | Yes |
| |
| Yes |
| ||
| Has the use of mutually inconsistent data been justified (i.e. are assumptions and choices appropriate)? | NA | Sources were specific to each type of data and no calibration was possible. | |
| NA | |||
| Is the process of data incorporation transparent? | Yes | Use of data from RCT described. | |
| Yes | Use of data from RCT and population‐based study described. | ||
| If data have been incorporated as distributions, has the choice of distribution for each parameter been described and justified? | NA | Individual data from RCTs used to estimate parameters. | |
| NA | |||
| If data have been incorporated as distributions, is it clear that second order uncertainty is reflected?
| NA |
| |
| NA |
| ||
| DATA: Assessment of uncertainty | |||
| Have the four principal types of uncertainty been addressed? | No | See below
| |
| No | |||
| If not, has the omission of particular forms of uncertainty been justified? | No |
| |
| No |
| ||
| DATA: Assessment of uncertainty: Methodological | |||
| Have methodological uncertainties been addressed by running alternative versions of the model with different methodological assumptions? | No | Single model structure as far as reported in NICE document | |
| No | Single model structure. | ||
| DATA: Assessment of uncertainty: Structural | |||
| Is there evidence that structural uncertainties have been addressed via sensitivity analysis? | Yes | Sensitivity analyses presented. | |
| Yes | |||
| DATA: Assessment of uncertainty: Heterogeneity | |||
| Has heterogeneity been dealt with by running the model separately for different subgroups? | Yes/Unclear | The manufacturer’s subgroup analysis suggesting that ranibizumab has a favourable cost‐effectiveness profile in people with a thicker retina (central foveal thickness greater than 400 micrometres), but The Appraisal Committee concluded that it could not consider this subgroup analysis sufficiently robust to support separate recommendations to the NHS because of small sample sizes. | |
| No | No subgroup analyses reported. | ||
| DATA: Assessment of uncertainty: Parameter | |||
| Are the methods of assessment of parameter uncertainty appropriate? | Yes | One‐way sensitivity analyses of point estimates of parameters. | |
| Yes | |||
| If data are incorporated as point estimates, are the ranges used for sensitivity analysis stated clearly and justified?
| Yes |
| |
| Yes |
| ||
| CONSISTENCY: Internal consistency | |||
| Is there evidence that the mathematical logic of the model has been tested thoroughly before use? | Unclear | Not reported. | |
| Unclear | Not reported. | ||
| CONSISTENCY: External consistency | |||
| Are any counterintuitive results from the model explained and justified? | Unclear | No such results. | |
| Unclear | |||
| If the model has been calibrated against independent data, have any differences been explained and justified?
| NA | No such calibration. | |
| NA | |||
| Have the results of the model been compared with those of previous models and any differences in results explained? | NA | No previous models. | |
| No | No comparison with NICE 2011, published in July 2011 and available to manufacturer. | ||
| BCVA: best‐corrected visual acuity | |||
| Cost of resources |
|
|
| Ranibizumab– drug cost | £761.20 | £742.17 |
| Ranibizumab injection – procedure cost | £150 |
|
| Injections year 1‐2 | 10 | 10 |
| Injections after year 2 | 3 | 0 |
| Laser photocoagulation – procedure cost | £150 | £274.19 |
| Procedures year 1‐2 | 3 | 3 |
| Procedures after year 2 | 2 | 0 |
| Ophthalmologist visit for ranibizumab plus any injection | £126 | £84.42 |
| Visits year 1‐2 | 22 | 22 |
| Ophthalmologist visit for laser | £126 | £84.42 |
| Visits year 1‐2 | 8 | 8 |
| Visits after year 2 | 4 | 4 |
| Cost of disease consequences |
|
|
| Low vision total cost ‐ 1st year | £6067 |
|
| Low vision total cost ‐ 2nd year | £5936 |
|
| Low‐vision aids (annual, 33% blind patients) |
| £194.16 |
| Residential care (private, 30% blind patients) |
| £16,998.80 |
| Community Care (annual, 6% blind patients) |
| £12,064 |
| Depression (annual, 39% blind patients) |
| £558.24 |
| Hip replacement (5% blind patients) |
| £6952.93 |
| Mortality of patients with DMO (vs. age‐sex matched) | RR: 2.45 | RR: 2.45 |
| Utility source | ||
| Time horizon | 15 years | 15 years |
| Discount rate | unclear | 3.5% |
| ICER (cost per QALY) ‐ base‐case and main sensitivity analyses |
|
|
| Base‐case | £30,277 | £24,028 |
| Bilateral treatment 35% | £44,400 |
|
| Covariate adjusted utility estimation | £33,857 |
|
| Utility source: Lloyd | £24,779 | £19,238 |
| Uitlity source: Brazier | £23,664 |
|
| Utility source: Brown |
| £21,953 |
| Discount rate 0‐5% (vs 3.5%): ICER £17,051‐27,042 |
|
|
| Total n. ranibizumab injections (vs 10) 14 ‐ 6 |
| £38,836 ‐12,446 |
| Cost of blindness (base £6477) ‐25%‐+25%: ICER |
| £27,907‐20,150 |
| Long term progression of visual acuity (vs declining) stable or improved |
| £26,198‐28,4131 |
| Baseline age (vs 63 years) 58 years |
| £19,259 |
| Number of visits with laser equal to ranibizumab | £37,673 |
|
| Number of visits with ranibizumab equal to laser | £33,074 |
|
| *ICER values are presented in cost per QALY units | ||
| Outcome or subgroup title | No. of studies | No. of participants | Statistical method | Effect size |
| 1 Gain 2+ lines of visual acuity at 1 year Show forest plot | 5 | 556 | Risk Ratio (M‐H, Fixed, 95% CI) | 2.76 [2.02, 3.76] |
| 1.1 Bevacizumab | 2 | 167 | Risk Ratio (M‐H, Fixed, 95% CI) | 3.06 [1.54, 6.05] |
| 1.2 Ranibizumab | 2 | 300 | Risk Ratio (M‐H, Fixed, 95% CI) | 3.06 [1.93, 4.87] |
| 1.3 Aflibercept | 1 | 89 | Risk Ratio (M‐H, Fixed, 95% CI) | 2.11 [1.26, 3.51] |
| 2 Gain 3+ lines of visual acuity at 1 year Show forest plot | 5 | 556 | Risk Ratio (M‐H, Fixed, 95% CI) | 3.20 [2.07, 4.95] |
| 2.1 Bevacizumab | 2 | 167 | Risk Ratio (M‐H, Fixed, 95% CI) | 2.52 [1.20, 5.29] |
| 2.2 Ranibizumab | 2 | 300 | Risk Ratio (M‐H, Fixed, 95% CI) | 3.51 [1.78, 6.92] |
| 2.3 Aflibercept | 1 | 89 | Risk Ratio (M‐H, Fixed, 95% CI) | 3.72 [1.52, 9.08] |
| 3 Loss 2+ lines of visual acuity at 1 year Show forest plot | 4 | 481 | Risk Ratio (M‐H, Fixed, 95% CI) | 0.23 [0.12, 0.44] |
| 3.1 Bevacizumab | 2 | 167 | Risk Ratio (M‐H, Fixed, 95% CI) | 0.19 [0.07, 0.52] |
| 3.2 Ranibizumab | 1 | 225 | Risk Ratio (M‐H, Fixed, 95% CI) | 0.27 [0.09, 0.80] |
| 3.3 Aflibercept | 1 | 89 | Risk Ratio (M‐H, Fixed, 95% CI) | 0.24 [0.05, 1.09] |
| 4 Loss 3+ lines of visual acuity at 1 year Show forest plot | 4 | 481 | Risk Ratio (M‐H, Fixed, 95% CI) | 0.13 [0.05, 0.34] |
| 4.1 Bevacizumab | 2 | 167 | Risk Ratio (M‐H, Fixed, 95% CI) | 0.16 [0.05, 0.51] |
| 4.2 Ranibizumab | 1 | 225 | Risk Ratio (M‐H, Fixed, 95% CI) | 0.11 [0.01, 0.83] |
| 4.3 Aflibercept | 1 | 89 | Risk Ratio (M‐H, Fixed, 95% CI) | 0.08 [0.00, 1.30] |
| 5 Mean difference in logMAR visual acuity at 1 year Show forest plot | 5 | 554 | Mean Difference (IV, Fixed, 95% CI) | ‐0.13 [‐0.16, ‐0.10] |
| 5.1 Bevacizumab | 2 | 165 | Mean Difference (IV, Fixed, 95% CI) | ‐0.20 [‐0.28, ‐0.12] |
| 5.2 Ranibizumab | 2 | 300 | Mean Difference (IV, Fixed, 95% CI) | ‐0.10 [‐0.14, ‐0.07] |
| 5.3 Aflibercept | 1 | 89 | Mean Difference (IV, Fixed, 95% CI) | ‐0.27 [‐0.40, ‐0.13] |
| 6 Mean difference in (change of) OCT central macular thickness at 1 year Show forest plot | 4 | 477 | Mean Difference (IV, Fixed, 95% CI) | ‐60.71 [‐83.87, ‐37.54] |
| 6.1 Bevacizumab | 2 | 165 | Mean Difference (IV, Fixed, 95% CI) | ‐43.61 [‐82.11, ‐5.11] |
| 6.2 Ranibizumab | 1 | 225 | Mean Difference (IV, Fixed, 95% CI) | ‐57.40 [‐89.86, ‐24.94] |
| 6.3 Aflibercept | 1 | 87 | Mean Difference (IV, Fixed, 95% CI) | ‐121.9 [‐186.47, ‐57.33] |
| 7 Mean difference in logMAR visual acuity at 2 years Show forest plot | 1 | Mean Difference (IV, Fixed, 95% CI) | Totals not selected | |
| 7.1 Bevacizumab | 1 | Mean Difference (IV, Fixed, 95% CI) | 0.0 [0.0, 0.0] | |
| 8 Mean difference in (change of) OCT Central Macular Thickness at 2 years Show forest plot | 1 | Mean Difference (IV, Fixed, 95% CI) | Totals not selected | |
| 8.1 Bevacizumab | 1 | Mean Difference (IV, Fixed, 95% CI) | 0.0 [0.0, 0.0] | |
| 9 Sensitivity analysis excluding studies with eyes as unit (Soheillian 2007): gain 3+ Show forest plot | 3 | 380 | Risk Ratio (M‐H, Fixed, 95% CI) | 3.29 [1.77, 6.13] |
| 10 Sensitivity analysis excluding studies with eyes as unit (Soheillian 2007): loss 3+ Show forest plot | 2 | 305 | Risk Ratio (M‐H, Fixed, 95% CI) | 0.10 [0.02, 0.41] |
| Outcome or subgroup title | No. of studies | No. of participants | Statistical method | Effect size |
| 1 Gain 2+ lines of visual acuity at 8 to 12 months Show forest plot | 3 | 497 | Risk Ratio (M‐H, Fixed, 95% CI) | 2.46 [1.77, 3.40] |
| 1.1 Pegaptanib | 2 | 346 | Risk Ratio (M‐H, Fixed, 95% CI) | 2.11 [1.43, 3.09] |
| 1.2 Ranibizumab | 1 | 151 | Risk Ratio (M‐H, Fixed, 95% CI) | 3.31 [1.80, 6.09] |
| 2 Gain 3+ lines of visual acuity at 8 to 12 months Show forest plot | 3 | 497 | Risk Ratio (M‐H, Fixed, 95% CI) | 2.19 [1.36, 3.53] |
| 2.1 Pegaptanib | 2 | 346 | Risk Ratio (M‐H, Fixed, 95% CI) | 1.79 [1.01, 3.16] |
| 2.2 Ranibizumab | 1 | 151 | Risk Ratio (M‐H, Fixed, 95% CI) | 3.17 [1.32, 7.62] |
| 3 Loss 2+ lines of visual acuity at 8 to 12 months Show forest plot | 3 | 497 | Risk Ratio (M‐H, Fixed, 95% CI) | 0.34 [0.19, 0.60] |
| 3.1 Pegaptanib | 2 | 346 | Risk Ratio (M‐H, Fixed, 95% CI) | 0.44 [0.21, 0.92] |
| 3.2 Ranibizumab | 1 | 151 | Risk Ratio (M‐H, Fixed, 95% CI) | 0.20 [0.07, 0.54] |
| 4 Loss 3+ lines of visual acuity at 8 to 12 months Show forest plot | 2 | 411 | Risk Ratio (M‐H, Fixed, 95% CI) | 0.28 [0.13, 0.59] |
| 4.1 Pegaptanib | 1 | 260 | Risk Ratio (M‐H, Fixed, 95% CI) | 0.43 [0.16, 1.21] |
| 4.2 Ranibizumab | 1 | 151 | Risk Ratio (M‐H, Fixed, 95% CI) | 0.14 [0.04, 0.50] |
| 5 Mean change of visual acuity at 6 to 12 months Show forest plot | 4 | 575 | Mean Difference (IV, Fixed, 95% CI) | ‐0.13 [‐0.17, ‐0.08] |
| 5.1 Bevacizumab | 1 | 78 | Mean Difference (IV, Fixed, 95% CI) | ‐0.15 [‐0.26, ‐0.04] |
| 5.2 Pegaptanib | 2 | 346 | Mean Difference (IV, Fixed, 95% CI) | ‐0.08 [‐0.13, ‐0.03] |
| 5.3 Ranibizumab | 1 | 151 | Mean Difference (IV, Fixed, 95% CI) | ‐0.23 [‐0.32, ‐0.15] |
| 6 Mean difference in (change of) OCT central macular thickness at 6 to 12 months Show forest plot | 3 | 315 | Mean Difference (IV, Fixed, 95% CI) | ‐126.38 [‐160.27, ‐92.49] |
| 6.1 Bevacizumab | 1 | 78 | Mean Difference (IV, Fixed, 95% CI) | ‐130.6 [‐187.27, ‐73.93] |
| 6.2 Pegaptanib | 1 | 86 | Mean Difference (IV, Fixed, 95% CI) | ‐71.7 [‐149.71, 6.31] |
| 6.3 Ranibizumab | 1 | 151 | Mean Difference (IV, Fixed, 95% CI) | ‐145.80 [‐196.12, ‐95.48] |
| 7 Gain 2+ lines of visual acuity at 2 years Show forest plot | 2 | 716 | Risk Ratio (M‐H, Fixed, 95% CI) | 1.99 [1.64, 2.40] |
| 7.1 Pegaptanib | 1 | 207 | Risk Ratio (M‐H, Fixed, 95% CI) | 1.28 [0.87, 1.88] |
| 7.2 Ranibizumab | 1 | 509 | Risk Ratio (M‐H, Fixed, 95% CI) | 2.30 [1.85, 2.86] |
| 8 Gain 3+ lines of visual acuity at 2 years Show forest plot | 2 | 716 | Risk Ratio (M‐H, Fixed, 95% CI) | 2.44 [1.85, 3.23] |
| 8.1 Pegaptanib | 1 | 207 | Risk Ratio (M‐H, Fixed, 95% CI) | 1.56 [0.87, 2.78] |
| 8.2 Ranibizumab | 1 | 509 | Risk Ratio (M‐H, Fixed, 95% CI) | 2.80 [2.03, 3.86] |
| 9 Loss 3+ lines of visual acuity at 2 years Show forest plot | 2 | 716 | Risk Ratio (M‐H, Fixed, 95% CI) | 0.33 [0.17, 0.64] |
| 9.1 Pegaptanib | 1 | 207 | Risk Ratio (M‐H, Fixed, 95% CI) | 0.42 [0.13, 1.31] |
| 9.2 Ranibizumab | 1 | 509 | Risk Ratio (M‐H, Fixed, 95% CI) | 0.30 [0.13, 0.68] |
| 10 Loss 2+ lines of visual acuity at 2 years Show forest plot | 1 | Risk Ratio (M‐H, Fixed, 95% CI) | Totals not selected | |
| 10.1 Ranibizumab | 1 | Risk Ratio (M‐H, Fixed, 95% CI) | 0.0 [0.0, 0.0] | |
| 11 Mean change of visual acuity at 2 years Show forest plot | 2 | 716 | Mean Difference (IV, Fixed, 95% CI) | ‐0.16 [‐0.20, ‐0.12] |
| 11.1 Pegaptanib | 1 | 207 | Mean Difference (IV, Fixed, 95% CI) | ‐0.10 [‐0.17, ‐0.02] |
| 11.2 Ranibizumab | 1 | 509 | Mean Difference (IV, Fixed, 95% CI) | ‐0.19 [‐0.23, ‐0.14] |
| 12 Quality of life (difference change in NEI‐VFQ 25 composite score at 54 weeks) Show forest plot | 1 | Mean Difference (Fixed, 95% CI) | Totals not selected | |
| 13 Quality of life (difference change in NEI‐VFQ 25 composite score at 102 weeks) Show forest plot | 1 | Mean Difference (Fixed, 95% CI) | Totals not selected | |
| Outcome or subgroup title | No. of studies | No. of participants | Statistical method | Effect size |
| 1 Gain 2+ lines of visual acuity at 1 year Show forest plot | 3 | 1267 | Risk Ratio (M‐H, Fixed, 95% CI) | 1.94 [1.66, 2.28] |
| 1.1 Prompt photocoagulation | 3 | 786 | Risk Ratio (M‐H, Fixed, 95% CI) | 2.14 [1.73, 2.64] |
| 1.2 Deferred photocoagulation | 1 | 481 | Risk Ratio (M‐H, Fixed, 95% CI) | 1.69 [1.33, 2.15] |
| 2 Gain 3+ lines of visual acuity at 1 year Show forest plot | 3 | 1267 | Risk Ratio (M‐H, Fixed, 95% CI) | 2.11 [1.67, 2.67] |
| 2.1 Prompt photocoagulation | 3 | 786 | Risk Ratio (M‐H, Fixed, 95% CI) | 2.29 [1.67, 3.13] |
| 2.2 Deferred photocoagulation | 1 | 481 | Risk Ratio (M‐H, Fixed, 95% CI) | 1.88 [1.31, 2.70] |
| 3 Loss 2+ lines of visual acuity at 1 year Show forest plot | 2 | 1189 | Risk Ratio (M‐H, Fixed, 95% CI) | 0.26 [0.15, 0.43] |
| 3.1 Prompt photocoagulation | 2 | 708 | Risk Ratio (M‐H, Fixed, 95% CI) | 0.27 [0.14, 0.51] |
| 3.2 Deferred photocoagulation | 1 | 481 | Risk Ratio (M‐H, Fixed, 95% CI) | 0.24 [0.10, 0.56] |
| 4 Loss 3+ lines of visual acuity at 1 year Show forest plot | 2 | 1189 | Risk Ratio (M‐H, Random, 95% CI) | 0.29 [0.15, 0.55] |
| 4.1 Prompt photocoagulation | 2 | 708 | Risk Ratio (M‐H, Random, 95% CI) | 0.29 [0.13, 0.67] |
| 4.2 Deferred photocoagulation | 1 | 481 | Risk Ratio (M‐H, Random, 95% CI) | 0.27 [0.10, 0.77] |
| 5 Mean difference in change of logMAR visual acuity at 6 to 12 months Show forest plot | 3 | 1266 | Mean Difference (IV, Random, 95% CI) | ‐0.11 [‐0.13, ‐0.08] |
| 5.1 Prompt photocoagulation | 3 | 785 | Mean Difference (IV, Random, 95% CI) | ‐0.10 [‐0.13, ‐0.07] |
| 5.2 Deferred photocoagulation | 1 | 481 | Mean Difference (IV, Random, 95% CI) | ‐0.12 [‐0.17, ‐0.07] |
| 6 Mean difference in change of OCT central macular thickness at 6 to 12 months Show forest plot | 2 | 1116 | Mean Difference (IV, Fixed, 95% CI) | ‐40.90 [‐57.19, ‐24.62] |
| 6.1 Prompt photocoagulation | 2 | 670 | Mean Difference (IV, Fixed, 95% CI) | ‐44.28 [‐64.69, ‐23.86] |
| 6.2 Deferred photocoagulation | 1 | 446 | Mean Difference (IV, Fixed, 95% CI) | ‐35.0 [‐62.00, ‐6.00] |
| 7 Gain 2+ lines of visual acuity at 2 years Show forest plot | 1 | Risk Ratio (M‐H, Fixed, 95% CI) | Totals not selected | |
| 7.1 Prompt photocoagulation | 1 | Risk Ratio (M‐H, Fixed, 95% CI) | 0.0 [0.0, 0.0] | |
| 7.2 Deferred photocoagulation | 1 | Risk Ratio (M‐H, Fixed, 95% CI) | 0.0 [0.0, 0.0] | |
| 8 Gain 3+ lines of visual acuity at 2 years Show forest plot | 1 | Risk Ratio (M‐H, Fixed, 95% CI) | Totals not selected | |
| 8.1 Prompt photocoagulation | 1 | Risk Ratio (M‐H, Fixed, 95% CI) | 0.0 [0.0, 0.0] | |
| 8.2 Deferred photocoagulation | 1 | Risk Ratio (M‐H, Fixed, 95% CI) | 0.0 [0.0, 0.0] | |
| 9 Loss 2+ lines of visual acuity at 2 years Show forest plot | 1 | Risk Ratio (M‐H, Random, 95% CI) | Totals not selected | |
| 9.1 Prompt photocoagulation | 1 | Risk Ratio (M‐H, Random, 95% CI) | 0.0 [0.0, 0.0] | |
| 9.2 Deferred photocoagulation | 1 | Risk Ratio (M‐H, Random, 95% CI) | 0.0 [0.0, 0.0] | |
| 10 Loss 3+ lines of visual acuity at 2 years Show forest plot | 1 | Risk Ratio (M‐H, Fixed, 95% CI) | Totals not selected | |
| 10.1 Prompt photocoagulation | 1 | Risk Ratio (M‐H, Fixed, 95% CI) | 0.0 [0.0, 0.0] | |
| 10.2 Deferred photocoagulation | 1 | Risk Ratio (M‐H, Fixed, 95% CI) | 0.0 [0.0, 0.0] | |
| 11 Mean difference in change of logMAR visual acuity at 2 years Show forest plot | 1 | Mean Difference (IV, Fixed, 95% CI) | Totals not selected | |
| 11.1 Prompt photocoagulation | 1 | Mean Difference (IV, Fixed, 95% CI) | 0.0 [0.0, 0.0] | |
| 11.2 Deferred photocoagulation | 1 | Mean Difference (IV, Fixed, 95% CI) | 0.0 [0.0, 0.0] | |
| 12 Mean difference in change of OCT central macular thickness at 2 years Show forest plot | 1 | Mean Difference (IV, Fixed, 95% CI) | Totals not selected | |
| 12.1 Prompt photocoagulation | 1 | Mean Difference (IV, Fixed, 95% CI) | 0.0 [0.0, 0.0] | |
| 12.2 Deferred photocoagulation | 1 | Mean Difference (IV, Fixed, 95% CI) | 0.0 [0.0, 0.0] | |
| Outcome or subgroup title | No. of studies | No. of participants | Statistical method | Effect size |
| 1 Total ATC thromboembolic events at 6 to 24 months Show forest plot | 9 | 2159 | Risk Ratio (M‐H, Random, 95% CI) | 0.85 [0.56, 1.28] |
| 1.1 Follow‐up 6 to 12 months | 6 | 868 | Risk Ratio (M‐H, Random, 95% CI) | 1.41 [0.49, 4.06] |
| 1.2 Follow‐up 24 months | 3 | 1291 | Risk Ratio (M‐H, Random, 95% CI) | 0.80 [0.42, 1.53] |
| 2 Death Show forest plot | 9 | 2159 | Risk Ratio (M‐H, Random, 95% CI) | 0.95 [0.52, 1.74] |
| 2.1 Follow‐up 6 to 12 months | 6 | 868 | Risk Ratio (M‐H, Random, 95% CI) | 0.82 [0.24, 2.83] |
| 2.2 Follow‐up 24 months | 3 | 1291 | Risk Ratio (M‐H, Random, 95% CI) | 1.11 [0.36, 3.45] |