分娩第3期女性における積極的管理と待機的管理の比較
Referencias
References to studies included in this review
References to studies excluded from this review
References to studies awaiting assessment
Additional references
References to other published versions of this review
Characteristics of studies
Characteristics of included studies [ordered by study ID]
| Methods | RCT with randomisation of individual women. | |
| Participants | Irish hospital setting. High‐income country. Inclusion criteria: all women at low risk of haemorrhage (< 35 years; parity < 5; 1st stage of labour < 15 hours; no previous history of PPH; Hb > 11 g/dL (or 10.6 g/dL for capillary sample)) with singleton, cephalic presentation, 35 to 36 weeks at recruitment; no medical complications which would contraindicate ergometrine or would increase the risk of bleeding (cardiac disease, use of heparin, hypertension), and expected to give birth vaginally. 1429 women randomised out of 2901 eligible. Exclusion criteria: women with hypertension in pregnancy or 1st or 2nd stage; epidural anaesthesia (included in separate study); APH; 1st stage > 15 hours; OVB; women attending private care. Clinician responsible for third stage: midwives. | |
| Interventions | Intervention: active management of third stage (N = 705):
For retained placenta: 1 hour after birth:
Comparison: expectant management of third stage (N = 724):
Special circumstances: if baby’s cord is clamped and cut before pulsation ceases (due to cord round neck, asphyxia etc) do not give ergometrine. Milk any placental blood into bowl and discard it. Watch for signs of placental separation and deliver placenta by CCT. Retained placenta > 1 hour after birth:
Data entered into Comparisons 1 and 2. | |
| Outcomes | Pre‐specified outcomes: manual removal of placenta; PPH (> 500 mL); mean blood loss; length 3rd stage; Hb < 10 g/dL at 48‐72 hours; and difference between 32 weeks and 48‐72 hours PP: PP blood transfusions; side effects 1‐2 hours post birth; PP complications; breastfeeding; serum prolactin; women’s views. No neonatal outcomes. (Information from Oxford Database of Perinatal Trials registration sheet) and from [Begley 1990]): morbidity; blood loss during 3rd stage; method of placental delivery; complications occurring in first 1‐2 hours post birth (haemorrhage, nausea, vomiting, raised BP, pain); Hb on 3rd postnatal day; prolactin levels on 3rd postnatal day, duration of breastfeeding. | |
| Notes | Between 1 Oct ’87 and 31 Oct ’88, 2901 women were deemed eligible for initial inclusion, 2650 agreed to take part. 1221 of these were excluded prior to randomisation because of epidural (399); OVB (354); CS (132); rapid birth (95); hypertension (77); missed (53); low Hb (40); woman’s request (28); miscellaneous (23); breech (20). Actual management used in the active arm: all given IV ergometrine 0.5 mg before delivery of placenta; 89% cord clamped and cut; 93% CCT and 5% maternal effort; 7% upright and 93% recumbent. Actual management used in the expectant arm: 14% got ergometrine for treatment, not prophylactically, 6 (0.83%) before placenta delivered; cord left unclamped till pulsation ceased 42%; placenta delivered by maternal effort 32% and CCT 66%; 11% upright. | |
| Risk of bias | ||
| Bias | Authors' judgement | Support for judgement |
| Random sequence generation (selection bias) | Low risk | Unpublished information from author: random number tables were used (Fleiss 1981). The first number was selected from the table by a disinterested observer and the numbers were allocated in blocks of 100 following in sequence. |
| Allocation concealment (selection bias) | Low risk | “...a numbered, sealed envelope containing the randomly allocated group was stapled to the woman’s chart in readiness for admission...The envelope remained sealed until the women was in second stage of labour and the midwife was certain a normal delivery would ensue. The envelope was then opened...” "When a woman was excluded from the study, her envelope was returned, unopened, to the researcher. All returned envelopes were re‐allocated in numerical order prior to starting the next batch of 100 envelopes." |
| Blinding of participants and personnel (performance bias) | High risk | It was not possible to blind women or clinicians in this study. The outcome assessor was often the caregiver for many important outcomes, e.g. blood loss and PPH. Even though blood loss was measured and not estimated, there may have been bias in measuring. |
| Blinding of outcome assessment (detection bias) | Unclear risk | Describes the differences in measuring blood loss in non‐blinded staff and attempts to standardise methods. Hb measurement was conducted by assessors blinded to allocation (personal communication) thus some outcomes were blinded but for some it was not possible. |
| Incomplete outcome data (attrition bias) | Low risk | Some missing data for some postnatal Hb measurements (618 out of 705 in the active group (12% attrition) and 645 out of 724 in the expectant (11% attrition). ITT not mentioned but no loss to follow‐up for outcomes measured during labour. Some outcome data are taken from the unpublished thesis. |
| Selective reporting (reporting bias) | Low risk | None apparent, outcomes on trial registration sheet all reported. |
| Other bias | Low risk | No significant difference in baseline characteristics, but more women in the physiological arm had pethidine in labour (46% cf 52%, P = 0.05). This may impact on outcomes in the physiological arm where the sight and sound of the baby may be the stimulus for the hormonal release needed for natural 3rd stage and pethidine may impact here. 1st and 2nd stage management similar and no obvious differences overall. |
| Methods | RCT with randomisation of individual women. | |
| Participants | Setting: University hospital, Sweden. High‐income country. Inclusion criteria: healthy women with normal pregnancies, a gestational age of 34 to 43 weeks, singleton, cephalic presentation and expected vaginal birth (included ventouse deliveries). Exclusion criteria: non‐Swedish speaking, previous PPH, elective CS, pre‐eclampsia, grand multiparity (> 5) or IUFD. Subgroups: high‐income, not low‐risk Clinician responsible for third stage: midwives. | |
| Interventions | Experimental intervention: active management of third stage (N = 903, but analysed 810).
Control/Comparison intervention: mixed management of third stage (N = 899, but analysed 821). Description: mixed: (no routine uterotonic; early cord clamping, no CCT):
Data used in Comparison 11. | |
| Outcomes | Pre‐specified outcomes: primary outcome was the incidence of blood loss > 1000 mL during the third stage of labour. Other outcomes: Hb at 24 hours and women's views. Reported outcomes: blood loss > 1000 mL and > 500 mL during the third stage of labour, blood loss > 1000 mL and > 500 mL in first 2 hours PP, Hb at 24 hours, change in Hb from antenatal to 24 hours postnatal, retained placenta/retained part of placenta or membranes, additional uterotonics, duration of 3rd stage. Blood transfusion, units transfused, experience of mothers, after‐pains. Outcomes obtained by email response 28thApril 2011 manual removal of placenta alone, cross‐over in additional uterotonics, Hb < 9 g/dL at 24‐48 hours, length of third stage > 60 minutes. Outcomes obtained by email response 26th May 2011 clarification of cross‐over in additional uterotonics, blood loss > 500 mL and > 1000 mL during third stage of labour separated from blood loss > 500 mL and > 1000 mL in first 2 hours PP. | |
| Notes | We wrote to the author for additional information which was provided as follows: "In the active group, 41 women had extra Synt, therapeutically, before the placenta (some went on to have a second dose, and/or Methergin) = 41 IN TOTAL, IN THE ACTIVE GROUP, 121 WOMEN HAD THERAPEUTIC UTEROTONICS. Blood loss before and during placenta delivery: IN ACTIVE GROUP: 0 to 500 mL = 86.57% ( n = 696) > 500 mL = 13.43% (n = 108) and 0 to 1000 mL = 96.39% (n = 775) > 1000 mL = 3.61% (n = 29) 26 women in the active group and 21 in the expectant had manual removal of placenta. 34 women in the active and 28 in the expectant group had maternal Hb < 9 g/dL at 24‐48 hrs. 31 women in the active and 23 in the expectant group had third stage > 60 minutes. "mean blood loss before placenta" was clarified as meaning "mean blood loss 'before and during expulsion' of the placenta." | |
| Risk of bias | ||
| Bias | Authors' judgement | Support for judgement |
| Random sequence generation (selection bias) | Low risk | Computer‐generated randomisation. |
| Allocation concealment (selection bias) | Low risk | Sealed envelopes containing the computer‐generated randomisation group were prepared in consecutive order and kept in another unit. At randomisation, midwives phoned the staff at the other unit who opened the sealed envelopes and disclosed the assigned intervention and trial number. |
| Blinding of participants and personnel (performance bias) | High risk | Received an injection in both groups to “blind”, but expectant group were asked to push and did not have CCT, active group had CCT. Clinicians not blinded. |
| Blinding of outcome assessment (detection bias) | Unclear risk | Clinicians not blinded and clinicians involved in many important outcomes decisions/assessments, e.g. blood loss, therapeutics uterotonics, blood transfusions. Other outcomes could have been blinded, e.g. Hb. |
| Incomplete outcome data (attrition bias) | Low risk | Of the 903 women randomised to the active group and 899 women randomised to the mixed management group:
Overall 10% and 9%. Was the analysis ITT? Yes, apart from above exclusions. |
| Selective reporting (reporting bias) | Unclear risk | Proposal not seen, and not registered before the trial commenced. |
| Other bias | High risk | There were more inductions in the active group (10% versus 7%). Describe any differential diagnosis: none. Although 11,000 women were potentially eligible, of whom at least half would usually be considered eligible, only 1802 were entered into the study. Numbers excluded due to ineligibility are not recorded, and other reasons given are 'excessive workload' or 'admission in advanced labour'. Email response from Jangsten 28th April 2001: "the hard workload was one reason that the women were not included and that all eligible women were not asked to participate. Few women refused in participating but I don't have the number". This has the potential to have biased the study, as midwives would have had the choice of not asking the women to participate and may unconsciously have not offered participation to some women who they felt were not suitable for physiological management. |
| Methods | RCT of individual women in low‐income setting. | |
| Participants | Setting: Sousse, Tunisia. Low‐income country. Women with singleton pregnancies expecting to give birth vaginally. Exclusion criteria: placenta praevia, APH, non‐cephalic presentation, intrauterine death, parity > 5, uterine fibroids, anticoagulation therapy, history of PPH, history of CS. | |
| Interventions | Intervention: active management of 3rd stage (N = 65):
Comparison: mixed management of 3rd stage (N = 65):
Data included in Comparison 12. | |
| Outcomes | Pre‐specified: reduction in HCT and Hb. | |
| Notes | We contacted the authors again on 14th March 2011, for further information on the management in the comparison arm, the methodology they used and data obtained. Reply received 19th March 2011. No publication has emanated, no further data were provided, but methodology was clarified. | |
| Risk of bias | ||
| Bias | Authors' judgement | Support for judgement |
| Random sequence generation (selection bias) | Unclear risk | As per www.randomization.com (not stated in publication but information provided by author on 19 March 2011). |
| Allocation concealment (selection bias) | High risk | Not concealed in any way (not stated in publication, but in information provided by author on 19 March 2011). |
| Blinding of participants and personnel (performance bias) | High risk | None. Unblinded assessment made. |
| Blinding of outcome assessment (detection bias) | Unclear risk | No information provided. |
| Incomplete outcome data (attrition bias) | Low risk | No loss described in publication and confirmed by information from author on 19 March 2011. Authors also provided information that the analysis was by 'intention to treat'. |
| Selective reporting (reporting bias) | Unclear risk | We did not assess the trial protocol. |
| Other bias | High risk | Women reported to have been allocated to groups after placental delivery yet active management group supposedly had oxytocin with the anterior shoulder. |
| Methods | RCT with randomisation of individual women. | |
| Participants | Abu Dhabi hospital setting. High‐income country. Inclusion criteria: all women expected to give birth vaginally. 1657 women randomised out of a possible 4239. Exclusion criteria: refusal or CS in second stage (9 excluded, final sample 1648). | |
| Interventions | Intervention: active management of 3rd stage (N = 827):
Comparison: mixed management of 3rd stage (N = 821):
In both groups, if placenta not delivered after 30 minutes, CCT or digital removal attempted, with IV oxytocin infusion if bleeding present. Data included in Comparison 10. | |
| Outcomes | Primary: PPH. Secondary: duration of third stage, retained placenta, shock, blood transfusion, methylergonovine or 15‐methyl‐a‐prostaglandin to control haemorrhage. | |
| Notes | Not readily comparable to other studies as IV oxytocin infusion given to all women in expectant management group after delivery of placenta. This is the practice in the US but not elsewhere. | |
| Risk of bias | ||
| Bias | Authors' judgement | Support for judgement |
| Random sequence generation (selection bias) | Unclear risk | No detail. |
| Allocation concealment (selection bias) | Low risk | Numbered sealed opaque envelopes. |
| Blinding of participants and personnel (performance bias) | High risk | Attempted with 2nd MW recording blood loss – however, no guarantee that the first MW could/would not have altered the amount of blood in the receptacle, so not any better than just 1 clinician measuring. |
| Blinding of outcome assessment (detection bias) | Unclear risk | No information provided. Presumed blinded, but unclear. |
| Incomplete outcome data (attrition bias) | Unclear risk | 2582 excluded prior to randomisation due to refusal. 9 excluded after randomisation due to emergency CS. |
| Selective reporting (reporting bias) | Unclear risk | No trial protocol reviewed. Most reported outcomes were pre‐specified. Mean change in HCT was reported, but not pre‐specified. |
| Other bias | High risk | 2582 out of 4239 refused to participate. Those that did agree may have been biased. It is unknown whether or not the midwives had sufficient training in physiological third stage before the trial started. This trial has been criticised for including all women (including high parity, all age groups, previous PPH, epidural, long labour, operative delivery) and not confining inclusion criteria to women who were low risk. Women at high risk of PPH will have a higher blood loss using expectant management; clinicians experiencing this may respond by anxiety in subsequent births, even of low‐risk women, which may result in higher intervention (mixed management) rates. Also, the minimal intervention (control) group had the cord clamped and cut immediately after delivery, which is suspected to lead to an increase in blood loss. |
| Methods | RCT with randomisation of individual women. | |
| Participants | UK hospital setting. High‐income country. Inclusion criteria: all women expected to give birth vaginally. 1695 women randomised out of a possible 4709. Exclusion criteria: refusal, cardiac disease, APH, non‐cephalic presentation, multiple pregnancy, IUFD, if clinician had good reason not to include women. After the first 5 months, exclusions included women with ritodrine given 2 hours before birth; anticoagulant treatment; any condition needing a particular management of 3rd stage (e.g. meconium‐stained liquor, dural tap). | |
| Interventions | Intervention: active management of 3rd stage (N = 846):
Comparison: expectant management of 3rd stage (N = 849):
Data included in Comparison 1. | |
| Outcomes | Pre‐specified outcomes: PPH (and “more objective measures of blood loss”, presumably Hb); length 3rd stage; need for therapeutic oxytocics; manual removal placenta; ERPC; side effects of oxytocics (nausea, vomiting, headaches, hypertension); Apgar scores; PCV; SCBU; jaundice; breastfeeding. Views of a subsample of women. | |
| Notes | Actual management used in the active arm: 99% given prophylactic uterotonic before delivery of placenta; 99% cord clamped and cut before delivery of placenta; 99% CCT; 26% upright. Actual management used in the expectant arm: 30% received uterotonic for treatment, and 20% prophylactically; cord left unclamped till pulsation ceased 48%; placenta delivered by maternal effort 60% and CCT 40%; 49% upright. | |
| Risk of bias | ||
| Bias | Authors' judgement | Support for judgement |
| Random sequence generation (selection bias) | Low risk | No description of the randomisation given. However, we believe that unclear sequence generation was a consequence of reporting omission rather than methodological inadequacies and therefore does not give rise to bias. |
| Allocation concealment (selection bias) | Low risk | “On admission to the labour ward... Correspondingly numbered, sealed opaque envelopes were placed in the woman’s notes...” |
| Blinding of participants and personnel (performance bias) | High risk | In all the studies, not possible to blind the women or the clinicians in any of the studies. The paper stated “We were concerned that clinical estimates of blood loss might also be subject to systematic bias between the two trial groups as the observer could not be blinded to the management allocated. We therefore studied three maternal haematological variables – namely, postpartum (24‐48 hrs) haemoglobin concentration ≤ 90g/l, mean postpartum packed cell volume and mean change in haemoglobin concentration between about 34 weeks gestation and post partum”. Primary outcome though is still PPH > 500 mL which is subject to systematic bias. |
| Blinding of outcome assessment (detection bias) | Unclear risk | See above. |
| Incomplete outcome data (attrition bias) | Unclear risk | Missing data for some outcomes, e.g. 19% of Hb results missing in active arm and 18% in the physiological; 25% of antenatal and/or postnatal Hb results (used to calculate drop in mean Hb) missing in the active arm and 26% in the physiological. Apparently no women were excluded after randomisation but 182 are described as having not entered in the trial due to the cord being cut early for fetal safety reasons. The allocation details, however, state that when the clinician was ready to prepare for delivery, the envelope was opened and "all women for whom an envelope was opened were deemed to have entered the trial and were followed up". The envelope would have been opened before any neonatal need for attention became apparent. |
| Selective reporting (reporting bias) | Unclear risk | Trial protocol not assessed. Reported outcomes not pre‐specified: blood transfusions; number of units transfused; days' stay; serious problems with 3rd stage;neonatal respiratory problems; birthweight; number with “serious problems in 3rd stage” (not pre‐specified), described as PPH, transfusion, manual removal of placenta, ERPC is reported. This is misleading as a number of those problems would co‐exist. |
| Other bias | High risk | Protocol was modified after 5 months (425 births), due to high blood loss in expectant management group, to allow women in the control arm who needed some active management to be switched to fully active management. However, data for the first 5 months were still included in analysis. Trial was stopped early because of potential harm. Sample size was meant to be 3900 but stopped after 1695. 30 women in the control group gave a late maternal refusal, whereas only 1 in the experimental group did so. The outcomes of these women are included in analysis. It is questioned whether the midwives had sufficient training in physiological third stage before the trial started. Harding et al found that, of 49 midwives responding to a questionnaire, only 1 had practised physiological management as defined in the trial. Only 6 (13%) of the midwives said that they were very confident of physiological management before the trial and 22 (46%) afterwards (Harding 1989; Prendiville 1988 paper). This trial has been criticised for including all women (including high parity, all age groups, previous PPH, epidural, long labour, operative delivery) and not confining inclusion criteria to women who were low risk. Women at high risk of PPH will have a higher blood loss using expectant management; clinicians experiencing this may respond by anxiety in subsequent births, even of low‐risk women, which may result in higher intervention (mixed management) rates. Only 47% (403/849) of women in physiological arm received the full physiological package (a problem with other studies also). But, in particular, 168/849 = 20% had prophylactic oxytocic, which is a large number for a “prophylactic” treatment as opposed to one in response to clinical need; In addition, 252 (30%) had a uterotonic as a treatment, so in total, 50% of the expectant management group received an oxytocic. However, 99% (838/846) of women in active management group received allocated management. |
| Methods | RCT with randomisation of individual women in balanced blocks, with allocation to 1 of 2 delivery postures within each arm. | |
| Participants | UK hospital setting. High‐income country. Inclusion criteria: 1512 women at low risk of PPH giving birth at study hospital (including water births). Exclusion criteria: placenta praevia, previous PPH, APH after 20 weeks’ gestation, Hb < 10 g/dL or MCV < 75 fL, non‐cephalic presentation, multiple pregnancy, intrauterine death, epidural anaesthesia, parity > 5, uterine fibroid, oxytocin augmentation infusion, anticoagulation therapy, intended instrumental or OVB, duration of gestation < 32 weeks, (plus any other contraindication, in clinician’s view). | |
| Interventions | Intervention: active management of 3rd stage (N = 748). 2 arms: active management ‐ upright position (N = 374); active management ‐ supine position (N = 374):
Control: expectant management of 3rd stage (N = 764). 2 arms: expectant management ‐ upright position (N = 381); expectant management ‐ supine position (N = 383):
Data included in Comparisons 1 and 2. | |
| Outcomes | Pre‐specified outcomes: PPH (> 500 mL) as assessed/estimated by the attending MW (used for power calculation); severe PPH 1000 mL), blood transfusion, iron tablets postnatally, Hb at 24‐48 hours P/N, self‐completed questionnaire on maternal fatigue and depression at 6 weeks P/N, nausea, vomiting, headache, hypertension, manual removal of placenta, ERPC, neonatal outcomes, views of mothers and staff. | |
| Notes | High‐income setting. Actual management used in the active arm: 699 (93.4%) had full active management; 95% given prophylactic uterotonic before delivery of placenta; 93% cord clamped before pulsation ceased; 46% CCT; 44% upright. Actual management used in the expectant arm: 488 (63.9%) had full expectant management; 21% received oxytocic for treatment, and 2.5% prophylactically; cord left unclamped till pulsation ceased 70%; placenta delivered by CCT 12%; 43% upright. The setting is described as one where the midwives were “similarly confident” in active and expectant management. However, the questionnaire administered to 92 of the 153 midwives prior to the trial commencement showed that, whereas 84% felt “very confident” of active management, only 41% were “very confident” of expectant management. Maternal mean Hb levels were reported with SEs and so SDs were calculated. | |
| Risk of bias | ||
| Bias | Authors' judgement | Support for judgement |
| Random sequence generation (selection bias) | Low risk | Variable sized balanced blocks “...randomisation envelopes were prepared in advance..” in an external academic unit ‐ National Perinatal Epidemiology Unit, Oxford. |
| Allocation concealment (selection bias) | Low risk | Sequentially numbered, opaque, sealed envelopes stored on the ward. Entry to the trial occurred when an envelope was opened. |
| Blinding of participants and personnel (performance bias) | High risk | Not possible to blind participants and personnel. |
| Blinding of outcome assessment (detection bias) | Unclear risk | Partly blinded. The technicians who did antenatal and postnatal blood tests were unaware of allocation. |
| Incomplete outcome data (attrition bias) | Low risk | Data available on 1507 out of 1512 at discharge (less than 0.5% attrition, approximately equal losses in both groups). At 6 weeks follow‐up less than 5% attrition. |
| Selective reporting (reporting bias) | Unclear risk | Both significant and non‐significant results presented but we have not been able to check the trial protocol. Most as above reported plus others. Only a few neonatal outcomes reported. |
| Other bias | High risk | ·Initial power calculation suggested a sample size of 2000. Interim analysis showed a higher PPH rate than expected, so sample size was revised to 1500 and the trial stopped earlier than expected. · Similar at baseline. · 93.4% of active management group received active management. Only 63.9% of women in expectant management group received expectant management. Also: · MWs not confident re 1 arm, so observer bias. · the hypothesis was phrased in favour of active management lowering PPH rate and other complications, rather than being a null hypothesis. Also, the setting is described as one where the midwives were “similarly confident” in active and expectant management. However, the questionnaire administered to 92 of the 153 midwives prior to the trial commencement showed that, whereas 84% felt “very confident” of active management, only 41% were “very confident” of expectant management. |
| Methods | RCT with randomisation of individual women. | |
| Participants | UK hospital setting. High‐income country. Inclusion criteria: women at "low risk of PPH” (defined only by the exclusion criteria for study) and at term (37‐42 weeks). 193 women randomised, from an unknown population. Exclusion criteria: grand multiparity; malpresentation, multiple pregnancy; previous CS or PPH; APH; pregnancy‐induced hypertension and intrauterine death. Then after randomisation: women who had had augmentation, instrumental or OVB, 3rd degree tear and cervical laceration. | |
| Interventions | Intervention: active management of 3rd stage (N = 103):
Comparison: expectant management of 3rd stage (N = 90): presumed no oxytocic, though not stated in the published paper. Authors’ information by letter states:
Both groups: if placenta not delivered in 30 minutes, bladder emptied and medical assistance sought. If delivery not imminent manual removal performed. Medical assistance sought for any excessive blood loss. Data included in Comparisons 1 and 2. | |
| Outcomes | Pre‐specified outcomes: estimated blood loss; Hb in labour and 3rd postnatal day; length of 3rd stage; complications. Reported outcomes: as above plus therapeutic uterotonics, blood transfusion. | |
| Notes | Drop in Hb is not calculated correctly. Maternal mean postnatal Hb reported as median and range. Active: 11.7 g/dL (10.7 to 12.6 g/dL) and expectant 11.7 g/dL (10.9 to 12.6 g/dL). Worrying problems with methodology and analysis. | |
| Risk of bias | ||
| Bias | Authors' judgement | Support for judgement |
| Random sequence generation (selection bias) | Low risk | “...randomly allocated using standard randomisation tables...” |
| Allocation concealment (selection bias) | Low risk | Not described. Not clear when randomisation occurred “...the midwife responsible for the management of her patient was not aware of the proposed allocation until her patient was entered into the study” (authors' information states: "randomised in the late 1st stage of labour when it was apparent that they were likely to delivery normally"). |
| Blinding of participants and personnel (performance bias) | High risk | Not possible to blind participants and personnel. |
| Blinding of outcome assessment (detection bias) | Unclear risk | Unknown. |
| Incomplete outcome data (attrition bias) | High risk | It is not clear how many were randomised. P. 20 states “A total of 193 women completed the study AND had all results available for complete analysis”. This could mean that a larger number were included but that some of their results were missing, and they were therefore excluded. This could lead to significant bias. It is very unlikely that all participants received the allocated management, yet this is not presented. The study groups were also very different sizes (103 and 93), which sounds unlikely. Women withdrawn after randomisation for operative delivery, 3rd degree tears and cervical lacerations. Numbers were not given; there is a significant risk of bias here. It is not stated in the published paper whether or not "intention to treat" analysis was used, but the response to Diana Elbourne’s letter of April 1991 states that they did not analyse on ‘intention to treat’ as it would not answer the aims of this preliminary study. |
| Selective reporting (reporting bias) | High risk | PPH rates not given and although this outcome was not specified in the trial registration form on 1991, it is key outcome which we would expect to be reported.
|
| Other bias | High risk | Variables age, birthweight and parity said to be equal between the groups but no details given. No power calculation done. Not a null hypothesis. The study groups were very different sizes (103 and 90). |
APH: antepartum haemorrhage
BP: blood pressure
CCT: controlled cord traction
CS: caesarean section
ERPC: evacuation of retained products of conception
fL: femtolitre
GA: general anaesthesia
g/dL: grams/decilitre
Hb: haemoglobin
HCT: haematocrit (= packed cell volume)
IM: intramuscular
ITT: intention‐to‐treat
IU: international units
IUFD: intrauterine fetal death
IV: intravenous
MCV: mean corpuscular volume
mL: millilitre
MW: midwife
OVB: operative vaginal birth
PCV: packed cell volume (= haematocrit)
P/N: postnatal
PPH: postpartum haemorrhage
PP: postpartum
RCT: randomised controlled trial
SCBU: special care baby unit
SD: standard deviation
SE: standard error
Characteristics of excluded studies [ordered by study ID]
| Study | Reason for exclusion |
| This study looked at uterine massage compared with active management and active management with uterine massage, so it was not a comparison of active and expectant management within the definitions used in the review. | |
| This study was an RCT of active management with and without controlled cord traction, so it was not a comparison of active and expectant management within the definitions used in the review. | |
| This study was an RCT of active management with and without controlled cord traction, so it was not a comparison of active and expectant management within the definitions used in the review. | |
| Conference abstract available only, but further information on methodology obtained from authors. Concerns re number of women withdrawn, after randomisation, due to CS. | |
| 48% of participants excluded in both arms following randomisation. | |
| This study looked at different times of undertaking manual removal of placenta to try to reduce PPH, so it was not a comparison of active and expectant management within the definitions used in the review. | |
| French conference abstract only, no full publication identified. The translation provided no information on the number of women randomised to each group and so it was not possible to use these data. Previous review authors wrote for further information but had no response. We wrote and received a response from the co‐author, but no further details to add to the published information. | |
| Insufficient information on the numbers included in each of the 3 arms, and the method of management for the expectant arm. | |
| Insufficient information. |
CS: caesarean section
PPH: postpartum haemorrhage
RCT: randomised controlled trial
Characteristics of studies awaiting assessment [ordered by study ID]
| Methods | |
| Participants | |
| Interventions | |
| Outcomes | |
| Notes | Awaiting a copy of the paper. |
Data and analyses
| Outcome or subgroup title | No. of studies | No. of participants | Statistical method | Effect size |
| 1 Severe primary postpartum haemorrhage (PPH) at time of birth (clinically estimated or measured blood loss ≥ 1000 mL) Show forest plot | 3 | 4636 | Risk Ratio (M‐H, Random, 95% CI) | 0.34 [0.14, 0.87] |
| Analysis 1.1  Comparison 1 Active versus expectant management of 3rd stage of labour (all women), Outcome 1 Severe primary postpartum haemorrhage (PPH) at time of birth (clinically estimated or measured blood loss ≥ 1000 mL). | ||||
| 1.1 High‐income setting | 3 | 4636 | Risk Ratio (M‐H, Random, 95% CI) | 0.34 [0.14, 0.87] |
| 1.2 Low‐income setting | 0 | 0 | Risk Ratio (M‐H, Random, 95% CI) | 0.0 [0.0, 0.0] |
| 2 Very severe primary PPH at time of birth (clinically estimated or measured blood loss ≥ 2500 mL) | 0 | 0 | Risk Ratio (M‐H, Random, 95% CI) | 0.0 [0.0, 0.0] |
| 2.1 High‐income setting | 0 | 0 | Risk Ratio (M‐H, Random, 95% CI) | 0.0 [0.0, 0.0] |
| 2.2 Low‐income setting | 0 | 0 | Risk Ratio (M‐H, Random, 95% CI) | 0.0 [0.0, 0.0] |
| 3 Maternal mortality | 0 | 0 | Risk Ratio (M‐H, Random, 95% CI) | 0.0 [0.0, 0.0] |
| 3.1 High‐income setting | 0 | 0 | Risk Ratio (M‐H, Random, 95% CI) | 0.0 [0.0, 0.0] |
| 3.2 Low‐income setting | 0 | 0 | Risk Ratio (M‐H, Random, 95% CI) | 0.0 [0.0, 0.0] |
| 4 Maternal Hb < 9 g/dL 24‐72 hours postpartum Show forest plot | 2 | 1572 | Risk Ratio (M‐H, Random, 95% CI) | 0.50 [0.30, 0.83] |
| Analysis 1.4  Comparison 1 Active versus expectant management of 3rd stage of labour (all women), Outcome 4 Maternal Hb < 9 g/dL 24‐72 hours postpartum. | ||||
| 4.1 High‐income setting | 2 | 1572 | Risk Ratio (M‐H, Random, 95% CI) | 0.50 [0.30, 0.83] |
| 4.2 Low‐income setting | 0 | 0 | Risk Ratio (M‐H, Random, 95% CI) | 0.0 [0.0, 0.0] |
| 5 Admission to neonatal special/intensive care Show forest plot | 2 | 3207 | Risk Ratio (M‐H, Random, 95% CI) | 0.81 [0.60, 1.11] |
| Analysis 1.5  Comparison 1 Active versus expectant management of 3rd stage of labour (all women), Outcome 5 Admission to neonatal special/intensive care. | ||||
| 5.1 High‐income setting | 2 | 3207 | Risk Ratio (M‐H, Random, 95% CI) | 0.81 [0.60, 1.11] |
| 5.2 Low‐income setting | 0 | 0 | Risk Ratio (M‐H, Random, 95% CI) | 0.0 [0.0, 0.0] |
| 6 Neonatal jaundice requiring phototherapy or exchange transfusion Show forest plot | 2 | 3142 | Risk Ratio (M‐H, Random, 95% CI) | 0.96 [0.55, 1.68] |
| Analysis 1.6  Comparison 1 Active versus expectant management of 3rd stage of labour (all women), Outcome 6 Neonatal jaundice requiring phototherapy or exchange transfusion. | ||||
| 6.1 High‐income setting | 2 | 3142 | Risk Ratio (M‐H, Random, 95% CI) | 0.96 [0.55, 1.68] |
| 6.2 Low‐income setting | 0 | 0 | Risk Ratio (M‐H, Random, 95% CI) | 0.0 [0.0, 0.0] |
| 7 Neonatal polycythaemia treated with dilutional exchange transfusion | 0 | 0 | Risk Ratio (M‐H, Random, 95% CI) | 0.0 [0.0, 0.0] |
| 7.1 High‐income setting | 0 | 0 | Risk Ratio (M‐H, Random, 95% CI) | 0.0 [0.0, 0.0] |
| 7.2 Low‐income setting | 0 | 0 | Risk Ratio (M‐H, Random, 95% CI) | 0.0 [0.0, 0.0] |
| 8 Severe primary PPH after placental delivery and up to 24 hours (clinically estimated or measured blood loss ≥ 1000 mL) | 0 | 0 | Risk Ratio (M‐H, Random, 95% CI) | 0.0 [0.0, 0.0] |
| 8.1 High‐income setting | 0 | 0 | Risk Ratio (M‐H, Random, 95% CI) | 0.0 [0.0, 0.0] |
| 8.2 Low‐income setting | 0 | 0 | Risk Ratio (M‐H, Random, 95% CI) | 0.0 [0.0, 0.0] |
| 9 Severe primary PPH at time of birth and up to 24 hours (clinically estimated or measured blood loss ≥ 1000 mL) | 0 | 0 | Risk Ratio (M‐H, Random, 95% CI) | 0.0 [0.0, 0.0] |
| 9.1 High‐income setting | 0 | 0 | Risk Ratio (M‐H, Random, 95% CI) | 0.0 [0.0, 0.0] |
| 9.2 Low‐income setting | 0 | 0 | Risk Ratio (M‐H, Random, 95% CI) | 0.0 [0.0, 0.0] |
| 10 Primary blood loss ≥ 500 mL at time of birth (clinically estimated or measured) Show forest plot | 3 | 4636 | Risk Ratio (M‐H, Random, 95% CI) | 0.34 [0.27, 0.44] |
| Analysis 1.10  Comparison 1 Active versus expectant management of 3rd stage of labour (all women), Outcome 10 Primary blood loss ≥ 500 mL at time of birth (clinically estimated or measured). | ||||
| 10.1 High‐income setting | 3 | 4636 | Risk Ratio (M‐H, Random, 95% CI) | 0.34 [0.27, 0.44] |
| 10.2 Low‐income setting | 0 | 0 | Risk Ratio (M‐H, Random, 95% CI) | 0.0 [0.0, 0.0] |
| 11 Primary blood loss ≥ 500 mL after delivery of placenta and up to 24 hours (clinically estimated or measured) | 0 | 0 | Risk Ratio (M‐H, Random, 95% CI) | 0.0 [0.0, 0.0] |
| 11.1 High‐income setting | 0 | 0 | Risk Ratio (M‐H, Random, 95% CI) | 0.0 [0.0, 0.0] |
| 11.2 Low‐income setting | 0 | 0 | Risk Ratio (M‐H, Random, 95% CI) | 0.0 [0.0, 0.0] |
| 12 Primary blood loss ≥ 500 mL at time of birth and up to 24 hours (clinically estimated or measured) | 0 | 0 | Risk Ratio (M‐H, Random, 95% CI) | 0.0 [0.0, 0.0] |
| 12.1 High‐income setting | 0 | 0 | Risk Ratio (M‐H, Random, 95% CI) | 0.0 [0.0, 0.0] |
| 12.2 Low‐income setting | 0 | 0 | Risk Ratio (M‐H, Random, 95% CI) | 0.0 [0.0, 0.0] |
| 13 Mean maternal blood loss (mL) at time of birth (clinically estimated or measured) Show forest plot | 2 | 2941 | Mean Difference (IV, Random, 95% CI) | ‐78.80 [‐95.96, ‐61.64] |
| Analysis 1.13  Comparison 1 Active versus expectant management of 3rd stage of labour (all women), Outcome 13 Mean maternal blood loss (mL) at time of birth (clinically estimated or measured). | ||||
| 13.1 High‐income setting | 2 | 2941 | Mean Difference (IV, Random, 95% CI) | ‐78.80 [‐95.96, ‐61.64] |
| 13.2 Low‐income setting | 0 | 0 | Mean Difference (IV, Random, 95% CI) | 0.0 [0.0, 0.0] |
| 14 Mean maternal blood loss (mL) after delivery of placenta and up to 24 hours (clinically estimated or measured) | 0 | 0 | Mean Difference (IV, Random, 95% CI) | 0.0 [0.0, 0.0] |
| 14.1 High‐income setting | 0 | 0 | Mean Difference (IV, Random, 95% CI) | 0.0 [0.0, 0.0] |
| 14.2 Low‐income setting | 0 | 0 | Mean Difference (IV, Random, 95% CI) | 0.0 [0.0, 0.0] |
| 15 Mean maternal blood loss (mL at time of birth and up to 24 hours (clinically estimated or measured) | 0 | 0 | Mean Difference (IV, Random, 95% CI) | 0.0 [0.0, 0.0] |
| 15.1 High‐income setting | 0 | 0 | Mean Difference (IV, Random, 95% CI) | 0.0 [0.0, 0.0] |
| 15.2 Low‐income setting | 0 | 0 | Mean Difference (IV, Random, 95% CI) | 0.0 [0.0, 0.0] |
| 16 Maternal blood transfusion Show forest plot | 4 | 4829 | Risk Ratio (M‐H, Random, 95% CI) | 0.35 [0.22, 0.55] |
| Analysis 1.16  Comparison 1 Active versus expectant management of 3rd stage of labour (all women), Outcome 16 Maternal blood transfusion. | ||||
| 16.1 High‐income setting | 4 | 4829 | Risk Ratio (M‐H, Random, 95% CI) | 0.35 [0.22, 0.55] |
| 16.2 Low‐income setting | 0 | 0 | Risk Ratio (M‐H, Random, 95% CI) | 0.0 [0.0, 0.0] |
| 17 Clinical signs of severe blood loss | 0 | 0 | Risk Ratio (M‐H, Random, 95% CI) | 0.0 [0.0, 0.0] |
| 17.1 High‐income setting | 0 | 0 | Risk Ratio (M‐H, Random, 95% CI) | 0.0 [0.0, 0.0] |
| 17.2 Low‐income setting | 0 | 0 | Risk Ratio (M‐H, Random, 95% CI) | 0.0 [0.0, 0.0] |
| 18 Therapeutic uterotonics during third stage and/or within 24 hours Show forest plot | 4 | 4829 | Risk Ratio (M‐H, Random, 95% CI) | 0.19 [0.15, 0.23] |
| Analysis 1.18  Comparison 1 Active versus expectant management of 3rd stage of labour (all women), Outcome 18 Therapeutic uterotonics during third stage and/or within 24 hours. | ||||
| 18.1 High‐income setting | 4 | 4829 | Risk Ratio (M‐H, Random, 95% CI) | 0.19 [0.15, 0.23] |
| 18.2 Low‐income setting | 0 | 0 | Risk Ratio (M‐H, Random, 95% CI) | 0.0 [0.0, 0.0] |
| 19 Mean length of third stage Show forest plot | 1 | 1429 | Mean Difference (IV, Random, 95% CI) | ‐0.30 [‐1.87, 1.27] |
| Analysis 1.19  Comparison 1 Active versus expectant management of 3rd stage of labour (all women), Outcome 19 Mean length of third stage. | ||||
| 19.1 High‐income setting | 1 | 1429 | Mean Difference (IV, Random, 95% CI) | ‐0.30 [‐1.87, 1.27] |
| 19.2 Low‐income setting | 0 | 0 | Mean Difference (IV, Random, 95% CI) | 0.0 [0.0, 0.0] |
| 20 Manual removal of placenta as defined by authors Show forest plot | 4 | 4829 | Risk Ratio (M‐H, Random, 95% CI) | 1.78 [0.57, 5.56] |
| Analysis 1.20  Comparison 1 Active versus expectant management of 3rd stage of labour (all women), Outcome 20 Manual removal of placenta as defined by authors. | ||||
| 20.1 High‐income setting | 4 | 4829 | Risk Ratio (M‐H, Random, 95% CI) | 1.78 [0.57, 5.56] |
| 20.2 Low‐income setting | 0 | 0 | Risk Ratio (M‐H, Random, 95% CI) | 0.0 [0.0, 0.0] |
| 21 Postnatal diastolic blood pressure > 90 mmHg between birth of baby and discharge from the labour ward. Show forest plot | 3 | 4636 | Risk Ratio (M‐H, Random, 95% CI) | 4.10 [1.63, 10.30] |
| Analysis 1.21  Comparison 1 Active versus expectant management of 3rd stage of labour (all women), Outcome 21 Postnatal diastolic blood pressure > 90 mmHg between birth of baby and discharge from the labour ward.. | ||||
| 21.1 High‐income setting | 3 | 4636 | Risk Ratio (M‐H, Random, 95% CI) | 4.10 [1.63, 10.30] |
| 21.2 Low‐income setting | 0 | 0 | Risk Ratio (M‐H, Random, 95% CI) | 0.0 [0.0, 0.0] |
| 22 Postnatal vomiting between birth of baby and discharge from the labour ward. Show forest plot | 3 | 4636 | Risk Ratio (M‐H, Random, 95% CI) | 2.47 [1.36, 4.48] |
| Analysis 1.22  Comparison 1 Active versus expectant management of 3rd stage of labour (all women), Outcome 22 Postnatal vomiting between birth of baby and discharge from the labour ward.. | ||||
| 22.1 High‐income setting | 3 | 4636 | Risk Ratio (M‐H, Random, 95% CI) | 2.47 [1.36, 4.48] |
| 22.2 Low‐income setting | 0 | 0 | Risk Ratio (M‐H, Random, 95% CI) | 0.0 [0.0, 0.0] |
| 23 Any analgesia between birth of the baby and discharge from labour ward Show forest plot | 1 | 1429 | Risk Ratio (M‐H, Random, 95% CI) | 2.53 [1.34, 4.78] |
| Analysis 1.23  Comparison 1 Active versus expectant management of 3rd stage of labour (all women), Outcome 23 Any analgesia between birth of the baby and discharge from labour ward. | ||||
| 23.1 High‐income setting | 1 | 1429 | Risk Ratio (M‐H, Random, 95% CI) | 2.53 [1.34, 4.78] |
| 23.2 Low‐income setting | 0 | 0 | Risk Ratio (M‐H, Random, 95% CI) | 0.0 [0.0, 0.0] |
| 24 Women's assessment of pain during third stage as reported by authors. | 0 | 0 | Risk Ratio (M‐H, Random, 95% CI) | 0.0 [0.0, 0.0] |
| 24.1 High‐income setting | 0 | 0 | Risk Ratio (M‐H, Random, 95% CI) | 0.0 [0.0, 0.0] |
| 24.2 Low‐income setting | 0 | 0 | Risk Ratio (M‐H, Random, 95% CI) | 0.0 [0.0, 0.0] |
| 25 Secondary blood loss/any vaginal bleeding needing treatment (after 24 hours and up to 6 weeks) Show forest plot | 3 | 4636 | Risk Ratio (M‐H, Random, 95% CI) | 1.10 [0.40, 2.99] |
| Analysis 1.25  Comparison 1 Active versus expectant management of 3rd stage of labour (all women), Outcome 25 Secondary blood loss/any vaginal bleeding needing treatment (after 24 hours and up to 6 weeks). | ||||
| 25.1 High‐income setting | 3 | 4636 | Risk Ratio (M‐H, Random, 95% CI) | 1.10 [0.40, 2.99] |
| 25.2 Low‐income setting | 0 | 0 | Risk Ratio (M‐H, Random, 95% CI) | 0.0 [0.0, 0.0] |
| 26 Amount of lochia either estimated or measured after 24 hours and up to discharge from hospital. | 0 | 0 | Mean Difference (IV, Random, 95% CI) | 0.0 [0.0, 0.0] |
| 26.1 High‐income setting | 0 | 0 | Mean Difference (IV, Random, 95% CI) | 0.0 [0.0, 0.0] |
| 26.2 Low‐income setting | 0 | 0 | Mean Difference (IV, Random, 95% CI) | 0.0 [0.0, 0.0] |
| 27 Surgical evacuation of retained products of conception Show forest plot | 3 | 4636 | Risk Ratio (M‐H, Random, 95% CI) | 0.74 [0.32, 1.71] |
| Analysis 1.27  Comparison 1 Active versus expectant management of 3rd stage of labour (all women), Outcome 27 Surgical evacuation of retained products of conception. | ||||
| 27.1 High‐income setting | 3 | 4636 | Risk Ratio (M‐H, Random, 95% CI) | 0.74 [0.32, 1.71] |
| 27.2 Low‐income setting | 0 | 0 | Risk Ratio (M‐H, Random, 95% CI) | 0.0 [0.0, 0.0] |
| 28 Afterpains ‐ abdominal pain associated with the contracting uterus in the postpartum period. Show forest plot | 1 | 1429 | Risk Ratio (M‐H, Random, 95% CI) | 2.53 [1.34, 4.78] |
| Analysis 1.28  Comparison 1 Active versus expectant management of 3rd stage of labour (all women), Outcome 28 Afterpains ‐ abdominal pain associated with the contracting uterus in the postpartum period.. | ||||
| 28.1 High‐income setting | 1 | 1429 | Risk Ratio (M‐H, Random, 95% CI) | 2.53 [1.34, 4.78] |
| 28.2 Low‐income setting | 0 | 0 | Risk Ratio (M‐H, Random, 95% CI) | 0.0 [0.0, 0.0] |
| 29 Apgar score < 7 at 5 minutes Show forest plot | 1 | 1695 | Risk Ratio (M‐H, Random, 95% CI) | 1.00 [0.38, 2.66] |
| Analysis 1.29  Comparison 1 Active versus expectant management of 3rd stage of labour (all women), Outcome 29 Apgar score < 7 at 5 minutes. | ||||
| 29.1 High‐income setting | 1 | 1695 | Risk Ratio (M‐H, Random, 95% CI) | 1.00 [0.38, 2.66] |
| 29.2 Low‐income setting | 0 | 0 | Risk Ratio (M‐H, Random, 95% CI) | 0.0 [0.0, 0.0] |
| 30 Birthweight Show forest plot | 2 | 3207 | Mean Difference (IV, Random, 95% CI) | ‐76.90 [‐108.51, ‐45.30] |
| Analysis 1.30  Comparison 1 Active versus expectant management of 3rd stage of labour (all women), Outcome 30 Birthweight. | ||||
| 30.1 High‐income setting | 2 | 3207 | Mean Difference (IV, Random, 95% CI) | ‐76.90 [‐108.51, ‐45.30] |
| 30.2 Low‐income setting | 0 | 0 | Mean Difference (IV, Random, 95% CI) | 0.0 [0.0, 0.0] |
| 31 Neonatal encephalopathy assessed using Sarnat staging (Sarnat 1976; Table 1). | 0 | 0 | Risk Ratio (M‐H, Random, 95% CI) | 0.0 [0.0, 0.0] |
| 31.1 High‐income setting | 0 | 0 | Risk Ratio (M‐H, Random, 95% CI) | 0.0 [0.0, 0.0] |
| 31.2 Low‐income setting | 0 | 0 | Risk Ratio (M‐H, Random, 95% CI) | 0.0 [0.0, 0.0] |
| 32 Neonatal mortality | 0 | 0 | Risk Ratio (M‐H, Random, 95% CI) | 0.0 [0.0, 0.0] |
| 32.1 High‐income setting | 0 | 0 | Risk Ratio (M‐H, Random, 95% CI) | 0.0 [0.0, 0.0] |
| 32.2 Low‐income setting | 0 | 0 | Risk Ratio (M‐H, Random, 95% CI) | 0.0 [0.0, 0.0] |
| 33 Intraventricular haemorrhage ‐ Papille grade III/IV ‐ (for infants born before 34 weeks' gestation only). | 0 | 0 | Risk Ratio (M‐H, Random, 95% CI) | 0.0 [0.0, 0.0] |
| 33.1 High‐income setting | 0 | 0 | Risk Ratio (M‐H, Random, 95% CI) | 0.0 [0.0, 0.0] |
| 33.2 Low‐income setting | 0 | 0 | Risk Ratio (M‐H, Random, 95% CI) | 0.0 [0.0, 0.0] |
| 34 Number of infants who received a red blood cell transfusion. | 0 | 0 | Risk Ratio (M‐H, Random, 95% CI) | 0.0 [0.0, 0.0] |
| 34.1 High‐income setting | 0 | 0 | Risk Ratio (M‐H, Random, 95% CI) | 0.0 [0.0, 0.0] |
| 34.2 Low‐income setting | 0 | 0 | Risk Ratio (M‐H, Random, 95% CI) | 0.0 [0.0, 0.0] |
| 35 Infant Hb level at 24 to 72 hours | 0 | 0 | Mean Difference (IV, Random, 95% CI) | 0.0 [0.0, 0.0] |
| 35.1 High‐income setting | 0 | 0 | Mean Difference (IV, Random, 95% CI) | 0.0 [0.0, 0.0] |
| 35.2 Low‐income setting | 0 | 0 | Mean Difference (IV, Random, 95% CI) | 0.0 [0.0, 0.0] |
| 36 Infant Hb level at 3‐6 months | 0 | 0 | Mean Difference (IV, Random, 95% CI) | 0.0 [0.0, 0.0] |
| 36.1 High‐income setting | 0 | 0 | Mean Difference (IV, Random, 95% CI) | 0.0 [0.0, 0.0] |
| 36.2 Low‐income setting | 0 | 0 | Mean Difference (IV, Random, 95% CI) | 0.0 [0.0, 0.0] |
| 37 Infant iron indices (ferritin) at 3 to 6 months. | 0 | 0 | Risk Ratio (M‐H, Random, 95% CI) | 0.0 [0.0, 0.0] |
| 37.1 High‐income setting | 0 | 0 | Risk Ratio (M‐H, Random, 95% CI) | 0.0 [0.0, 0.0] |
| 37.2 Low‐income setting | 0 | 0 | Risk Ratio (M‐H, Random, 95% CI) | 0.0 [0.0, 0.0] |
| 38 Exclusive breastfeeding at discharge from hospital Show forest plot | 1 | 1695 | Risk Ratio (M‐H, Random, 95% CI) | 1.01 [0.96, 1.07] |
| Analysis 1.38  Comparison 1 Active versus expectant management of 3rd stage of labour (all women), Outcome 38 Exclusive breastfeeding at discharge from hospital. | ||||
| 38.1 High‐income setting | 1 | 1695 | Risk Ratio (M‐H, Random, 95% CI) | 1.01 [0.96, 1.07] |
| 38.2 Low‐income setting | 0 | 0 | Risk Ratio (M‐H, Random, 95% CI) | 0.0 [0.0, 0.0] |
| 39 Neurodevelopmental, cognitive or developmental outcomes assessed after age 18 months. | 0 | 0 | Risk Ratio (M‐H, Random, 95% CI) | 0.0 [0.0, 0.0] |
| 39.1 High‐income setting | 0 | 0 | Risk Ratio (M‐H, Random, 95% CI) | 0.0 [0.0, 0.0] |
| 39.2 Low‐income setting | 0 | 0 | Risk Ratio (M‐H, Random, 95% CI) | 0.0 [0.0, 0.0] |
| 40 Return to hospital as in‐ or outpatient because of bleeding (not pre‐specified) Show forest plot | 2 | 2941 | Risk Ratio (M‐H, Random, 95% CI) | 2.21 [1.29, 3.79] |
| Analysis 1.40  Comparison 1 Active versus expectant management of 3rd stage of labour (all women), Outcome 40 Return to hospital as in‐ or outpatient because of bleeding (not pre‐specified). | ||||
| 40.1 High‐income setting | 2 | 2941 | Risk Ratio (M‐H, Random, 95% CI) | 2.21 [1.29, 3.79] |
| 40.2 Low‐income setting | 0 | 0 | Risk Ratio (M‐H, Random, 95% CI) | 0.0 [0.0, 0.0] |
| 41 Postnatal maternal mean Hb (outcome not pre‐specified) Show forest plot | 3 | 4062 | Mean Difference (IV, Random, 95% CI) | 0.52 [0.44, 0.60] |
| Analysis 1.41  Comparison 1 Active versus expectant management of 3rd stage of labour (all women), Outcome 41 Postnatal maternal mean Hb (outcome not pre‐specified). | ||||
| 41.1 High‐income setting | 3 | 4062 | Mean Difference (IV, Random, 95% CI) | 0.52 [0.44, 0.60] |
| 41.2 Low‐income setting | 0 | 0 | Mean Difference (IV, Random, 95% CI) | 0.0 [0.0, 0.0] |
| Outcome or subgroup title | No. of studies | No. of participants | Statistical method | Effect size |
| 1 Severe primary PPH at time of birth (clinically estimated or measured blood loss ≥ 1000 mL) Show forest plot | 2 | 2941 | Risk Ratio (M‐H, Random, 95% CI) | 0.31 [0.05, 2.17] |
| Analysis 2.1  Comparison 2 Active versus expectant management of 3rd stage of labour (women at low risk), Outcome 1 Severe primary PPH at time of birth (clinically estimated or measured blood loss ≥ 1000 mL). | ||||
| 1.1 High‐income setting | 2 | 2941 | Risk Ratio (M‐H, Random, 95% CI) | 0.31 [0.05, 2.17] |
| 1.2 Low‐income setting | 0 | 0 | Risk Ratio (M‐H, Random, 95% CI) | 0.0 [0.0, 0.0] |
| 2 Very severe primary PPH at time of birth (clinically estimated or measured blood loss ≥ 2500 mL) | 0 | 0 | Risk Ratio (M‐H, Random, 95% CI) | 0.0 [0.0, 0.0] |
| 2.1 High‐income setting | 0 | 0 | Risk Ratio (M‐H, Random, 95% CI) | 0.0 [0.0, 0.0] |
| 2.2 Low‐income setting | 0 | 0 | Risk Ratio (M‐H, Random, 95% CI) | 0.0 [0.0, 0.0] |
| 3 Maternal mortality | 0 | 0 | Risk Ratio (M‐H, Random, 95% CI) | 0.0 [0.0, 0.0] |
| 3.1 High‐income setting | 0 | 0 | Risk Ratio (M‐H, Random, 95% CI) | 0.0 [0.0, 0.0] |
| 3.2 Low‐income setting | 0 | 0 | Risk Ratio (M‐H, Random, 95% CI) | 0.0 [0.0, 0.0] |
| 4 Maternal Hb < 9 g/dL at 24‐72 hr Show forest plot | 1 | 193 | Risk Ratio (M‐H, Random, 95% CI) | 0.17 [0.02, 1.47] |
| Analysis 2.4  Comparison 2 Active versus expectant management of 3rd stage of labour (women at low risk), Outcome 4 Maternal Hb < 9 g/dL at 24‐72 hr. | ||||
| 4.1 High‐income setting | 1 | 193 | Risk Ratio (M‐H, Random, 95% CI) | 0.17 [0.02, 1.47] |
| 4.2 Low‐income setting | 0 | 0 | Risk Ratio (M‐H, Random, 95% CI) | 0.0 [0.0, 0.0] |
| 5 Admission to neonatal special/intensive care Show forest plot | 1 | 1512 | Risk Ratio (M‐H, Random, 95% CI) | 1.02 [0.55, 1.88] |
| Analysis 2.5  Comparison 2 Active versus expectant management of 3rd stage of labour (women at low risk), Outcome 5 Admission to neonatal special/intensive care. | ||||
| 5.1 High‐income setting | 1 | 1512 | Risk Ratio (M‐H, Random, 95% CI) | 1.02 [0.55, 1.88] |
| 5.2 Low‐income setting | 0 | 0 | Risk Ratio (M‐H, Random, 95% CI) | 0.0 [0.0, 0.0] |
| 6 Neonatal jaundice requiring phototherapy or exchange transfusion Show forest plot | 1 | 1447 | Risk Ratio (M‐H, Random, 95% CI) | 1.31 [0.78, 2.18] |
| Analysis 2.6  Comparison 2 Active versus expectant management of 3rd stage of labour (women at low risk), Outcome 6 Neonatal jaundice requiring phototherapy or exchange transfusion. | ||||
| 6.1 High‐income setting | 1 | 1447 | Risk Ratio (M‐H, Random, 95% CI) | 1.31 [0.78, 2.18] |
| 6.2 Low‐income setting | 0 | 0 | Risk Ratio (M‐H, Random, 95% CI) | 0.0 [0.0, 0.0] |
| 7 Neonatal polycythaemia treated with dilutional exchange transfusion | 0 | 0 | Risk Ratio (M‐H, Random, 95% CI) | 0.0 [0.0, 0.0] |
| 7.1 High‐income setting | 0 | 0 | Risk Ratio (M‐H, Random, 95% CI) | 0.0 [0.0, 0.0] |
| 7.2 Low‐income setting | 0 | 0 | Risk Ratio (M‐H, Random, 95% CI) | 0.0 [0.0, 0.0] |
| 8 Severe primary PPH after placental delivery and up to 24 hours (clinically estimated or measured blood loss ≥ 1000 mL) | 0 | 0 | Risk Ratio (M‐H, Random, 95% CI) | 0.0 [0.0, 0.0] |
| 8.1 High‐income setting | 0 | 0 | Risk Ratio (M‐H, Random, 95% CI) | 0.0 [0.0, 0.0] |
| 8.2 Low‐income setting | 0 | 0 | Risk Ratio (M‐H, Random, 95% CI) | 0.0 [0.0, 0.0] |
| 9 Severe primary PPH at time of birth and up to 24 hours (clinically estimated or measured blood loss ≥ 1000 mL) | 0 | 0 | Risk Ratio (M‐H, Random, 95% CI) | 0.0 [0.0, 0.0] |
| 9.1 High‐income setting | 0 | 0 | Risk Ratio (M‐H, Random, 95% CI) | 0.0 [0.0, 0.0] |
| 9.2 Low‐income setting | 0 | 0 | Risk Ratio (M‐H, Random, 95% CI) | 0.0 [0.0, 0.0] |
| 10 Primary blood loss ≥ 500 mL at time of birth (clinically estimated or measured) Show forest plot | 2 | 2941 | Risk Ratio (M‐H, Random, 95% CI) | 0.33 [0.20, 0.56] |
| Analysis 2.10  Comparison 2 Active versus expectant management of 3rd stage of labour (women at low risk), Outcome 10 Primary blood loss ≥ 500 mL at time of birth (clinically estimated or measured). | ||||
| 10.1 High‐income setting | 2 | 2941 | Risk Ratio (M‐H, Random, 95% CI) | 0.33 [0.20, 0.56] |
| 10.2 Low‐income setting | 0 | 0 | Risk Ratio (M‐H, Random, 95% CI) | 0.0 [0.0, 0.0] |
| 11 Primary blood loss ≥ 500 mL after delivery of placenta and up to 24 hours (clinically estimated or measured) | 0 | 0 | Risk Ratio (M‐H, Random, 95% CI) | 0.0 [0.0, 0.0] |
| 11.1 High‐income setting | 0 | 0 | Risk Ratio (M‐H, Random, 95% CI) | 0.0 [0.0, 0.0] |
| 11.2 Low‐income setting | 0 | 0 | Risk Ratio (M‐H, Random, 95% CI) | 0.0 [0.0, 0.0] |
| 12 Primary blood loss ≥ 500 mL at time of birth and up to 24 hours (clinically estimated or measured) | 0 | 0 | Risk Ratio (M‐H, Random, 95% CI) | 0.0 [0.0, 0.0] |
| 12.1 High‐income setting | 0 | 0 | Risk Ratio (M‐H, Random, 95% CI) | 0.0 [0.0, 0.0] |
| 12.2 Low‐income setting | 0 | 0 | Risk Ratio (M‐H, Random, 95% CI) | 0.0 [0.0, 0.0] |
| 13 Mean maternal blood loss (mL at the time of birth, clinically estimated or measured Show forest plot | 2 | 2941 | Mean Difference (IV, Random, 95% CI) | ‐78.80 [‐95.96, ‐61.64] |
| Analysis 2.13  Comparison 2 Active versus expectant management of 3rd stage of labour (women at low risk), Outcome 13 Mean maternal blood loss (mL at the time of birth, clinically estimated or measured. | ||||
| 13.1 High‐income setting | 2 | 2941 | Mean Difference (IV, Random, 95% CI) | ‐78.80 [‐95.96, ‐61.64] |
| 13.2 Low‐income setting | 0 | 0 | Mean Difference (IV, Random, 95% CI) | 0.0 [0.0, 0.0] |
| 14 Mean maternal blood loss (mL) after delivery of placenta and up to 24 hours (clinically estimated or measured) | 0 | 0 | Mean Difference (IV, Random, 95% CI) | 0.0 [0.0, 0.0] |
| 14.1 High‐income setting | 0 | 0 | Mean Difference (IV, Random, 95% CI) | 0.0 [0.0, 0.0] |
| 14.2 Low‐income setting | 0 | 0 | Mean Difference (IV, Random, 95% CI) | 0.0 [0.0, 0.0] |
| 15 Mean maternal blood loss (mL) at time of birth and up to 24 hours (clinically estimated or measured) | 0 | 0 | Mean Difference (IV, Random, 95% CI) | 0.0 [0.0, 0.0] |
| 15.1 High‐income setting | 0 | 0 | Mean Difference (IV, Random, 95% CI) | 0.0 [0.0, 0.0] |
| 15.2 Low‐income setting | 0 | 0 | Mean Difference (IV, Random, 95% CI) | 0.0 [0.0, 0.0] |
| 16 Maternal blood transfusion Show forest plot | 3 | 3134 | Risk Ratio (M‐H, Random, 95% CI) | 0.30 [0.10, 0.88] |
| Analysis 2.16  Comparison 2 Active versus expectant management of 3rd stage of labour (women at low risk), Outcome 16 Maternal blood transfusion. | ||||
| 16.1 High‐income setting | 3 | 3134 | Risk Ratio (M‐H, Random, 95% CI) | 0.30 [0.10, 0.88] |
| 16.2 Low‐income setting | 0 | 0 | Risk Ratio (M‐H, Random, 95% CI) | 0.0 [0.0, 0.0] |
| 17 Clinical signs of severe blood loss | 0 | 0 | Risk Ratio (M‐H, Random, 95% CI) | 0.0 [0.0, 0.0] |
| 17.1 High‐income setting | 0 | 0 | Risk Ratio (M‐H, Random, 95% CI) | 0.0 [0.0, 0.0] |
| 17.2 Low‐income setting | 0 | 0 | Risk Ratio (M‐H, Random, 95% CI) | 0.0 [0.0, 0.0] |
| 18 Therapeutic uterotonics during third stage and/or within 24 hours Show forest plot | 3 | 3134 | Risk Ratio (M‐H, Random, 95% CI) | 0.15 [0.11, 0.21] |
| Analysis 2.18  Comparison 2 Active versus expectant management of 3rd stage of labour (women at low risk), Outcome 18 Therapeutic uterotonics during third stage and/or within 24 hours. | ||||
| 18.1 High‐income setting | 3 | 3134 | Risk Ratio (M‐H, Random, 95% CI) | 0.15 [0.11, 0.21] |
| 18.2 Low‐income setting | 0 | 0 | Risk Ratio (M‐H, Random, 95% CI) | 0.0 [0.0, 0.0] |
| 19 Mean length of third stage Show forest plot | 1 | 1429 | Mean Difference (IV, Random, 95% CI) | ‐0.30 [‐1.87, 1.27] |
| Analysis 2.19  Comparison 2 Active versus expectant management of 3rd stage of labour (women at low risk), Outcome 19 Mean length of third stage. | ||||
| 19.1 High‐income setting | 1 | 1429 | Mean Difference (IV, Random, 95% CI) | ‐0.30 [‐1.87, 1.27] |
| 19.2 Low‐income setting | 0 | 0 | Mean Difference (IV, Random, 95% CI) | 0.0 [0.0, 0.0] |
| 20 Manual removal of placenta as defined by authors Show forest plot | 3 | 3134 | Risk Ratio (M‐H, Random, 95% CI) | 3.58 [0.42, 30.61] |
| Analysis 2.20  Comparison 2 Active versus expectant management of 3rd stage of labour (women at low risk), Outcome 20 Manual removal of placenta as defined by authors. | ||||
| 20.1 High‐income setting | 3 | 3134 | Risk Ratio (M‐H, Random, 95% CI) | 3.58 [0.42, 30.61] |
| 20.2 Low‐income setting | 0 | 0 | Risk Ratio (M‐H, Random, 95% CI) | 0.0 [0.0, 0.0] |
| 21 Postnatal diastolic blood pressure > 90 mmHg between birth of baby and discharge from the labour ward. Show forest plot | 2 | 2941 | Risk Ratio (M‐H, Random, 95% CI) | 7.00 [2.99, 16.43] |
| Analysis 2.21  Comparison 2 Active versus expectant management of 3rd stage of labour (women at low risk), Outcome 21 Postnatal diastolic blood pressure > 90 mmHg between birth of baby and discharge from the labour ward.. | ||||
| 21.1 High‐income setting | 2 | 2941 | Risk Ratio (M‐H, Random, 95% CI) | 7.00 [2.99, 16.43] |
| 21.2 Low‐income setting | 0 | 0 | Risk Ratio (M‐H, Random, 95% CI) | 0.0 [0.0, 0.0] |
| 22 Postnatal vomiting between birth of baby and discharge from the labour ward. Show forest plot | 2 | 2941 | Risk Ratio (M‐H, Random, 95% CI) | 5.63 [0.69, 46.08] |
| Analysis 2.22  Comparison 2 Active versus expectant management of 3rd stage of labour (women at low risk), Outcome 22 Postnatal vomiting between birth of baby and discharge from the labour ward.. | ||||
| 22.1 High‐income setting | 2 | 2941 | Risk Ratio (M‐H, Random, 95% CI) | 5.63 [0.69, 46.08] |
| 22.2 Low‐income setting | 0 | 0 | Risk Ratio (M‐H, Random, 95% CI) | 0.0 [0.0, 0.0] |
| 23 Any analgesia between birth of the baby and up to discharge from labour ward Show forest plot | 1 | 1429 | Risk Ratio (M‐H, Random, 95% CI) | 2.53 [1.34, 4.78] |
| Analysis 2.23  Comparison 2 Active versus expectant management of 3rd stage of labour (women at low risk), Outcome 23 Any analgesia between birth of the baby and up to discharge from labour ward. | ||||
| 23.1 High‐income setting | 1 | 1429 | Risk Ratio (M‐H, Random, 95% CI) | 2.53 [1.34, 4.78] |
| 23.2 Low‐income setting | 0 | 0 | Risk Ratio (M‐H, Random, 95% CI) | 0.0 [0.0, 0.0] |
| 24 Women's assessment of pain during third stage as reported by authors. | 0 | 0 | Risk Ratio (M‐H, Random, 95% CI) | 0.0 [0.0, 0.0] |
| 24.1 High‐income setting | 0 | 0 | Risk Ratio (M‐H, Random, 95% CI) | 0.0 [0.0, 0.0] |
| 24.2 Low‐income setting | 0 | 0 | Risk Ratio (M‐H, Random, 95% CI) | 0.0 [0.0, 0.0] |
| 25 Secondary blood loss/any vaginal bleeding needing treatment (after 24 hours and up to 6 weeks) Show forest plot | 2 | 2941 | Risk Ratio (M‐H, Random, 95% CI) | 1.78 [0.69, 4.60] |
| Analysis 2.25  Comparison 2 Active versus expectant management of 3rd stage of labour (women at low risk), Outcome 25 Secondary blood loss/any vaginal bleeding needing treatment (after 24 hours and up to 6 weeks). | ||||
| 25.1 High‐income setting | 2 | 2941 | Risk Ratio (M‐H, Random, 95% CI) | 1.78 [0.69, 4.60] |
| 25.2 Low‐income setting | 0 | 0 | Risk Ratio (M‐H, Random, 95% CI) | 0.0 [0.0, 0.0] |
| 26 Amount of lochia either estimated or measured after 24 hours and up to discharge from hospital. | 0 | 0 | Mean Difference (IV, Random, 95% CI) | 0.0 [0.0, 0.0] |
| 26.1 High‐income setting | 0 | 0 | Mean Difference (IV, Random, 95% CI) | 0.0 [0.0, 0.0] |
| 26.2 Low‐income setting | 0 | 0 | Mean Difference (IV, Random, 95% CI) | 0.0 [0.0, 0.0] |
| 27 Surgical evacuation of retained products of conception Show forest plot | 2 | 2941 | Risk Ratio (M‐H, Random, 95% CI) | 0.69 [0.12, 3.98] |
| Analysis 2.27  Comparison 2 Active versus expectant management of 3rd stage of labour (women at low risk), Outcome 27 Surgical evacuation of retained products of conception. | ||||
| 27.1 High‐income setting | 2 | 2941 | Risk Ratio (M‐H, Random, 95% CI) | 0.69 [0.12, 3.98] |
| 27.2 Low‐income setting | 0 | 0 | Risk Ratio (M‐H, Random, 95% CI) | 0.0 [0.0, 0.0] |
| 28 Afterpains ‐ abdominal pain associated with the contracting uterus in the postpartum period. Show forest plot | 1 | 1429 | Risk Ratio (M‐H, Random, 95% CI) | 2.53 [1.34, 4.78] |
| Analysis 2.28  Comparison 2 Active versus expectant management of 3rd stage of labour (women at low risk), Outcome 28 Afterpains ‐ abdominal pain associated with the contracting uterus in the postpartum period.. | ||||
| 28.1 High‐income setting | 1 | 1429 | Risk Ratio (M‐H, Random, 95% CI) | 2.53 [1.34, 4.78] |
| 28.2 Low‐income setting | 0 | 0 | Risk Ratio (M‐H, Random, 95% CI) | 0.0 [0.0, 0.0] |
| 29 Apgar score < 7 at 5 minutes | 0 | 0 | Risk Ratio (M‐H, Random, 95% CI) | 0.0 [0.0, 0.0] |
| 29.1 High‐income setting | 0 | 0 | Risk Ratio (M‐H, Random, 95% CI) | 0.0 [0.0, 0.0] |
| 29.2 Low‐income setting | 0 | 0 | Risk Ratio (M‐H, Random, 95% CI) | 0.0 [0.0, 0.0] |
| 30 Birthweight Show forest plot | 1 | 1512 | Mean Difference (IV, Random, 95% CI) | ‐67.0 [‐114.13, ‐19.87] |
| Analysis 2.30  Comparison 2 Active versus expectant management of 3rd stage of labour (women at low risk), Outcome 30 Birthweight. | ||||
| 30.1 High‐income setting | 1 | 1512 | Mean Difference (IV, Random, 95% CI) | ‐67.0 [‐114.13, ‐19.87] |
| 30.2 Low‐income setting | 0 | 0 | Mean Difference (IV, Random, 95% CI) | 0.0 [0.0, 0.0] |
| 31 Neonatal encephalopathy assessed using Sarnat staging (Sarnat 1976; Table 1). | 0 | 0 | Risk Ratio (M‐H, Random, 95% CI) | 0.0 [0.0, 0.0] |
| 31.1 High‐income setting | 0 | 0 | Risk Ratio (M‐H, Random, 95% CI) | 0.0 [0.0, 0.0] |
| 31.2 Low‐income setting | 0 | 0 | Risk Ratio (M‐H, Random, 95% CI) | 0.0 [0.0, 0.0] |
| 32 Neonatal mortality | 0 | 0 | Risk Ratio (M‐H, Random, 95% CI) | 0.0 [0.0, 0.0] |
| 32.1 High‐income setting | 0 | 0 | Risk Ratio (M‐H, Random, 95% CI) | 0.0 [0.0, 0.0] |
| 32.2 Low‐income setting | 0 | 0 | Risk Ratio (M‐H, Random, 95% CI) | 0.0 [0.0, 0.0] |
| 33 Intraventricular haemorrhage ‐ Papille grade III/IV ‐ (for infants born before 34 weeks' gestation only). | 0 | 0 | Risk Ratio (M‐H, Random, 95% CI) | 0.0 [0.0, 0.0] |
| 33.1 High‐income setting | 0 | 0 | Risk Ratio (M‐H, Random, 95% CI) | 0.0 [0.0, 0.0] |
| 33.2 Low‐income setting | 0 | 0 | Risk Ratio (M‐H, Random, 95% CI) | 0.0 [0.0, 0.0] |
| 34 Number of infants exposed to one or more red blood cell transfusions | 0 | 0 | Risk Ratio (M‐H, Random, 95% CI) | 0.0 [0.0, 0.0] |
| 34.1 High‐income setting | 0 | 0 | Risk Ratio (M‐H, Random, 95% CI) | 0.0 [0.0, 0.0] |
| 34.2 Low‐income setting | 0 | 0 | Risk Ratio (M‐H, Random, 95% CI) | 0.0 [0.0, 0.0] |
| 35 Infant Hb level at 24 to 72 hours | 0 | 0 | Mean Difference (IV, Random, 95% CI) | 0.0 [0.0, 0.0] |
| 35.1 High‐income setting | 0 | 0 | Mean Difference (IV, Random, 95% CI) | 0.0 [0.0, 0.0] |
| 35.2 Low‐income setting | 0 | 0 | Mean Difference (IV, Random, 95% CI) | 0.0 [0.0, 0.0] |
| 36 Infant Hb level at 3‐6 months | 0 | 0 | Mean Difference (IV, Random, 95% CI) | 0.0 [0.0, 0.0] |
| 36.1 High‐income setting | 0 | 0 | Mean Difference (IV, Random, 95% CI) | 0.0 [0.0, 0.0] |
| 36.2 Low‐income setting | 0 | 0 | Mean Difference (IV, Random, 95% CI) | 0.0 [0.0, 0.0] |
| 37 Infant iron indices (ferritin) at 3 to 6 months. | 0 | 0 | Risk Ratio (M‐H, Random, 95% CI) | 0.0 [0.0, 0.0] |
| 37.1 High‐income setting | 0 | 0 | Risk Ratio (M‐H, Random, 95% CI) | 0.0 [0.0, 0.0] |
| 37.2 Low‐income setting | 0 | 0 | Risk Ratio (M‐H, Random, 95% CI) | 0.0 [0.0, 0.0] |
| 38 Exclusive breastfeeding at discharge from hospital | 0 | 0 | Risk Ratio (M‐H, Random, 95% CI) | 0.0 [0.0, 0.0] |
| 38.1 High‐income setting | 0 | 0 | Risk Ratio (M‐H, Random, 95% CI) | 0.0 [0.0, 0.0] |
| 38.2 Low‐income setting | 0 | 0 | Risk Ratio (M‐H, Random, 95% CI) | 0.0 [0.0, 0.0] |
| 39 Neurodevelopmental, cognitive or developmental outcomes assessed after age 18 months. | 0 | 0 | Risk Ratio (M‐H, Random, 95% CI) | 0.0 [0.0, 0.0] |
| 39.1 High‐income setting | 0 | 0 | Risk Ratio (M‐H, Random, 95% CI) | 0.0 [0.0, 0.0] |
| 39.2 Low‐income setting | 0 | 0 | Risk Ratio (M‐H, Random, 95% CI) | 0.0 [0.0, 0.0] |
| 40 Return to hospital as in‐ or outpatient because of bleeding (not pre‐specified) Show forest plot | 2 | 2941 | Risk Ratio (M‐H, Random, 95% CI) | 2.21 [1.29, 3.79] |
| Analysis 2.40  Comparison 2 Active versus expectant management of 3rd stage of labour (women at low risk), Outcome 40 Return to hospital as in‐ or outpatient because of bleeding (not pre‐specified). | ||||
| 40.1 High‐income setting | 2 | 2941 | Risk Ratio (M‐H, Random, 95% CI) | 2.21 [1.29, 3.79] |
| 40.2 Low‐income setting | 0 | 0 | Risk Ratio (M‐H, Random, 95% CI) | 0.0 [0.0, 0.0] |
| 41 Postnatal maternal mean Hb (outcome not pre‐specified) Show forest plot | 2 | 2683 | Mean Difference (IV, Random, 95% CI) | 0.5 [0.41, 0.59] |
| Analysis 2.41  Comparison 2 Active versus expectant management of 3rd stage of labour (women at low risk), Outcome 41 Postnatal maternal mean Hb (outcome not pre‐specified). | ||||
| 41.1 High‐income setting | 2 | 2683 | Mean Difference (IV, Random, 95% CI) | 0.5 [0.41, 0.59] |
| 41.2 Low‐income setting | 0 | 0 | Mean Difference (IV, Random, 95% CI) | 0.0 [0.0, 0.0] |
| Outcome or subgroup title | No. of studies | No. of participants | Statistical method | Effect size |
| 1 Severe primary PPH at time of birth (clinically estimated or measured blood loss ≥ 1000 mL) | 0 | 0 | Risk Ratio (M‐H, Random, 95% CI) | 0.0 [0.0, 0.0] |
| 1.1 High‐income setting | 0 | 0 | Risk Ratio (M‐H, Random, 95% CI) | 0.0 [0.0, 0.0] |
| 1.2 Low‐income setting | 0 | 0 | Risk Ratio (M‐H, Random, 95% CI) | 0.0 [0.0, 0.0] |
| 2 Very severe primary PPH at time of birth (clinically estimated or measured blood loss ≥ 2500 mL) | 0 | 0 | Risk Ratio (M‐H, Random, 95% CI) | 0.0 [0.0, 0.0] |
| 2.1 High‐income setting | 0 | 0 | Risk Ratio (M‐H, Random, 95% CI) | 0.0 [0.0, 0.0] |
| 2.2 Low‐income setting | 0 | 0 | Risk Ratio (M‐H, Random, 95% CI) | 0.0 [0.0, 0.0] |
| 3 Maternal mortality | 0 | 0 | Risk Ratio (M‐H, Random, 95% CI) | 0.0 [0.0, 0.0] |
| 3.1 High‐income setting | 0 | 0 | Risk Ratio (M‐H, Random, 95% CI) | 0.0 [0.0, 0.0] |
| 3.2 Low‐income setting | 0 | 0 | Risk Ratio (M‐H, Random, 95% CI) | 0.0 [0.0, 0.0] |
| 4 Maternal Hb < 9 g/dL at 24‐72 hr | 0 | 0 | Risk Ratio (M‐H, Random, 95% CI) | 0.0 [0.0, 0.0] |
| 4.1 High‐income setting | 0 | 0 | Risk Ratio (M‐H, Random, 95% CI) | 0.0 [0.0, 0.0] |
| 4.2 Low‐income setting | 0 | 0 | Risk Ratio (M‐H, Random, 95% CI) | 0.0 [0.0, 0.0] |
| 5 Admission to neonatal special/intensive care | 0 | 0 | Risk Ratio (M‐H, Random, 95% CI) | 0.0 [0.0, 0.0] |
| 5.1 High‐income setting | 0 | 0 | Risk Ratio (M‐H, Random, 95% CI) | 0.0 [0.0, 0.0] |
| 5.2 Low‐income setting | 0 | 0 | Risk Ratio (M‐H, Random, 95% CI) | 0.0 [0.0, 0.0] |
| 6 Neonatal jaundice requiring phototherapy or exchange transfusion | 0 | 0 | Risk Ratio (M‐H, Random, 95% CI) | 0.0 [0.0, 0.0] |
| 6.1 High‐income setting | 0 | 0 | Risk Ratio (M‐H, Random, 95% CI) | 0.0 [0.0, 0.0] |
| 6.2 Low‐income setting | 0 | 0 | Risk Ratio (M‐H, Random, 95% CI) | 0.0 [0.0, 0.0] |
| 7 Neonatal polycythaemia treated with dilutional exchange transfusion | 0 | 0 | Risk Ratio (M‐H, Random, 95% CI) | 0.0 [0.0, 0.0] |
| 7.1 High‐income setting | 0 | 0 | Risk Ratio (M‐H, Random, 95% CI) | 0.0 [0.0, 0.0] |
| 7.2 Low‐income setting | 0 | 0 | Risk Ratio (M‐H, Random, 95% CI) | 0.0 [0.0, 0.0] |
| Outcome or subgroup title | No. of studies | No. of participants | Statistical method | Effect size |
| 1 Severe primary PPH at time of birth (clinically estimated or measured blood loss ≥ 1000 mL) Show forest plot | 1 | 1648 | Risk Ratio (M‐H, Random, 95% CI) | 0.23 [0.09, 0.55] |
| Analysis 10.1  Comparison 10 Active versus mixed management (uterotonic after placental delivery, immediate cord clamping and no CCT) , Outcome 1 Severe primary PPH at time of birth (clinically estimated or measured blood loss ≥ 1000 mL). | ||||
| 1.1 High‐income setting | 1 | 1648 | Risk Ratio (M‐H, Random, 95% CI) | 0.23 [0.09, 0.55] |
| 1.2 Low‐income setting | 0 | 0 | Risk Ratio (M‐H, Random, 95% CI) | 0.0 [0.0, 0.0] |
| 2 Very severe primary PPH at time of birth (clinically estimated or measured blood loss ≥ 2500 mL) | 0 | 0 | Risk Ratio (M‐H, Random, 95% CI) | 0.0 [0.0, 0.0] |
| 2.1 High‐income setting | 0 | 0 | Risk Ratio (M‐H, Random, 95% CI) | 0.0 [0.0, 0.0] |
| 2.2 Low‐income setting | 0 | 0 | Risk Ratio (M‐H, Random, 95% CI) | 0.0 [0.0, 0.0] |
| 3 Maternal mortality | 0 | 0 | Risk Ratio (M‐H, Random, 95% CI) | 0.0 [0.0, 0.0] |
| 3.1 High‐income setting | 0 | 0 | Risk Ratio (M‐H, Random, 95% CI) | 0.0 [0.0, 0.0] |
| 3.2 Low‐income setting | 0 | 0 | Risk Ratio (M‐H, Random, 95% CI) | 0.0 [0.0, 0.0] |
| 4 Maternal Hb < 9 g/dL at 24‐72 hr | 0 | 0 | Risk Ratio (M‐H, Random, 95% CI) | 0.0 [0.0, 0.0] |
| 4.1 High‐income setting | 0 | 0 | Risk Ratio (M‐H, Random, 95% CI) | 0.0 [0.0, 0.0] |
| 4.2 Low‐income setting | 0 | 0 | Risk Ratio (M‐H, Random, 95% CI) | 0.0 [0.0, 0.0] |
| 5 Admission to neonatal special/intensive care | 0 | 0 | Risk Ratio (M‐H, Random, 95% CI) | 0.0 [0.0, 0.0] |
| 5.1 High‐income setting | 0 | 0 | Risk Ratio (M‐H, Random, 95% CI) | 0.0 [0.0, 0.0] |
| 5.2 Low‐income setting | 0 | 0 | Risk Ratio (M‐H, Random, 95% CI) | 0.0 [0.0, 0.0] |
| 6 Neonatal jaundice requiring phototherapy or exchange transfusion | 0 | 0 | Risk Ratio (M‐H, Random, 95% CI) | 0.0 [0.0, 0.0] |
| 6.1 High‐income setting | 0 | 0 | Risk Ratio (M‐H, Random, 95% CI) | 0.0 [0.0, 0.0] |
| 6.2 Low‐income setting | 0 | 0 | Risk Ratio (M‐H, Random, 95% CI) | 0.0 [0.0, 0.0] |
| 7 Neonatal polycythaemia treated with dilutional exchange transfusion | 0 | 0 | Risk Ratio (M‐H, Random, 95% CI) | 0.0 [0.0, 0.0] |
| 7.1 High‐income setting | 0 | 0 | Risk Ratio (M‐H, Random, 95% CI) | 0.0 [0.0, 0.0] |
| 7.2 Low‐income setting | 0 | 0 | Risk Ratio (M‐H, Random, 95% CI) | 0.0 [0.0, 0.0] |
| 8 Severe primary PPH after placental delivery and up to 24 hours (clinically estimated or measured blood loss ≥ 1000 mL) | 0 | 0 | Risk Ratio (M‐H, Random, 95% CI) | 0.0 [0.0, 0.0] |
| 8.1 High‐income setting | 0 | 0 | Risk Ratio (M‐H, Random, 95% CI) | 0.0 [0.0, 0.0] |
| 8.2 Low‐income setting | 0 | 0 | Risk Ratio (M‐H, Random, 95% CI) | 0.0 [0.0, 0.0] |
| 9 Severe primary PPH at time of birth and up to 24 hours (clinically estimated or measured blood loss ≥1000 mL) | 0 | 0 | Risk Ratio (M‐H, Random, 95% CI) | 0.0 [0.0, 0.0] |
| 9.1 High‐income setting | 0 | 0 | Risk Ratio (M‐H, Random, 95% CI) | 0.0 [0.0, 0.0] |
| 9.2 Low‐income setting | 0 | 0 | Risk Ratio (M‐H, Random, 95% CI) | 0.0 [0.0, 0.0] |
| 10 Primary blood loss ≥ 500 mL at time of birth (clinically estimated or measured) Show forest plot | 1 | 1648 | Risk Ratio (M‐H, Random, 95% CI) | 0.53 [0.38, 0.74] |
| Analysis 10.10  Comparison 10 Active versus mixed management (uterotonic after placental delivery, immediate cord clamping and no CCT) , Outcome 10 Primary blood loss ≥ 500 mL at time of birth (clinically estimated or measured). | ||||
| 10.1 High‐income setting | 1 | 1648 | Risk Ratio (M‐H, Random, 95% CI) | 0.53 [0.38, 0.74] |
| 10.2 Low‐income setting | 0 | 0 | Risk Ratio (M‐H, Random, 95% CI) | 0.0 [0.0, 0.0] |
| 11 Primary blood loss ≥ 500 mL after delivery of placenta and up to 24 hours (clinically estimated or measured) | 0 | 0 | Risk Ratio (M‐H, Random, 95% CI) | 0.0 [0.0, 0.0] |
| 11.1 High‐income setting | 0 | 0 | Risk Ratio (M‐H, Random, 95% CI) | 0.0 [0.0, 0.0] |
| 11.2 Low‐income setting | 0 | 0 | Risk Ratio (M‐H, Random, 95% CI) | 0.0 [0.0, 0.0] |
| 12 Primary blood loss ≥ 500 mL at time of birth and up to 24 hours (clinically estimated or measured) | 0 | 0 | Risk Ratio (M‐H, Random, 95% CI) | 0.0 [0.0, 0.0] |
| 12.1 High‐income setting | 0 | 0 | Risk Ratio (M‐H, Random, 95% CI) | 0.0 [0.0, 0.0] |
| 12.2 Low‐income setting | 0 | 0 | Risk Ratio (M‐H, Random, 95% CI) | 0.0 [0.0, 0.0] |
| 13 Mean maternal blood loss (mL) at time of birth (clinically estimated or measured) | 0 | 0 | Mean Difference (IV, Random, 95% CI) | 0.0 [0.0, 0.0] |
| 13.1 High‐income setting | 0 | 0 | Mean Difference (IV, Random, 95% CI) | 0.0 [0.0, 0.0] |
| 13.2 Low‐income setting | 0 | 0 | Mean Difference (IV, Random, 95% CI) | 0.0 [0.0, 0.0] |
| 14 Mean maternal blood loss (mL) after delivery of placenta and up to 24 hours (clinically estimated or measured) | 0 | 0 | Mean Difference (IV, Random, 95% CI) | 0.0 [0.0, 0.0] |
| 14.1 High‐income setting | 0 | 0 | Mean Difference (IV, Random, 95% CI) | 0.0 [0.0, 0.0] |
| 14.2 Low‐income setting | 0 | 0 | Mean Difference (IV, Random, 95% CI) | 0.0 [0.0, 0.0] |
| 15 Mean maternal blood loss (mL) at time of birth and up to 24 hours (clinically estimated or measured) | 0 | 0 | Mean Difference (IV, Random, 95% CI) | 0.0 [0.0, 0.0] |
| 15.1 High‐income setting | 0 | 0 | Mean Difference (IV, Random, 95% CI) | 0.0 [0.0, 0.0] |
| 15.2 Low‐income setting | 0 | 0 | Mean Difference (IV, Random, 95% CI) | 0.0 [0.0, 0.0] |
| 16 Maternal blood transfusion Show forest plot | 1 | 1648 | Risk Ratio (M‐H, Random, 95% CI) | 0.25 [0.03, 2.22] |
| Analysis 10.16  Comparison 10 Active versus mixed management (uterotonic after placental delivery, immediate cord clamping and no CCT) , Outcome 16 Maternal blood transfusion. | ||||
| 16.1 High‐income setting | 1 | 1648 | Risk Ratio (M‐H, Random, 95% CI) | 0.25 [0.03, 2.22] |
| 16.2 Low‐income setting | 0 | 0 | Risk Ratio (M‐H, Random, 95% CI) | 0.0 [0.0, 0.0] |
| 17 Clinical signs of severe blood loss Show forest plot | 1 | 1648 | Risk Ratio (M‐H, Random, 95% CI) | 0.25 [0.05, 1.17] |
| Analysis 10.17  Comparison 10 Active versus mixed management (uterotonic after placental delivery, immediate cord clamping and no CCT) , Outcome 17 Clinical signs of severe blood loss. | ||||
| 17.1 High‐income setting | 1 | 1648 | Risk Ratio (M‐H, Random, 95% CI) | 0.25 [0.05, 1.17] |
| 17.2 Low‐income setting | 0 | 0 | Risk Ratio (M‐H, Random, 95% CI) | 0.0 [0.0, 0.0] |
| 18 Therapeutic uterotonics during third stage and/or within 24 hours Show forest plot | 1 | 1648 | Risk Ratio (M‐H, Random, 95% CI) | 0.45 [0.26, 0.77] |
| Analysis 10.18  Comparison 10 Active versus mixed management (uterotonic after placental delivery, immediate cord clamping and no CCT) , Outcome 18 Therapeutic uterotonics during third stage and/or within 24 hours. | ||||
| 18.1 High‐income setting | 1 | 1648 | Risk Ratio (M‐H, Random, 95% CI) | 0.45 [0.26, 0.77] |
| 18.2 Low‐income setting | 0 | 0 | Risk Ratio (M‐H, Random, 95% CI) | 0.0 [0.0, 0.0] |
| 19 Mean length of third stage Show forest plot | 1 | 1648 | Mean Difference (IV, Random, 95% CI) | ‐10.0 [‐10.24, ‐9.76] |
| Analysis 10.19  Comparison 10 Active versus mixed management (uterotonic after placental delivery, immediate cord clamping and no CCT) , Outcome 19 Mean length of third stage. | ||||
| 19.1 High‐income setting | 1 | 1648 | Mean Difference (IV, Random, 95% CI) | ‐10.0 [‐10.24, ‐9.76] |
| 19.2 Low‐income setting | 0 | 0 | Mean Difference (IV, Random, 95% CI) | 0.0 [0.0, 0.0] |
| 20 Manual removal of placenta as defined by authors | 0 | 0 | Risk Ratio (M‐H, Random, 95% CI) | 0.0 [0.0, 0.0] |
| 20.1 High‐income setting | 0 | 0 | Risk Ratio (M‐H, Random, 95% CI) | 0.0 [0.0, 0.0] |
| 20.2 Low‐income setting | 0 | 0 | Risk Ratio (M‐H, Random, 95% CI) | 0.0 [0.0, 0.0] |
| 21 Postnatal diastolic blood pressure > 90 mmHg between birth of baby and discharge from the labour ward. | 0 | 0 | Risk Ratio (M‐H, Random, 95% CI) | 0.0 [0.0, 0.0] |
| 21.1 High‐income setting | 0 | 0 | Risk Ratio (M‐H, Random, 95% CI) | 0.0 [0.0, 0.0] |
| 21.2 Low‐income setting | 0 | 0 | Risk Ratio (M‐H, Random, 95% CI) | 0.0 [0.0, 0.0] |
| 22 Postnatal vomiting between birth of baby and discharge from the labour ward | 0 | 0 | Risk Ratio (M‐H, Random, 95% CI) | 0.0 [0.0, 0.0] |
| 22.1 High‐income setting | 0 | 0 | Risk Ratio (M‐H, Random, 95% CI) | 0.0 [0.0, 0.0] |
| 22.2 Low‐income setting | 0 | 0 | Risk Ratio (M‐H, Random, 95% CI) | 0.0 [0.0, 0.0] |
| 23 Any analgesia between birth of the baby and discharge from labour ward | 0 | 0 | Risk Ratio (M‐H, Random, 95% CI) | 0.0 [0.0, 0.0] |
| 23.1 High‐income setting | 0 | 0 | Risk Ratio (M‐H, Random, 95% CI) | 0.0 [0.0, 0.0] |
| 23.2 Low‐income setting | 0 | 0 | Risk Ratio (M‐H, Random, 95% CI) | 0.0 [0.0, 0.0] |
| 24 Women's assessment of pain during third stage as reported by authors | 0 | 0 | Risk Ratio (M‐H, Random, 95% CI) | 0.0 [0.0, 0.0] |
| 24.1 High‐income setting | 0 | 0 | Risk Ratio (M‐H, Random, 95% CI) | 0.0 [0.0, 0.0] |
| 24.2 Low‐income setting | 0 | 0 | Risk Ratio (M‐H, Random, 95% CI) | 0.0 [0.0, 0.0] |
| 25 Secondary blood loss/any vaginal bleeding needing treatment (after 24 hours and up to 6 weeks) | 0 | 0 | Risk Ratio (M‐H, Random, 95% CI) | 0.0 [0.0, 0.0] |
| 25.1 High‐income setting | 0 | 0 | Risk Ratio (M‐H, Random, 95% CI) | 0.0 [0.0, 0.0] |
| 25.2 Low‐income setting | 0 | 0 | Risk Ratio (M‐H, Random, 95% CI) | 0.0 [0.0, 0.0] |
| 26 Amount of lochia either estimated or measured after 24 hours and up to discharge from hospital | 0 | 0 | Mean Difference (IV, Random, 95% CI) | 0.0 [0.0, 0.0] |
| 26.1 High‐income setting | 0 | 0 | Mean Difference (IV, Random, 95% CI) | 0.0 [0.0, 0.0] |
| 26.2 Low‐income setting | 0 | 0 | Mean Difference (IV, Random, 95% CI) | 0.0 [0.0, 0.0] |
| 27 Surgical evacuation of retained products of conception | 0 | 0 | Risk Ratio (M‐H, Random, 95% CI) | 0.0 [0.0, 0.0] |
| 27.1 High‐income setting | 0 | 0 | Risk Ratio (M‐H, Random, 95% CI) | 0.0 [0.0, 0.0] |
| 27.2 Low‐income setting | 0 | 0 | Risk Ratio (M‐H, Random, 95% CI) | 0.0 [0.0, 0.0] |
| 28 Afterpains ‐ abdominal pain associated with the contracting uterus in the postpartum period | 0 | 0 | Risk Ratio (M‐H, Random, 95% CI) | 0.0 [0.0, 0.0] |
| 28.1 High‐income setting | 0 | 0 | Risk Ratio (M‐H, Random, 95% CI) | 0.0 [0.0, 0.0] |
| 28.2 Low‐income setting | 0 | 0 | Risk Ratio (M‐H, Random, 95% CI) | 0.0 [0.0, 0.0] |
| 29 Apgar score < 7 at 5 minutes | 0 | 0 | Risk Ratio (M‐H, Random, 95% CI) | 0.0 [0.0, 0.0] |
| 29.1 High‐income setting | 0 | 0 | Risk Ratio (M‐H, Random, 95% CI) | 0.0 [0.0, 0.0] |
| 29.2 Low‐income setting | 0 | 0 | Risk Ratio (M‐H, Random, 95% CI) | 0.0 [0.0, 0.0] |
| 30 Birthweight | 0 | 0 | Mean Difference (IV, Random, 95% CI) | 0.0 [0.0, 0.0] |
| 30.1 High‐income setting | 0 | 0 | Mean Difference (IV, Random, 95% CI) | 0.0 [0.0, 0.0] |
| 30.2 Low‐income setting | 0 | 0 | Mean Difference (IV, Random, 95% CI) | 0.0 [0.0, 0.0] |
| 31 Neonatal encephalopathy assessed using Sarnat staging (Sarnat 1976; Table 1) | 0 | 0 | Risk Ratio (M‐H, Random, 95% CI) | 0.0 [0.0, 0.0] |
| 31.1 High‐income setting | 0 | 0 | Risk Ratio (M‐H, Random, 95% CI) | 0.0 [0.0, 0.0] |
| 31.2 Low‐income setting | 0 | 0 | Risk Ratio (M‐H, Random, 95% CI) | 0.0 [0.0, 0.0] |
| 32 Neonatal mortality | 0 | 0 | Risk Ratio (M‐H, Random, 95% CI) | 0.0 [0.0, 0.0] |
| 32.1 High‐income setting | 0 | 0 | Risk Ratio (M‐H, Random, 95% CI) | 0.0 [0.0, 0.0] |
| 32.2 Low‐income setting | 0 | 0 | Risk Ratio (M‐H, Random, 95% CI) | 0.0 [0.0, 0.0] |
| 33 Intraventricular haemorrhage ‐ Papille grade III/IV ‐ (for infants born before 34 weeks' gestation only). | 0 | 0 | Risk Ratio (M‐H, Random, 95% CI) | 0.0 [0.0, 0.0] |
| 33.1 High‐income setting | 0 | 0 | Risk Ratio (M‐H, Random, 95% CI) | 0.0 [0.0, 0.0] |
| 33.2 Low‐income setting | 0 | 0 | Risk Ratio (M‐H, Random, 95% CI) | 0.0 [0.0, 0.0] |
| 34 Number of infants who received a red blood cell transfusion. | 0 | 0 | Risk Ratio (M‐H, Random, 95% CI) | 0.0 [0.0, 0.0] |
| 34.1 High‐income setting | 0 | 0 | Risk Ratio (M‐H, Random, 95% CI) | 0.0 [0.0, 0.0] |
| 34.2 Low‐income setting | 0 | 0 | Risk Ratio (M‐H, Random, 95% CI) | 0.0 [0.0, 0.0] |
| 35 Infant Hb level at 24 to 72 hours | 0 | 0 | Mean Difference (IV, Random, 95% CI) | 0.0 [0.0, 0.0] |
| 35.1 High‐income setting | 0 | 0 | Mean Difference (IV, Random, 95% CI) | 0.0 [0.0, 0.0] |
| 35.2 Low‐income setting | 0 | 0 | Mean Difference (IV, Random, 95% CI) | 0.0 [0.0, 0.0] |
| 36 Infant Hb level at 3‐6 months | 0 | 0 | Mean Difference (IV, Random, 95% CI) | 0.0 [0.0, 0.0] |
| 36.1 High‐income setting | 0 | 0 | Mean Difference (IV, Random, 95% CI) | 0.0 [0.0, 0.0] |
| 36.2 Low‐income setting | 0 | 0 | Mean Difference (IV, Random, 95% CI) | 0.0 [0.0, 0.0] |
| 37 Infant iron indices (ferritin) at 3 to 6 months. | 0 | 0 | Risk Ratio (M‐H, Random, 95% CI) | 0.0 [0.0, 0.0] |
| 37.1 High‐income setting | 0 | 0 | Risk Ratio (M‐H, Random, 95% CI) | 0.0 [0.0, 0.0] |
| 37.2 Low‐income setting | 0 | 0 | Risk Ratio (M‐H, Random, 95% CI) | 0.0 [0.0, 0.0] |
| 38 Exclusive breastfeeding at discharge from hospital | 0 | 0 | Risk Ratio (M‐H, Random, 95% CI) | 0.0 [0.0, 0.0] |
| 38.1 High‐income setting | 0 | 0 | Risk Ratio (M‐H, Random, 95% CI) | 0.0 [0.0, 0.0] |
| 38.2 Low‐income setting | 0 | 0 | Risk Ratio (M‐H, Random, 95% CI) | 0.0 [0.0, 0.0] |
| 39 Neurodevelopmental, cognitive or developmental outcomes assessed after age 18 months. | 0 | 0 | Risk Ratio (M‐H, Random, 95% CI) | 0.0 [0.0, 0.0] |
| 39.1 High‐income setting | 0 | 0 | Risk Ratio (M‐H, Random, 95% CI) | 0.0 [0.0, 0.0] |
| 39.2 Low‐income setting | 0 | 0 | Risk Ratio (M‐H, Random, 95% CI) | 0.0 [0.0, 0.0] |
| 40 Return to hospital as in‐ or outpatient because of bleeding (not pre‐specified) | 0 | 0 | Risk Ratio (M‐H, Random, 95% CI) | 0.0 [0.0, 0.0] |
| 40.1 High‐income setting | 0 | 0 | Risk Ratio (M‐H, Random, 95% CI) | 0.0 [0.0, 0.0] |
| 40.2 Low‐income setting | 0 | 0 | Risk Ratio (M‐H, Random, 95% CI) | 0.0 [0.0, 0.0] |
| 41 Postnatal maternal mean Hb (outcome not pre‐specified) | 0 | 0 | Mean Difference (IV, Random, 95% CI) | 0.0 [0.0, 0.0] |
| 41.1 High‐income setting | 0 | 0 | Mean Difference (IV, Random, 95% CI) | 0.0 [0.0, 0.0] |
| 41.2 Low‐income setting | 0 | 0 | Mean Difference (IV, Random, 95% CI) | 0.0 [0.0, 0.0] |
| Outcome or subgroup title | No. of studies | No. of participants | Statistical method | Effect size |
| 1 Severe primary PPH at time of birth (clinically estimated or measured blood loss ≥ 1000 mL) Show forest plot | 1 | 1621 | Risk Ratio (M‐H, Random, 95% CI) | 0.78 [0.48, 1.24] |
| Analysis 11.1  Comparison 11 Active versus mixed management (no routine uterotonic, early cord clamping, no CCT), Outcome 1 Severe primary PPH at time of birth (clinically estimated or measured blood loss ≥ 1000 mL). | ||||
| 1.1 High‐income setting | 1 | 1621 | Risk Ratio (M‐H, Random, 95% CI) | 0.78 [0.48, 1.24] |
| 1.2 Low‐income setting | 0 | 0 | Risk Ratio (M‐H, Random, 95% CI) | 0.0 [0.0, 0.0] |
| 2 Very severe primary PPH at time of birth (clinically estimated or measured blood loss ≥ 2500 mL) | 0 | 0 | Risk Ratio (M‐H, Random, 95% CI) | 0.0 [0.0, 0.0] |
| 2.1 High‐income setting | 0 | 0 | Risk Ratio (M‐H, Random, 95% CI) | 0.0 [0.0, 0.0] |
| 2.2 Low‐income setting | 0 | 0 | Risk Ratio (M‐H, Random, 95% CI) | 0.0 [0.0, 0.0] |
| 3 Maternal mortality | 0 | 0 | Risk Ratio (M‐H, Random, 95% CI) | 0.0 [0.0, 0.0] |
| 3.1 High‐income setting | 0 | 0 | Risk Ratio (M‐H, Random, 95% CI) | 0.0 [0.0, 0.0] |
| 3.2 Low‐income setting | 0 | 0 | Risk Ratio (M‐H, Random, 95% CI) | 0.0 [0.0, 0.0] |
| 4 Maternal Hb < 9 g/dL at 24‐72 hr Show forest plot | 1 | 1631 | Risk Ratio (M‐H, Random, 95% CI) | 1.23 [0.75, 2.01] |
| Analysis 11.4  Comparison 11 Active versus mixed management (no routine uterotonic, early cord clamping, no CCT), Outcome 4 Maternal Hb < 9 g/dL at 24‐72 hr. | ||||
| 4.1 High‐income setting | 1 | 1631 | Risk Ratio (M‐H, Random, 95% CI) | 1.23 [0.75, 2.01] |
| 4.2 Low‐income setting | 0 | 0 | Risk Ratio (M‐H, Random, 95% CI) | 0.0 [0.0, 0.0] |
| 5 Admission to neonatal special/intensive care | 0 | 0 | Risk Ratio (M‐H, Random, 95% CI) | 0.0 [0.0, 0.0] |
| 5.1 High‐income setting | 0 | 0 | Risk Ratio (M‐H, Random, 95% CI) | 0.0 [0.0, 0.0] |
| 5.2 Low‐income setting | 0 | 0 | Risk Ratio (M‐H, Random, 95% CI) | 0.0 [0.0, 0.0] |
| 6 Neonatal jaundice requiring phototherapy or exchange transfusion | 0 | 0 | Risk Ratio (M‐H, Random, 95% CI) | 0.0 [0.0, 0.0] |
| 6.1 High‐income setting | 0 | 0 | Risk Ratio (M‐H, Random, 95% CI) | 0.0 [0.0, 0.0] |
| 6.2 Low‐income setting | 0 | 0 | Risk Ratio (M‐H, Random, 95% CI) | 0.0 [0.0, 0.0] |
| 7 Neonatal polycythaemia treated with dilutional exchange transfusion | 0 | 0 | Risk Ratio (M‐H, Random, 95% CI) | 0.0 [0.0, 0.0] |
| 7.1 High‐income setting | 0 | 0 | Risk Ratio (M‐H, Random, 95% CI) | 0.0 [0.0, 0.0] |
| 7.2 Low‐income setting | 0 | 0 | Risk Ratio (M‐H, Random, 95% CI) | 0.0 [0.0, 0.0] |
| 8 Severe primary PPH after placental delivery and up to 24 hours (clinically estimated or measured blood loss ≥ 1000 mL) | 0 | 0 | Risk Ratio (M‐H, Random, 95% CI) | 0.0 [0.0, 0.0] |
| 8.1 High‐income setting | 0 | 0 | Risk Ratio (M‐H, Random, 95% CI) | 0.0 [0.0, 0.0] |
| 8.2 Low‐income setting | 0 | 0 | Risk Ratio (M‐H, Random, 95% CI) | 0.0 [0.0, 0.0] |
| 9 Severe primary PPH at time of birth and up to 24 hours (clinically estimated or measured blood loss ≥1000 mL) | 0 | 0 | Risk Ratio (M‐H, Random, 95% CI) | 0.0 [0.0, 0.0] |
| 9.1 High‐income setting | 0 | 0 | Risk Ratio (M‐H, Random, 95% CI) | 0.0 [0.0, 0.0] |
| 9.2 Low‐income setting | 0 | 0 | Risk Ratio (M‐H, Random, 95% CI) | 0.0 [0.0, 0.0] |
| 10 Primary blood loss ≥ 500 mL at time of birth (clinically estimated or measured) Show forest plot | 1 | 1621 | Risk Ratio (M‐H, Random, 95% CI) | 0.51 [0.40, 0.66] |
| Analysis 11.10  Comparison 11 Active versus mixed management (no routine uterotonic, early cord clamping, no CCT), Outcome 10 Primary blood loss ≥ 500 mL at time of birth (clinically estimated or measured). | ||||
| 10.1 High‐income setting | 1 | 1621 | Risk Ratio (M‐H, Random, 95% CI) | 0.51 [0.40, 0.66] |
| 10.2 Low‐income setting | 0 | 0 | Risk Ratio (M‐H, Random, 95% CI) | 0.0 [0.0, 0.0] |
| 11 Primary blood loss ≥ 500 mL after delivery of placenta and up to 24 hours (clinically estimated or measured) | 0 | 0 | Risk Ratio (M‐H, Random, 95% CI) | 0.0 [0.0, 0.0] |
| 11.1 High‐income setting | 0 | 0 | Risk Ratio (M‐H, Random, 95% CI) | 0.0 [0.0, 0.0] |
| 11.2 Low‐income setting | 0 | 0 | Risk Ratio (M‐H, Random, 95% CI) | 0.0 [0.0, 0.0] |
| 12 Primary blood loss ≥ 500 mL at time of birth and up to 24 hours (clinically estimated or measured) | 0 | 0 | Risk Ratio (M‐H, Random, 95% CI) | 0.0 [0.0, 0.0] |
| 12.1 High‐income setting | 0 | 0 | Risk Ratio (M‐H, Random, 95% CI) | 0.0 [0.0, 0.0] |
| 12.2 Low‐income setting | 0 | 0 | Risk Ratio (M‐H, Random, 95% CI) | 0.0 [0.0, 0.0] |
| 13 Mean maternal blood loss (mL) at time of birth (clinically estimated or measured) Show forest plot | 1 | 1621 | Mean Difference (IV, Random, 95% CI) | ‐94.0 [‐126.57, ‐61.43] |
| Analysis 11.13  Comparison 11 Active versus mixed management (no routine uterotonic, early cord clamping, no CCT), Outcome 13 Mean maternal blood loss (mL) at time of birth (clinically estimated or measured). | ||||
| 13.1 High‐income setting | 1 | 1621 | Mean Difference (IV, Random, 95% CI) | ‐94.0 [‐126.57, ‐61.43] |
| 13.2 Low‐income setting | 0 | 0 | Mean Difference (IV, Random, 95% CI) | 0.0 [0.0, 0.0] |
| 14 Mean maternal blood loss (mL) after delivery of placenta and up to 24 hours (clinically estimated or measured) | 0 | 0 | Mean Difference (IV, Random, 95% CI) | 0.0 [0.0, 0.0] |
| 14.1 High‐income setting | 0 | 0 | Mean Difference (IV, Random, 95% CI) | 0.0 [0.0, 0.0] |
| 14.2 Low‐income setting | 0 | 0 | Mean Difference (IV, Random, 95% CI) | 0.0 [0.0, 0.0] |
| 15 Mean maternal blood loss (mL) at time of birth and up to 24 hours (clinically estimated or measured) | 0 | 0 | Mean Difference (IV, Random, 95% CI) | 0.0 [0.0, 0.0] |
| 15.1 High‐income setting | 0 | 0 | Mean Difference (IV, Random, 95% CI) | 0.0 [0.0, 0.0] |
| 15.2 Low‐income setting | 0 | 0 | Mean Difference (IV, Random, 95% CI) | 0.0 [0.0, 0.0] |
| 16 Maternal blood transfusion Show forest plot | 1 | 1631 | Risk Ratio (M‐H, Random, 95% CI) | 0.79 [0.43, 1.46] |
| Analysis 11.16  Comparison 11 Active versus mixed management (no routine uterotonic, early cord clamping, no CCT), Outcome 16 Maternal blood transfusion. | ||||
| 16.1 High‐income setting | 1 | 1631 | Risk Ratio (M‐H, Random, 95% CI) | 0.79 [0.43, 1.46] |
| 16.2 Low‐income setting | 0 | 0 | Risk Ratio (M‐H, Random, 95% CI) | 0.0 [0.0, 0.0] |
| 17 Clinical signs of severe blood loss | 0 | 0 | Risk Ratio (M‐H, Random, 95% CI) | 0.0 [0.0, 0.0] |
| 17.1 High‐income setting | 0 | 0 | Risk Ratio (M‐H, Random, 95% CI) | 0.0 [0.0, 0.0] |
| 17.2 Low‐income setting | 0 | 0 | Risk Ratio (M‐H, Random, 95% CI) | 0.0 [0.0, 0.0] |
| 18 Therapeutic uterotonics during third stage and/or within 24 hours Show forest plot | 1 | 1631 | Risk Ratio (M‐H, Random, 95% CI) | 0.39 [0.33, 0.48] |
| Analysis 11.18  Comparison 11 Active versus mixed management (no routine uterotonic, early cord clamping, no CCT), Outcome 18 Therapeutic uterotonics during third stage and/or within 24 hours. | ||||
| 18.1 High‐income setting | 1 | 1631 | Risk Ratio (M‐H, Random, 95% CI) | 0.39 [0.33, 0.48] |
| 18.2 Low‐income setting | 0 | 0 | Risk Ratio (M‐H, Random, 95% CI) | 0.0 [0.0, 0.0] |
| 19 Mean length of third stage Show forest plot | 1 | 1631 | Mean Difference (IV, Random, 95% CI) | ‐1.60 [‐3.08, ‐0.12] |
| Analysis 11.19  Comparison 11 Active versus mixed management (no routine uterotonic, early cord clamping, no CCT), Outcome 19 Mean length of third stage. | ||||
| 19.1 High‐income setting | 1 | 1631 | Mean Difference (IV, Random, 95% CI) | ‐1.60 [‐3.08, ‐0.12] |
| 19.2 Low‐income setting | 0 | 0 | Mean Difference (IV, Random, 95% CI) | 0.0 [0.0, 0.0] |
| 20 Manual removal of placenta as defined by authors Show forest plot | 1 | 1631 | Risk Ratio (M‐H, Random, 95% CI) | 1.25 [0.71, 2.21] |
| Analysis 11.20  Comparison 11 Active versus mixed management (no routine uterotonic, early cord clamping, no CCT), Outcome 20 Manual removal of placenta as defined by authors. | ||||
| 20.1 High‐income setting | 1 | 1631 | Risk Ratio (M‐H, Random, 95% CI) | 1.25 [0.71, 2.21] |
| 20.2 Low‐income setting | 0 | 0 | Risk Ratio (M‐H, Random, 95% CI) | 0.0 [0.0, 0.0] |
| 21 Postnatal diastolic blood pressure > 90 mmHg between birth of baby and discharge from the labour ward. | 0 | 0 | Risk Ratio (M‐H, Random, 95% CI) | 0.0 [0.0, 0.0] |
| 21.1 High‐income setting | 0 | 0 | Risk Ratio (M‐H, Random, 95% CI) | 0.0 [0.0, 0.0] |
| 21.2 Low‐income setting | 0 | 0 | Risk Ratio (M‐H, Random, 95% CI) | 0.0 [0.0, 0.0] |
| 22 Postnatal vomiting between birth of baby and discharge from the labour ward | 0 | 0 | Risk Ratio (M‐H, Random, 95% CI) | 0.0 [0.0, 0.0] |
| 22.1 High‐income setting | 0 | 0 | Risk Ratio (M‐H, Random, 95% CI) | 0.0 [0.0, 0.0] |
| 22.2 Low‐income setting | 0 | 0 | Risk Ratio (M‐H, Random, 95% CI) | 0.0 [0.0, 0.0] |
| 23 Any analgesia between birth of the baby and discharge from labour ward | 0 | 0 | Risk Ratio (M‐H, Random, 95% CI) | 0.0 [0.0, 0.0] |
| 23.1 High‐income setting | 0 | 0 | Risk Ratio (M‐H, Random, 95% CI) | 0.0 [0.0, 0.0] |
| 23.2 Low‐income setting | 0 | 0 | Risk Ratio (M‐H, Random, 95% CI) | 0.0 [0.0, 0.0] |
| 24 Women's assessment of pain during third stage as reported by authors | 0 | 0 | Risk Ratio (M‐H, Random, 95% CI) | 0.0 [0.0, 0.0] |
| 24.1 High‐income setting | 0 | 0 | Risk Ratio (M‐H, Random, 95% CI) | 0.0 [0.0, 0.0] |
| 24.2 Low‐income setting | 0 | 0 | Risk Ratio (M‐H, Random, 95% CI) | 0.0 [0.0, 0.0] |
| 25 Secondary blood loss/any vaginal bleeding needing treatment (after 24 hours and up to 6 weeks) | 0 | 0 | Risk Ratio (M‐H, Random, 95% CI) | 0.0 [0.0, 0.0] |
| 25.1 High‐income setting | 0 | 0 | Risk Ratio (M‐H, Random, 95% CI) | 0.0 [0.0, 0.0] |
| 25.2 Low‐income setting | 0 | 0 | Risk Ratio (M‐H, Random, 95% CI) | 0.0 [0.0, 0.0] |
| 26 Amount of lochia either estimated or measured after 24 hours and up to discharge from hospital | 0 | 0 | Mean Difference (IV, Random, 95% CI) | 0.0 [0.0, 0.0] |
| 26.1 High‐income setting | 0 | 0 | Mean Difference (IV, Random, 95% CI) | 0.0 [0.0, 0.0] |
| 26.2 Low‐income setting | 0 | 0 | Mean Difference (IV, Random, 95% CI) | 0.0 [0.0, 0.0] |
| 27 Surgical evacuation of retained products of conception | 0 | 0 | Risk Ratio (M‐H, Random, 95% CI) | 0.0 [0.0, 0.0] |
| 27.1 High‐income setting | 0 | 0 | Risk Ratio (M‐H, Random, 95% CI) | 0.0 [0.0, 0.0] |
| 27.2 Low‐income setting | 0 | 0 | Risk Ratio (M‐H, Random, 95% CI) | 0.0 [0.0, 0.0] |
| 28 Not prespecified: afterpains at 2 hours after birth (id 20458) Show forest plot | 1 | 1425 | Mean Difference (IV, Fixed, 95% CI) | ‐2.80 [‐4.62, ‐0.98] |
| Analysis 11.28  Comparison 11 Active versus mixed management (no routine uterotonic, early cord clamping, no CCT), Outcome 28 Not prespecified: afterpains at 2 hours after birth (id 20458). | ||||
| 28.1 High‐income setting | 1 | 1425 | Mean Difference (IV, Fixed, 95% CI) | ‐2.80 [‐4.62, ‐0.98] |
| 28.2 Low‐income setting | 0 | 0 | Mean Difference (IV, Fixed, 95% CI) | 0.0 [0.0, 0.0] |
| 29 Not pre‐specified: afterpains the day after birth (id 20458) Show forest plot | 1 | 1336 | Mean Difference (IV, Fixed, 95% CI) | ‐3.0 [‐5.33, ‐0.67] |
| Analysis 11.29  Comparison 11 Active versus mixed management (no routine uterotonic, early cord clamping, no CCT), Outcome 29 Not pre‐specified: afterpains the day after birth (id 20458). | ||||
| 29.1 High‐income setting | 1 | 1336 | Mean Difference (IV, Fixed, 95% CI) | ‐3.0 [‐5.33, ‐0.67] |
| 29.2 Low‐income setting | 0 | 0 | Mean Difference (IV, Fixed, 95% CI) | 0.0 [0.0, 0.0] |
| 30 Apgar score < 7 at 5 minutes | 0 | 0 | Risk Ratio (M‐H, Random, 95% CI) | 0.0 [0.0, 0.0] |
| 30.1 High‐income setting | 0 | 0 | Risk Ratio (M‐H, Random, 95% CI) | 0.0 [0.0, 0.0] |
| 30.2 Low‐income setting | 0 | 0 | Risk Ratio (M‐H, Random, 95% CI) | 0.0 [0.0, 0.0] |
| 31 Birthweight Show forest plot | 1 | 1631 | Mean Difference (IV, Random, 95% CI) | 15.0 [‐28.88, 58.88] |
| Analysis 11.31  Comparison 11 Active versus mixed management (no routine uterotonic, early cord clamping, no CCT), Outcome 31 Birthweight. | ||||
| 31.1 High‐income setting | 1 | 1631 | Mean Difference (IV, Random, 95% CI) | 15.0 [‐28.88, 58.88] |
| 31.2 Low‐income setting | 0 | 0 | Mean Difference (IV, Random, 95% CI) | 0.0 [0.0, 0.0] |
| 32 Neonatal encephalopathy assessed using Sarnat staging (Sarnat 1976; Table 1) | 0 | 0 | Risk Ratio (M‐H, Random, 95% CI) | 0.0 [0.0, 0.0] |
| 32.1 High‐income setting | 0 | 0 | Risk Ratio (M‐H, Random, 95% CI) | 0.0 [0.0, 0.0] |
| 32.2 Low‐income setting | 0 | 0 | Risk Ratio (M‐H, Random, 95% CI) | 0.0 [0.0, 0.0] |
| 33 Neonatal mortality | 0 | 0 | Risk Ratio (M‐H, Random, 95% CI) | 0.0 [0.0, 0.0] |
| 33.1 High‐income setting | 0 | 0 | Risk Ratio (M‐H, Random, 95% CI) | 0.0 [0.0, 0.0] |
| 33.2 Low‐income setting | 0 | 0 | Risk Ratio (M‐H, Random, 95% CI) | 0.0 [0.0, 0.0] |
| 34 Intraventricular haemorrhage ‐ Papille grade III/IV ‐ (for infants born before 34 weeks' gestation only). | 0 | 0 | Risk Ratio (M‐H, Random, 95% CI) | 0.0 [0.0, 0.0] |
| 34.1 High‐income setting | 0 | 0 | Risk Ratio (M‐H, Random, 95% CI) | 0.0 [0.0, 0.0] |
| 34.2 Low‐income setting | 0 | 0 | Risk Ratio (M‐H, Random, 95% CI) | 0.0 [0.0, 0.0] |
| 35 Number of infants who received a red blood cell transfusion. | 0 | 0 | Risk Ratio (M‐H, Random, 95% CI) | 0.0 [0.0, 0.0] |
| 35.1 High‐income setting | 0 | 0 | Risk Ratio (M‐H, Random, 95% CI) | 0.0 [0.0, 0.0] |
| 35.2 Low‐income setting | 0 | 0 | Risk Ratio (M‐H, Random, 95% CI) | 0.0 [0.0, 0.0] |
| 36 Infant Hb level at 24 to 72 hours | 0 | 0 | Mean Difference (IV, Random, 95% CI) | 0.0 [0.0, 0.0] |
| 36.1 High‐income setting | 0 | 0 | Mean Difference (IV, Random, 95% CI) | 0.0 [0.0, 0.0] |
| 36.2 Low‐income setting | 0 | 0 | Mean Difference (IV, Random, 95% CI) | 0.0 [0.0, 0.0] |
| 37 Infant Hb level at 3‐6 months | 0 | 0 | Mean Difference (IV, Random, 95% CI) | 0.0 [0.0, 0.0] |
| 37.1 High‐income setting | 0 | 0 | Mean Difference (IV, Random, 95% CI) | 0.0 [0.0, 0.0] |
| 37.2 Low‐income setting | 0 | 0 | Mean Difference (IV, Random, 95% CI) | 0.0 [0.0, 0.0] |
| 38 Infant iron indices (ferritin) at 3 to 6 months. | 0 | 0 | Risk Ratio (M‐H, Random, 95% CI) | 0.0 [0.0, 0.0] |
| 38.1 High‐income setting | 0 | 0 | Risk Ratio (M‐H, Random, 95% CI) | 0.0 [0.0, 0.0] |
| 38.2 Low‐income setting | 0 | 0 | Risk Ratio (M‐H, Random, 95% CI) | 0.0 [0.0, 0.0] |
| 39 Exclusive breastfeeding at discharge from hospital | 0 | 0 | Risk Ratio (M‐H, Random, 95% CI) | 0.0 [0.0, 0.0] |
| 39.1 High‐income setting | 0 | 0 | Risk Ratio (M‐H, Random, 95% CI) | 0.0 [0.0, 0.0] |
| 39.2 Low‐income setting | 0 | 0 | Risk Ratio (M‐H, Random, 95% CI) | 0.0 [0.0, 0.0] |
| 40 Neurodevelopmental, cognitive or developmental outcomes assessed after age 18 months. | 0 | 0 | Risk Ratio (M‐H, Random, 95% CI) | 0.0 [0.0, 0.0] |
| 40.1 High‐income setting | 0 | 0 | Risk Ratio (M‐H, Random, 95% CI) | 0.0 [0.0, 0.0] |
| 40.2 Low‐income setting | 0 | 0 | Risk Ratio (M‐H, Random, 95% CI) | 0.0 [0.0, 0.0] |
| 41 Return to hospital as in‐ or outpatient because of bleeding (not pre‐specified) | 0 | 0 | Risk Ratio (M‐H, Random, 95% CI) | 0.0 [0.0, 0.0] |
| 42 Postnatal maternal mean Hb (outcome not pre‐specified) Show forest plot | 1 | 1631 | Mean Difference (IV, Random, 95% CI) | 0.28 [0.14, 0.42] |
| Analysis 11.42  Comparison 11 Active versus mixed management (no routine uterotonic, early cord clamping, no CCT), Outcome 42 Postnatal maternal mean Hb (outcome not pre‐specified). | ||||
| 42.1 High‐income setting | 1 | 1631 | Mean Difference (IV, Random, 95% CI) | 0.28 [0.14, 0.42] |
| 42.2 Low‐income setting | 0 | 0 | Mean Difference (IV, Random, 95% CI) | 0.0 [0.0, 0.0] |
| 43 Severe primary PPH after placental delivery and up to 2 hours (clinically estimated or measured blood loss ≥ 1000 mL) ‐ not pre‐specified Show forest plot | 1 | 1621 | Risk Ratio (M‐H, Random, 95% CI) | 0.54 [0.39, 0.74] |
| Analysis 11.43  Comparison 11 Active versus mixed management (no routine uterotonic, early cord clamping, no CCT), Outcome 43 Severe primary PPH after placental delivery and up to 2 hours (clinically estimated or measured blood loss ≥ 1000 mL) ‐ not pre‐specified. | ||||
| 43.1 High‐income setting | 1 | 1621 | Risk Ratio (M‐H, Random, 95% CI) | 0.54 [0.39, 0.74] |
| 43.2 Low‐income setting | 0 | 0 | Risk Ratio (M‐H, Random, 95% CI) | 0.0 [0.0, 0.0] |
| 44 Severe primary PPH at time of birth and up to 2 hours (clinically estimated or measured blood loss ≥1000 mL) ‐ not pre‐specified Show forest plot | 1 | 1621 | Risk Ratio (M‐H, Random, 95% CI) | 0.60 [0.47, 0.78] |
| Analysis 11.44  Comparison 11 Active versus mixed management (no routine uterotonic, early cord clamping, no CCT), Outcome 44 Severe primary PPH at time of birth and up to 2 hours (clinically estimated or measured blood loss ≥1000 mL) ‐ not pre‐specified. | ||||
| 44.1 High‐income setting | 1 | 1621 | Risk Ratio (M‐H, Random, 95% CI) | 0.60 [0.47, 0.78] |
| 44.2 Low‐income setting | 0 | 0 | Risk Ratio (M‐H, Random, 95% CI) | 0.0 [0.0, 0.0] |
| 45 Mean blood loss (mL) (clinically estimated or measured at birth and up to 2 hours (not pre‐specified) Show forest plot | 1 | 1621 | Mean Difference (IV, Random, 95% CI) | ‐49.0 [‐75.52, ‐22.48] |
| Analysis 11.45  Comparison 11 Active versus mixed management (no routine uterotonic, early cord clamping, no CCT), Outcome 45 Mean blood loss (mL) (clinically estimated or measured at birth and up to 2 hours (not pre‐specified). | ||||
| 45.1 High‐income setting | 1 | 1621 | Mean Difference (IV, Random, 95% CI) | ‐49.0 [‐75.52, ‐22.48] |
| 45.2 Low‐income setting | 0 | 0 | Mean Difference (IV, Random, 95% CI) | 0.0 [0.0, 0.0] |
| Outcome or subgroup title | No. of studies | No. of participants | Statistical method | Effect size |
| 1 Severe primary PPH at time of birth (clinically estimated or measured blood loss ≥ 1000 mL) | 0 | 0 | Risk Ratio (M‐H, Random, 95% CI) | 0.0 [0.0, 0.0] |
| 1.1 High‐income setting | 0 | 0 | Risk Ratio (M‐H, Random, 95% CI) | 0.0 [0.0, 0.0] |
| 1.2 Low‐income setting | 0 | 0 | Risk Ratio (M‐H, Random, 95% CI) | 0.0 [0.0, 0.0] |
| 2 Very severe primary PPH at time of birth (clinically estimated or measured blood loss ≥ 2500 mL) | 0 | 0 | Risk Ratio (M‐H, Random, 95% CI) | 0.0 [0.0, 0.0] |
| 2.1 High‐income setting | 0 | 0 | Risk Ratio (M‐H, Random, 95% CI) | 0.0 [0.0, 0.0] |
| 2.2 Low‐income setting | 0 | 0 | Risk Ratio (M‐H, Random, 95% CI) | 0.0 [0.0, 0.0] |
| 3 Maternal mortality | 0 | 0 | Risk Ratio (M‐H, Random, 95% CI) | 0.0 [0.0, 0.0] |
| 3.1 High‐income setting | 0 | 0 | Risk Ratio (M‐H, Random, 95% CI) | 0.0 [0.0, 0.0] |
| 3.2 Low‐income setting | 0 | 0 | Risk Ratio (M‐H, Random, 95% CI) | 0.0 [0.0, 0.0] |
| 4 Maternal Hb < 9 g/dL at 24‐72 hr Show forest plot | 1 | 130 | Risk Ratio (M‐H, Random, 95% CI) | 0.8 [0.34, 1.90] |
| Analysis 12.4  Comparison 12 Active versus mixed management (no routine uterotonic, early cord clamping, CCT), Outcome 4 Maternal Hb < 9 g/dL at 24‐72 hr. | ||||
| 4.1 High‐income setting | 0 | 0 | Risk Ratio (M‐H, Random, 95% CI) | 0.0 [0.0, 0.0] |
| 4.2 Low‐income setting | 1 | 130 | Risk Ratio (M‐H, Random, 95% CI) | 0.8 [0.34, 1.90] |
| 5 Admission to neonatal special/intensive care | 0 | 0 | Risk Ratio (M‐H, Random, 95% CI) | 0.0 [0.0, 0.0] |
| 5.1 High‐income setting | 0 | 0 | Risk Ratio (M‐H, Random, 95% CI) | 0.0 [0.0, 0.0] |
| 5.2 Low‐income setting | 0 | 0 | Risk Ratio (M‐H, Random, 95% CI) | 0.0 [0.0, 0.0] |
| 6 Neonatal jaundice requiring phototherapy or exchange transfusion | 0 | 0 | Risk Ratio (M‐H, Random, 95% CI) | 0.0 [0.0, 0.0] |
| 6.1 High‐income setting | 0 | 0 | Risk Ratio (M‐H, Random, 95% CI) | 0.0 [0.0, 0.0] |
| 6.2 Low‐income setting | 0 | 0 | Risk Ratio (M‐H, Random, 95% CI) | 0.0 [0.0, 0.0] |
| 7 Neonatal polycythaemia treated with dilutional exchange transfusion | 0 | 0 | Risk Ratio (M‐H, Random, 95% CI) | 0.0 [0.0, 0.0] |
| 7.1 High‐income setting | 0 | 0 | Risk Ratio (M‐H, Random, 95% CI) | 0.0 [0.0, 0.0] |
| 7.2 Low‐income setting | 0 | 0 | Risk Ratio (M‐H, Random, 95% CI) | 0.0 [0.0, 0.0] |
| 8 Severe primary PPH after placental delivery and up to 24 hours (clinically estimated or measured blood loss ≥ 1000 mL) | 0 | 0 | Risk Ratio (M‐H, Random, 95% CI) | 0.0 [0.0, 0.0] |
| 8.1 High‐income setting | 0 | 0 | Risk Ratio (M‐H, Random, 95% CI) | 0.0 [0.0, 0.0] |
| 8.2 Low‐income setting | 0 | 0 | Risk Ratio (M‐H, Random, 95% CI) | 0.0 [0.0, 0.0] |
| 9 Severe primary PPH at time of birth and up to 24 hours (clinically estimated or measured blood loss ≥1000 mL) | 0 | 0 | Risk Ratio (M‐H, Random, 95% CI) | 0.0 [0.0, 0.0] |
| 9.1 High‐income setting | 0 | 0 | Risk Ratio (M‐H, Random, 95% CI) | 0.0 [0.0, 0.0] |
| 9.2 Low‐income setting | 0 | 0 | Risk Ratio (M‐H, Random, 95% CI) | 0.0 [0.0, 0.0] |
| 10 Primary blood loss ≥ 500 mL at time of birth (clinically estimated or measured) | 0 | 0 | Risk Ratio (M‐H, Random, 95% CI) | 0.0 [0.0, 0.0] |
| 10.1 High‐income setting | 0 | 0 | Risk Ratio (M‐H, Random, 95% CI) | 0.0 [0.0, 0.0] |
| 10.2 Low‐income setting | 0 | 0 | Risk Ratio (M‐H, Random, 95% CI) | 0.0 [0.0, 0.0] |
| 11 Primary blood loss ≥ 500 mL after delivery of placenta and up to 24 hours (clinically estimated or measured) | 0 | 0 | Risk Ratio (M‐H, Random, 95% CI) | 0.0 [0.0, 0.0] |
| 11.1 High‐income setting | 0 | 0 | Risk Ratio (M‐H, Random, 95% CI) | 0.0 [0.0, 0.0] |
| 11.2 Low‐income setting | 0 | 0 | Risk Ratio (M‐H, Random, 95% CI) | 0.0 [0.0, 0.0] |
| 12 Primary blood loss ≥ 500 mL at time of birth and up to 24 hours (clinically estimated or measured) | 0 | 0 | Risk Ratio (M‐H, Random, 95% CI) | 0.0 [0.0, 0.0] |
| 12.1 High‐income setting | 0 | 0 | Risk Ratio (M‐H, Random, 95% CI) | 0.0 [0.0, 0.0] |
| 12.2 Low‐income setting | 0 | 0 | Risk Ratio (M‐H, Random, 95% CI) | 0.0 [0.0, 0.0] |
| 13 Mean maternal blood loss (mL) at time of birth (clinically estimated or measured) | 0 | 0 | Mean Difference (IV, Random, 95% CI) | 0.0 [0.0, 0.0] |
| 13.1 High‐income setting | 0 | 0 | Mean Difference (IV, Random, 95% CI) | 0.0 [0.0, 0.0] |
| 13.2 Low‐income setting | 0 | 0 | Mean Difference (IV, Random, 95% CI) | 0.0 [0.0, 0.0] |
| 14 Mean maternal blood loss (mL) after delivery of placenta and up to 24 hours (clinically estimated or measured) | 0 | 0 | Mean Difference (IV, Random, 95% CI) | 0.0 [0.0, 0.0] |
| 14.1 High‐income setting | 0 | 0 | Mean Difference (IV, Random, 95% CI) | 0.0 [0.0, 0.0] |
| 14.2 Low‐income setting | 0 | 0 | Mean Difference (IV, Random, 95% CI) | 0.0 [0.0, 0.0] |
| 15 Mean maternal blood loss (mL) at time of birth and up to 24 hours (clinically estimated or measured) | 0 | 0 | Mean Difference (IV, Random, 95% CI) | 0.0 [0.0, 0.0] |
| 15.1 High‐income setting | 0 | 0 | Mean Difference (IV, Random, 95% CI) | 0.0 [0.0, 0.0] |
| 15.2 Low‐income setting | 0 | 0 | Mean Difference (IV, Random, 95% CI) | 0.0 [0.0, 0.0] |
| 16 Maternal blood transfusion | 0 | 0 | Risk Ratio (M‐H, Random, 95% CI) | 0.0 [0.0, 0.0] |
| 16.1 High‐income setting | 0 | 0 | Risk Ratio (M‐H, Random, 95% CI) | 0.0 [0.0, 0.0] |
| 16.2 Low‐income setting | 0 | 0 | Risk Ratio (M‐H, Random, 95% CI) | 0.0 [0.0, 0.0] |
| 17 Clinical signs of severe blood loss | 0 | 0 | Risk Ratio (M‐H, Random, 95% CI) | 0.0 [0.0, 0.0] |
| 17.1 High‐income setting | 0 | 0 | Risk Ratio (M‐H, Random, 95% CI) | 0.0 [0.0, 0.0] |
| 17.2 Low‐income setting | 0 | 0 | Risk Ratio (M‐H, Random, 95% CI) | 0.0 [0.0, 0.0] |
| 18 Therapeutic uterotonics during third stage and/or within 24 hours | 0 | 0 | Risk Ratio (M‐H, Random, 95% CI) | 0.0 [0.0, 0.0] |
| 18.1 High‐income setting | 0 | 0 | Risk Ratio (M‐H, Random, 95% CI) | 0.0 [0.0, 0.0] |
| 18.2 Low‐income setting | 0 | 0 | Risk Ratio (M‐H, Random, 95% CI) | 0.0 [0.0, 0.0] |
| 19 Mean length of third stage Show forest plot | 1 | 130 | Mean Difference (IV, Random, 95% CI) | ‐8.12 [‐9.72, ‐6.52] |
| Analysis 12.19  Comparison 12 Active versus mixed management (no routine uterotonic, early cord clamping, CCT), Outcome 19 Mean length of third stage. | ||||
| 19.1 High‐income setting | 0 | 0 | Mean Difference (IV, Random, 95% CI) | 0.0 [0.0, 0.0] |
| 19.2 Low‐income setting | 1 | 130 | Mean Difference (IV, Random, 95% CI) | ‐8.12 [‐9.72, ‐6.52] |
| 20 Manual removal of placenta as defined by authors Show forest plot | 1 | 130 | Risk Ratio (M‐H, Random, 95% CI) | 1.0 [0.06, 15.65] |
| Analysis 12.20  Comparison 12 Active versus mixed management (no routine uterotonic, early cord clamping, CCT), Outcome 20 Manual removal of placenta as defined by authors. | ||||
| 20.1 High‐income setting | 0 | 0 | Risk Ratio (M‐H, Random, 95% CI) | 0.0 [0.0, 0.0] |
| 20.2 Low‐income setting | 1 | 130 | Risk Ratio (M‐H, Random, 95% CI) | 1.0 [0.06, 15.65] |
| 21 Postnatal diastolic blood pressure > 90 mmHg between birth of baby and discharge from the labour ward. | 0 | 0 | Risk Ratio (M‐H, Random, 95% CI) | 0.0 [0.0, 0.0] |
| 21.1 High‐income setting | 0 | 0 | Risk Ratio (M‐H, Random, 95% CI) | 0.0 [0.0, 0.0] |
| 21.2 Low‐income setting | 0 | 0 | Risk Ratio (M‐H, Random, 95% CI) | 0.0 [0.0, 0.0] |
| 22 Postnatal vomiting between birth of baby and discharge from the labour ward | 0 | 0 | Risk Ratio (M‐H, Random, 95% CI) | 0.0 [0.0, 0.0] |
| 22.1 High‐income setting | 0 | 0 | Risk Ratio (M‐H, Random, 95% CI) | 0.0 [0.0, 0.0] |
| 22.2 Low‐income setting | 0 | 0 | Risk Ratio (M‐H, Random, 95% CI) | 0.0 [0.0, 0.0] |
| 23 Any analgesia between birth of the baby and discharge from labour ward | 0 | 0 | Risk Ratio (M‐H, Random, 95% CI) | 0.0 [0.0, 0.0] |
| 23.1 High‐income setting | 0 | 0 | Risk Ratio (M‐H, Random, 95% CI) | 0.0 [0.0, 0.0] |
| 23.2 Low‐income setting | 0 | 0 | Risk Ratio (M‐H, Random, 95% CI) | 0.0 [0.0, 0.0] |
| 24 Women's assessment of pain during third stage as reported by authors | 0 | 0 | Risk Ratio (M‐H, Random, 95% CI) | 0.0 [0.0, 0.0] |
| 24.1 High‐income setting | 0 | 0 | Risk Ratio (M‐H, Random, 95% CI) | 0.0 [0.0, 0.0] |
| 24.2 Low‐income setting | 0 | 0 | Risk Ratio (M‐H, Random, 95% CI) | 0.0 [0.0, 0.0] |
| 25 Secondary blood loss/any vaginal bleeding needing treatment (after 24 hours and up to 6 weeks) | 0 | 0 | Risk Ratio (M‐H, Random, 95% CI) | 0.0 [0.0, 0.0] |
| 25.1 High‐income setting | 0 | 0 | Risk Ratio (M‐H, Random, 95% CI) | 0.0 [0.0, 0.0] |
| 25.2 Low‐income setting | 0 | 0 | Risk Ratio (M‐H, Random, 95% CI) | 0.0 [0.0, 0.0] |
| 26 Amount of lochia either estimated or measured after 24 hours and up to discharge from hospital | 0 | 0 | Mean Difference (IV, Random, 95% CI) | 0.0 [0.0, 0.0] |
| 26.1 High‐income setting | 0 | 0 | Mean Difference (IV, Random, 95% CI) | 0.0 [0.0, 0.0] |
| 26.2 Low‐income setting | 0 | 0 | Mean Difference (IV, Random, 95% CI) | 0.0 [0.0, 0.0] |
| 27 Surgical evacuation of retained products of conception | 0 | 0 | Risk Ratio (M‐H, Random, 95% CI) | 0.0 [0.0, 0.0] |
| 27.1 High‐income setting | 0 | 0 | Risk Ratio (M‐H, Random, 95% CI) | 0.0 [0.0, 0.0] |
| 27.2 Low‐income setting | 0 | 0 | Risk Ratio (M‐H, Random, 95% CI) | 0.0 [0.0, 0.0] |
| 28 Afterpains ‐ abdominal pain associated with the contracting uterus in the postpartum period | 0 | 0 | Risk Ratio (M‐H, Random, 95% CI) | 0.0 [0.0, 0.0] |
| 28.1 High‐income setting | 0 | 0 | Risk Ratio (M‐H, Random, 95% CI) | 0.0 [0.0, 0.0] |
| 28.2 Low‐income setting | 0 | 0 | Risk Ratio (M‐H, Random, 95% CI) | 0.0 [0.0, 0.0] |
| 29 Apgar score < 7 at 5 minutes | 0 | 0 | Risk Ratio (M‐H, Random, 95% CI) | 0.0 [0.0, 0.0] |
| 29.1 High‐income setting | 0 | 0 | Risk Ratio (M‐H, Random, 95% CI) | 0.0 [0.0, 0.0] |
| 29.2 Low‐income setting | 0 | 0 | Risk Ratio (M‐H, Random, 95% CI) | 0.0 [0.0, 0.0] |
| 30 Birthweight | 0 | 0 | Mean Difference (IV, Random, 95% CI) | 0.0 [0.0, 0.0] |
| 30.1 High‐income setting | 0 | 0 | Mean Difference (IV, Random, 95% CI) | 0.0 [0.0, 0.0] |
| 30.2 Low‐income setting | 0 | 0 | Mean Difference (IV, Random, 95% CI) | 0.0 [0.0, 0.0] |
| 31 Neonatal encephalopathy assessed using Sarnat staging (Sarnat 1976; Table 1) | 0 | 0 | Risk Ratio (M‐H, Random, 95% CI) | 0.0 [0.0, 0.0] |
| 31.1 High‐income setting | 0 | 0 | Risk Ratio (M‐H, Random, 95% CI) | 0.0 [0.0, 0.0] |
| 31.2 Low‐income setting | 0 | 0 | Risk Ratio (M‐H, Random, 95% CI) | 0.0 [0.0, 0.0] |
| 32 Neonatal mortality | 0 | 0 | Risk Ratio (M‐H, Random, 95% CI) | 0.0 [0.0, 0.0] |
| 32.1 High‐income setting | 0 | 0 | Risk Ratio (M‐H, Random, 95% CI) | 0.0 [0.0, 0.0] |
| 32.2 Low‐income setting | 0 | 0 | Risk Ratio (M‐H, Random, 95% CI) | 0.0 [0.0, 0.0] |
| 33 Intraventricular haemorrhage ‐ Papille grade III/IV ‐ (for infants born before 34 weeks' gestation only). | 0 | 0 | Risk Ratio (M‐H, Random, 95% CI) | 0.0 [0.0, 0.0] |
| 33.1 High‐income setting | 0 | 0 | Risk Ratio (M‐H, Random, 95% CI) | 0.0 [0.0, 0.0] |
| 33.2 Low‐income setting | 0 | 0 | Risk Ratio (M‐H, Random, 95% CI) | 0.0 [0.0, 0.0] |
| 34 Number of infants who received a red blood cell transfusion. | 0 | 0 | Risk Ratio (M‐H, Random, 95% CI) | 0.0 [0.0, 0.0] |
| 34.1 High‐income setting | 0 | 0 | Risk Ratio (M‐H, Random, 95% CI) | 0.0 [0.0, 0.0] |
| 34.2 Low‐income setting | 0 | 0 | Risk Ratio (M‐H, Random, 95% CI) | 0.0 [0.0, 0.0] |
| 35 Infant Hb level at 24 to 72 hours | 0 | 0 | Mean Difference (IV, Random, 95% CI) | 0.0 [0.0, 0.0] |
| 35.1 High‐income setting | 0 | 0 | Mean Difference (IV, Random, 95% CI) | 0.0 [0.0, 0.0] |
| 35.2 Low‐income setting | 0 | 0 | Mean Difference (IV, Random, 95% CI) | 0.0 [0.0, 0.0] |
| 36 Infant Hb level at 3‐6 months | 0 | 0 | Mean Difference (IV, Random, 95% CI) | 0.0 [0.0, 0.0] |
| 36.1 High‐income setting | 0 | 0 | Mean Difference (IV, Random, 95% CI) | 0.0 [0.0, 0.0] |
| 36.2 Low‐income setting | 0 | 0 | Mean Difference (IV, Random, 95% CI) | 0.0 [0.0, 0.0] |
| 37 Infant iron indices (ferritin) at 3 to 6 months. | 0 | 0 | Risk Ratio (M‐H, Random, 95% CI) | 0.0 [0.0, 0.0] |
| 37.1 High‐income setting | 0 | 0 | Risk Ratio (M‐H, Random, 95% CI) | 0.0 [0.0, 0.0] |
| 37.2 Low‐income setting | 0 | 0 | Risk Ratio (M‐H, Random, 95% CI) | 0.0 [0.0, 0.0] |
| 38 Exclusive breastfeeding at discharge from hospital | 0 | 0 | Risk Ratio (M‐H, Random, 95% CI) | 0.0 [0.0, 0.0] |
| 38.1 High‐income setting | 0 | 0 | Risk Ratio (M‐H, Random, 95% CI) | 0.0 [0.0, 0.0] |
| 38.2 Low‐income setting | 0 | 0 | Risk Ratio (M‐H, Random, 95% CI) | 0.0 [0.0, 0.0] |
| 39 Neurodevelopmental, cognitive or developmental outcomes assessed after age 18 months. | 0 | 0 | Risk Ratio (M‐H, Random, 95% CI) | 0.0 [0.0, 0.0] |
| 39.1 High‐income setting | 0 | 0 | Risk Ratio (M‐H, Random, 95% CI) | 0.0 [0.0, 0.0] |
| 39.2 Low‐income setting | 0 | 0 | Risk Ratio (M‐H, Random, 95% CI) | 0.0 [0.0, 0.0] |
| 40 Return to hospital as in‐ or outpatient because of bleeding (not pre‐specified) | 0 | 0 | Risk Ratio (M‐H, Random, 95% CI) | 0.0 [0.0, 0.0] |
| 40.1 High‐income setting | 0 | 0 | Risk Ratio (M‐H, Random, 95% CI) | 0.0 [0.0, 0.0] |
| 40.2 Low‐income setting | 0 | 0 | Risk Ratio (M‐H, Random, 95% CI) | 0.0 [0.0, 0.0] |
| 41 Postnatal maternal mean Hb (outcome not pre‐specified) | 0 | 0 | Mean Difference (IV, Random, 95% CI) | 0.0 [0.0, 0.0] |
| 41.1 High‐income setting | 0 | 0 | Mean Difference (IV, Random, 95% CI) | 0.0 [0.0, 0.0] |
| 41.2 Low‐income setting | 0 | 0 | Mean Difference (IV, Random, 95% CI) | 0.0 [0.0, 0.0] |
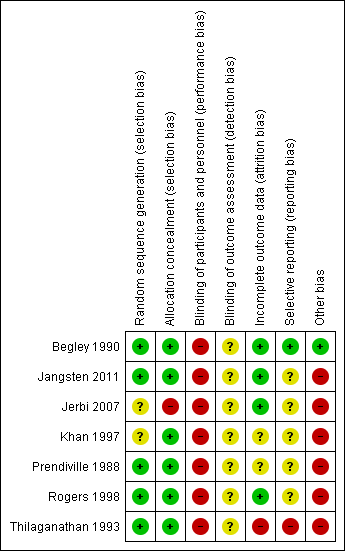
Methodological quality summary: review authors' judgements about each methodological quality item for each included study.

Comparison 1 Active versus expectant management of 3rd stage of labour (all women), Outcome 1 Severe primary postpartum haemorrhage (PPH) at time of birth (clinically estimated or measured blood loss ≥ 1000 mL).

Comparison 1 Active versus expectant management of 3rd stage of labour (all women), Outcome 4 Maternal Hb < 9 g/dL 24‐72 hours postpartum.

Comparison 1 Active versus expectant management of 3rd stage of labour (all women), Outcome 5 Admission to neonatal special/intensive care.

Comparison 1 Active versus expectant management of 3rd stage of labour (all women), Outcome 6 Neonatal jaundice requiring phototherapy or exchange transfusion.

Comparison 1 Active versus expectant management of 3rd stage of labour (all women), Outcome 10 Primary blood loss ≥ 500 mL at time of birth (clinically estimated or measured).

Comparison 1 Active versus expectant management of 3rd stage of labour (all women), Outcome 13 Mean maternal blood loss (mL) at time of birth (clinically estimated or measured).
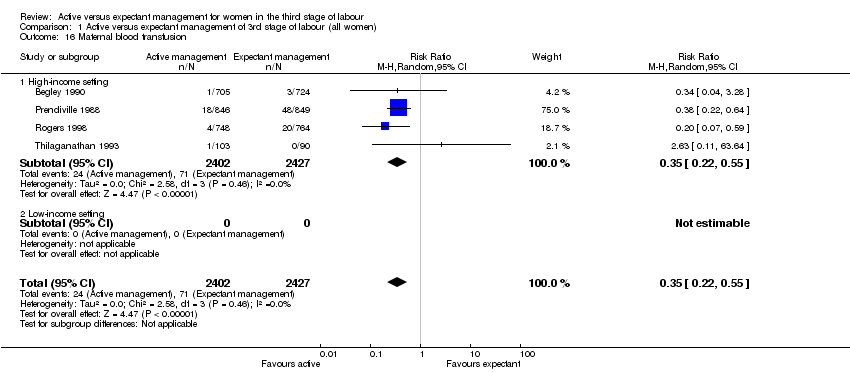
Comparison 1 Active versus expectant management of 3rd stage of labour (all women), Outcome 16 Maternal blood transfusion.
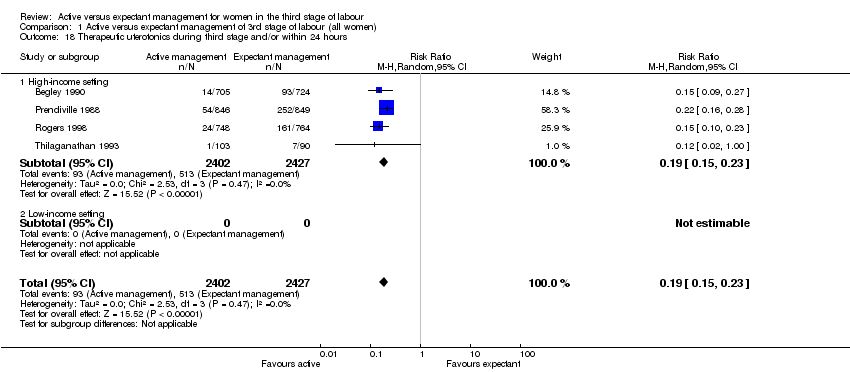
Comparison 1 Active versus expectant management of 3rd stage of labour (all women), Outcome 18 Therapeutic uterotonics during third stage and/or within 24 hours.

Comparison 1 Active versus expectant management of 3rd stage of labour (all women), Outcome 19 Mean length of third stage.

Comparison 1 Active versus expectant management of 3rd stage of labour (all women), Outcome 20 Manual removal of placenta as defined by authors.
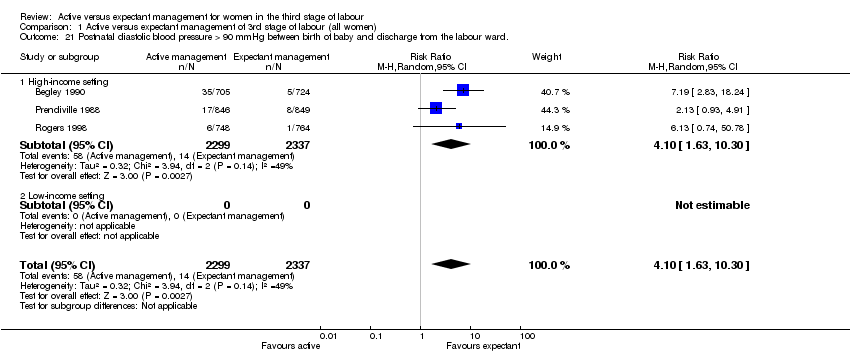
Comparison 1 Active versus expectant management of 3rd stage of labour (all women), Outcome 21 Postnatal diastolic blood pressure > 90 mmHg between birth of baby and discharge from the labour ward..
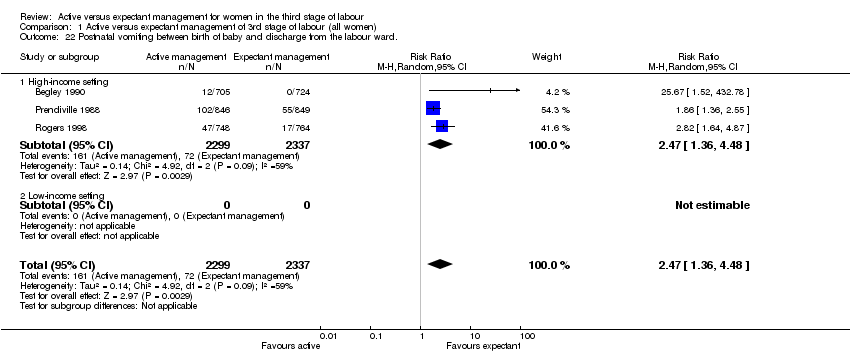
Comparison 1 Active versus expectant management of 3rd stage of labour (all women), Outcome 22 Postnatal vomiting between birth of baby and discharge from the labour ward..

Comparison 1 Active versus expectant management of 3rd stage of labour (all women), Outcome 23 Any analgesia between birth of the baby and discharge from labour ward.

Comparison 1 Active versus expectant management of 3rd stage of labour (all women), Outcome 25 Secondary blood loss/any vaginal bleeding needing treatment (after 24 hours and up to 6 weeks).

Comparison 1 Active versus expectant management of 3rd stage of labour (all women), Outcome 27 Surgical evacuation of retained products of conception.

Comparison 1 Active versus expectant management of 3rd stage of labour (all women), Outcome 28 Afterpains ‐ abdominal pain associated with the contracting uterus in the postpartum period..
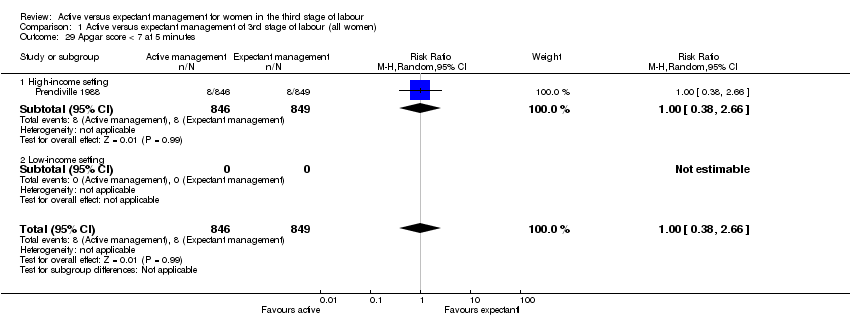
Comparison 1 Active versus expectant management of 3rd stage of labour (all women), Outcome 29 Apgar score < 7 at 5 minutes.

Comparison 1 Active versus expectant management of 3rd stage of labour (all women), Outcome 30 Birthweight.
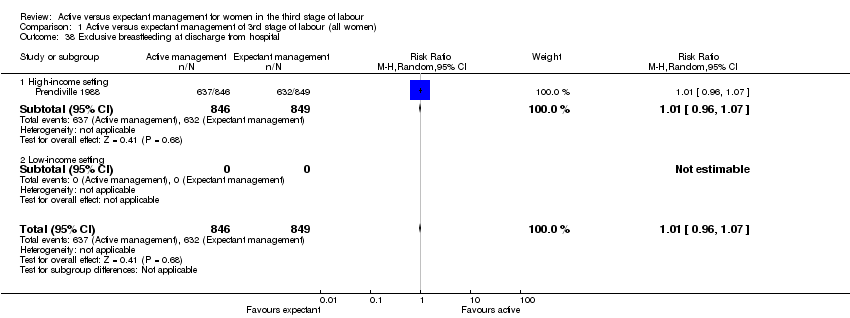
Comparison 1 Active versus expectant management of 3rd stage of labour (all women), Outcome 38 Exclusive breastfeeding at discharge from hospital.

Comparison 1 Active versus expectant management of 3rd stage of labour (all women), Outcome 40 Return to hospital as in‐ or outpatient because of bleeding (not pre‐specified).
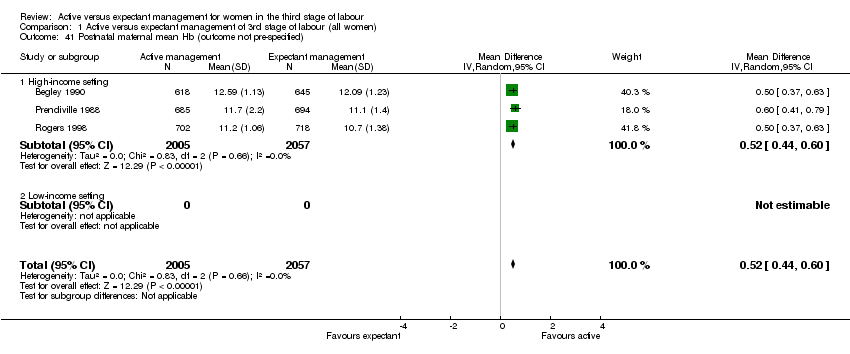
Comparison 1 Active versus expectant management of 3rd stage of labour (all women), Outcome 41 Postnatal maternal mean Hb (outcome not pre‐specified).
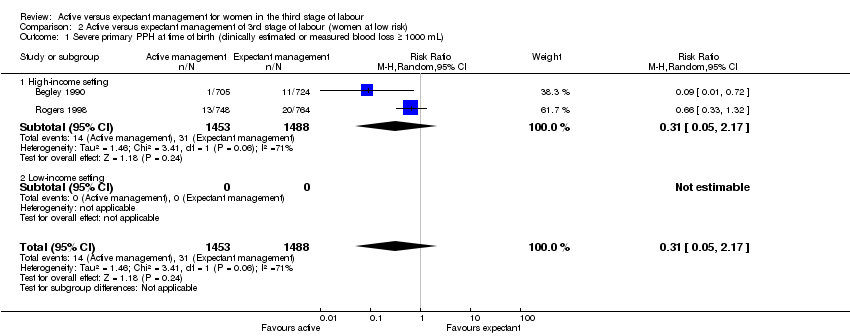
Comparison 2 Active versus expectant management of 3rd stage of labour (women at low risk), Outcome 1 Severe primary PPH at time of birth (clinically estimated or measured blood loss ≥ 1000 mL).

Comparison 2 Active versus expectant management of 3rd stage of labour (women at low risk), Outcome 4 Maternal Hb < 9 g/dL at 24‐72 hr.

Comparison 2 Active versus expectant management of 3rd stage of labour (women at low risk), Outcome 5 Admission to neonatal special/intensive care.

Comparison 2 Active versus expectant management of 3rd stage of labour (women at low risk), Outcome 6 Neonatal jaundice requiring phototherapy or exchange transfusion.

Comparison 2 Active versus expectant management of 3rd stage of labour (women at low risk), Outcome 10 Primary blood loss ≥ 500 mL at time of birth (clinically estimated or measured).

Comparison 2 Active versus expectant management of 3rd stage of labour (women at low risk), Outcome 13 Mean maternal blood loss (mL at the time of birth, clinically estimated or measured.

Comparison 2 Active versus expectant management of 3rd stage of labour (women at low risk), Outcome 16 Maternal blood transfusion.

Comparison 2 Active versus expectant management of 3rd stage of labour (women at low risk), Outcome 18 Therapeutic uterotonics during third stage and/or within 24 hours.
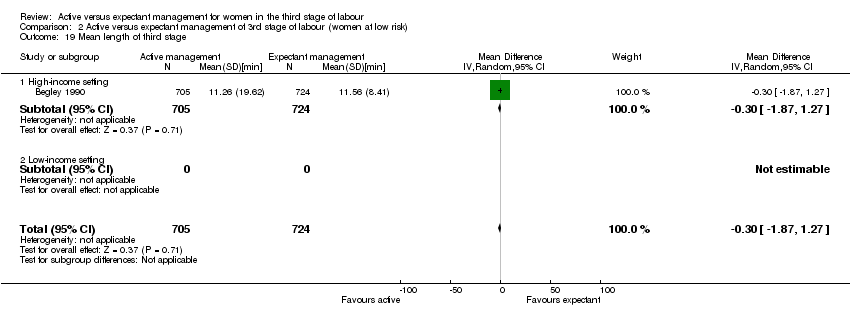
Comparison 2 Active versus expectant management of 3rd stage of labour (women at low risk), Outcome 19 Mean length of third stage.

Comparison 2 Active versus expectant management of 3rd stage of labour (women at low risk), Outcome 20 Manual removal of placenta as defined by authors.
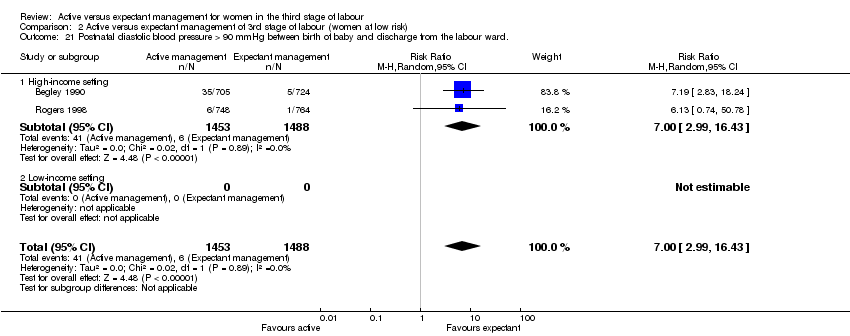
Comparison 2 Active versus expectant management of 3rd stage of labour (women at low risk), Outcome 21 Postnatal diastolic blood pressure > 90 mmHg between birth of baby and discharge from the labour ward..

Comparison 2 Active versus expectant management of 3rd stage of labour (women at low risk), Outcome 22 Postnatal vomiting between birth of baby and discharge from the labour ward..

Comparison 2 Active versus expectant management of 3rd stage of labour (women at low risk), Outcome 23 Any analgesia between birth of the baby and up to discharge from labour ward.

Comparison 2 Active versus expectant management of 3rd stage of labour (women at low risk), Outcome 25 Secondary blood loss/any vaginal bleeding needing treatment (after 24 hours and up to 6 weeks).

Comparison 2 Active versus expectant management of 3rd stage of labour (women at low risk), Outcome 27 Surgical evacuation of retained products of conception.

Comparison 2 Active versus expectant management of 3rd stage of labour (women at low risk), Outcome 28 Afterpains ‐ abdominal pain associated with the contracting uterus in the postpartum period..
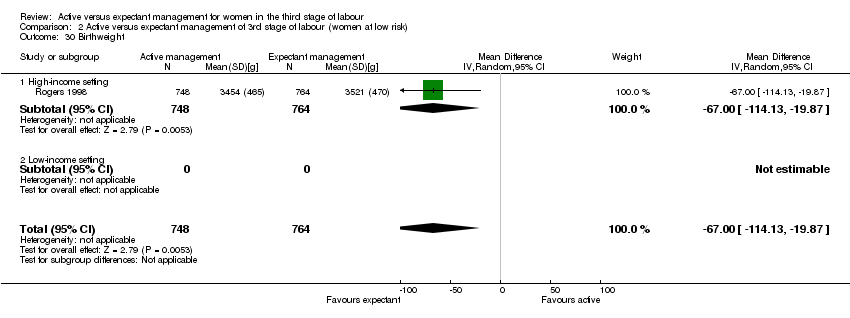
Comparison 2 Active versus expectant management of 3rd stage of labour (women at low risk), Outcome 30 Birthweight.
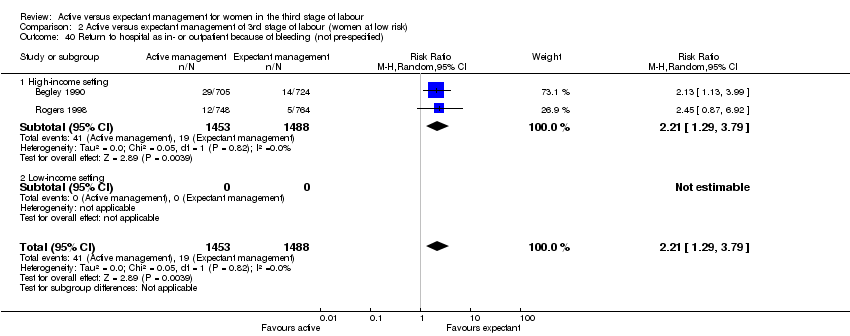
Comparison 2 Active versus expectant management of 3rd stage of labour (women at low risk), Outcome 40 Return to hospital as in‐ or outpatient because of bleeding (not pre‐specified).

Comparison 2 Active versus expectant management of 3rd stage of labour (women at low risk), Outcome 41 Postnatal maternal mean Hb (outcome not pre‐specified).

Comparison 10 Active versus mixed management (uterotonic after placental delivery, immediate cord clamping and no CCT) , Outcome 1 Severe primary PPH at time of birth (clinically estimated or measured blood loss ≥ 1000 mL).
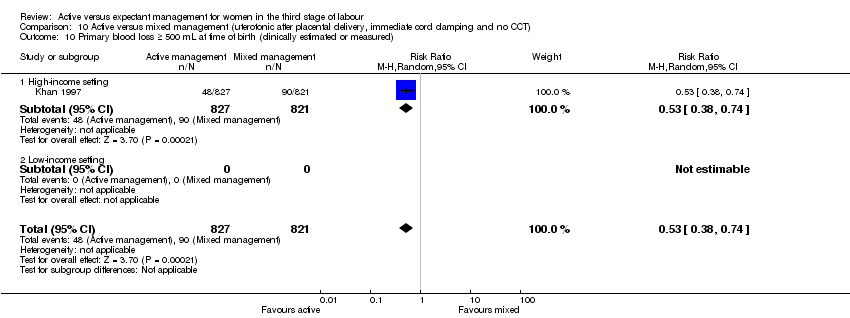
Comparison 10 Active versus mixed management (uterotonic after placental delivery, immediate cord clamping and no CCT) , Outcome 10 Primary blood loss ≥ 500 mL at time of birth (clinically estimated or measured).

Comparison 10 Active versus mixed management (uterotonic after placental delivery, immediate cord clamping and no CCT) , Outcome 16 Maternal blood transfusion.
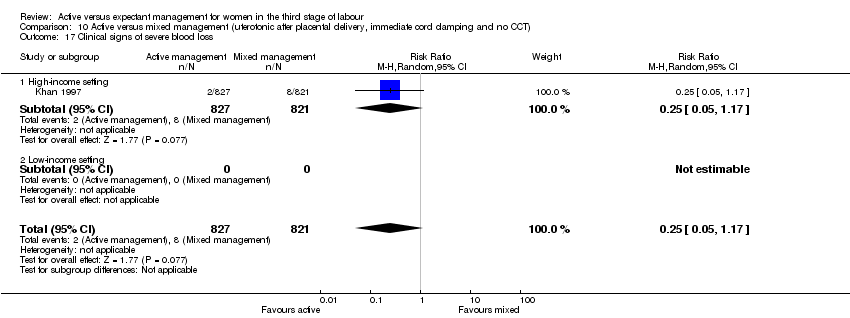
Comparison 10 Active versus mixed management (uterotonic after placental delivery, immediate cord clamping and no CCT) , Outcome 17 Clinical signs of severe blood loss.
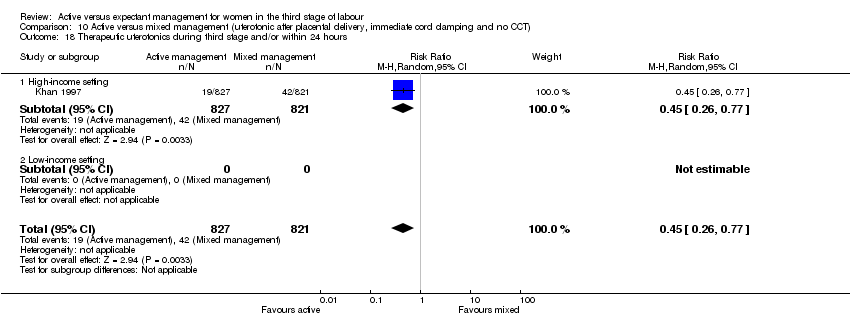
Comparison 10 Active versus mixed management (uterotonic after placental delivery, immediate cord clamping and no CCT) , Outcome 18 Therapeutic uterotonics during third stage and/or within 24 hours.

Comparison 10 Active versus mixed management (uterotonic after placental delivery, immediate cord clamping and no CCT) , Outcome 19 Mean length of third stage.

Comparison 11 Active versus mixed management (no routine uterotonic, early cord clamping, no CCT), Outcome 1 Severe primary PPH at time of birth (clinically estimated or measured blood loss ≥ 1000 mL).

Comparison 11 Active versus mixed management (no routine uterotonic, early cord clamping, no CCT), Outcome 4 Maternal Hb < 9 g/dL at 24‐72 hr.

Comparison 11 Active versus mixed management (no routine uterotonic, early cord clamping, no CCT), Outcome 10 Primary blood loss ≥ 500 mL at time of birth (clinically estimated or measured).

Comparison 11 Active versus mixed management (no routine uterotonic, early cord clamping, no CCT), Outcome 13 Mean maternal blood loss (mL) at time of birth (clinically estimated or measured).
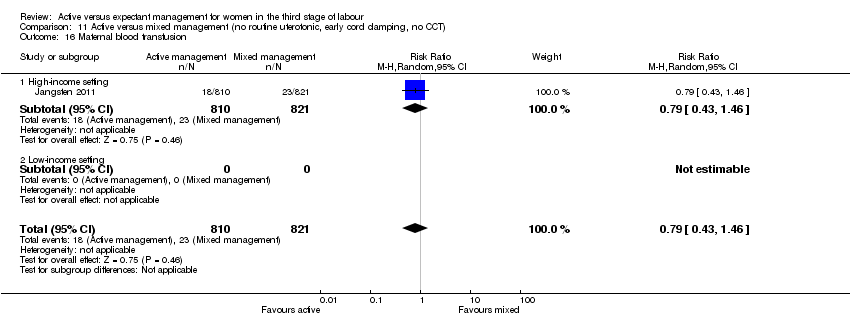
Comparison 11 Active versus mixed management (no routine uterotonic, early cord clamping, no CCT), Outcome 16 Maternal blood transfusion.

Comparison 11 Active versus mixed management (no routine uterotonic, early cord clamping, no CCT), Outcome 18 Therapeutic uterotonics during third stage and/or within 24 hours.

Comparison 11 Active versus mixed management (no routine uterotonic, early cord clamping, no CCT), Outcome 19 Mean length of third stage.

Comparison 11 Active versus mixed management (no routine uterotonic, early cord clamping, no CCT), Outcome 20 Manual removal of placenta as defined by authors.

Comparison 11 Active versus mixed management (no routine uterotonic, early cord clamping, no CCT), Outcome 28 Not prespecified: afterpains at 2 hours after birth (id 20458).

Comparison 11 Active versus mixed management (no routine uterotonic, early cord clamping, no CCT), Outcome 29 Not pre‐specified: afterpains the day after birth (id 20458).
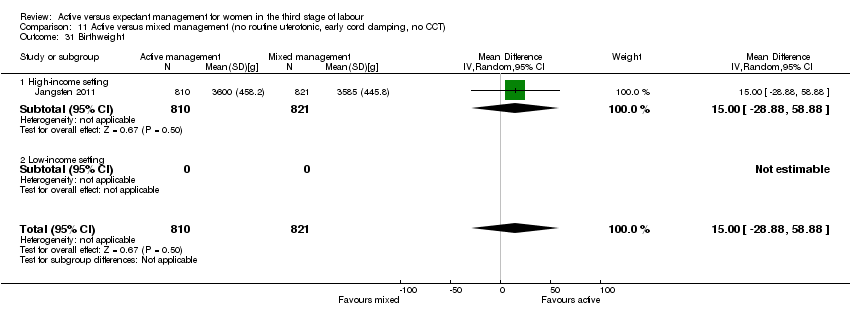
Comparison 11 Active versus mixed management (no routine uterotonic, early cord clamping, no CCT), Outcome 31 Birthweight.

Comparison 11 Active versus mixed management (no routine uterotonic, early cord clamping, no CCT), Outcome 42 Postnatal maternal mean Hb (outcome not pre‐specified).

Comparison 11 Active versus mixed management (no routine uterotonic, early cord clamping, no CCT), Outcome 43 Severe primary PPH after placental delivery and up to 2 hours (clinically estimated or measured blood loss ≥ 1000 mL) ‐ not pre‐specified.
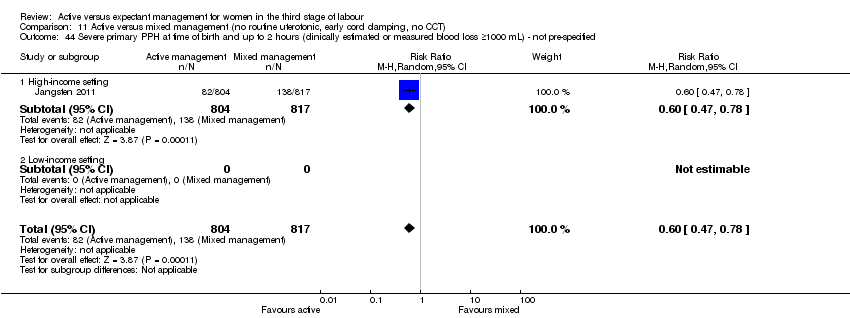
Comparison 11 Active versus mixed management (no routine uterotonic, early cord clamping, no CCT), Outcome 44 Severe primary PPH at time of birth and up to 2 hours (clinically estimated or measured blood loss ≥1000 mL) ‐ not pre‐specified.

Comparison 11 Active versus mixed management (no routine uterotonic, early cord clamping, no CCT), Outcome 45 Mean blood loss (mL) (clinically estimated or measured at birth and up to 2 hours (not pre‐specified).

Comparison 12 Active versus mixed management (no routine uterotonic, early cord clamping, CCT), Outcome 4 Maternal Hb < 9 g/dL at 24‐72 hr.

Comparison 12 Active versus mixed management (no routine uterotonic, early cord clamping, CCT), Outcome 19 Mean length of third stage.
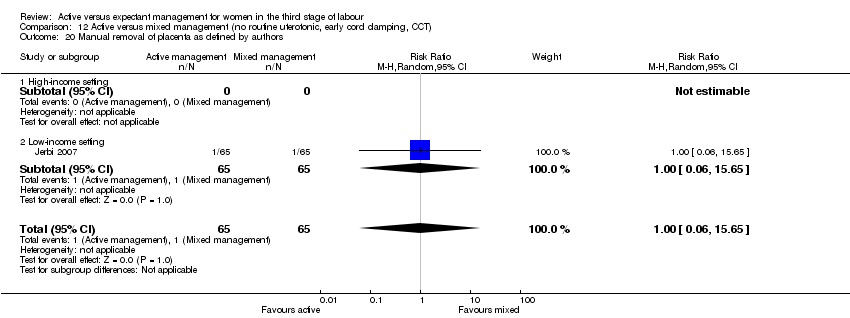
Comparison 12 Active versus mixed management (no routine uterotonic, early cord clamping, CCT), Outcome 20 Manual removal of placenta as defined by authors.
| Active versus expectant management of the third stage of labour (all women) | ||||||
| Population: all women who expected a vaginal birth at 24 weeks' gestation or later | ||||||
| Outcomes | Illustrative comparative risks* (95% CI) | Relative effect | No of Participants | Quality of the evidence | Comments | |
| Assumed risk | Corresponding risk | |||||
| Expectant management of the third stage of labour | Active management of the third stage of labour | |||||
| Severe primary postpartum haemorrhage (PPH) (clinically estimated or measured blood loss ≥ to 1000 mL at time of birth) | 24 per 1000 | 8 per 1000 | RR 0.34 | 4636 | ⊕⊝⊝⊝ | |
| Very severe primary PPH (clinically estimated or measured blood loss ≥ to 2500 mL at time of birth) | See comment | See comment | Not estimable | 0 | See comment | No data |
| Maternal mortality | See comment | See comment | Not estimable | 0 | See comment | No data |
| Maternal Hb < 9 g/dL 24 to 72 hours postpartum | 71 per 1000 | 36 per 1000 | RR 0.5 | 1572 | ⊕⊕⊝⊝ | |
| Admission to neonatal special/intensive care | 52 per 1000 | 42 per 1000 | RR 0.81 | 3207 | ⊕⊕⊝⊝ | |
| Neonatal jaundice requiring phototherapy or exchange transfusion | 49 per 1000 | 47 per 1000 | RR 0.96 | 3142 | ⊕⊝⊝⊝ | |
| Neonatal polycythaemia treated with dilutional exchange transfusion | See comment | See comment | Not estimable | 0 | See comment | No data |
| *The basis for the assumed risk (e.g. the median control group risk across studies) is provided in footnotes. The corresponding risk (and its 95% confidence interval) is based on the assumed risk in the comparison group and the relative effect of the intervention (and its 95% CI). | ||||||
| GRADE Working Group grades of evidence | ||||||
| 1Risk of bias: of the 3 trials providing data for this outcome, all 3 are at low risk of bias for sequence generation (selection bias), allocation concealment (selection bias) and for incomplete outcome data (attrition bias). 2 are at low risk of selective reporting (reporting bias) and 1 is unclear. 1 study is at high risk of other bias (see 'Risk of bias' tables). 2Risk of bias: of the 2 trials providing data for this outcome, both are at low risk of bias for sequence generation (selection bias) and allocation concealment (selection bias), 1 is at low risk of bias for incomplete outcome data (attrition bias) while the other is high‐risk. 1 is at high‐‐risk of selective reporting (reporting bias) and 1 is unclear. Both studies are at high risk of other bias (see 'Risk of bias' tables). 3Risk of bias: of the 2 trials providing data for this outcome, both are at low risk of bias for sequence generation (selection bias), allocation concealment (selection bias) and for incomplete outcome data (attrition bias). 1 is at low‐risk of selective reporting (reporting bias) and 1 is unclear. 1 study is at high risk of other bias and the other is at low risk of bias (see 'Risk of bias' tables). 4Risk of bias: Of the 2 trials providing data for this outcome, both are at low risk of bias for sequence generation (selection bias), allocation concealment (selection bias) and for incomplete outcome data (attrition bias). 1 is at low‐risk of selective reporting (reporting bias) and 1 is unclear. 1 study is at high risk of other bias and the other is at low risk of bias (see 'Risk of bias' tables). | ||||||
| Terms | Definitions used in this review | ||||||
| Expectant management of third stage of labour | 1. A prophylactic uterotonic agent is not administered; | ||||||
| Active management of third stage of labour | 1. The routine administration of a prophylactic uterotonic drug just before, with, or immediately after, the birth of the baby; | ||||||
| Mixed management of third stage of labour | A mixture of some of the components of both active and expectant management of third stage, but without exclusively containing all the components of either. There can be a number of different mixed third stage managements, for example: | ||||||
| Early prophylactic uterotonic | Prophylactic uterotonic drug administered just before, with, or immediately after, the birth of the infant. | ||||||
| Delayed prophylactic uterotonic | Prophylactic uterotonic drug administered after the cord pulsation has ceased. | ||||||
| Early cord clamping | The application of a clamp to the umbilical cord within 60 seconds of the birth of the infant (McDonald 2013). | ||||||
| Delayed cord clamping | The application of a clamp to the umbilical cord greater than 1 minute after birth or when cord pulsation has ceased (McDonald 2013). | ||||||
| Sarnat staging for hypoxic ischaemic encephalopathy (Sarnat 1976) | Stage 1 (mild): hyper‐alertness, hyper‐reflexia, dilated pupils, tachycardia, absence of seizures. Stage 2 (moderate): lethargy, hyper‐reflexia, miosis, bradycardia, seizures, hypotonia with weak suck and Moro reflexes. Stage 3 (severe): stupor, flaccidity, small to mid‐position pupils which react poorly to light, decreased stretch reflexes, hypothermia and absent Moro. | ||||||
| Active management protocol | Expectant management protocol | Active management used | Expectant management used | |
| (Bristol trial) | • IM syntometrine (5 units oxytocin + 0.5 mg ergometrine) (IM 10 units oxytocin if raised BP) Immediately after birth of anterior shoulder. • Clamp cord 30 seconds after birth. • CCT when uterus contracted. | • Try not to give oxytocic. • Try to leave cord attached to baby until placenta delivered. • Try not to use CCT or any manual interference with uterus at the fundus. • Encourage mother to adopt posture aiding delivery with gravity. • If placenta not delivered spontaneously wait, try putting baby to breast, and encourage maternal effort as above. | • Full active management (99%). • 99% cord clamped and cut before delivery of placenta. • 99% CCT. • 217 (26%) upright.
| • Full expectant management 403 (48%). • Full active management 168 (20%). • 278 (32%) had mixed management. • Cord left unclamped till pulsation ceased 48%. • Placenta delivered by maternal effort 60% and CCT 40%. • 416 (49%) upright. • 30% received uterotonic for treatment. |
| (Dublin trial) | • IV ergometrine 0.5 mg immediately following birth. • Try to clamp cord within 30 seconds. • When uterus contracted, attempt CCT. • Try not to give any special instructions re posture.
| • No oxytocic drug routinely. • Try to leave cord attached to baby until pulsation has ceased. • Placenta may be delivered by maternal effort or gentle controlled cord traction once separated. • Encourage mother to breastfeed. Help her to kneel/sit/squat. | • All given IV ergometrine before delivery of placenta. • 89% cord clamped and cut. • 93% CCT and 5% maternal effort. • 7% upright and 93% recumbent. | • 14% were given ergometrine for treatment, not prophylactically, 6 (0.83%) before placenta delivered. • Cord left unclamped till pulsation ceased 42%. • Placenta delivered by maternal effort 32% and gentle CCT 66%. • 11% upright. |
| (Hinchingbrooke trial) | •IM syntometrine (5 units oxytocin + 0.5 mg ergometrine) (IM 10 units oxytocin if raised blood pressure). • As soon as possible after birth of anterior shoulder (within 2 minutes of birth). • Immediate cord clamping and cutting. • CCT or maternal effort. • Women randomised to upright and recumbent in both arms. | • No uterotonic drug. • No cord clamping until after pulsation ceased. • Delivery of placenta within 1 hour by maternal effort. | • 699 (93.4%) had full active management. • 2 (0.3%) had fully expectant management. • 47 (6.2%) had mixed. • 95% given prophylactic uterotonic before delivery of placenta. • 93% cord clamped before pulsation ceased. • 46% CCT. • 44% upright (when placenta delivered). | • 488 (63.9%) had full expectant management. • 19 (2.5%) had fully active management. • 257 (33.6%) had mixed. • 21% received oxytocic for treatment, 2.5% prophylactically. • Cord left unclamped till pulsation ceased 70%. • Placenta delivered by CCT 12%. • 43% upright (when placenta delivered). |
| Thilaganathan 1993(Brighton trial) | • Syntometrine 1 mL (IM or IV, route not specified). • As soon as baby born. • Cord was “immediately clamped”. • Placenta delivered with CCT.
| • No oxytocic. • Cord not cut or clamped until after pulsation ceased (unless there were contraindications). • Deliver placenta by maternal effort after signs of separation. “when the placenta could be felt in the vagina, the midwife could then assist delivery of the placenta”. • Upright position encouraged. | • No information. | • No information. |
| (Abu Dhabi trial) | • IM oxytocin 10 units at delivery of anterior shoulder. • Immediate cord clamping and cutting. • CCT as soon as the uterus was contracted firmly ‐ repeated every 2‐3 minutes.
| • No oxytocic prior to delivery of placenta. • Cord clamped and cut after delivery. • No CCT. • No fundal massage. • Maternal expulsion after signs of separation. • IV infusion of oxytocin 10 units in 500 mL normal saline given slowly. | • No information. | • No information. |
| BP: blood pressure | ||||
| Outcome or subgroup title | No. of studies | No. of participants | Statistical method | Effect size |
| 1 Severe primary postpartum haemorrhage (PPH) at time of birth (clinically estimated or measured blood loss ≥ 1000 mL) Show forest plot | 3 | 4636 | Risk Ratio (M‐H, Random, 95% CI) | 0.34 [0.14, 0.87] |
| 1.1 High‐income setting | 3 | 4636 | Risk Ratio (M‐H, Random, 95% CI) | 0.34 [0.14, 0.87] |
| 1.2 Low‐income setting | 0 | 0 | Risk Ratio (M‐H, Random, 95% CI) | 0.0 [0.0, 0.0] |
| 2 Very severe primary PPH at time of birth (clinically estimated or measured blood loss ≥ 2500 mL) | 0 | 0 | Risk Ratio (M‐H, Random, 95% CI) | 0.0 [0.0, 0.0] |
| 2.1 High‐income setting | 0 | 0 | Risk Ratio (M‐H, Random, 95% CI) | 0.0 [0.0, 0.0] |
| 2.2 Low‐income setting | 0 | 0 | Risk Ratio (M‐H, Random, 95% CI) | 0.0 [0.0, 0.0] |
| 3 Maternal mortality | 0 | 0 | Risk Ratio (M‐H, Random, 95% CI) | 0.0 [0.0, 0.0] |
| 3.1 High‐income setting | 0 | 0 | Risk Ratio (M‐H, Random, 95% CI) | 0.0 [0.0, 0.0] |
| 3.2 Low‐income setting | 0 | 0 | Risk Ratio (M‐H, Random, 95% CI) | 0.0 [0.0, 0.0] |
| 4 Maternal Hb < 9 g/dL 24‐72 hours postpartum Show forest plot | 2 | 1572 | Risk Ratio (M‐H, Random, 95% CI) | 0.50 [0.30, 0.83] |
| 4.1 High‐income setting | 2 | 1572 | Risk Ratio (M‐H, Random, 95% CI) | 0.50 [0.30, 0.83] |
| 4.2 Low‐income setting | 0 | 0 | Risk Ratio (M‐H, Random, 95% CI) | 0.0 [0.0, 0.0] |
| 5 Admission to neonatal special/intensive care Show forest plot | 2 | 3207 | Risk Ratio (M‐H, Random, 95% CI) | 0.81 [0.60, 1.11] |
| 5.1 High‐income setting | 2 | 3207 | Risk Ratio (M‐H, Random, 95% CI) | 0.81 [0.60, 1.11] |
| 5.2 Low‐income setting | 0 | 0 | Risk Ratio (M‐H, Random, 95% CI) | 0.0 [0.0, 0.0] |
| 6 Neonatal jaundice requiring phototherapy or exchange transfusion Show forest plot | 2 | 3142 | Risk Ratio (M‐H, Random, 95% CI) | 0.96 [0.55, 1.68] |
| 6.1 High‐income setting | 2 | 3142 | Risk Ratio (M‐H, Random, 95% CI) | 0.96 [0.55, 1.68] |
| 6.2 Low‐income setting | 0 | 0 | Risk Ratio (M‐H, Random, 95% CI) | 0.0 [0.0, 0.0] |
| 7 Neonatal polycythaemia treated with dilutional exchange transfusion | 0 | 0 | Risk Ratio (M‐H, Random, 95% CI) | 0.0 [0.0, 0.0] |
| 7.1 High‐income setting | 0 | 0 | Risk Ratio (M‐H, Random, 95% CI) | 0.0 [0.0, 0.0] |
| 7.2 Low‐income setting | 0 | 0 | Risk Ratio (M‐H, Random, 95% CI) | 0.0 [0.0, 0.0] |
| 8 Severe primary PPH after placental delivery and up to 24 hours (clinically estimated or measured blood loss ≥ 1000 mL) | 0 | 0 | Risk Ratio (M‐H, Random, 95% CI) | 0.0 [0.0, 0.0] |
| 8.1 High‐income setting | 0 | 0 | Risk Ratio (M‐H, Random, 95% CI) | 0.0 [0.0, 0.0] |
| 8.2 Low‐income setting | 0 | 0 | Risk Ratio (M‐H, Random, 95% CI) | 0.0 [0.0, 0.0] |
| 9 Severe primary PPH at time of birth and up to 24 hours (clinically estimated or measured blood loss ≥ 1000 mL) | 0 | 0 | Risk Ratio (M‐H, Random, 95% CI) | 0.0 [0.0, 0.0] |
| 9.1 High‐income setting | 0 | 0 | Risk Ratio (M‐H, Random, 95% CI) | 0.0 [0.0, 0.0] |
| 9.2 Low‐income setting | 0 | 0 | Risk Ratio (M‐H, Random, 95% CI) | 0.0 [0.0, 0.0] |
| 10 Primary blood loss ≥ 500 mL at time of birth (clinically estimated or measured) Show forest plot | 3 | 4636 | Risk Ratio (M‐H, Random, 95% CI) | 0.34 [0.27, 0.44] |
| 10.1 High‐income setting | 3 | 4636 | Risk Ratio (M‐H, Random, 95% CI) | 0.34 [0.27, 0.44] |
| 10.2 Low‐income setting | 0 | 0 | Risk Ratio (M‐H, Random, 95% CI) | 0.0 [0.0, 0.0] |
| 11 Primary blood loss ≥ 500 mL after delivery of placenta and up to 24 hours (clinically estimated or measured) | 0 | 0 | Risk Ratio (M‐H, Random, 95% CI) | 0.0 [0.0, 0.0] |
| 11.1 High‐income setting | 0 | 0 | Risk Ratio (M‐H, Random, 95% CI) | 0.0 [0.0, 0.0] |
| 11.2 Low‐income setting | 0 | 0 | Risk Ratio (M‐H, Random, 95% CI) | 0.0 [0.0, 0.0] |
| 12 Primary blood loss ≥ 500 mL at time of birth and up to 24 hours (clinically estimated or measured) | 0 | 0 | Risk Ratio (M‐H, Random, 95% CI) | 0.0 [0.0, 0.0] |
| 12.1 High‐income setting | 0 | 0 | Risk Ratio (M‐H, Random, 95% CI) | 0.0 [0.0, 0.0] |
| 12.2 Low‐income setting | 0 | 0 | Risk Ratio (M‐H, Random, 95% CI) | 0.0 [0.0, 0.0] |
| 13 Mean maternal blood loss (mL) at time of birth (clinically estimated or measured) Show forest plot | 2 | 2941 | Mean Difference (IV, Random, 95% CI) | ‐78.80 [‐95.96, ‐61.64] |
| 13.1 High‐income setting | 2 | 2941 | Mean Difference (IV, Random, 95% CI) | ‐78.80 [‐95.96, ‐61.64] |
| 13.2 Low‐income setting | 0 | 0 | Mean Difference (IV, Random, 95% CI) | 0.0 [0.0, 0.0] |
| 14 Mean maternal blood loss (mL) after delivery of placenta and up to 24 hours (clinically estimated or measured) | 0 | 0 | Mean Difference (IV, Random, 95% CI) | 0.0 [0.0, 0.0] |
| 14.1 High‐income setting | 0 | 0 | Mean Difference (IV, Random, 95% CI) | 0.0 [0.0, 0.0] |
| 14.2 Low‐income setting | 0 | 0 | Mean Difference (IV, Random, 95% CI) | 0.0 [0.0, 0.0] |
| 15 Mean maternal blood loss (mL at time of birth and up to 24 hours (clinically estimated or measured) | 0 | 0 | Mean Difference (IV, Random, 95% CI) | 0.0 [0.0, 0.0] |
| 15.1 High‐income setting | 0 | 0 | Mean Difference (IV, Random, 95% CI) | 0.0 [0.0, 0.0] |
| 15.2 Low‐income setting | 0 | 0 | Mean Difference (IV, Random, 95% CI) | 0.0 [0.0, 0.0] |
| 16 Maternal blood transfusion Show forest plot | 4 | 4829 | Risk Ratio (M‐H, Random, 95% CI) | 0.35 [0.22, 0.55] |
| 16.1 High‐income setting | 4 | 4829 | Risk Ratio (M‐H, Random, 95% CI) | 0.35 [0.22, 0.55] |
| 16.2 Low‐income setting | 0 | 0 | Risk Ratio (M‐H, Random, 95% CI) | 0.0 [0.0, 0.0] |
| 17 Clinical signs of severe blood loss | 0 | 0 | Risk Ratio (M‐H, Random, 95% CI) | 0.0 [0.0, 0.0] |
| 17.1 High‐income setting | 0 | 0 | Risk Ratio (M‐H, Random, 95% CI) | 0.0 [0.0, 0.0] |
| 17.2 Low‐income setting | 0 | 0 | Risk Ratio (M‐H, Random, 95% CI) | 0.0 [0.0, 0.0] |
| 18 Therapeutic uterotonics during third stage and/or within 24 hours Show forest plot | 4 | 4829 | Risk Ratio (M‐H, Random, 95% CI) | 0.19 [0.15, 0.23] |
| 18.1 High‐income setting | 4 | 4829 | Risk Ratio (M‐H, Random, 95% CI) | 0.19 [0.15, 0.23] |
| 18.2 Low‐income setting | 0 | 0 | Risk Ratio (M‐H, Random, 95% CI) | 0.0 [0.0, 0.0] |
| 19 Mean length of third stage Show forest plot | 1 | 1429 | Mean Difference (IV, Random, 95% CI) | ‐0.30 [‐1.87, 1.27] |
| 19.1 High‐income setting | 1 | 1429 | Mean Difference (IV, Random, 95% CI) | ‐0.30 [‐1.87, 1.27] |
| 19.2 Low‐income setting | 0 | 0 | Mean Difference (IV, Random, 95% CI) | 0.0 [0.0, 0.0] |
| 20 Manual removal of placenta as defined by authors Show forest plot | 4 | 4829 | Risk Ratio (M‐H, Random, 95% CI) | 1.78 [0.57, 5.56] |
| 20.1 High‐income setting | 4 | 4829 | Risk Ratio (M‐H, Random, 95% CI) | 1.78 [0.57, 5.56] |
| 20.2 Low‐income setting | 0 | 0 | Risk Ratio (M‐H, Random, 95% CI) | 0.0 [0.0, 0.0] |
| 21 Postnatal diastolic blood pressure > 90 mmHg between birth of baby and discharge from the labour ward. Show forest plot | 3 | 4636 | Risk Ratio (M‐H, Random, 95% CI) | 4.10 [1.63, 10.30] |
| 21.1 High‐income setting | 3 | 4636 | Risk Ratio (M‐H, Random, 95% CI) | 4.10 [1.63, 10.30] |
| 21.2 Low‐income setting | 0 | 0 | Risk Ratio (M‐H, Random, 95% CI) | 0.0 [0.0, 0.0] |
| 22 Postnatal vomiting between birth of baby and discharge from the labour ward. Show forest plot | 3 | 4636 | Risk Ratio (M‐H, Random, 95% CI) | 2.47 [1.36, 4.48] |
| 22.1 High‐income setting | 3 | 4636 | Risk Ratio (M‐H, Random, 95% CI) | 2.47 [1.36, 4.48] |
| 22.2 Low‐income setting | 0 | 0 | Risk Ratio (M‐H, Random, 95% CI) | 0.0 [0.0, 0.0] |
| 23 Any analgesia between birth of the baby and discharge from labour ward Show forest plot | 1 | 1429 | Risk Ratio (M‐H, Random, 95% CI) | 2.53 [1.34, 4.78] |
| 23.1 High‐income setting | 1 | 1429 | Risk Ratio (M‐H, Random, 95% CI) | 2.53 [1.34, 4.78] |
| 23.2 Low‐income setting | 0 | 0 | Risk Ratio (M‐H, Random, 95% CI) | 0.0 [0.0, 0.0] |
| 24 Women's assessment of pain during third stage as reported by authors. | 0 | 0 | Risk Ratio (M‐H, Random, 95% CI) | 0.0 [0.0, 0.0] |
| 24.1 High‐income setting | 0 | 0 | Risk Ratio (M‐H, Random, 95% CI) | 0.0 [0.0, 0.0] |
| 24.2 Low‐income setting | 0 | 0 | Risk Ratio (M‐H, Random, 95% CI) | 0.0 [0.0, 0.0] |
| 25 Secondary blood loss/any vaginal bleeding needing treatment (after 24 hours and up to 6 weeks) Show forest plot | 3 | 4636 | Risk Ratio (M‐H, Random, 95% CI) | 1.10 [0.40, 2.99] |
| 25.1 High‐income setting | 3 | 4636 | Risk Ratio (M‐H, Random, 95% CI) | 1.10 [0.40, 2.99] |
| 25.2 Low‐income setting | 0 | 0 | Risk Ratio (M‐H, Random, 95% CI) | 0.0 [0.0, 0.0] |
| 26 Amount of lochia either estimated or measured after 24 hours and up to discharge from hospital. | 0 | 0 | Mean Difference (IV, Random, 95% CI) | 0.0 [0.0, 0.0] |
| 26.1 High‐income setting | 0 | 0 | Mean Difference (IV, Random, 95% CI) | 0.0 [0.0, 0.0] |
| 26.2 Low‐income setting | 0 | 0 | Mean Difference (IV, Random, 95% CI) | 0.0 [0.0, 0.0] |
| 27 Surgical evacuation of retained products of conception Show forest plot | 3 | 4636 | Risk Ratio (M‐H, Random, 95% CI) | 0.74 [0.32, 1.71] |
| 27.1 High‐income setting | 3 | 4636 | Risk Ratio (M‐H, Random, 95% CI) | 0.74 [0.32, 1.71] |
| 27.2 Low‐income setting | 0 | 0 | Risk Ratio (M‐H, Random, 95% CI) | 0.0 [0.0, 0.0] |
| 28 Afterpains ‐ abdominal pain associated with the contracting uterus in the postpartum period. Show forest plot | 1 | 1429 | Risk Ratio (M‐H, Random, 95% CI) | 2.53 [1.34, 4.78] |
| 28.1 High‐income setting | 1 | 1429 | Risk Ratio (M‐H, Random, 95% CI) | 2.53 [1.34, 4.78] |
| 28.2 Low‐income setting | 0 | 0 | Risk Ratio (M‐H, Random, 95% CI) | 0.0 [0.0, 0.0] |
| 29 Apgar score < 7 at 5 minutes Show forest plot | 1 | 1695 | Risk Ratio (M‐H, Random, 95% CI) | 1.00 [0.38, 2.66] |
| 29.1 High‐income setting | 1 | 1695 | Risk Ratio (M‐H, Random, 95% CI) | 1.00 [0.38, 2.66] |
| 29.2 Low‐income setting | 0 | 0 | Risk Ratio (M‐H, Random, 95% CI) | 0.0 [0.0, 0.0] |
| 30 Birthweight Show forest plot | 2 | 3207 | Mean Difference (IV, Random, 95% CI) | ‐76.90 [‐108.51, ‐45.30] |
| 30.1 High‐income setting | 2 | 3207 | Mean Difference (IV, Random, 95% CI) | ‐76.90 [‐108.51, ‐45.30] |
| 30.2 Low‐income setting | 0 | 0 | Mean Difference (IV, Random, 95% CI) | 0.0 [0.0, 0.0] |
| 31 Neonatal encephalopathy assessed using Sarnat staging (Sarnat 1976; Table 1). | 0 | 0 | Risk Ratio (M‐H, Random, 95% CI) | 0.0 [0.0, 0.0] |
| 31.1 High‐income setting | 0 | 0 | Risk Ratio (M‐H, Random, 95% CI) | 0.0 [0.0, 0.0] |
| 31.2 Low‐income setting | 0 | 0 | Risk Ratio (M‐H, Random, 95% CI) | 0.0 [0.0, 0.0] |
| 32 Neonatal mortality | 0 | 0 | Risk Ratio (M‐H, Random, 95% CI) | 0.0 [0.0, 0.0] |
| 32.1 High‐income setting | 0 | 0 | Risk Ratio (M‐H, Random, 95% CI) | 0.0 [0.0, 0.0] |
| 32.2 Low‐income setting | 0 | 0 | Risk Ratio (M‐H, Random, 95% CI) | 0.0 [0.0, 0.0] |
| 33 Intraventricular haemorrhage ‐ Papille grade III/IV ‐ (for infants born before 34 weeks' gestation only). | 0 | 0 | Risk Ratio (M‐H, Random, 95% CI) | 0.0 [0.0, 0.0] |
| 33.1 High‐income setting | 0 | 0 | Risk Ratio (M‐H, Random, 95% CI) | 0.0 [0.0, 0.0] |
| 33.2 Low‐income setting | 0 | 0 | Risk Ratio (M‐H, Random, 95% CI) | 0.0 [0.0, 0.0] |
| 34 Number of infants who received a red blood cell transfusion. | 0 | 0 | Risk Ratio (M‐H, Random, 95% CI) | 0.0 [0.0, 0.0] |
| 34.1 High‐income setting | 0 | 0 | Risk Ratio (M‐H, Random, 95% CI) | 0.0 [0.0, 0.0] |
| 34.2 Low‐income setting | 0 | 0 | Risk Ratio (M‐H, Random, 95% CI) | 0.0 [0.0, 0.0] |
| 35 Infant Hb level at 24 to 72 hours | 0 | 0 | Mean Difference (IV, Random, 95% CI) | 0.0 [0.0, 0.0] |
| 35.1 High‐income setting | 0 | 0 | Mean Difference (IV, Random, 95% CI) | 0.0 [0.0, 0.0] |
| 35.2 Low‐income setting | 0 | 0 | Mean Difference (IV, Random, 95% CI) | 0.0 [0.0, 0.0] |
| 36 Infant Hb level at 3‐6 months | 0 | 0 | Mean Difference (IV, Random, 95% CI) | 0.0 [0.0, 0.0] |
| 36.1 High‐income setting | 0 | 0 | Mean Difference (IV, Random, 95% CI) | 0.0 [0.0, 0.0] |
| 36.2 Low‐income setting | 0 | 0 | Mean Difference (IV, Random, 95% CI) | 0.0 [0.0, 0.0] |
| 37 Infant iron indices (ferritin) at 3 to 6 months. | 0 | 0 | Risk Ratio (M‐H, Random, 95% CI) | 0.0 [0.0, 0.0] |
| 37.1 High‐income setting | 0 | 0 | Risk Ratio (M‐H, Random, 95% CI) | 0.0 [0.0, 0.0] |
| 37.2 Low‐income setting | 0 | 0 | Risk Ratio (M‐H, Random, 95% CI) | 0.0 [0.0, 0.0] |
| 38 Exclusive breastfeeding at discharge from hospital Show forest plot | 1 | 1695 | Risk Ratio (M‐H, Random, 95% CI) | 1.01 [0.96, 1.07] |
| 38.1 High‐income setting | 1 | 1695 | Risk Ratio (M‐H, Random, 95% CI) | 1.01 [0.96, 1.07] |
| 38.2 Low‐income setting | 0 | 0 | Risk Ratio (M‐H, Random, 95% CI) | 0.0 [0.0, 0.0] |
| 39 Neurodevelopmental, cognitive or developmental outcomes assessed after age 18 months. | 0 | 0 | Risk Ratio (M‐H, Random, 95% CI) | 0.0 [0.0, 0.0] |
| 39.1 High‐income setting | 0 | 0 | Risk Ratio (M‐H, Random, 95% CI) | 0.0 [0.0, 0.0] |
| 39.2 Low‐income setting | 0 | 0 | Risk Ratio (M‐H, Random, 95% CI) | 0.0 [0.0, 0.0] |
| 40 Return to hospital as in‐ or outpatient because of bleeding (not pre‐specified) Show forest plot | 2 | 2941 | Risk Ratio (M‐H, Random, 95% CI) | 2.21 [1.29, 3.79] |
| 40.1 High‐income setting | 2 | 2941 | Risk Ratio (M‐H, Random, 95% CI) | 2.21 [1.29, 3.79] |
| 40.2 Low‐income setting | 0 | 0 | Risk Ratio (M‐H, Random, 95% CI) | 0.0 [0.0, 0.0] |
| 41 Postnatal maternal mean Hb (outcome not pre‐specified) Show forest plot | 3 | 4062 | Mean Difference (IV, Random, 95% CI) | 0.52 [0.44, 0.60] |
| 41.1 High‐income setting | 3 | 4062 | Mean Difference (IV, Random, 95% CI) | 0.52 [0.44, 0.60] |
| 41.2 Low‐income setting | 0 | 0 | Mean Difference (IV, Random, 95% CI) | 0.0 [0.0, 0.0] |
| Outcome or subgroup title | No. of studies | No. of participants | Statistical method | Effect size |
| 1 Severe primary PPH at time of birth (clinically estimated or measured blood loss ≥ 1000 mL) Show forest plot | 2 | 2941 | Risk Ratio (M‐H, Random, 95% CI) | 0.31 [0.05, 2.17] |
| 1.1 High‐income setting | 2 | 2941 | Risk Ratio (M‐H, Random, 95% CI) | 0.31 [0.05, 2.17] |
| 1.2 Low‐income setting | 0 | 0 | Risk Ratio (M‐H, Random, 95% CI) | 0.0 [0.0, 0.0] |
| 2 Very severe primary PPH at time of birth (clinically estimated or measured blood loss ≥ 2500 mL) | 0 | 0 | Risk Ratio (M‐H, Random, 95% CI) | 0.0 [0.0, 0.0] |
| 2.1 High‐income setting | 0 | 0 | Risk Ratio (M‐H, Random, 95% CI) | 0.0 [0.0, 0.0] |
| 2.2 Low‐income setting | 0 | 0 | Risk Ratio (M‐H, Random, 95% CI) | 0.0 [0.0, 0.0] |
| 3 Maternal mortality | 0 | 0 | Risk Ratio (M‐H, Random, 95% CI) | 0.0 [0.0, 0.0] |
| 3.1 High‐income setting | 0 | 0 | Risk Ratio (M‐H, Random, 95% CI) | 0.0 [0.0, 0.0] |
| 3.2 Low‐income setting | 0 | 0 | Risk Ratio (M‐H, Random, 95% CI) | 0.0 [0.0, 0.0] |
| 4 Maternal Hb < 9 g/dL at 24‐72 hr Show forest plot | 1 | 193 | Risk Ratio (M‐H, Random, 95% CI) | 0.17 [0.02, 1.47] |
| 4.1 High‐income setting | 1 | 193 | Risk Ratio (M‐H, Random, 95% CI) | 0.17 [0.02, 1.47] |
| 4.2 Low‐income setting | 0 | 0 | Risk Ratio (M‐H, Random, 95% CI) | 0.0 [0.0, 0.0] |
| 5 Admission to neonatal special/intensive care Show forest plot | 1 | 1512 | Risk Ratio (M‐H, Random, 95% CI) | 1.02 [0.55, 1.88] |
| 5.1 High‐income setting | 1 | 1512 | Risk Ratio (M‐H, Random, 95% CI) | 1.02 [0.55, 1.88] |
| 5.2 Low‐income setting | 0 | 0 | Risk Ratio (M‐H, Random, 95% CI) | 0.0 [0.0, 0.0] |
| 6 Neonatal jaundice requiring phototherapy or exchange transfusion Show forest plot | 1 | 1447 | Risk Ratio (M‐H, Random, 95% CI) | 1.31 [0.78, 2.18] |
| 6.1 High‐income setting | 1 | 1447 | Risk Ratio (M‐H, Random, 95% CI) | 1.31 [0.78, 2.18] |
| 6.2 Low‐income setting | 0 | 0 | Risk Ratio (M‐H, Random, 95% CI) | 0.0 [0.0, 0.0] |
| 7 Neonatal polycythaemia treated with dilutional exchange transfusion | 0 | 0 | Risk Ratio (M‐H, Random, 95% CI) | 0.0 [0.0, 0.0] |
| 7.1 High‐income setting | 0 | 0 | Risk Ratio (M‐H, Random, 95% CI) | 0.0 [0.0, 0.0] |
| 7.2 Low‐income setting | 0 | 0 | Risk Ratio (M‐H, Random, 95% CI) | 0.0 [0.0, 0.0] |
| 8 Severe primary PPH after placental delivery and up to 24 hours (clinically estimated or measured blood loss ≥ 1000 mL) | 0 | 0 | Risk Ratio (M‐H, Random, 95% CI) | 0.0 [0.0, 0.0] |
| 8.1 High‐income setting | 0 | 0 | Risk Ratio (M‐H, Random, 95% CI) | 0.0 [0.0, 0.0] |
| 8.2 Low‐income setting | 0 | 0 | Risk Ratio (M‐H, Random, 95% CI) | 0.0 [0.0, 0.0] |
| 9 Severe primary PPH at time of birth and up to 24 hours (clinically estimated or measured blood loss ≥ 1000 mL) | 0 | 0 | Risk Ratio (M‐H, Random, 95% CI) | 0.0 [0.0, 0.0] |
| 9.1 High‐income setting | 0 | 0 | Risk Ratio (M‐H, Random, 95% CI) | 0.0 [0.0, 0.0] |
| 9.2 Low‐income setting | 0 | 0 | Risk Ratio (M‐H, Random, 95% CI) | 0.0 [0.0, 0.0] |
| 10 Primary blood loss ≥ 500 mL at time of birth (clinically estimated or measured) Show forest plot | 2 | 2941 | Risk Ratio (M‐H, Random, 95% CI) | 0.33 [0.20, 0.56] |
| 10.1 High‐income setting | 2 | 2941 | Risk Ratio (M‐H, Random, 95% CI) | 0.33 [0.20, 0.56] |
| 10.2 Low‐income setting | 0 | 0 | Risk Ratio (M‐H, Random, 95% CI) | 0.0 [0.0, 0.0] |
| 11 Primary blood loss ≥ 500 mL after delivery of placenta and up to 24 hours (clinically estimated or measured) | 0 | 0 | Risk Ratio (M‐H, Random, 95% CI) | 0.0 [0.0, 0.0] |
| 11.1 High‐income setting | 0 | 0 | Risk Ratio (M‐H, Random, 95% CI) | 0.0 [0.0, 0.0] |
| 11.2 Low‐income setting | 0 | 0 | Risk Ratio (M‐H, Random, 95% CI) | 0.0 [0.0, 0.0] |
| 12 Primary blood loss ≥ 500 mL at time of birth and up to 24 hours (clinically estimated or measured) | 0 | 0 | Risk Ratio (M‐H, Random, 95% CI) | 0.0 [0.0, 0.0] |
| 12.1 High‐income setting | 0 | 0 | Risk Ratio (M‐H, Random, 95% CI) | 0.0 [0.0, 0.0] |
| 12.2 Low‐income setting | 0 | 0 | Risk Ratio (M‐H, Random, 95% CI) | 0.0 [0.0, 0.0] |
| 13 Mean maternal blood loss (mL at the time of birth, clinically estimated or measured Show forest plot | 2 | 2941 | Mean Difference (IV, Random, 95% CI) | ‐78.80 [‐95.96, ‐61.64] |
| 13.1 High‐income setting | 2 | 2941 | Mean Difference (IV, Random, 95% CI) | ‐78.80 [‐95.96, ‐61.64] |
| 13.2 Low‐income setting | 0 | 0 | Mean Difference (IV, Random, 95% CI) | 0.0 [0.0, 0.0] |
| 14 Mean maternal blood loss (mL) after delivery of placenta and up to 24 hours (clinically estimated or measured) | 0 | 0 | Mean Difference (IV, Random, 95% CI) | 0.0 [0.0, 0.0] |
| 14.1 High‐income setting | 0 | 0 | Mean Difference (IV, Random, 95% CI) | 0.0 [0.0, 0.0] |
| 14.2 Low‐income setting | 0 | 0 | Mean Difference (IV, Random, 95% CI) | 0.0 [0.0, 0.0] |
| 15 Mean maternal blood loss (mL) at time of birth and up to 24 hours (clinically estimated or measured) | 0 | 0 | Mean Difference (IV, Random, 95% CI) | 0.0 [0.0, 0.0] |
| 15.1 High‐income setting | 0 | 0 | Mean Difference (IV, Random, 95% CI) | 0.0 [0.0, 0.0] |
| 15.2 Low‐income setting | 0 | 0 | Mean Difference (IV, Random, 95% CI) | 0.0 [0.0, 0.0] |
| 16 Maternal blood transfusion Show forest plot | 3 | 3134 | Risk Ratio (M‐H, Random, 95% CI) | 0.30 [0.10, 0.88] |
| 16.1 High‐income setting | 3 | 3134 | Risk Ratio (M‐H, Random, 95% CI) | 0.30 [0.10, 0.88] |
| 16.2 Low‐income setting | 0 | 0 | Risk Ratio (M‐H, Random, 95% CI) | 0.0 [0.0, 0.0] |
| 17 Clinical signs of severe blood loss | 0 | 0 | Risk Ratio (M‐H, Random, 95% CI) | 0.0 [0.0, 0.0] |
| 17.1 High‐income setting | 0 | 0 | Risk Ratio (M‐H, Random, 95% CI) | 0.0 [0.0, 0.0] |
| 17.2 Low‐income setting | 0 | 0 | Risk Ratio (M‐H, Random, 95% CI) | 0.0 [0.0, 0.0] |
| 18 Therapeutic uterotonics during third stage and/or within 24 hours Show forest plot | 3 | 3134 | Risk Ratio (M‐H, Random, 95% CI) | 0.15 [0.11, 0.21] |
| 18.1 High‐income setting | 3 | 3134 | Risk Ratio (M‐H, Random, 95% CI) | 0.15 [0.11, 0.21] |
| 18.2 Low‐income setting | 0 | 0 | Risk Ratio (M‐H, Random, 95% CI) | 0.0 [0.0, 0.0] |
| 19 Mean length of third stage Show forest plot | 1 | 1429 | Mean Difference (IV, Random, 95% CI) | ‐0.30 [‐1.87, 1.27] |
| 19.1 High‐income setting | 1 | 1429 | Mean Difference (IV, Random, 95% CI) | ‐0.30 [‐1.87, 1.27] |
| 19.2 Low‐income setting | 0 | 0 | Mean Difference (IV, Random, 95% CI) | 0.0 [0.0, 0.0] |
| 20 Manual removal of placenta as defined by authors Show forest plot | 3 | 3134 | Risk Ratio (M‐H, Random, 95% CI) | 3.58 [0.42, 30.61] |
| 20.1 High‐income setting | 3 | 3134 | Risk Ratio (M‐H, Random, 95% CI) | 3.58 [0.42, 30.61] |
| 20.2 Low‐income setting | 0 | 0 | Risk Ratio (M‐H, Random, 95% CI) | 0.0 [0.0, 0.0] |
| 21 Postnatal diastolic blood pressure > 90 mmHg between birth of baby and discharge from the labour ward. Show forest plot | 2 | 2941 | Risk Ratio (M‐H, Random, 95% CI) | 7.00 [2.99, 16.43] |
| 21.1 High‐income setting | 2 | 2941 | Risk Ratio (M‐H, Random, 95% CI) | 7.00 [2.99, 16.43] |
| 21.2 Low‐income setting | 0 | 0 | Risk Ratio (M‐H, Random, 95% CI) | 0.0 [0.0, 0.0] |
| 22 Postnatal vomiting between birth of baby and discharge from the labour ward. Show forest plot | 2 | 2941 | Risk Ratio (M‐H, Random, 95% CI) | 5.63 [0.69, 46.08] |
| 22.1 High‐income setting | 2 | 2941 | Risk Ratio (M‐H, Random, 95% CI) | 5.63 [0.69, 46.08] |
| 22.2 Low‐income setting | 0 | 0 | Risk Ratio (M‐H, Random, 95% CI) | 0.0 [0.0, 0.0] |
| 23 Any analgesia between birth of the baby and up to discharge from labour ward Show forest plot | 1 | 1429 | Risk Ratio (M‐H, Random, 95% CI) | 2.53 [1.34, 4.78] |
| 23.1 High‐income setting | 1 | 1429 | Risk Ratio (M‐H, Random, 95% CI) | 2.53 [1.34, 4.78] |
| 23.2 Low‐income setting | 0 | 0 | Risk Ratio (M‐H, Random, 95% CI) | 0.0 [0.0, 0.0] |
| 24 Women's assessment of pain during third stage as reported by authors. | 0 | 0 | Risk Ratio (M‐H, Random, 95% CI) | 0.0 [0.0, 0.0] |
| 24.1 High‐income setting | 0 | 0 | Risk Ratio (M‐H, Random, 95% CI) | 0.0 [0.0, 0.0] |
| 24.2 Low‐income setting | 0 | 0 | Risk Ratio (M‐H, Random, 95% CI) | 0.0 [0.0, 0.0] |
| 25 Secondary blood loss/any vaginal bleeding needing treatment (after 24 hours and up to 6 weeks) Show forest plot | 2 | 2941 | Risk Ratio (M‐H, Random, 95% CI) | 1.78 [0.69, 4.60] |
| 25.1 High‐income setting | 2 | 2941 | Risk Ratio (M‐H, Random, 95% CI) | 1.78 [0.69, 4.60] |
| 25.2 Low‐income setting | 0 | 0 | Risk Ratio (M‐H, Random, 95% CI) | 0.0 [0.0, 0.0] |
| 26 Amount of lochia either estimated or measured after 24 hours and up to discharge from hospital. | 0 | 0 | Mean Difference (IV, Random, 95% CI) | 0.0 [0.0, 0.0] |
| 26.1 High‐income setting | 0 | 0 | Mean Difference (IV, Random, 95% CI) | 0.0 [0.0, 0.0] |
| 26.2 Low‐income setting | 0 | 0 | Mean Difference (IV, Random, 95% CI) | 0.0 [0.0, 0.0] |
| 27 Surgical evacuation of retained products of conception Show forest plot | 2 | 2941 | Risk Ratio (M‐H, Random, 95% CI) | 0.69 [0.12, 3.98] |
| 27.1 High‐income setting | 2 | 2941 | Risk Ratio (M‐H, Random, 95% CI) | 0.69 [0.12, 3.98] |
| 27.2 Low‐income setting | 0 | 0 | Risk Ratio (M‐H, Random, 95% CI) | 0.0 [0.0, 0.0] |
| 28 Afterpains ‐ abdominal pain associated with the contracting uterus in the postpartum period. Show forest plot | 1 | 1429 | Risk Ratio (M‐H, Random, 95% CI) | 2.53 [1.34, 4.78] |
| 28.1 High‐income setting | 1 | 1429 | Risk Ratio (M‐H, Random, 95% CI) | 2.53 [1.34, 4.78] |
| 28.2 Low‐income setting | 0 | 0 | Risk Ratio (M‐H, Random, 95% CI) | 0.0 [0.0, 0.0] |
| 29 Apgar score < 7 at 5 minutes | 0 | 0 | Risk Ratio (M‐H, Random, 95% CI) | 0.0 [0.0, 0.0] |
| 29.1 High‐income setting | 0 | 0 | Risk Ratio (M‐H, Random, 95% CI) | 0.0 [0.0, 0.0] |
| 29.2 Low‐income setting | 0 | 0 | Risk Ratio (M‐H, Random, 95% CI) | 0.0 [0.0, 0.0] |
| 30 Birthweight Show forest plot | 1 | 1512 | Mean Difference (IV, Random, 95% CI) | ‐67.0 [‐114.13, ‐19.87] |
| 30.1 High‐income setting | 1 | 1512 | Mean Difference (IV, Random, 95% CI) | ‐67.0 [‐114.13, ‐19.87] |
| 30.2 Low‐income setting | 0 | 0 | Mean Difference (IV, Random, 95% CI) | 0.0 [0.0, 0.0] |
| 31 Neonatal encephalopathy assessed using Sarnat staging (Sarnat 1976; Table 1). | 0 | 0 | Risk Ratio (M‐H, Random, 95% CI) | 0.0 [0.0, 0.0] |
| 31.1 High‐income setting | 0 | 0 | Risk Ratio (M‐H, Random, 95% CI) | 0.0 [0.0, 0.0] |
| 31.2 Low‐income setting | 0 | 0 | Risk Ratio (M‐H, Random, 95% CI) | 0.0 [0.0, 0.0] |
| 32 Neonatal mortality | 0 | 0 | Risk Ratio (M‐H, Random, 95% CI) | 0.0 [0.0, 0.0] |
| 32.1 High‐income setting | 0 | 0 | Risk Ratio (M‐H, Random, 95% CI) | 0.0 [0.0, 0.0] |
| 32.2 Low‐income setting | 0 | 0 | Risk Ratio (M‐H, Random, 95% CI) | 0.0 [0.0, 0.0] |
| 33 Intraventricular haemorrhage ‐ Papille grade III/IV ‐ (for infants born before 34 weeks' gestation only). | 0 | 0 | Risk Ratio (M‐H, Random, 95% CI) | 0.0 [0.0, 0.0] |
| 33.1 High‐income setting | 0 | 0 | Risk Ratio (M‐H, Random, 95% CI) | 0.0 [0.0, 0.0] |
| 33.2 Low‐income setting | 0 | 0 | Risk Ratio (M‐H, Random, 95% CI) | 0.0 [0.0, 0.0] |
| 34 Number of infants exposed to one or more red blood cell transfusions | 0 | 0 | Risk Ratio (M‐H, Random, 95% CI) | 0.0 [0.0, 0.0] |
| 34.1 High‐income setting | 0 | 0 | Risk Ratio (M‐H, Random, 95% CI) | 0.0 [0.0, 0.0] |
| 34.2 Low‐income setting | 0 | 0 | Risk Ratio (M‐H, Random, 95% CI) | 0.0 [0.0, 0.0] |
| 35 Infant Hb level at 24 to 72 hours | 0 | 0 | Mean Difference (IV, Random, 95% CI) | 0.0 [0.0, 0.0] |
| 35.1 High‐income setting | 0 | 0 | Mean Difference (IV, Random, 95% CI) | 0.0 [0.0, 0.0] |
| 35.2 Low‐income setting | 0 | 0 | Mean Difference (IV, Random, 95% CI) | 0.0 [0.0, 0.0] |
| 36 Infant Hb level at 3‐6 months | 0 | 0 | Mean Difference (IV, Random, 95% CI) | 0.0 [0.0, 0.0] |
| 36.1 High‐income setting | 0 | 0 | Mean Difference (IV, Random, 95% CI) | 0.0 [0.0, 0.0] |
| 36.2 Low‐income setting | 0 | 0 | Mean Difference (IV, Random, 95% CI) | 0.0 [0.0, 0.0] |
| 37 Infant iron indices (ferritin) at 3 to 6 months. | 0 | 0 | Risk Ratio (M‐H, Random, 95% CI) | 0.0 [0.0, 0.0] |
| 37.1 High‐income setting | 0 | 0 | Risk Ratio (M‐H, Random, 95% CI) | 0.0 [0.0, 0.0] |
| 37.2 Low‐income setting | 0 | 0 | Risk Ratio (M‐H, Random, 95% CI) | 0.0 [0.0, 0.0] |
| 38 Exclusive breastfeeding at discharge from hospital | 0 | 0 | Risk Ratio (M‐H, Random, 95% CI) | 0.0 [0.0, 0.0] |
| 38.1 High‐income setting | 0 | 0 | Risk Ratio (M‐H, Random, 95% CI) | 0.0 [0.0, 0.0] |
| 38.2 Low‐income setting | 0 | 0 | Risk Ratio (M‐H, Random, 95% CI) | 0.0 [0.0, 0.0] |
| 39 Neurodevelopmental, cognitive or developmental outcomes assessed after age 18 months. | 0 | 0 | Risk Ratio (M‐H, Random, 95% CI) | 0.0 [0.0, 0.0] |
| 39.1 High‐income setting | 0 | 0 | Risk Ratio (M‐H, Random, 95% CI) | 0.0 [0.0, 0.0] |
| 39.2 Low‐income setting | 0 | 0 | Risk Ratio (M‐H, Random, 95% CI) | 0.0 [0.0, 0.0] |
| 40 Return to hospital as in‐ or outpatient because of bleeding (not pre‐specified) Show forest plot | 2 | 2941 | Risk Ratio (M‐H, Random, 95% CI) | 2.21 [1.29, 3.79] |
| 40.1 High‐income setting | 2 | 2941 | Risk Ratio (M‐H, Random, 95% CI) | 2.21 [1.29, 3.79] |
| 40.2 Low‐income setting | 0 | 0 | Risk Ratio (M‐H, Random, 95% CI) | 0.0 [0.0, 0.0] |
| 41 Postnatal maternal mean Hb (outcome not pre‐specified) Show forest plot | 2 | 2683 | Mean Difference (IV, Random, 95% CI) | 0.5 [0.41, 0.59] |
| 41.1 High‐income setting | 2 | 2683 | Mean Difference (IV, Random, 95% CI) | 0.5 [0.41, 0.59] |
| 41.2 Low‐income setting | 0 | 0 | Mean Difference (IV, Random, 95% CI) | 0.0 [0.0, 0.0] |
| Outcome or subgroup title | No. of studies | No. of participants | Statistical method | Effect size |
| 1 Severe primary PPH at time of birth (clinically estimated or measured blood loss ≥ 1000 mL) | 0 | 0 | Risk Ratio (M‐H, Random, 95% CI) | 0.0 [0.0, 0.0] |
| 1.1 High‐income setting | 0 | 0 | Risk Ratio (M‐H, Random, 95% CI) | 0.0 [0.0, 0.0] |
| 1.2 Low‐income setting | 0 | 0 | Risk Ratio (M‐H, Random, 95% CI) | 0.0 [0.0, 0.0] |
| 2 Very severe primary PPH at time of birth (clinically estimated or measured blood loss ≥ 2500 mL) | 0 | 0 | Risk Ratio (M‐H, Random, 95% CI) | 0.0 [0.0, 0.0] |
| 2.1 High‐income setting | 0 | 0 | Risk Ratio (M‐H, Random, 95% CI) | 0.0 [0.0, 0.0] |
| 2.2 Low‐income setting | 0 | 0 | Risk Ratio (M‐H, Random, 95% CI) | 0.0 [0.0, 0.0] |
| 3 Maternal mortality | 0 | 0 | Risk Ratio (M‐H, Random, 95% CI) | 0.0 [0.0, 0.0] |
| 3.1 High‐income setting | 0 | 0 | Risk Ratio (M‐H, Random, 95% CI) | 0.0 [0.0, 0.0] |
| 3.2 Low‐income setting | 0 | 0 | Risk Ratio (M‐H, Random, 95% CI) | 0.0 [0.0, 0.0] |
| 4 Maternal Hb < 9 g/dL at 24‐72 hr | 0 | 0 | Risk Ratio (M‐H, Random, 95% CI) | 0.0 [0.0, 0.0] |
| 4.1 High‐income setting | 0 | 0 | Risk Ratio (M‐H, Random, 95% CI) | 0.0 [0.0, 0.0] |
| 4.2 Low‐income setting | 0 | 0 | Risk Ratio (M‐H, Random, 95% CI) | 0.0 [0.0, 0.0] |
| 5 Admission to neonatal special/intensive care | 0 | 0 | Risk Ratio (M‐H, Random, 95% CI) | 0.0 [0.0, 0.0] |
| 5.1 High‐income setting | 0 | 0 | Risk Ratio (M‐H, Random, 95% CI) | 0.0 [0.0, 0.0] |
| 5.2 Low‐income setting | 0 | 0 | Risk Ratio (M‐H, Random, 95% CI) | 0.0 [0.0, 0.0] |
| 6 Neonatal jaundice requiring phototherapy or exchange transfusion | 0 | 0 | Risk Ratio (M‐H, Random, 95% CI) | 0.0 [0.0, 0.0] |
| 6.1 High‐income setting | 0 | 0 | Risk Ratio (M‐H, Random, 95% CI) | 0.0 [0.0, 0.0] |
| 6.2 Low‐income setting | 0 | 0 | Risk Ratio (M‐H, Random, 95% CI) | 0.0 [0.0, 0.0] |
| 7 Neonatal polycythaemia treated with dilutional exchange transfusion | 0 | 0 | Risk Ratio (M‐H, Random, 95% CI) | 0.0 [0.0, 0.0] |
| 7.1 High‐income setting | 0 | 0 | Risk Ratio (M‐H, Random, 95% CI) | 0.0 [0.0, 0.0] |
| 7.2 Low‐income setting | 0 | 0 | Risk Ratio (M‐H, Random, 95% CI) | 0.0 [0.0, 0.0] |
| Outcome or subgroup title | No. of studies | No. of participants | Statistical method | Effect size |
| 1 Severe primary PPH at time of birth (clinically estimated or measured blood loss ≥ 1000 mL) | 0 | 0 | Risk Ratio (M‐H, Random, 95% CI) | 0.0 [0.0, 0.0] |
| 1.1 High‐income setting | 0 | 0 | Risk Ratio (M‐H, Random, 95% CI) | 0.0 [0.0, 0.0] |
| 1.2 Low‐income setting | 0 | 0 | Risk Ratio (M‐H, Random, 95% CI) | 0.0 [0.0, 0.0] |
| 2 Very severe primary PPH at time of birth (clinically estimated or measured blood loss ≥ 2500 mL) | 0 | 0 | Risk Ratio (M‐H, Random, 95% CI) | 0.0 [0.0, 0.0] |
| 2.1 High‐income setting | 0 | 0 | Risk Ratio (M‐H, Random, 95% CI) | 0.0 [0.0, 0.0] |
| 2.2 Low‐income setting | 0 | 0 | Risk Ratio (M‐H, Random, 95% CI) | 0.0 [0.0, 0.0] |
| 3 Maternal mortality | 0 | 0 | Risk Ratio (M‐H, Random, 95% CI) | 0.0 [0.0, 0.0] |
| 3.1 High‐income setting | 0 | 0 | Risk Ratio (M‐H, Random, 95% CI) | 0.0 [0.0, 0.0] |
| 3.2 Low‐income setting | 0 | 0 | Risk Ratio (M‐H, Random, 95% CI) | 0.0 [0.0, 0.0] |
| 4 Maternal Hb < 9 g/dL at 24‐72 hr | 0 | 0 | Risk Ratio (M‐H, Random, 95% CI) | 0.0 [0.0, 0.0] |
| 4.1 High‐income setting | 0 | 0 | Risk Ratio (M‐H, Random, 95% CI) | 0.0 [0.0, 0.0] |
| 4.2 Low‐income setting | 0 | 0 | Risk Ratio (M‐H, Random, 95% CI) | 0.0 [0.0, 0.0] |
| 5 Admission to neonatal special/intensive care | 0 | 0 | Risk Ratio (M‐H, Random, 95% CI) | 0.0 [0.0, 0.0] |
| 5.1 High‐income setting | 0 | 0 | Risk Ratio (M‐H, Random, 95% CI) | 0.0 [0.0, 0.0] |
| 5.2 Low‐income setting | 0 | 0 | Risk Ratio (M‐H, Random, 95% CI) | 0.0 [0.0, 0.0] |
| 6 Neonatal jaundice requiring phototherapy or exchange transfusion | 0 | 0 | Risk Ratio (M‐H, Random, 95% CI) | 0.0 [0.0, 0.0] |
| 6.1 High‐income setting | 0 | 0 | Risk Ratio (M‐H, Random, 95% CI) | 0.0 [0.0, 0.0] |
| 6.2 Low‐income setting | 0 | 0 | Risk Ratio (M‐H, Random, 95% CI) | 0.0 [0.0, 0.0] |
| 7 Neonatal polycythaemia treated with dilutional exchange transfusion | 0 | 0 | Risk Ratio (M‐H, Random, 95% CI) | 0.0 [0.0, 0.0] |
| 7.1 High‐income setting | 0 | 0 | Risk Ratio (M‐H, Random, 95% CI) | 0.0 [0.0, 0.0] |
| 7.2 Low‐income setting | 0 | 0 | Risk Ratio (M‐H, Random, 95% CI) | 0.0 [0.0, 0.0] |
| Outcome or subgroup title | No. of studies | No. of participants | Statistical method | Effect size |
| 1 Severe primary PPH at time of birth (clinically estimated or measured blood loss ≥ 1000 mL) | 0 | 0 | Risk Ratio (M‐H, Random, 95% CI) | 0.0 [0.0, 0.0] |
| 1.1 High‐income setting | 0 | 0 | Risk Ratio (M‐H, Random, 95% CI) | 0.0 [0.0, 0.0] |
| 1.2 Low‐income setting | 0 | 0 | Risk Ratio (M‐H, Random, 95% CI) | 0.0 [0.0, 0.0] |
| 2 Very severe primary PPH at time of birth (clinically estimated or measured blood loss ≥ 2500 mL) | 0 | 0 | Risk Ratio (M‐H, Random, 95% CI) | 0.0 [0.0, 0.0] |
| 2.1 High‐income setting | 0 | 0 | Risk Ratio (M‐H, Random, 95% CI) | 0.0 [0.0, 0.0] |
| 2.2 Low‐income setting | 0 | 0 | Risk Ratio (M‐H, Random, 95% CI) | 0.0 [0.0, 0.0] |
| 3 Maternal mortality | 0 | 0 | Risk Ratio (M‐H, Random, 95% CI) | 0.0 [0.0, 0.0] |
| 3.1 High‐income setting | 0 | 0 | Risk Ratio (M‐H, Random, 95% CI) | 0.0 [0.0, 0.0] |
| 3.2 Low‐income setting | 0 | 0 | Risk Ratio (M‐H, Random, 95% CI) | 0.0 [0.0, 0.0] |
| 4 Maternal Hb < 9 g/dL at 24‐72 hr | 0 | 0 | Risk Ratio (M‐H, Random, 95% CI) | 0.0 [0.0, 0.0] |
| 4.1 High‐income setting | 0 | 0 | Risk Ratio (M‐H, Random, 95% CI) | 0.0 [0.0, 0.0] |
| 4.2 Low‐income setting | 0 | 0 | Risk Ratio (M‐H, Random, 95% CI) | 0.0 [0.0, 0.0] |
| 5 Admission to neonatal special/intensive care | 0 | 0 | Risk Ratio (M‐H, Random, 95% CI) | 0.0 [0.0, 0.0] |
| 5.1 High‐income setting | 0 | 0 | Risk Ratio (M‐H, Random, 95% CI) | 0.0 [0.0, 0.0] |
| 5.2 Low‐income setting | 0 | 0 | Risk Ratio (M‐H, Random, 95% CI) | 0.0 [0.0, 0.0] |
| 6 Neonatal jaundice requiring phototherapy or exchange transfusion | 0 | 0 | Risk Ratio (M‐H, Random, 95% CI) | 0.0 [0.0, 0.0] |
| 6.1 High‐income setting | 0 | 0 | Risk Ratio (M‐H, Random, 95% CI) | 0.0 [0.0, 0.0] |
| 6.2 Low‐income setting | 0 | 0 | Risk Ratio (M‐H, Random, 95% CI) | 0.0 [0.0, 0.0] |
| 7 Neonatal polycythaemia treated with dilutional exchange transfusion | 0 | 0 | Risk Ratio (M‐H, Random, 95% CI) | 0.0 [0.0, 0.0] |
| 7.1 High‐income setting | 0 | 0 | Risk Ratio (M‐H, Random, 95% CI) | 0.0 [0.0, 0.0] |
| 7.2 Low‐income setting | 0 | 0 | Risk Ratio (M‐H, Random, 95% CI) | 0.0 [0.0, 0.0] |
| Outcome or subgroup title | No. of studies | No. of participants | Statistical method | Effect size |
| 1 Severe primary PPH at time of birth (clinically estimated or measured blood loss ≥ 1000 mL) | 0 | 0 | Risk Ratio (M‐H, Random, 95% CI) | 0.0 [0.0, 0.0] |
| 1.1 High‐income setting | 0 | 0 | Risk Ratio (M‐H, Random, 95% CI) | 0.0 [0.0, 0.0] |
| 1.2 Low‐income setting | 0 | 0 | Risk Ratio (M‐H, Random, 95% CI) | 0.0 [0.0, 0.0] |
| 2 Very severe primary PPH at time of birth (clinically estimated or measured blood loss ≥ 2500 mL) | 0 | 0 | Risk Ratio (M‐H, Random, 95% CI) | 0.0 [0.0, 0.0] |
| 2.1 High‐income setting | 0 | 0 | Risk Ratio (M‐H, Random, 95% CI) | 0.0 [0.0, 0.0] |
| 2.2 Low‐income setting | 0 | 0 | Risk Ratio (M‐H, Random, 95% CI) | 0.0 [0.0, 0.0] |
| 3 Maternal mortality | 0 | 0 | Risk Ratio (M‐H, Random, 95% CI) | 0.0 [0.0, 0.0] |
| 3.1 High‐income setting | 0 | 0 | Risk Ratio (M‐H, Random, 95% CI) | 0.0 [0.0, 0.0] |
| 3.2 Low‐income setting | 0 | 0 | Risk Ratio (M‐H, Random, 95% CI) | 0.0 [0.0, 0.0] |
| 4 Maternal Hb < 9 g/dL at 24‐72 hr | 0 | 0 | Risk Ratio (M‐H, Random, 95% CI) | 0.0 [0.0, 0.0] |
| 4.1 High‐income setting | 0 | 0 | Risk Ratio (M‐H, Random, 95% CI) | 0.0 [0.0, 0.0] |
| 4.2 Low‐income setting | 0 | 0 | Risk Ratio (M‐H, Random, 95% CI) | 0.0 [0.0, 0.0] |
| 5 Admission to neonatal special/intensive care | 0 | 0 | Risk Ratio (M‐H, Random, 95% CI) | 0.0 [0.0, 0.0] |
| 5.1 High‐income setting | 0 | 0 | Risk Ratio (M‐H, Random, 95% CI) | 0.0 [0.0, 0.0] |
| 5.2 Low‐income setting | 0 | 0 | Risk Ratio (M‐H, Random, 95% CI) | 0.0 [0.0, 0.0] |
| 6 Neonatal jaundice requiring phototherapy or exchange transfusion | 0 | 0 | Risk Ratio (M‐H, Random, 95% CI) | 0.0 [0.0, 0.0] |
| 6.1 High‐income setting | 0 | 0 | Risk Ratio (M‐H, Random, 95% CI) | 0.0 [0.0, 0.0] |
| 6.2 Low‐income setting | 0 | 0 | Risk Ratio (M‐H, Random, 95% CI) | 0.0 [0.0, 0.0] |
| 7 Neonatal polycythaemia treated with dilutional exchange transfusion | 0 | 0 | Risk Ratio (M‐H, Random, 95% CI) | 0.0 [0.0, 0.0] |
| 7.1 High‐income setting | 0 | 0 | Risk Ratio (M‐H, Random, 95% CI) | 0.0 [0.0, 0.0] |
| 7.2 Low‐income setting | 0 | 0 | Risk Ratio (M‐H, Random, 95% CI) | 0.0 [0.0, 0.0] |
| Outcome or subgroup title | No. of studies | No. of participants | Statistical method | Effect size |
| 1 Severe primary PPH at time of birth (clinically estimated or measured blood loss ≥ 1000 mL) | 0 | 0 | Risk Ratio (M‐H, Random, 95% CI) | 0.0 [0.0, 0.0] |
| 1.1 High‐income setting | 0 | 0 | Risk Ratio (M‐H, Random, 95% CI) | 0.0 [0.0, 0.0] |
| 1.2 Low‐income setting | 0 | 0 | Risk Ratio (M‐H, Random, 95% CI) | 0.0 [0.0, 0.0] |
| 2 Very severe primary PPH at time of birth (clinically estimated or measured blood loss ≥ 2500 mL) | 0 | 0 | Risk Ratio (M‐H, Random, 95% CI) | 0.0 [0.0, 0.0] |
| 2.1 High‐income setting | 0 | 0 | Risk Ratio (M‐H, Random, 95% CI) | 0.0 [0.0, 0.0] |
| 2.2 Low‐income setting | 0 | 0 | Risk Ratio (M‐H, Random, 95% CI) | 0.0 [0.0, 0.0] |
| 3 Maternal mortality | 0 | 0 | Risk Ratio (M‐H, Random, 95% CI) | 0.0 [0.0, 0.0] |
| 3.1 High‐income setting | 0 | 0 | Risk Ratio (M‐H, Random, 95% CI) | 0.0 [0.0, 0.0] |
| 3.2 Low‐income setting | 0 | 0 | Risk Ratio (M‐H, Random, 95% CI) | 0.0 [0.0, 0.0] |
| 4 Maternal Hb < 9 g/dL at 24‐72 hr | 0 | 0 | Risk Ratio (M‐H, Random, 95% CI) | 0.0 [0.0, 0.0] |
| 4.1 High‐income setting | 0 | 0 | Risk Ratio (M‐H, Random, 95% CI) | 0.0 [0.0, 0.0] |
| 4.2 Low‐income setting | 0 | 0 | Risk Ratio (M‐H, Random, 95% CI) | 0.0 [0.0, 0.0] |
| 5 Admission to neonatal special/intensive care | 0 | 0 | Risk Ratio (M‐H, Random, 95% CI) | 0.0 [0.0, 0.0] |
| 5.1 High‐income setting | 0 | 0 | Risk Ratio (M‐H, Random, 95% CI) | 0.0 [0.0, 0.0] |
| 5.2 Low‐income setting | 0 | 0 | Risk Ratio (M‐H, Random, 95% CI) | 0.0 [0.0, 0.0] |
| 6 Neonatal jaundice requiring phototherapy or exchange transfusion | 0 | 0 | Risk Ratio (M‐H, Random, 95% CI) | 0.0 [0.0, 0.0] |
| 6.1 High‐income setting | 0 | 0 | Risk Ratio (M‐H, Random, 95% CI) | 0.0 [0.0, 0.0] |
| 6.2 Low‐income setting | 0 | 0 | Risk Ratio (M‐H, Random, 95% CI) | 0.0 [0.0, 0.0] |
| 7 Neonatal polycythaemia treated with dilutional exchange transfusion | 0 | 0 | Risk Ratio (M‐H, Random, 95% CI) | 0.0 [0.0, 0.0] |
| 7.1 High‐income setting | 0 | 0 | Risk Ratio (M‐H, Random, 95% CI) | 0.0 [0.0, 0.0] |
| 7.2 Low‐income setting | 0 | 0 | Risk Ratio (M‐H, Random, 95% CI) | 0.0 [0.0, 0.0] |
| Outcome or subgroup title | No. of studies | No. of participants | Statistical method | Effect size |
| 1 Severe primary PPH at time of birth (clinically estimated or measured blood loss ≥ 1000 mL) | 0 | 0 | Risk Ratio (M‐H, Random, 95% CI) | 0.0 [0.0, 0.0] |
| 1.1 High‐income setting | 0 | 0 | Risk Ratio (M‐H, Random, 95% CI) | 0.0 [0.0, 0.0] |
| 1.2 Low‐income setting | 0 | 0 | Risk Ratio (M‐H, Random, 95% CI) | 0.0 [0.0, 0.0] |
| 2 Very severe primary PPH at time of birth (clinically estimated or measured blood loss ≥ 2500 mL) | 0 | 0 | Risk Ratio (M‐H, Random, 95% CI) | 0.0 [0.0, 0.0] |
| 2.1 High‐income setting | 0 | 0 | Risk Ratio (M‐H, Random, 95% CI) | 0.0 [0.0, 0.0] |
| 2.2 Low‐income setting | 0 | 0 | Risk Ratio (M‐H, Random, 95% CI) | 0.0 [0.0, 0.0] |
| 3 Maternal mortality | 0 | 0 | Risk Ratio (M‐H, Random, 95% CI) | 0.0 [0.0, 0.0] |
| 3.1 High‐income setting | 0 | 0 | Risk Ratio (M‐H, Random, 95% CI) | 0.0 [0.0, 0.0] |
| 3.2 Low‐income setting | 0 | 0 | Risk Ratio (M‐H, Random, 95% CI) | 0.0 [0.0, 0.0] |
| 4 Maternal Hb < 9 g/dL at 24‐72 hr | 0 | 0 | Risk Ratio (M‐H, Random, 95% CI) | 0.0 [0.0, 0.0] |
| 4.1 High‐income setting | 0 | 0 | Risk Ratio (M‐H, Random, 95% CI) | 0.0 [0.0, 0.0] |
| 4.2 Low‐income setting | 0 | 0 | Risk Ratio (M‐H, Random, 95% CI) | 0.0 [0.0, 0.0] |
| 5 Admission to neonatal special/intensive care | 0 | 0 | Risk Ratio (M‐H, Random, 95% CI) | 0.0 [0.0, 0.0] |
| 5.1 High‐income setting | 0 | 0 | Risk Ratio (M‐H, Random, 95% CI) | 0.0 [0.0, 0.0] |
| 5.2 Low‐income setting | 0 | 0 | Risk Ratio (M‐H, Random, 95% CI) | 0.0 [0.0, 0.0] |
| 6 Neonatal jaundice requiring phototherapy or exchange transfusion | 0 | 0 | Risk Ratio (M‐H, Random, 95% CI) | 0.0 [0.0, 0.0] |
| 6.1 High‐income setting | 0 | 0 | Risk Ratio (M‐H, Random, 95% CI) | 0.0 [0.0, 0.0] |
| 6.2 Low‐income setting | 0 | 0 | Risk Ratio (M‐H, Random, 95% CI) | 0.0 [0.0, 0.0] |
| 7 Neonatal polycythaemia treated with dilutional exchange transfusion | 0 | 0 | Risk Ratio (M‐H, Random, 95% CI) | 0.0 [0.0, 0.0] |
| 7.1 High‐income setting | 0 | 0 | Risk Ratio (M‐H, Random, 95% CI) | 0.0 [0.0, 0.0] |
| 7.2 Low‐income setting | 0 | 0 | Risk Ratio (M‐H, Random, 95% CI) | 0.0 [0.0, 0.0] |
| Outcome or subgroup title | No. of studies | No. of participants | Statistical method | Effect size |
| 1 Severe primary PPH at time of birth (clinically estimated or measured blood loss ≥ 1000 mL) | 0 | 0 | Risk Ratio (M‐H, Random, 95% CI) | 0.0 [0.0, 0.0] |
| 1.1 High‐income setting | 0 | 0 | Risk Ratio (M‐H, Random, 95% CI) | 0.0 [0.0, 0.0] |
| 1.2 Low‐income setting | 0 | 0 | Risk Ratio (M‐H, Random, 95% CI) | 0.0 [0.0, 0.0] |
| 2 Very severe primary PPH at time of birth (clinically estimated or measured blood loss ≥ 2500 mL) | 0 | 0 | Risk Ratio (M‐H, Random, 95% CI) | 0.0 [0.0, 0.0] |
| 2.1 High‐income setting | 0 | 0 | Risk Ratio (M‐H, Random, 95% CI) | 0.0 [0.0, 0.0] |
| 2.2 Low‐income setting | 0 | 0 | Risk Ratio (M‐H, Random, 95% CI) | 0.0 [0.0, 0.0] |
| 3 Maternal mortality | 0 | 0 | Risk Ratio (M‐H, Random, 95% CI) | 0.0 [0.0, 0.0] |
| 3.1 High‐income setting | 0 | 0 | Risk Ratio (M‐H, Random, 95% CI) | 0.0 [0.0, 0.0] |
| 3.2 Low‐income setting | 0 | 0 | Risk Ratio (M‐H, Random, 95% CI) | 0.0 [0.0, 0.0] |
| 4 Maternal Hb < 9 g/dL at 24‐72 hr | 0 | 0 | Risk Ratio (M‐H, Random, 95% CI) | 0.0 [0.0, 0.0] |
| 4.1 High‐income setting | 0 | 0 | Risk Ratio (M‐H, Random, 95% CI) | 0.0 [0.0, 0.0] |
| 4.2 Low‐income setting | 0 | 0 | Risk Ratio (M‐H, Random, 95% CI) | 0.0 [0.0, 0.0] |
| 5 Admission to neonatal special/intensive care | 0 | 0 | Risk Ratio (M‐H, Random, 95% CI) | 0.0 [0.0, 0.0] |
| 5.1 High‐income setting | 0 | 0 | Risk Ratio (M‐H, Random, 95% CI) | 0.0 [0.0, 0.0] |
| 5.2 Low‐income setting | 0 | 0 | Risk Ratio (M‐H, Random, 95% CI) | 0.0 [0.0, 0.0] |
| 6 Neonatal jaundice requiring phototherapy or exchange transfusion | 0 | 0 | Risk Ratio (M‐H, Random, 95% CI) | 0.0 [0.0, 0.0] |
| 6.1 High‐income setting | 0 | 0 | Risk Ratio (M‐H, Random, 95% CI) | 0.0 [0.0, 0.0] |
| 6.2 Low‐income setting | 0 | 0 | Risk Ratio (M‐H, Random, 95% CI) | 0.0 [0.0, 0.0] |
| 7 Neonatal polycythaemia treated with dilutional exchange transfusion | 0 | 0 | Risk Ratio (M‐H, Random, 95% CI) | 0.0 [0.0, 0.0] |
| 7.1 High‐income setting | 0 | 0 | Risk Ratio (M‐H, Random, 95% CI) | 0.0 [0.0, 0.0] |
| 7.2 Low‐income setting | 0 | 0 | Risk Ratio (M‐H, Random, 95% CI) | 0.0 [0.0, 0.0] |
| Outcome or subgroup title | No. of studies | No. of participants | Statistical method | Effect size |
| 1 Severe primary PPH at time of birth (clinically estimated or measured blood loss ≥ 1000 mL) Show forest plot | 1 | 1648 | Risk Ratio (M‐H, Random, 95% CI) | 0.23 [0.09, 0.55] |
| 1.1 High‐income setting | 1 | 1648 | Risk Ratio (M‐H, Random, 95% CI) | 0.23 [0.09, 0.55] |
| 1.2 Low‐income setting | 0 | 0 | Risk Ratio (M‐H, Random, 95% CI) | 0.0 [0.0, 0.0] |
| 2 Very severe primary PPH at time of birth (clinically estimated or measured blood loss ≥ 2500 mL) | 0 | 0 | Risk Ratio (M‐H, Random, 95% CI) | 0.0 [0.0, 0.0] |
| 2.1 High‐income setting | 0 | 0 | Risk Ratio (M‐H, Random, 95% CI) | 0.0 [0.0, 0.0] |
| 2.2 Low‐income setting | 0 | 0 | Risk Ratio (M‐H, Random, 95% CI) | 0.0 [0.0, 0.0] |
| 3 Maternal mortality | 0 | 0 | Risk Ratio (M‐H, Random, 95% CI) | 0.0 [0.0, 0.0] |
| 3.1 High‐income setting | 0 | 0 | Risk Ratio (M‐H, Random, 95% CI) | 0.0 [0.0, 0.0] |
| 3.2 Low‐income setting | 0 | 0 | Risk Ratio (M‐H, Random, 95% CI) | 0.0 [0.0, 0.0] |
| 4 Maternal Hb < 9 g/dL at 24‐72 hr | 0 | 0 | Risk Ratio (M‐H, Random, 95% CI) | 0.0 [0.0, 0.0] |
| 4.1 High‐income setting | 0 | 0 | Risk Ratio (M‐H, Random, 95% CI) | 0.0 [0.0, 0.0] |
| 4.2 Low‐income setting | 0 | 0 | Risk Ratio (M‐H, Random, 95% CI) | 0.0 [0.0, 0.0] |
| 5 Admission to neonatal special/intensive care | 0 | 0 | Risk Ratio (M‐H, Random, 95% CI) | 0.0 [0.0, 0.0] |
| 5.1 High‐income setting | 0 | 0 | Risk Ratio (M‐H, Random, 95% CI) | 0.0 [0.0, 0.0] |
| 5.2 Low‐income setting | 0 | 0 | Risk Ratio (M‐H, Random, 95% CI) | 0.0 [0.0, 0.0] |
| 6 Neonatal jaundice requiring phototherapy or exchange transfusion | 0 | 0 | Risk Ratio (M‐H, Random, 95% CI) | 0.0 [0.0, 0.0] |
| 6.1 High‐income setting | 0 | 0 | Risk Ratio (M‐H, Random, 95% CI) | 0.0 [0.0, 0.0] |
| 6.2 Low‐income setting | 0 | 0 | Risk Ratio (M‐H, Random, 95% CI) | 0.0 [0.0, 0.0] |
| 7 Neonatal polycythaemia treated with dilutional exchange transfusion | 0 | 0 | Risk Ratio (M‐H, Random, 95% CI) | 0.0 [0.0, 0.0] |
| 7.1 High‐income setting | 0 | 0 | Risk Ratio (M‐H, Random, 95% CI) | 0.0 [0.0, 0.0] |
| 7.2 Low‐income setting | 0 | 0 | Risk Ratio (M‐H, Random, 95% CI) | 0.0 [0.0, 0.0] |
| 8 Severe primary PPH after placental delivery and up to 24 hours (clinically estimated or measured blood loss ≥ 1000 mL) | 0 | 0 | Risk Ratio (M‐H, Random, 95% CI) | 0.0 [0.0, 0.0] |
| 8.1 High‐income setting | 0 | 0 | Risk Ratio (M‐H, Random, 95% CI) | 0.0 [0.0, 0.0] |
| 8.2 Low‐income setting | 0 | 0 | Risk Ratio (M‐H, Random, 95% CI) | 0.0 [0.0, 0.0] |
| 9 Severe primary PPH at time of birth and up to 24 hours (clinically estimated or measured blood loss ≥1000 mL) | 0 | 0 | Risk Ratio (M‐H, Random, 95% CI) | 0.0 [0.0, 0.0] |
| 9.1 High‐income setting | 0 | 0 | Risk Ratio (M‐H, Random, 95% CI) | 0.0 [0.0, 0.0] |
| 9.2 Low‐income setting | 0 | 0 | Risk Ratio (M‐H, Random, 95% CI) | 0.0 [0.0, 0.0] |
| 10 Primary blood loss ≥ 500 mL at time of birth (clinically estimated or measured) Show forest plot | 1 | 1648 | Risk Ratio (M‐H, Random, 95% CI) | 0.53 [0.38, 0.74] |
| 10.1 High‐income setting | 1 | 1648 | Risk Ratio (M‐H, Random, 95% CI) | 0.53 [0.38, 0.74] |
| 10.2 Low‐income setting | 0 | 0 | Risk Ratio (M‐H, Random, 95% CI) | 0.0 [0.0, 0.0] |
| 11 Primary blood loss ≥ 500 mL after delivery of placenta and up to 24 hours (clinically estimated or measured) | 0 | 0 | Risk Ratio (M‐H, Random, 95% CI) | 0.0 [0.0, 0.0] |
| 11.1 High‐income setting | 0 | 0 | Risk Ratio (M‐H, Random, 95% CI) | 0.0 [0.0, 0.0] |
| 11.2 Low‐income setting | 0 | 0 | Risk Ratio (M‐H, Random, 95% CI) | 0.0 [0.0, 0.0] |
| 12 Primary blood loss ≥ 500 mL at time of birth and up to 24 hours (clinically estimated or measured) | 0 | 0 | Risk Ratio (M‐H, Random, 95% CI) | 0.0 [0.0, 0.0] |
| 12.1 High‐income setting | 0 | 0 | Risk Ratio (M‐H, Random, 95% CI) | 0.0 [0.0, 0.0] |
| 12.2 Low‐income setting | 0 | 0 | Risk Ratio (M‐H, Random, 95% CI) | 0.0 [0.0, 0.0] |
| 13 Mean maternal blood loss (mL) at time of birth (clinically estimated or measured) | 0 | 0 | Mean Difference (IV, Random, 95% CI) | 0.0 [0.0, 0.0] |
| 13.1 High‐income setting | 0 | 0 | Mean Difference (IV, Random, 95% CI) | 0.0 [0.0, 0.0] |
| 13.2 Low‐income setting | 0 | 0 | Mean Difference (IV, Random, 95% CI) | 0.0 [0.0, 0.0] |
| 14 Mean maternal blood loss (mL) after delivery of placenta and up to 24 hours (clinically estimated or measured) | 0 | 0 | Mean Difference (IV, Random, 95% CI) | 0.0 [0.0, 0.0] |
| 14.1 High‐income setting | 0 | 0 | Mean Difference (IV, Random, 95% CI) | 0.0 [0.0, 0.0] |
| 14.2 Low‐income setting | 0 | 0 | Mean Difference (IV, Random, 95% CI) | 0.0 [0.0, 0.0] |
| 15 Mean maternal blood loss (mL) at time of birth and up to 24 hours (clinically estimated or measured) | 0 | 0 | Mean Difference (IV, Random, 95% CI) | 0.0 [0.0, 0.0] |
| 15.1 High‐income setting | 0 | 0 | Mean Difference (IV, Random, 95% CI) | 0.0 [0.0, 0.0] |
| 15.2 Low‐income setting | 0 | 0 | Mean Difference (IV, Random, 95% CI) | 0.0 [0.0, 0.0] |
| 16 Maternal blood transfusion Show forest plot | 1 | 1648 | Risk Ratio (M‐H, Random, 95% CI) | 0.25 [0.03, 2.22] |
| 16.1 High‐income setting | 1 | 1648 | Risk Ratio (M‐H, Random, 95% CI) | 0.25 [0.03, 2.22] |
| 16.2 Low‐income setting | 0 | 0 | Risk Ratio (M‐H, Random, 95% CI) | 0.0 [0.0, 0.0] |
| 17 Clinical signs of severe blood loss Show forest plot | 1 | 1648 | Risk Ratio (M‐H, Random, 95% CI) | 0.25 [0.05, 1.17] |
| 17.1 High‐income setting | 1 | 1648 | Risk Ratio (M‐H, Random, 95% CI) | 0.25 [0.05, 1.17] |
| 17.2 Low‐income setting | 0 | 0 | Risk Ratio (M‐H, Random, 95% CI) | 0.0 [0.0, 0.0] |
| 18 Therapeutic uterotonics during third stage and/or within 24 hours Show forest plot | 1 | 1648 | Risk Ratio (M‐H, Random, 95% CI) | 0.45 [0.26, 0.77] |
| 18.1 High‐income setting | 1 | 1648 | Risk Ratio (M‐H, Random, 95% CI) | 0.45 [0.26, 0.77] |
| 18.2 Low‐income setting | 0 | 0 | Risk Ratio (M‐H, Random, 95% CI) | 0.0 [0.0, 0.0] |
| 19 Mean length of third stage Show forest plot | 1 | 1648 | Mean Difference (IV, Random, 95% CI) | ‐10.0 [‐10.24, ‐9.76] |
| 19.1 High‐income setting | 1 | 1648 | Mean Difference (IV, Random, 95% CI) | ‐10.0 [‐10.24, ‐9.76] |
| 19.2 Low‐income setting | 0 | 0 | Mean Difference (IV, Random, 95% CI) | 0.0 [0.0, 0.0] |
| 20 Manual removal of placenta as defined by authors | 0 | 0 | Risk Ratio (M‐H, Random, 95% CI) | 0.0 [0.0, 0.0] |
| 20.1 High‐income setting | 0 | 0 | Risk Ratio (M‐H, Random, 95% CI) | 0.0 [0.0, 0.0] |
| 20.2 Low‐income setting | 0 | 0 | Risk Ratio (M‐H, Random, 95% CI) | 0.0 [0.0, 0.0] |
| 21 Postnatal diastolic blood pressure > 90 mmHg between birth of baby and discharge from the labour ward. | 0 | 0 | Risk Ratio (M‐H, Random, 95% CI) | 0.0 [0.0, 0.0] |
| 21.1 High‐income setting | 0 | 0 | Risk Ratio (M‐H, Random, 95% CI) | 0.0 [0.0, 0.0] |
| 21.2 Low‐income setting | 0 | 0 | Risk Ratio (M‐H, Random, 95% CI) | 0.0 [0.0, 0.0] |
| 22 Postnatal vomiting between birth of baby and discharge from the labour ward | 0 | 0 | Risk Ratio (M‐H, Random, 95% CI) | 0.0 [0.0, 0.0] |
| 22.1 High‐income setting | 0 | 0 | Risk Ratio (M‐H, Random, 95% CI) | 0.0 [0.0, 0.0] |
| 22.2 Low‐income setting | 0 | 0 | Risk Ratio (M‐H, Random, 95% CI) | 0.0 [0.0, 0.0] |
| 23 Any analgesia between birth of the baby and discharge from labour ward | 0 | 0 | Risk Ratio (M‐H, Random, 95% CI) | 0.0 [0.0, 0.0] |
| 23.1 High‐income setting | 0 | 0 | Risk Ratio (M‐H, Random, 95% CI) | 0.0 [0.0, 0.0] |
| 23.2 Low‐income setting | 0 | 0 | Risk Ratio (M‐H, Random, 95% CI) | 0.0 [0.0, 0.0] |
| 24 Women's assessment of pain during third stage as reported by authors | 0 | 0 | Risk Ratio (M‐H, Random, 95% CI) | 0.0 [0.0, 0.0] |
| 24.1 High‐income setting | 0 | 0 | Risk Ratio (M‐H, Random, 95% CI) | 0.0 [0.0, 0.0] |
| 24.2 Low‐income setting | 0 | 0 | Risk Ratio (M‐H, Random, 95% CI) | 0.0 [0.0, 0.0] |
| 25 Secondary blood loss/any vaginal bleeding needing treatment (after 24 hours and up to 6 weeks) | 0 | 0 | Risk Ratio (M‐H, Random, 95% CI) | 0.0 [0.0, 0.0] |
| 25.1 High‐income setting | 0 | 0 | Risk Ratio (M‐H, Random, 95% CI) | 0.0 [0.0, 0.0] |
| 25.2 Low‐income setting | 0 | 0 | Risk Ratio (M‐H, Random, 95% CI) | 0.0 [0.0, 0.0] |
| 26 Amount of lochia either estimated or measured after 24 hours and up to discharge from hospital | 0 | 0 | Mean Difference (IV, Random, 95% CI) | 0.0 [0.0, 0.0] |
| 26.1 High‐income setting | 0 | 0 | Mean Difference (IV, Random, 95% CI) | 0.0 [0.0, 0.0] |
| 26.2 Low‐income setting | 0 | 0 | Mean Difference (IV, Random, 95% CI) | 0.0 [0.0, 0.0] |
| 27 Surgical evacuation of retained products of conception | 0 | 0 | Risk Ratio (M‐H, Random, 95% CI) | 0.0 [0.0, 0.0] |
| 27.1 High‐income setting | 0 | 0 | Risk Ratio (M‐H, Random, 95% CI) | 0.0 [0.0, 0.0] |
| 27.2 Low‐income setting | 0 | 0 | Risk Ratio (M‐H, Random, 95% CI) | 0.0 [0.0, 0.0] |
| 28 Afterpains ‐ abdominal pain associated with the contracting uterus in the postpartum period | 0 | 0 | Risk Ratio (M‐H, Random, 95% CI) | 0.0 [0.0, 0.0] |
| 28.1 High‐income setting | 0 | 0 | Risk Ratio (M‐H, Random, 95% CI) | 0.0 [0.0, 0.0] |
| 28.2 Low‐income setting | 0 | 0 | Risk Ratio (M‐H, Random, 95% CI) | 0.0 [0.0, 0.0] |
| 29 Apgar score < 7 at 5 minutes | 0 | 0 | Risk Ratio (M‐H, Random, 95% CI) | 0.0 [0.0, 0.0] |
| 29.1 High‐income setting | 0 | 0 | Risk Ratio (M‐H, Random, 95% CI) | 0.0 [0.0, 0.0] |
| 29.2 Low‐income setting | 0 | 0 | Risk Ratio (M‐H, Random, 95% CI) | 0.0 [0.0, 0.0] |
| 30 Birthweight | 0 | 0 | Mean Difference (IV, Random, 95% CI) | 0.0 [0.0, 0.0] |
| 30.1 High‐income setting | 0 | 0 | Mean Difference (IV, Random, 95% CI) | 0.0 [0.0, 0.0] |
| 30.2 Low‐income setting | 0 | 0 | Mean Difference (IV, Random, 95% CI) | 0.0 [0.0, 0.0] |
| 31 Neonatal encephalopathy assessed using Sarnat staging (Sarnat 1976; Table 1) | 0 | 0 | Risk Ratio (M‐H, Random, 95% CI) | 0.0 [0.0, 0.0] |
| 31.1 High‐income setting | 0 | 0 | Risk Ratio (M‐H, Random, 95% CI) | 0.0 [0.0, 0.0] |
| 31.2 Low‐income setting | 0 | 0 | Risk Ratio (M‐H, Random, 95% CI) | 0.0 [0.0, 0.0] |
| 32 Neonatal mortality | 0 | 0 | Risk Ratio (M‐H, Random, 95% CI) | 0.0 [0.0, 0.0] |
| 32.1 High‐income setting | 0 | 0 | Risk Ratio (M‐H, Random, 95% CI) | 0.0 [0.0, 0.0] |
| 32.2 Low‐income setting | 0 | 0 | Risk Ratio (M‐H, Random, 95% CI) | 0.0 [0.0, 0.0] |
| 33 Intraventricular haemorrhage ‐ Papille grade III/IV ‐ (for infants born before 34 weeks' gestation only). | 0 | 0 | Risk Ratio (M‐H, Random, 95% CI) | 0.0 [0.0, 0.0] |
| 33.1 High‐income setting | 0 | 0 | Risk Ratio (M‐H, Random, 95% CI) | 0.0 [0.0, 0.0] |
| 33.2 Low‐income setting | 0 | 0 | Risk Ratio (M‐H, Random, 95% CI) | 0.0 [0.0, 0.0] |
| 34 Number of infants who received a red blood cell transfusion. | 0 | 0 | Risk Ratio (M‐H, Random, 95% CI) | 0.0 [0.0, 0.0] |
| 34.1 High‐income setting | 0 | 0 | Risk Ratio (M‐H, Random, 95% CI) | 0.0 [0.0, 0.0] |
| 34.2 Low‐income setting | 0 | 0 | Risk Ratio (M‐H, Random, 95% CI) | 0.0 [0.0, 0.0] |
| 35 Infant Hb level at 24 to 72 hours | 0 | 0 | Mean Difference (IV, Random, 95% CI) | 0.0 [0.0, 0.0] |
| 35.1 High‐income setting | 0 | 0 | Mean Difference (IV, Random, 95% CI) | 0.0 [0.0, 0.0] |
| 35.2 Low‐income setting | 0 | 0 | Mean Difference (IV, Random, 95% CI) | 0.0 [0.0, 0.0] |
| 36 Infant Hb level at 3‐6 months | 0 | 0 | Mean Difference (IV, Random, 95% CI) | 0.0 [0.0, 0.0] |
| 36.1 High‐income setting | 0 | 0 | Mean Difference (IV, Random, 95% CI) | 0.0 [0.0, 0.0] |
| 36.2 Low‐income setting | 0 | 0 | Mean Difference (IV, Random, 95% CI) | 0.0 [0.0, 0.0] |
| 37 Infant iron indices (ferritin) at 3 to 6 months. | 0 | 0 | Risk Ratio (M‐H, Random, 95% CI) | 0.0 [0.0, 0.0] |
| 37.1 High‐income setting | 0 | 0 | Risk Ratio (M‐H, Random, 95% CI) | 0.0 [0.0, 0.0] |
| 37.2 Low‐income setting | 0 | 0 | Risk Ratio (M‐H, Random, 95% CI) | 0.0 [0.0, 0.0] |
| 38 Exclusive breastfeeding at discharge from hospital | 0 | 0 | Risk Ratio (M‐H, Random, 95% CI) | 0.0 [0.0, 0.0] |
| 38.1 High‐income setting | 0 | 0 | Risk Ratio (M‐H, Random, 95% CI) | 0.0 [0.0, 0.0] |
| 38.2 Low‐income setting | 0 | 0 | Risk Ratio (M‐H, Random, 95% CI) | 0.0 [0.0, 0.0] |
| 39 Neurodevelopmental, cognitive or developmental outcomes assessed after age 18 months. | 0 | 0 | Risk Ratio (M‐H, Random, 95% CI) | 0.0 [0.0, 0.0] |
| 39.1 High‐income setting | 0 | 0 | Risk Ratio (M‐H, Random, 95% CI) | 0.0 [0.0, 0.0] |
| 39.2 Low‐income setting | 0 | 0 | Risk Ratio (M‐H, Random, 95% CI) | 0.0 [0.0, 0.0] |
| 40 Return to hospital as in‐ or outpatient because of bleeding (not pre‐specified) | 0 | 0 | Risk Ratio (M‐H, Random, 95% CI) | 0.0 [0.0, 0.0] |
| 40.1 High‐income setting | 0 | 0 | Risk Ratio (M‐H, Random, 95% CI) | 0.0 [0.0, 0.0] |
| 40.2 Low‐income setting | 0 | 0 | Risk Ratio (M‐H, Random, 95% CI) | 0.0 [0.0, 0.0] |
| 41 Postnatal maternal mean Hb (outcome not pre‐specified) | 0 | 0 | Mean Difference (IV, Random, 95% CI) | 0.0 [0.0, 0.0] |
| 41.1 High‐income setting | 0 | 0 | Mean Difference (IV, Random, 95% CI) | 0.0 [0.0, 0.0] |
| 41.2 Low‐income setting | 0 | 0 | Mean Difference (IV, Random, 95% CI) | 0.0 [0.0, 0.0] |
| Outcome or subgroup title | No. of studies | No. of participants | Statistical method | Effect size |
| 1 Severe primary PPH at time of birth (clinically estimated or measured blood loss ≥ 1000 mL) Show forest plot | 1 | 1621 | Risk Ratio (M‐H, Random, 95% CI) | 0.78 [0.48, 1.24] |
| 1.1 High‐income setting | 1 | 1621 | Risk Ratio (M‐H, Random, 95% CI) | 0.78 [0.48, 1.24] |
| 1.2 Low‐income setting | 0 | 0 | Risk Ratio (M‐H, Random, 95% CI) | 0.0 [0.0, 0.0] |
| 2 Very severe primary PPH at time of birth (clinically estimated or measured blood loss ≥ 2500 mL) | 0 | 0 | Risk Ratio (M‐H, Random, 95% CI) | 0.0 [0.0, 0.0] |
| 2.1 High‐income setting | 0 | 0 | Risk Ratio (M‐H, Random, 95% CI) | 0.0 [0.0, 0.0] |
| 2.2 Low‐income setting | 0 | 0 | Risk Ratio (M‐H, Random, 95% CI) | 0.0 [0.0, 0.0] |
| 3 Maternal mortality | 0 | 0 | Risk Ratio (M‐H, Random, 95% CI) | 0.0 [0.0, 0.0] |
| 3.1 High‐income setting | 0 | 0 | Risk Ratio (M‐H, Random, 95% CI) | 0.0 [0.0, 0.0] |
| 3.2 Low‐income setting | 0 | 0 | Risk Ratio (M‐H, Random, 95% CI) | 0.0 [0.0, 0.0] |
| 4 Maternal Hb < 9 g/dL at 24‐72 hr Show forest plot | 1 | 1631 | Risk Ratio (M‐H, Random, 95% CI) | 1.23 [0.75, 2.01] |
| 4.1 High‐income setting | 1 | 1631 | Risk Ratio (M‐H, Random, 95% CI) | 1.23 [0.75, 2.01] |
| 4.2 Low‐income setting | 0 | 0 | Risk Ratio (M‐H, Random, 95% CI) | 0.0 [0.0, 0.0] |
| 5 Admission to neonatal special/intensive care | 0 | 0 | Risk Ratio (M‐H, Random, 95% CI) | 0.0 [0.0, 0.0] |
| 5.1 High‐income setting | 0 | 0 | Risk Ratio (M‐H, Random, 95% CI) | 0.0 [0.0, 0.0] |
| 5.2 Low‐income setting | 0 | 0 | Risk Ratio (M‐H, Random, 95% CI) | 0.0 [0.0, 0.0] |
| 6 Neonatal jaundice requiring phototherapy or exchange transfusion | 0 | 0 | Risk Ratio (M‐H, Random, 95% CI) | 0.0 [0.0, 0.0] |
| 6.1 High‐income setting | 0 | 0 | Risk Ratio (M‐H, Random, 95% CI) | 0.0 [0.0, 0.0] |
| 6.2 Low‐income setting | 0 | 0 | Risk Ratio (M‐H, Random, 95% CI) | 0.0 [0.0, 0.0] |
| 7 Neonatal polycythaemia treated with dilutional exchange transfusion | 0 | 0 | Risk Ratio (M‐H, Random, 95% CI) | 0.0 [0.0, 0.0] |
| 7.1 High‐income setting | 0 | 0 | Risk Ratio (M‐H, Random, 95% CI) | 0.0 [0.0, 0.0] |
| 7.2 Low‐income setting | 0 | 0 | Risk Ratio (M‐H, Random, 95% CI) | 0.0 [0.0, 0.0] |
| 8 Severe primary PPH after placental delivery and up to 24 hours (clinically estimated or measured blood loss ≥ 1000 mL) | 0 | 0 | Risk Ratio (M‐H, Random, 95% CI) | 0.0 [0.0, 0.0] |
| 8.1 High‐income setting | 0 | 0 | Risk Ratio (M‐H, Random, 95% CI) | 0.0 [0.0, 0.0] |
| 8.2 Low‐income setting | 0 | 0 | Risk Ratio (M‐H, Random, 95% CI) | 0.0 [0.0, 0.0] |
| 9 Severe primary PPH at time of birth and up to 24 hours (clinically estimated or measured blood loss ≥1000 mL) | 0 | 0 | Risk Ratio (M‐H, Random, 95% CI) | 0.0 [0.0, 0.0] |
| 9.1 High‐income setting | 0 | 0 | Risk Ratio (M‐H, Random, 95% CI) | 0.0 [0.0, 0.0] |
| 9.2 Low‐income setting | 0 | 0 | Risk Ratio (M‐H, Random, 95% CI) | 0.0 [0.0, 0.0] |
| 10 Primary blood loss ≥ 500 mL at time of birth (clinically estimated or measured) Show forest plot | 1 | 1621 | Risk Ratio (M‐H, Random, 95% CI) | 0.51 [0.40, 0.66] |
| 10.1 High‐income setting | 1 | 1621 | Risk Ratio (M‐H, Random, 95% CI) | 0.51 [0.40, 0.66] |
| 10.2 Low‐income setting | 0 | 0 | Risk Ratio (M‐H, Random, 95% CI) | 0.0 [0.0, 0.0] |
| 11 Primary blood loss ≥ 500 mL after delivery of placenta and up to 24 hours (clinically estimated or measured) | 0 | 0 | Risk Ratio (M‐H, Random, 95% CI) | 0.0 [0.0, 0.0] |
| 11.1 High‐income setting | 0 | 0 | Risk Ratio (M‐H, Random, 95% CI) | 0.0 [0.0, 0.0] |
| 11.2 Low‐income setting | 0 | 0 | Risk Ratio (M‐H, Random, 95% CI) | 0.0 [0.0, 0.0] |
| 12 Primary blood loss ≥ 500 mL at time of birth and up to 24 hours (clinically estimated or measured) | 0 | 0 | Risk Ratio (M‐H, Random, 95% CI) | 0.0 [0.0, 0.0] |
| 12.1 High‐income setting | 0 | 0 | Risk Ratio (M‐H, Random, 95% CI) | 0.0 [0.0, 0.0] |
| 12.2 Low‐income setting | 0 | 0 | Risk Ratio (M‐H, Random, 95% CI) | 0.0 [0.0, 0.0] |
| 13 Mean maternal blood loss (mL) at time of birth (clinically estimated or measured) Show forest plot | 1 | 1621 | Mean Difference (IV, Random, 95% CI) | ‐94.0 [‐126.57, ‐61.43] |
| 13.1 High‐income setting | 1 | 1621 | Mean Difference (IV, Random, 95% CI) | ‐94.0 [‐126.57, ‐61.43] |
| 13.2 Low‐income setting | 0 | 0 | Mean Difference (IV, Random, 95% CI) | 0.0 [0.0, 0.0] |
| 14 Mean maternal blood loss (mL) after delivery of placenta and up to 24 hours (clinically estimated or measured) | 0 | 0 | Mean Difference (IV, Random, 95% CI) | 0.0 [0.0, 0.0] |
| 14.1 High‐income setting | 0 | 0 | Mean Difference (IV, Random, 95% CI) | 0.0 [0.0, 0.0] |
| 14.2 Low‐income setting | 0 | 0 | Mean Difference (IV, Random, 95% CI) | 0.0 [0.0, 0.0] |
| 15 Mean maternal blood loss (mL) at time of birth and up to 24 hours (clinically estimated or measured) | 0 | 0 | Mean Difference (IV, Random, 95% CI) | 0.0 [0.0, 0.0] |
| 15.1 High‐income setting | 0 | 0 | Mean Difference (IV, Random, 95% CI) | 0.0 [0.0, 0.0] |
| 15.2 Low‐income setting | 0 | 0 | Mean Difference (IV, Random, 95% CI) | 0.0 [0.0, 0.0] |
| 16 Maternal blood transfusion Show forest plot | 1 | 1631 | Risk Ratio (M‐H, Random, 95% CI) | 0.79 [0.43, 1.46] |
| 16.1 High‐income setting | 1 | 1631 | Risk Ratio (M‐H, Random, 95% CI) | 0.79 [0.43, 1.46] |
| 16.2 Low‐income setting | 0 | 0 | Risk Ratio (M‐H, Random, 95% CI) | 0.0 [0.0, 0.0] |
| 17 Clinical signs of severe blood loss | 0 | 0 | Risk Ratio (M‐H, Random, 95% CI) | 0.0 [0.0, 0.0] |
| 17.1 High‐income setting | 0 | 0 | Risk Ratio (M‐H, Random, 95% CI) | 0.0 [0.0, 0.0] |
| 17.2 Low‐income setting | 0 | 0 | Risk Ratio (M‐H, Random, 95% CI) | 0.0 [0.0, 0.0] |
| 18 Therapeutic uterotonics during third stage and/or within 24 hours Show forest plot | 1 | 1631 | Risk Ratio (M‐H, Random, 95% CI) | 0.39 [0.33, 0.48] |
| 18.1 High‐income setting | 1 | 1631 | Risk Ratio (M‐H, Random, 95% CI) | 0.39 [0.33, 0.48] |
| 18.2 Low‐income setting | 0 | 0 | Risk Ratio (M‐H, Random, 95% CI) | 0.0 [0.0, 0.0] |
| 19 Mean length of third stage Show forest plot | 1 | 1631 | Mean Difference (IV, Random, 95% CI) | ‐1.60 [‐3.08, ‐0.12] |
| 19.1 High‐income setting | 1 | 1631 | Mean Difference (IV, Random, 95% CI) | ‐1.60 [‐3.08, ‐0.12] |
| 19.2 Low‐income setting | 0 | 0 | Mean Difference (IV, Random, 95% CI) | 0.0 [0.0, 0.0] |
| 20 Manual removal of placenta as defined by authors Show forest plot | 1 | 1631 | Risk Ratio (M‐H, Random, 95% CI) | 1.25 [0.71, 2.21] |
| 20.1 High‐income setting | 1 | 1631 | Risk Ratio (M‐H, Random, 95% CI) | 1.25 [0.71, 2.21] |
| 20.2 Low‐income setting | 0 | 0 | Risk Ratio (M‐H, Random, 95% CI) | 0.0 [0.0, 0.0] |
| 21 Postnatal diastolic blood pressure > 90 mmHg between birth of baby and discharge from the labour ward. | 0 | 0 | Risk Ratio (M‐H, Random, 95% CI) | 0.0 [0.0, 0.0] |
| 21.1 High‐income setting | 0 | 0 | Risk Ratio (M‐H, Random, 95% CI) | 0.0 [0.0, 0.0] |
| 21.2 Low‐income setting | 0 | 0 | Risk Ratio (M‐H, Random, 95% CI) | 0.0 [0.0, 0.0] |
| 22 Postnatal vomiting between birth of baby and discharge from the labour ward | 0 | 0 | Risk Ratio (M‐H, Random, 95% CI) | 0.0 [0.0, 0.0] |
| 22.1 High‐income setting | 0 | 0 | Risk Ratio (M‐H, Random, 95% CI) | 0.0 [0.0, 0.0] |
| 22.2 Low‐income setting | 0 | 0 | Risk Ratio (M‐H, Random, 95% CI) | 0.0 [0.0, 0.0] |
| 23 Any analgesia between birth of the baby and discharge from labour ward | 0 | 0 | Risk Ratio (M‐H, Random, 95% CI) | 0.0 [0.0, 0.0] |
| 23.1 High‐income setting | 0 | 0 | Risk Ratio (M‐H, Random, 95% CI) | 0.0 [0.0, 0.0] |
| 23.2 Low‐income setting | 0 | 0 | Risk Ratio (M‐H, Random, 95% CI) | 0.0 [0.0, 0.0] |
| 24 Women's assessment of pain during third stage as reported by authors | 0 | 0 | Risk Ratio (M‐H, Random, 95% CI) | 0.0 [0.0, 0.0] |
| 24.1 High‐income setting | 0 | 0 | Risk Ratio (M‐H, Random, 95% CI) | 0.0 [0.0, 0.0] |
| 24.2 Low‐income setting | 0 | 0 | Risk Ratio (M‐H, Random, 95% CI) | 0.0 [0.0, 0.0] |
| 25 Secondary blood loss/any vaginal bleeding needing treatment (after 24 hours and up to 6 weeks) | 0 | 0 | Risk Ratio (M‐H, Random, 95% CI) | 0.0 [0.0, 0.0] |
| 25.1 High‐income setting | 0 | 0 | Risk Ratio (M‐H, Random, 95% CI) | 0.0 [0.0, 0.0] |
| 25.2 Low‐income setting | 0 | 0 | Risk Ratio (M‐H, Random, 95% CI) | 0.0 [0.0, 0.0] |
| 26 Amount of lochia either estimated or measured after 24 hours and up to discharge from hospital | 0 | 0 | Mean Difference (IV, Random, 95% CI) | 0.0 [0.0, 0.0] |
| 26.1 High‐income setting | 0 | 0 | Mean Difference (IV, Random, 95% CI) | 0.0 [0.0, 0.0] |
| 26.2 Low‐income setting | 0 | 0 | Mean Difference (IV, Random, 95% CI) | 0.0 [0.0, 0.0] |
| 27 Surgical evacuation of retained products of conception | 0 | 0 | Risk Ratio (M‐H, Random, 95% CI) | 0.0 [0.0, 0.0] |
| 27.1 High‐income setting | 0 | 0 | Risk Ratio (M‐H, Random, 95% CI) | 0.0 [0.0, 0.0] |
| 27.2 Low‐income setting | 0 | 0 | Risk Ratio (M‐H, Random, 95% CI) | 0.0 [0.0, 0.0] |
| 28 Not prespecified: afterpains at 2 hours after birth (id 20458) Show forest plot | 1 | 1425 | Mean Difference (IV, Fixed, 95% CI) | ‐2.80 [‐4.62, ‐0.98] |
| 28.1 High‐income setting | 1 | 1425 | Mean Difference (IV, Fixed, 95% CI) | ‐2.80 [‐4.62, ‐0.98] |
| 28.2 Low‐income setting | 0 | 0 | Mean Difference (IV, Fixed, 95% CI) | 0.0 [0.0, 0.0] |
| 29 Not pre‐specified: afterpains the day after birth (id 20458) Show forest plot | 1 | 1336 | Mean Difference (IV, Fixed, 95% CI) | ‐3.0 [‐5.33, ‐0.67] |
| 29.1 High‐income setting | 1 | 1336 | Mean Difference (IV, Fixed, 95% CI) | ‐3.0 [‐5.33, ‐0.67] |
| 29.2 Low‐income setting | 0 | 0 | Mean Difference (IV, Fixed, 95% CI) | 0.0 [0.0, 0.0] |
| 30 Apgar score < 7 at 5 minutes | 0 | 0 | Risk Ratio (M‐H, Random, 95% CI) | 0.0 [0.0, 0.0] |
| 30.1 High‐income setting | 0 | 0 | Risk Ratio (M‐H, Random, 95% CI) | 0.0 [0.0, 0.0] |
| 30.2 Low‐income setting | 0 | 0 | Risk Ratio (M‐H, Random, 95% CI) | 0.0 [0.0, 0.0] |
| 31 Birthweight Show forest plot | 1 | 1631 | Mean Difference (IV, Random, 95% CI) | 15.0 [‐28.88, 58.88] |
| 31.1 High‐income setting | 1 | 1631 | Mean Difference (IV, Random, 95% CI) | 15.0 [‐28.88, 58.88] |
| 31.2 Low‐income setting | 0 | 0 | Mean Difference (IV, Random, 95% CI) | 0.0 [0.0, 0.0] |
| 32 Neonatal encephalopathy assessed using Sarnat staging (Sarnat 1976; Table 1) | 0 | 0 | Risk Ratio (M‐H, Random, 95% CI) | 0.0 [0.0, 0.0] |
| 32.1 High‐income setting | 0 | 0 | Risk Ratio (M‐H, Random, 95% CI) | 0.0 [0.0, 0.0] |
| 32.2 Low‐income setting | 0 | 0 | Risk Ratio (M‐H, Random, 95% CI) | 0.0 [0.0, 0.0] |
| 33 Neonatal mortality | 0 | 0 | Risk Ratio (M‐H, Random, 95% CI) | 0.0 [0.0, 0.0] |
| 33.1 High‐income setting | 0 | 0 | Risk Ratio (M‐H, Random, 95% CI) | 0.0 [0.0, 0.0] |
| 33.2 Low‐income setting | 0 | 0 | Risk Ratio (M‐H, Random, 95% CI) | 0.0 [0.0, 0.0] |
| 34 Intraventricular haemorrhage ‐ Papille grade III/IV ‐ (for infants born before 34 weeks' gestation only). | 0 | 0 | Risk Ratio (M‐H, Random, 95% CI) | 0.0 [0.0, 0.0] |
| 34.1 High‐income setting | 0 | 0 | Risk Ratio (M‐H, Random, 95% CI) | 0.0 [0.0, 0.0] |
| 34.2 Low‐income setting | 0 | 0 | Risk Ratio (M‐H, Random, 95% CI) | 0.0 [0.0, 0.0] |
| 35 Number of infants who received a red blood cell transfusion. | 0 | 0 | Risk Ratio (M‐H, Random, 95% CI) | 0.0 [0.0, 0.0] |
| 35.1 High‐income setting | 0 | 0 | Risk Ratio (M‐H, Random, 95% CI) | 0.0 [0.0, 0.0] |
| 35.2 Low‐income setting | 0 | 0 | Risk Ratio (M‐H, Random, 95% CI) | 0.0 [0.0, 0.0] |
| 36 Infant Hb level at 24 to 72 hours | 0 | 0 | Mean Difference (IV, Random, 95% CI) | 0.0 [0.0, 0.0] |
| 36.1 High‐income setting | 0 | 0 | Mean Difference (IV, Random, 95% CI) | 0.0 [0.0, 0.0] |
| 36.2 Low‐income setting | 0 | 0 | Mean Difference (IV, Random, 95% CI) | 0.0 [0.0, 0.0] |
| 37 Infant Hb level at 3‐6 months | 0 | 0 | Mean Difference (IV, Random, 95% CI) | 0.0 [0.0, 0.0] |
| 37.1 High‐income setting | 0 | 0 | Mean Difference (IV, Random, 95% CI) | 0.0 [0.0, 0.0] |
| 37.2 Low‐income setting | 0 | 0 | Mean Difference (IV, Random, 95% CI) | 0.0 [0.0, 0.0] |
| 38 Infant iron indices (ferritin) at 3 to 6 months. | 0 | 0 | Risk Ratio (M‐H, Random, 95% CI) | 0.0 [0.0, 0.0] |
| 38.1 High‐income setting | 0 | 0 | Risk Ratio (M‐H, Random, 95% CI) | 0.0 [0.0, 0.0] |
| 38.2 Low‐income setting | 0 | 0 | Risk Ratio (M‐H, Random, 95% CI) | 0.0 [0.0, 0.0] |
| 39 Exclusive breastfeeding at discharge from hospital | 0 | 0 | Risk Ratio (M‐H, Random, 95% CI) | 0.0 [0.0, 0.0] |
| 39.1 High‐income setting | 0 | 0 | Risk Ratio (M‐H, Random, 95% CI) | 0.0 [0.0, 0.0] |
| 39.2 Low‐income setting | 0 | 0 | Risk Ratio (M‐H, Random, 95% CI) | 0.0 [0.0, 0.0] |
| 40 Neurodevelopmental, cognitive or developmental outcomes assessed after age 18 months. | 0 | 0 | Risk Ratio (M‐H, Random, 95% CI) | 0.0 [0.0, 0.0] |
| 40.1 High‐income setting | 0 | 0 | Risk Ratio (M‐H, Random, 95% CI) | 0.0 [0.0, 0.0] |
| 40.2 Low‐income setting | 0 | 0 | Risk Ratio (M‐H, Random, 95% CI) | 0.0 [0.0, 0.0] |
| 41 Return to hospital as in‐ or outpatient because of bleeding (not pre‐specified) | 0 | 0 | Risk Ratio (M‐H, Random, 95% CI) | 0.0 [0.0, 0.0] |
| 42 Postnatal maternal mean Hb (outcome not pre‐specified) Show forest plot | 1 | 1631 | Mean Difference (IV, Random, 95% CI) | 0.28 [0.14, 0.42] |
| 42.1 High‐income setting | 1 | 1631 | Mean Difference (IV, Random, 95% CI) | 0.28 [0.14, 0.42] |
| 42.2 Low‐income setting | 0 | 0 | Mean Difference (IV, Random, 95% CI) | 0.0 [0.0, 0.0] |
| 43 Severe primary PPH after placental delivery and up to 2 hours (clinically estimated or measured blood loss ≥ 1000 mL) ‐ not pre‐specified Show forest plot | 1 | 1621 | Risk Ratio (M‐H, Random, 95% CI) | 0.54 [0.39, 0.74] |
| 43.1 High‐income setting | 1 | 1621 | Risk Ratio (M‐H, Random, 95% CI) | 0.54 [0.39, 0.74] |
| 43.2 Low‐income setting | 0 | 0 | Risk Ratio (M‐H, Random, 95% CI) | 0.0 [0.0, 0.0] |
| 44 Severe primary PPH at time of birth and up to 2 hours (clinically estimated or measured blood loss ≥1000 mL) ‐ not pre‐specified Show forest plot | 1 | 1621 | Risk Ratio (M‐H, Random, 95% CI) | 0.60 [0.47, 0.78] |
| 44.1 High‐income setting | 1 | 1621 | Risk Ratio (M‐H, Random, 95% CI) | 0.60 [0.47, 0.78] |
| 44.2 Low‐income setting | 0 | 0 | Risk Ratio (M‐H, Random, 95% CI) | 0.0 [0.0, 0.0] |
| 45 Mean blood loss (mL) (clinically estimated or measured at birth and up to 2 hours (not pre‐specified) Show forest plot | 1 | 1621 | Mean Difference (IV, Random, 95% CI) | ‐49.0 [‐75.52, ‐22.48] |
| 45.1 High‐income setting | 1 | 1621 | Mean Difference (IV, Random, 95% CI) | ‐49.0 [‐75.52, ‐22.48] |
| 45.2 Low‐income setting | 0 | 0 | Mean Difference (IV, Random, 95% CI) | 0.0 [0.0, 0.0] |
| Outcome or subgroup title | No. of studies | No. of participants | Statistical method | Effect size |
| 1 Severe primary PPH at time of birth (clinically estimated or measured blood loss ≥ 1000 mL) | 0 | 0 | Risk Ratio (M‐H, Random, 95% CI) | 0.0 [0.0, 0.0] |
| 1.1 High‐income setting | 0 | 0 | Risk Ratio (M‐H, Random, 95% CI) | 0.0 [0.0, 0.0] |
| 1.2 Low‐income setting | 0 | 0 | Risk Ratio (M‐H, Random, 95% CI) | 0.0 [0.0, 0.0] |
| 2 Very severe primary PPH at time of birth (clinically estimated or measured blood loss ≥ 2500 mL) | 0 | 0 | Risk Ratio (M‐H, Random, 95% CI) | 0.0 [0.0, 0.0] |
| 2.1 High‐income setting | 0 | 0 | Risk Ratio (M‐H, Random, 95% CI) | 0.0 [0.0, 0.0] |
| 2.2 Low‐income setting | 0 | 0 | Risk Ratio (M‐H, Random, 95% CI) | 0.0 [0.0, 0.0] |
| 3 Maternal mortality | 0 | 0 | Risk Ratio (M‐H, Random, 95% CI) | 0.0 [0.0, 0.0] |
| 3.1 High‐income setting | 0 | 0 | Risk Ratio (M‐H, Random, 95% CI) | 0.0 [0.0, 0.0] |
| 3.2 Low‐income setting | 0 | 0 | Risk Ratio (M‐H, Random, 95% CI) | 0.0 [0.0, 0.0] |
| 4 Maternal Hb < 9 g/dL at 24‐72 hr Show forest plot | 1 | 130 | Risk Ratio (M‐H, Random, 95% CI) | 0.8 [0.34, 1.90] |
| 4.1 High‐income setting | 0 | 0 | Risk Ratio (M‐H, Random, 95% CI) | 0.0 [0.0, 0.0] |
| 4.2 Low‐income setting | 1 | 130 | Risk Ratio (M‐H, Random, 95% CI) | 0.8 [0.34, 1.90] |
| 5 Admission to neonatal special/intensive care | 0 | 0 | Risk Ratio (M‐H, Random, 95% CI) | 0.0 [0.0, 0.0] |
| 5.1 High‐income setting | 0 | 0 | Risk Ratio (M‐H, Random, 95% CI) | 0.0 [0.0, 0.0] |
| 5.2 Low‐income setting | 0 | 0 | Risk Ratio (M‐H, Random, 95% CI) | 0.0 [0.0, 0.0] |
| 6 Neonatal jaundice requiring phototherapy or exchange transfusion | 0 | 0 | Risk Ratio (M‐H, Random, 95% CI) | 0.0 [0.0, 0.0] |
| 6.1 High‐income setting | 0 | 0 | Risk Ratio (M‐H, Random, 95% CI) | 0.0 [0.0, 0.0] |
| 6.2 Low‐income setting | 0 | 0 | Risk Ratio (M‐H, Random, 95% CI) | 0.0 [0.0, 0.0] |
| 7 Neonatal polycythaemia treated with dilutional exchange transfusion | 0 | 0 | Risk Ratio (M‐H, Random, 95% CI) | 0.0 [0.0, 0.0] |
| 7.1 High‐income setting | 0 | 0 | Risk Ratio (M‐H, Random, 95% CI) | 0.0 [0.0, 0.0] |
| 7.2 Low‐income setting | 0 | 0 | Risk Ratio (M‐H, Random, 95% CI) | 0.0 [0.0, 0.0] |
| 8 Severe primary PPH after placental delivery and up to 24 hours (clinically estimated or measured blood loss ≥ 1000 mL) | 0 | 0 | Risk Ratio (M‐H, Random, 95% CI) | 0.0 [0.0, 0.0] |
| 8.1 High‐income setting | 0 | 0 | Risk Ratio (M‐H, Random, 95% CI) | 0.0 [0.0, 0.0] |
| 8.2 Low‐income setting | 0 | 0 | Risk Ratio (M‐H, Random, 95% CI) | 0.0 [0.0, 0.0] |
| 9 Severe primary PPH at time of birth and up to 24 hours (clinically estimated or measured blood loss ≥1000 mL) | 0 | 0 | Risk Ratio (M‐H, Random, 95% CI) | 0.0 [0.0, 0.0] |
| 9.1 High‐income setting | 0 | 0 | Risk Ratio (M‐H, Random, 95% CI) | 0.0 [0.0, 0.0] |
| 9.2 Low‐income setting | 0 | 0 | Risk Ratio (M‐H, Random, 95% CI) | 0.0 [0.0, 0.0] |
| 10 Primary blood loss ≥ 500 mL at time of birth (clinically estimated or measured) | 0 | 0 | Risk Ratio (M‐H, Random, 95% CI) | 0.0 [0.0, 0.0] |
| 10.1 High‐income setting | 0 | 0 | Risk Ratio (M‐H, Random, 95% CI) | 0.0 [0.0, 0.0] |
| 10.2 Low‐income setting | 0 | 0 | Risk Ratio (M‐H, Random, 95% CI) | 0.0 [0.0, 0.0] |
| 11 Primary blood loss ≥ 500 mL after delivery of placenta and up to 24 hours (clinically estimated or measured) | 0 | 0 | Risk Ratio (M‐H, Random, 95% CI) | 0.0 [0.0, 0.0] |
| 11.1 High‐income setting | 0 | 0 | Risk Ratio (M‐H, Random, 95% CI) | 0.0 [0.0, 0.0] |
| 11.2 Low‐income setting | 0 | 0 | Risk Ratio (M‐H, Random, 95% CI) | 0.0 [0.0, 0.0] |
| 12 Primary blood loss ≥ 500 mL at time of birth and up to 24 hours (clinically estimated or measured) | 0 | 0 | Risk Ratio (M‐H, Random, 95% CI) | 0.0 [0.0, 0.0] |
| 12.1 High‐income setting | 0 | 0 | Risk Ratio (M‐H, Random, 95% CI) | 0.0 [0.0, 0.0] |
| 12.2 Low‐income setting | 0 | 0 | Risk Ratio (M‐H, Random, 95% CI) | 0.0 [0.0, 0.0] |
| 13 Mean maternal blood loss (mL) at time of birth (clinically estimated or measured) | 0 | 0 | Mean Difference (IV, Random, 95% CI) | 0.0 [0.0, 0.0] |
| 13.1 High‐income setting | 0 | 0 | Mean Difference (IV, Random, 95% CI) | 0.0 [0.0, 0.0] |
| 13.2 Low‐income setting | 0 | 0 | Mean Difference (IV, Random, 95% CI) | 0.0 [0.0, 0.0] |
| 14 Mean maternal blood loss (mL) after delivery of placenta and up to 24 hours (clinically estimated or measured) | 0 | 0 | Mean Difference (IV, Random, 95% CI) | 0.0 [0.0, 0.0] |
| 14.1 High‐income setting | 0 | 0 | Mean Difference (IV, Random, 95% CI) | 0.0 [0.0, 0.0] |
| 14.2 Low‐income setting | 0 | 0 | Mean Difference (IV, Random, 95% CI) | 0.0 [0.0, 0.0] |
| 15 Mean maternal blood loss (mL) at time of birth and up to 24 hours (clinically estimated or measured) | 0 | 0 | Mean Difference (IV, Random, 95% CI) | 0.0 [0.0, 0.0] |
| 15.1 High‐income setting | 0 | 0 | Mean Difference (IV, Random, 95% CI) | 0.0 [0.0, 0.0] |
| 15.2 Low‐income setting | 0 | 0 | Mean Difference (IV, Random, 95% CI) | 0.0 [0.0, 0.0] |
| 16 Maternal blood transfusion | 0 | 0 | Risk Ratio (M‐H, Random, 95% CI) | 0.0 [0.0, 0.0] |
| 16.1 High‐income setting | 0 | 0 | Risk Ratio (M‐H, Random, 95% CI) | 0.0 [0.0, 0.0] |
| 16.2 Low‐income setting | 0 | 0 | Risk Ratio (M‐H, Random, 95% CI) | 0.0 [0.0, 0.0] |
| 17 Clinical signs of severe blood loss | 0 | 0 | Risk Ratio (M‐H, Random, 95% CI) | 0.0 [0.0, 0.0] |
| 17.1 High‐income setting | 0 | 0 | Risk Ratio (M‐H, Random, 95% CI) | 0.0 [0.0, 0.0] |
| 17.2 Low‐income setting | 0 | 0 | Risk Ratio (M‐H, Random, 95% CI) | 0.0 [0.0, 0.0] |
| 18 Therapeutic uterotonics during third stage and/or within 24 hours | 0 | 0 | Risk Ratio (M‐H, Random, 95% CI) | 0.0 [0.0, 0.0] |
| 18.1 High‐income setting | 0 | 0 | Risk Ratio (M‐H, Random, 95% CI) | 0.0 [0.0, 0.0] |
| 18.2 Low‐income setting | 0 | 0 | Risk Ratio (M‐H, Random, 95% CI) | 0.0 [0.0, 0.0] |
| 19 Mean length of third stage Show forest plot | 1 | 130 | Mean Difference (IV, Random, 95% CI) | ‐8.12 [‐9.72, ‐6.52] |
| 19.1 High‐income setting | 0 | 0 | Mean Difference (IV, Random, 95% CI) | 0.0 [0.0, 0.0] |
| 19.2 Low‐income setting | 1 | 130 | Mean Difference (IV, Random, 95% CI) | ‐8.12 [‐9.72, ‐6.52] |
| 20 Manual removal of placenta as defined by authors Show forest plot | 1 | 130 | Risk Ratio (M‐H, Random, 95% CI) | 1.0 [0.06, 15.65] |
| 20.1 High‐income setting | 0 | 0 | Risk Ratio (M‐H, Random, 95% CI) | 0.0 [0.0, 0.0] |
| 20.2 Low‐income setting | 1 | 130 | Risk Ratio (M‐H, Random, 95% CI) | 1.0 [0.06, 15.65] |
| 21 Postnatal diastolic blood pressure > 90 mmHg between birth of baby and discharge from the labour ward. | 0 | 0 | Risk Ratio (M‐H, Random, 95% CI) | 0.0 [0.0, 0.0] |
| 21.1 High‐income setting | 0 | 0 | Risk Ratio (M‐H, Random, 95% CI) | 0.0 [0.0, 0.0] |
| 21.2 Low‐income setting | 0 | 0 | Risk Ratio (M‐H, Random, 95% CI) | 0.0 [0.0, 0.0] |
| 22 Postnatal vomiting between birth of baby and discharge from the labour ward | 0 | 0 | Risk Ratio (M‐H, Random, 95% CI) | 0.0 [0.0, 0.0] |
| 22.1 High‐income setting | 0 | 0 | Risk Ratio (M‐H, Random, 95% CI) | 0.0 [0.0, 0.0] |
| 22.2 Low‐income setting | 0 | 0 | Risk Ratio (M‐H, Random, 95% CI) | 0.0 [0.0, 0.0] |
| 23 Any analgesia between birth of the baby and discharge from labour ward | 0 | 0 | Risk Ratio (M‐H, Random, 95% CI) | 0.0 [0.0, 0.0] |
| 23.1 High‐income setting | 0 | 0 | Risk Ratio (M‐H, Random, 95% CI) | 0.0 [0.0, 0.0] |
| 23.2 Low‐income setting | 0 | 0 | Risk Ratio (M‐H, Random, 95% CI) | 0.0 [0.0, 0.0] |
| 24 Women's assessment of pain during third stage as reported by authors | 0 | 0 | Risk Ratio (M‐H, Random, 95% CI) | 0.0 [0.0, 0.0] |
| 24.1 High‐income setting | 0 | 0 | Risk Ratio (M‐H, Random, 95% CI) | 0.0 [0.0, 0.0] |
| 24.2 Low‐income setting | 0 | 0 | Risk Ratio (M‐H, Random, 95% CI) | 0.0 [0.0, 0.0] |
| 25 Secondary blood loss/any vaginal bleeding needing treatment (after 24 hours and up to 6 weeks) | 0 | 0 | Risk Ratio (M‐H, Random, 95% CI) | 0.0 [0.0, 0.0] |
| 25.1 High‐income setting | 0 | 0 | Risk Ratio (M‐H, Random, 95% CI) | 0.0 [0.0, 0.0] |
| 25.2 Low‐income setting | 0 | 0 | Risk Ratio (M‐H, Random, 95% CI) | 0.0 [0.0, 0.0] |
| 26 Amount of lochia either estimated or measured after 24 hours and up to discharge from hospital | 0 | 0 | Mean Difference (IV, Random, 95% CI) | 0.0 [0.0, 0.0] |
| 26.1 High‐income setting | 0 | 0 | Mean Difference (IV, Random, 95% CI) | 0.0 [0.0, 0.0] |
| 26.2 Low‐income setting | 0 | 0 | Mean Difference (IV, Random, 95% CI) | 0.0 [0.0, 0.0] |
| 27 Surgical evacuation of retained products of conception | 0 | 0 | Risk Ratio (M‐H, Random, 95% CI) | 0.0 [0.0, 0.0] |
| 27.1 High‐income setting | 0 | 0 | Risk Ratio (M‐H, Random, 95% CI) | 0.0 [0.0, 0.0] |
| 27.2 Low‐income setting | 0 | 0 | Risk Ratio (M‐H, Random, 95% CI) | 0.0 [0.0, 0.0] |
| 28 Afterpains ‐ abdominal pain associated with the contracting uterus in the postpartum period | 0 | 0 | Risk Ratio (M‐H, Random, 95% CI) | 0.0 [0.0, 0.0] |
| 28.1 High‐income setting | 0 | 0 | Risk Ratio (M‐H, Random, 95% CI) | 0.0 [0.0, 0.0] |
| 28.2 Low‐income setting | 0 | 0 | Risk Ratio (M‐H, Random, 95% CI) | 0.0 [0.0, 0.0] |
| 29 Apgar score < 7 at 5 minutes | 0 | 0 | Risk Ratio (M‐H, Random, 95% CI) | 0.0 [0.0, 0.0] |
| 29.1 High‐income setting | 0 | 0 | Risk Ratio (M‐H, Random, 95% CI) | 0.0 [0.0, 0.0] |
| 29.2 Low‐income setting | 0 | 0 | Risk Ratio (M‐H, Random, 95% CI) | 0.0 [0.0, 0.0] |
| 30 Birthweight | 0 | 0 | Mean Difference (IV, Random, 95% CI) | 0.0 [0.0, 0.0] |
| 30.1 High‐income setting | 0 | 0 | Mean Difference (IV, Random, 95% CI) | 0.0 [0.0, 0.0] |
| 30.2 Low‐income setting | 0 | 0 | Mean Difference (IV, Random, 95% CI) | 0.0 [0.0, 0.0] |
| 31 Neonatal encephalopathy assessed using Sarnat staging (Sarnat 1976; Table 1) | 0 | 0 | Risk Ratio (M‐H, Random, 95% CI) | 0.0 [0.0, 0.0] |
| 31.1 High‐income setting | 0 | 0 | Risk Ratio (M‐H, Random, 95% CI) | 0.0 [0.0, 0.0] |
| 31.2 Low‐income setting | 0 | 0 | Risk Ratio (M‐H, Random, 95% CI) | 0.0 [0.0, 0.0] |
| 32 Neonatal mortality | 0 | 0 | Risk Ratio (M‐H, Random, 95% CI) | 0.0 [0.0, 0.0] |
| 32.1 High‐income setting | 0 | 0 | Risk Ratio (M‐H, Random, 95% CI) | 0.0 [0.0, 0.0] |
| 32.2 Low‐income setting | 0 | 0 | Risk Ratio (M‐H, Random, 95% CI) | 0.0 [0.0, 0.0] |
| 33 Intraventricular haemorrhage ‐ Papille grade III/IV ‐ (for infants born before 34 weeks' gestation only). | 0 | 0 | Risk Ratio (M‐H, Random, 95% CI) | 0.0 [0.0, 0.0] |
| 33.1 High‐income setting | 0 | 0 | Risk Ratio (M‐H, Random, 95% CI) | 0.0 [0.0, 0.0] |
| 33.2 Low‐income setting | 0 | 0 | Risk Ratio (M‐H, Random, 95% CI) | 0.0 [0.0, 0.0] |
| 34 Number of infants who received a red blood cell transfusion. | 0 | 0 | Risk Ratio (M‐H, Random, 95% CI) | 0.0 [0.0, 0.0] |
| 34.1 High‐income setting | 0 | 0 | Risk Ratio (M‐H, Random, 95% CI) | 0.0 [0.0, 0.0] |
| 34.2 Low‐income setting | 0 | 0 | Risk Ratio (M‐H, Random, 95% CI) | 0.0 [0.0, 0.0] |
| 35 Infant Hb level at 24 to 72 hours | 0 | 0 | Mean Difference (IV, Random, 95% CI) | 0.0 [0.0, 0.0] |
| 35.1 High‐income setting | 0 | 0 | Mean Difference (IV, Random, 95% CI) | 0.0 [0.0, 0.0] |
| 35.2 Low‐income setting | 0 | 0 | Mean Difference (IV, Random, 95% CI) | 0.0 [0.0, 0.0] |
| 36 Infant Hb level at 3‐6 months | 0 | 0 | Mean Difference (IV, Random, 95% CI) | 0.0 [0.0, 0.0] |
| 36.1 High‐income setting | 0 | 0 | Mean Difference (IV, Random, 95% CI) | 0.0 [0.0, 0.0] |
| 36.2 Low‐income setting | 0 | 0 | Mean Difference (IV, Random, 95% CI) | 0.0 [0.0, 0.0] |
| 37 Infant iron indices (ferritin) at 3 to 6 months. | 0 | 0 | Risk Ratio (M‐H, Random, 95% CI) | 0.0 [0.0, 0.0] |
| 37.1 High‐income setting | 0 | 0 | Risk Ratio (M‐H, Random, 95% CI) | 0.0 [0.0, 0.0] |
| 37.2 Low‐income setting | 0 | 0 | Risk Ratio (M‐H, Random, 95% CI) | 0.0 [0.0, 0.0] |
| 38 Exclusive breastfeeding at discharge from hospital | 0 | 0 | Risk Ratio (M‐H, Random, 95% CI) | 0.0 [0.0, 0.0] |
| 38.1 High‐income setting | 0 | 0 | Risk Ratio (M‐H, Random, 95% CI) | 0.0 [0.0, 0.0] |
| 38.2 Low‐income setting | 0 | 0 | Risk Ratio (M‐H, Random, 95% CI) | 0.0 [0.0, 0.0] |
| 39 Neurodevelopmental, cognitive or developmental outcomes assessed after age 18 months. | 0 | 0 | Risk Ratio (M‐H, Random, 95% CI) | 0.0 [0.0, 0.0] |
| 39.1 High‐income setting | 0 | 0 | Risk Ratio (M‐H, Random, 95% CI) | 0.0 [0.0, 0.0] |
| 39.2 Low‐income setting | 0 | 0 | Risk Ratio (M‐H, Random, 95% CI) | 0.0 [0.0, 0.0] |
| 40 Return to hospital as in‐ or outpatient because of bleeding (not pre‐specified) | 0 | 0 | Risk Ratio (M‐H, Random, 95% CI) | 0.0 [0.0, 0.0] |
| 40.1 High‐income setting | 0 | 0 | Risk Ratio (M‐H, Random, 95% CI) | 0.0 [0.0, 0.0] |
| 40.2 Low‐income setting | 0 | 0 | Risk Ratio (M‐H, Random, 95% CI) | 0.0 [0.0, 0.0] |
| 41 Postnatal maternal mean Hb (outcome not pre‐specified) | 0 | 0 | Mean Difference (IV, Random, 95% CI) | 0.0 [0.0, 0.0] |
| 41.1 High‐income setting | 0 | 0 | Mean Difference (IV, Random, 95% CI) | 0.0 [0.0, 0.0] |
| 41.2 Low‐income setting | 0 | 0 | Mean Difference (IV, Random, 95% CI) | 0.0 [0.0, 0.0] |