| | Analgesia | |
| Study ID | Treatment | Outcome measure | Success | Rescue Medication |
| Acute | | | | |
| Diebschlag 1987 | (1) Salicylate, adrenal extract, and mucopolysaccharide ointment (Mobilat) (2) Placebo ointment | Movement pain on 100 mm VAS at: (a) 8 days (b) 15 days | No dichotomous data (a) Significant difference in favour of (1) (b) Significant difference in favour of (1) | No data |
| Frahm 1993 | (1) Salicylate and mucopolysaccharide cream (Movelat) (2) Placebo cream | Movement pain on 100 mm VAS at: (a) 9 days (b) 11 days | No dichotomous data (a) Significant difference in favour of (1) (b) No significant difference | No data |
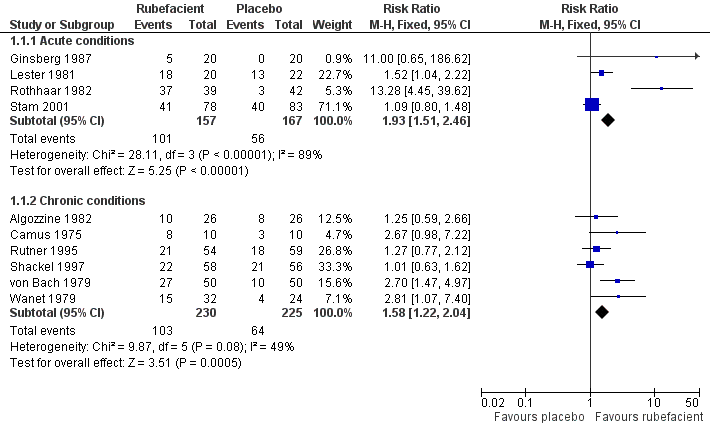
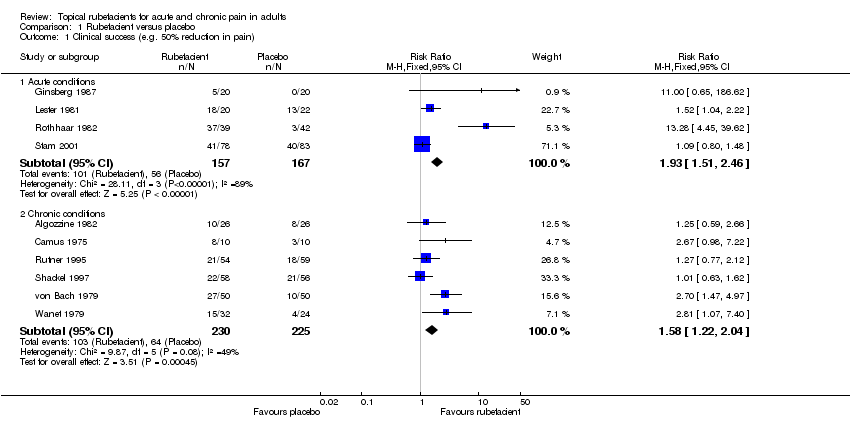
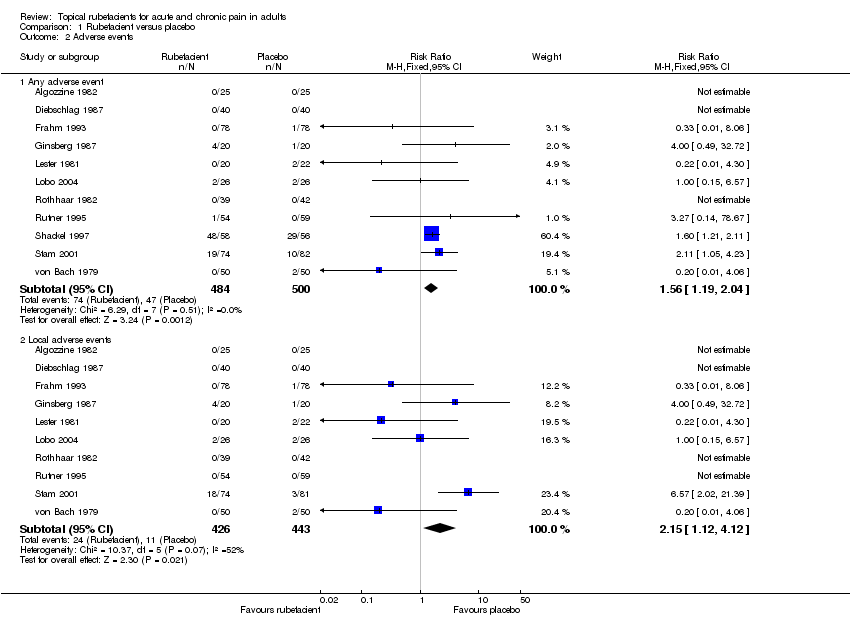
| Ginsberg 1987 | (1) Salicylate and capsicum oleoresin ointment (Rado‐Salil) (2) Placebo ointment | Patient global assessment ('excellent' or 'good') at: (a) 3 days (b) 14 days | (a) (1) 5/20 (2) 0/20 (b) (1) 10/20 (2) 2/20 | Total number of rescue tablets (250 mg paracetamol) used: (1) 24 (2) 36 |
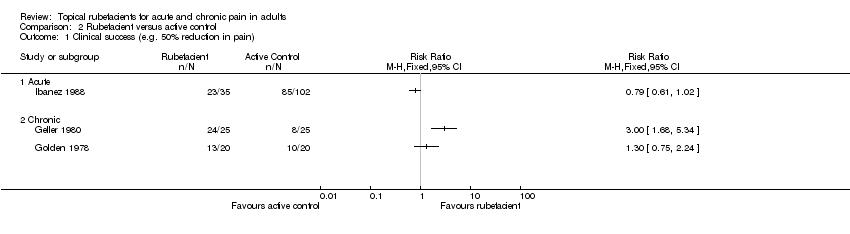
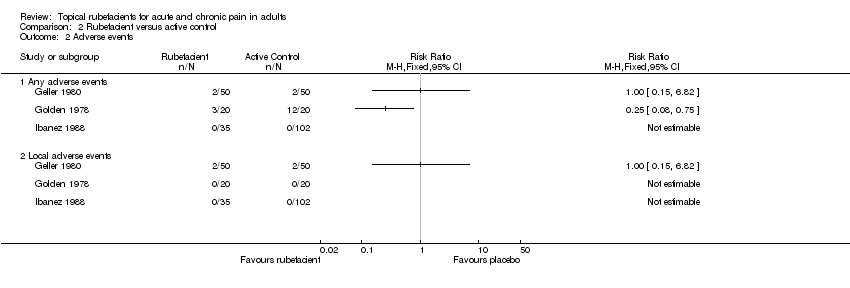
| Ibanez 1988 | (1) Salicylate spray (2) Fepradinol spray active control | 'Cure' at 12 days | (1) 23/35 (2) 85/102 | No data |
| Lester 1981 | (1) Salicylate, adrenal extract, and mucopolysaccharide gel (Movelat) (2) Placebo gel | Relief of pain by 7 days | (1) 18/20 (2) 13/22 | No data |
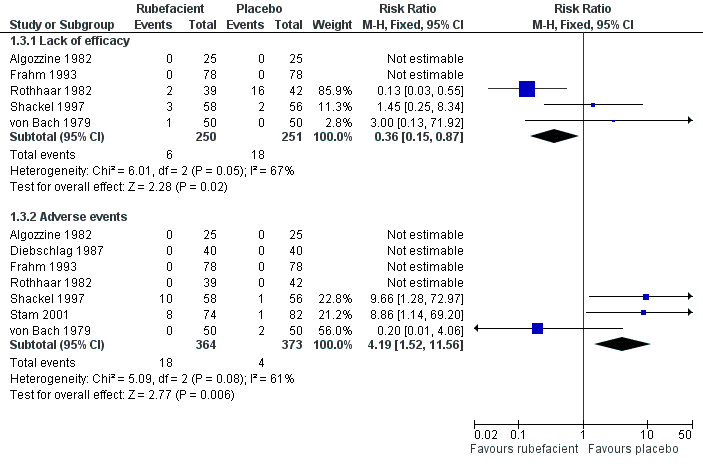
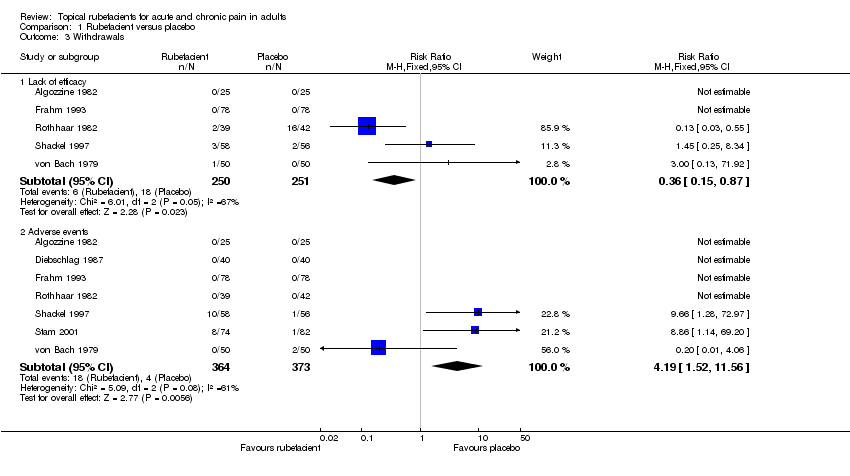
| Rothhaar 1982 | (1) Salicylate gel (Reparil‐Gel) (2) Placebo gel | Patient global assessment ('very good' or 'good') at 9 days | (1) 37/39 (2) 3/42 | No data |
| Stam 2001 | (1) Salicylate, nicotinate, capsicum oleoresin, and histamine gel (Cremor Capsici Compositus FNA) (2) Herbal gel (Spiroflor SRL) active control | 80% reduction in pain on 100 mm VAS at 7 days | (1) 41/78 (2) 40/83 | Number using rescue medication (paracetamol): (1) 65/82 (2) 56/75 |
| Chronic | | | | |
| Algozzine 1982 | (1) Salicylate cream (Myoflex) (2) Placebo cream | Pain relief score at 7 days favours (1) or (2) | (1) 10/26 (2) 8/26 | No data |
| Camus 1975 | (1) Salicylate and myrtecaine cream (Algesal Suractive) (2) Placebo cream | Improvement in rest pain score at 10 days | (1) 8/10 (2) 3/10 | No data |
| Geller 1980 | (1) Salicylate and heparin gel (Dolo‐Menthoneurin) (2) Etofenamate gel active control | Patient global score ('very good' or 'good') after phase 1 at 7 days | (1) 24/25 (2) 8/25 | No data |
| Golden 1978 | (1) Salicylate cream (Aspercreme) + placebo tablets (2) Aspirin tablets + placebo cream active control | Patient global assessment of pain relief ('excellent' or 'good') at 7 days | (1) 13/20 (2) 10/20 | No data |
| Lobo 2004 | (1) Salicylate cream (Theraflex‐TMJ)
(2) Placebo cream | Spontaneous pain VAS (10 cm) at: (a) 15 days (b) 10 days | No dichotomous data (a) Significant difference in favour of (1) (b) No significant difference | No data |
| Rutner 1995 | (1) Salicylate gel (Phardol‐Mono) (2) Placebo gel | Drop‐out 'pain free' by day 14 | (1) 21/54 (2) 18/59 | No data |
| Shackel 1997 | (1) Salicylate gel (2) Placebo gel | Patient global assessment ('very good' or 'good') at 28 days | (1) 22/58 (2) 21/56 | Number using rescue medication (paracetamol): (1) 43/56 (2) 39/55
Average dose (mg/day): (1) 555 (2) 600 |
| von Bach 1979 | (1) Salicylate and nonivamide in heparin and salicylate ointment (Enelbin‐Rheuma) (2) Salicylate in heparin and salicylate ointment active control | Global assessment ('very good' or 'good') at 14 days | (1) 27/50 (2) 10/50 | No data |
| Wanet 1979 | (1) Salicylate and myrtecaine cream (Algesal Suractive) (2) Placebo cream | Rest pain score at 15 days | (1) 15/32 (2) 4/24 | No data |