The use of propofol for procedural sedation in emergency departments
Abstract
Background
There is increasing evidence that propofol is efficacious and safe for procedural sedation (PS) in the emergency department (ED) setting. However, propofol has a narrow therapeutic window and lacks of a reversal agent. The aim of this review was to cohere the evidence base regarding the efficacy and safety profile of propofol when used in the ED setting for PS.
Objectives
To identify and evaluate all randomized controlled trials (RCTs) comparing propofol with alternative drugs (benzodiazepines, barbiturates, etomidate and ketamine) used in the ED setting for PS.
Search methods
We searched the Cochrane Central Register of Controlled Trials (CENTRAL) (The Cochrane Library 2013, Issue 9), MEDLINE (1950 to September week 2 2013) and EMBASE (1980 to week 2 2013). We searched the Current Controlled Trials metaRegister of Clinical Trials (compiled by Current Science) (September 2013). We checked the reference lists of trials and contacted trial authors. We imposed no language restriction. We re‐ran the search in February 2015. We will deal with the one study awaiting classification when we update the review.
Selection criteria
RCTs comparing propofol to alternative drugs (benzodiazepines, barbiturates, etomidate and ketamine) used in the ED setting for PS in participants of all ages.
Data collection and analysis
Two authors independently performed data extraction. Two authors performed trial quality assessment. We used mean difference (MD), odds ratio (OR) and 95% confidence intervals (CI) to measure effect sizes. Two authors independently assessed and rated the methodological quality of each trial using The Cochrane Collaboration tool for assessing risk of bias.
Main results
Ten studies (813 participants) met the inclusion criteria. Two studies only included participants 18 years and younger; six studies only included participants 18 years and older; one study included participants between 16 and 65 years of age and one study included only adults but did not specify the age range. Eight of the included studies had a high risk of bias. The included studies were clinically heterogeneous. We undertook no meta‐analysis.
The primary outcome measures of this review were: adverse effects (as defined by the study authors) and participant satisfaction (as defined by the study authors). In one study comparing propofol/fentanyl with ketamine/midazolam, delayed adverse reactions (nightmares and behavioural change) were noted in 10% of the ketamine/midazolam group and none in the propofol/fentanyl group. Seven individual studies reported no evidence of a difference in adverse effects between intravenous propofol, with and without adjunctive analgesic agents, and alternative interventions. Three individual studies reported no evidence of a difference in pain at the injection site between intravenous propofol and alternative interventions. Four individual studies reported no evidence of a difference in participant satisfaction between intravenous propofol, with and without adjunctive analgesic agents, and alternative interventions (ketamine, etomidate, midazolam). All the studies employed propofol without the use of an adjunctive analgesic and all, except one, were small (fewer than 100 participants) studies. The quality of evidence for the adverse effects and participant satisfaction outcomes was very low.
Nine included studies (eight comparisons) reported all the secondary outcome measures of the review except mortality. It was not possible to pool the results of the included studies for any of the secondary outcome measures because the comparator interventions were different and the measures were reported in different ways. Seven individual studies reported no evidence of difference in incidence of hypoxia between intravenous propofol, with and without adjunctive analgesic agents, and alternative interventions.
Authors' conclusions
No firm conclusions can be drawn concerning the comparative effects of administering intravenous propofol, with or without an adjunctive analgesic agent, with alternative interventions in participants undergoing PS in the ED setting on adverse effects (including pain at the injection site) and participant satisfaction. The review was limited because no two included studies employed the same comparator interventions, and because the number of participants in eight of the included studies were small (fewer than 100 participants).
PICO
Plain language summary
Comparison of propofol (an anaesthetic drug) with other drug options for sedating people undergoing painful procedures in emergency departments
Background
Propofol is a drug frequently used as a general anaesthetic to sedate (calm) people for surgery in the operating theatre. It is administered into a vein. There is increasing evidence that propofol can be used outside of the operating theatre to sedate people undergoing painful procedures (e.g. when relocating a joint that is out of its normal position because of an injury) in the emergency department (ED) setting.
Review question
We reviewed the evidence regarding the use of propofol to sedate people in the ED undergoing painful medical procedures. We wanted to discover the effectiveness and safety of propofol compared with other drugs used to sedate people in the ED.
Study characteristics
The evidence obtained is current to September 2013. We re‐ran the search in February 2015 and we will deal with the study awaiting classification when we update the review. We included 10 studies involving 813 participants. The included studies compared propofol with five other alternative drugs used to sedate people in the ED. We could not pool the results of the 10 studies because no two studies compared the same drug options.
Key results
We found very low quality evidence for the effects of propofol and the other drugs used for sedating people in the ED in terms of complications (side effects, including pain at the injection site) and participant satisfaction. In one study comparing a drug combination of propofol and fentanyl (a painkiller) with midazolam and ketamine (a drug which acts as both a painkiller and a sedative), delayed adverse reactions (nightmares and behavioural change) were noted in 10% of the ketamine/midazolam group and none in the propofol/fentanyl group.
Quality of the evidence
The quality of the evidence was overall very low.
Authors' conclusions
Summary of findings
| Intravenous propofol compared with alternative intravenous sedative or hypnotic for emergency department procedural sedation | ||||||
| Patient or population: emergency department procedural sedation | ||||||
| Outcomes | Illustrative comparative risks* (95% CI) | Relative effect | No of participants | Quality of the evidence | Comments | |
| Assumed risk | Corresponding risk | |||||
| Alternative intravenous sedative or hypnotic | Intravenous propofol | |||||
| Adverse effects (as defined by study authors) | Study population | Not estimable | 527 | ⊕⊝⊝⊝ | Clinical heterogeneity prevented a summary statistic | |
| 0 per 1000 | 0 per 1000 | |||||
| Participant satisfaction (as defined by study authors) | Study population | Not estimable | 413 | ⊕⊝⊝⊝ | Clinical heterogeneity prevented a summary statistic | |
| 0 per 1000 | 0 per 1000 | |||||
| Pain with injection | Study population | Not estimable | 193 | ⊕⊝⊝⊝ | Clinical heterogeneity prevented a summary statistic | |
| 0 per 1000 | 0 per 1000 | |||||
| *The basis for the assumed risk (e.g. the median control group risk across studies) is provided in footnotes. The corresponding risk (and its 95% confidence interval) is based on the assumed risk in the comparison group and the relative effect of the intervention (and its 95% CI). | ||||||
| GRADE Working Group grades of evidence | ||||||
| 1The 7 included studies all employed different comparator interventions (Coll‐Vinent 2003; Dunn 2011; Godambe 2003; Havel 1999; Miner 2010; Parlak 2006; Taylor 2005). The quality of evidence was rated down 3 levels for risk of bias because of very serious concerns about inadequate blinding. Coll‐Vinent 2003 reported that the physician responsible for observing time intervals and recovery time was not blinded to the agent used. Dunn 2011 employed no blinding. Godambe 2003 reported blinding of participants, parents and reviewers of the recorded procedure. Havel 1999 reported that blinding during sedation was achieved by shielding medications, infusion tubing and intravenous site from everyone but the study investigator. Miner 2010 reported that neither participants nor staff were blinded to the study drug being administered. Parlak 2006 reported that only the researcher collecting data was blinded to the study drug. Taylor 2005 reported that the doctor performing the procedure was blinded but not the sedation doctor. The quality of evidence was rated down 3 levels for imprecision because the reported CIs around the estimates of treatment effect were very wide. The quality of evidence was rated down 3 levels for inconsistency due to significant clinical heterogeneity in the studies reporting this outcome measure. The quality of evidence was rated down 1 level for indirectness because in 1 study the setting included the coronary care unit (Parlak 2006). The quality of evidence was rated down 3 levels for publication bias because the available evidence comes from small studies (6 of the 7 studies reporting this outcome measure employed fewer than 100 participants). 2The 4 included studies all employed different comparator interventions (Coll‐Vinent 2003; Miner 2007; Miner 2010; Parlak 2006). The quality of evidence was rated down three levels for risk of bias because of very serious concerns about inadequate blinding. Coll‐Vinent 2003 reported that the physician responsible for observing time intervals and recovery time was not blinded to the agent used. Miner 2010 and Miner 2007 reported that neither participants nor staff were blinded to the study drug being administered. Parlak 2006 reported that only the researcher collecting data was blinded to the study drug. The quality of evidence was rated down 3 levels for imprecision because the only reported CI around the estimates of treatment effect was very wide (Miner 2007). The quality of evidence was rated down 3 levels for inconsistency due to significant clinical heterogeneity in the studies reporting this outcome measure. The quality of evidence was rated down 1 level for indirectness because in 1 study the setting included the coronary care unit (Parlak 2006). The quality of evidence was rated down 3 levels for publication bias because the available evidence comes from small studies (3 of the 4 studies reporting this outcome measure employed fewer than 100 participants). 3The 3 included studies all employed different comparator interventions (Coll‐Vinent 2003; Havel 1999; Taylor 2005). The quality of evidence was rated down 3 levels for risk of bias because of very serious concerns about inadequate blinding. Coll‐Vinent 2003 reported that the physician responsible for observing time intervals and recovery time was not blinded to the agent used. Havel 1999 reported that blinding during sedation was achieved by shielding medications, infusion tubing and intravenous site from everyone but the study investigator. Taylor 2005 reported that the doctor performing the procedure was blinded but not the sedation doctor. The quality of evidence was rated down 3 levels for imprecision because the reported CIs around the estimates of treatment effect were very wide (Havel 1999; Taylor 2005). The quality of evidence was rated down 3 levels for inconsistency due to significant clinical heterogeneity in the studies reporting this outcome measure. The quality of evidence was not rated down for indirectness because all the studies reporting this outcome measure, which is important to participants, where applied to the emergency department participant population. The quality of evidence was rated down 3 levels for publication bias because the available evidence comes from small studies (all the studies reporting this outcome measure employed fewer than 100 participants). | ||||||
Background
Description of the condition
Many people presenting to emergency departments (ED) are in an anxious state because they are in distressing pain (e.g. due to a joint dislocation). Their anxiety is further heightened by some of the painful procedures required for the management of the underlying clinical condition (e.g. reduction of a dislocated joint). Procedural sedation (PS) may be required for sedation, hypnosis and relaxation for painful procedures. It may also be required to provide adequate operating conditions by minimizing movement or by inducing amnesia for unpleasant procedures (e.g. wound closure by suturing in children). When analgesia cannot be guaranteed in adults, PS may also be required.
Accordingly, the management of sedation and analgesia is an important component of comprehensive emergency medical care (Godwin 2014). People undergoing painful procedures in the ED may, therefore, require a potent sedative in addition to opioid analgesia to proactively address pain and anxiety. This proactive strategy may improve quality of care and participant satisfaction by facilitating interventional procedures and minimizing suffering (Godwin 2014).
Description of the intervention
Since its introduction in 1977, propofol (2,6‐diisopropylphenol) has gained popularity with anaesthetists for sedation in the operating theatre, and for PS in many settings (Kaye 2014; Mittal 2013; Tang 2010). It is an intravenous hypnotic agent commonly used in general anaesthesia for the induction and maintenance of anaesthesia and sedation.
How the intervention might work
Propofol has many properties that make it an attractive agent for PS in the ED setting (Kaye 2014). Propofol has a rapid onset of action, its clinical effect is essentially immediate after administration ('one arm‐brain circulatory time'), and it produces hypnosis usually within 20 to 40 seconds from the time of injection (Kaye 2014). Peak effect occurs at 92 seconds (Caro 2012; Diprivan 2002). It has an ultrashort half‐life (distribution t½ two to four minutes) with extremely short recovery times (RT) after sedation, typically between five and 10 minutes (Caro 2012). Its marked potency reliably produces effective PS and analgesia, even for very painful procedures (Green 2003). Propofol use is rarely associated with emesis (Green 2003). The disadvantages of propofol include lack of a direct analgesic effect, lack of a reversal agent, respiratory and haemodynamic depression, and a narrow therapeutic window (Green 2003; Kaye 2014).
Why it is important to do this review
There is increasing evidence that propofol may be an appropriate agent for use as part of ED PS (Godwin 2014; Kaye 2014). In the US, the Joint Commission permits the use of propofol by emergency physicians, depending on the policy of their individual hospitals (Bahn 2005; Green 2003; The Joint Commission 2005). However, the Joint Commission emphasises that the physician administering propofol for sedation must be qualified to manage the person at whatever level of sedation or anaesthesia is achieved, either intentionally or unintentionally (The Joint Commission 2008). In addition, the Joint Commission emphasises that the physician administering the sedation must be qualified to monitor the patient, even if there is need for additional monitoring personnel (The Joint Commission 2008). One published Cochrane protocol focused on anaesthetic and sedative agents used only for electrical cardioversion is of relevance (Reed 2013). The aim of this systematic review is to provide an objective evidence base to inform future clinical practice guidelines regarding the efficacy and safety profile of propofol when used in the ED setting for sedation in a wide range of procedures.
Objectives
To identify and evaluate all randomized controlled trials (RCTs) comparing propofol with alternative drugs (benzodiazepines, barbiturates, etomidate and ketamine) used in the ED setting for PS.
Methods
Criteria for considering studies for this review
Types of studies
We included RCTs and quasi‐RCTs in all languages.
We defined an RCT as a study in which participants were allocated to treatment groups on the basis of a random method (e.g. using random number tables) and a quasi‐RCT as one in which treatment allocation was done using a quasi‐random method (e.g. hospital number, date of birth). We excluded studies with a cross‐over design.
Types of participants
We included participants of all ages undergoing PS by ED staff in the ED setting.
Types of interventions
The target intervention was administration of intravenous propofol, with or without the use of adjunctive opioid or non‐opioid analgesic agents, compared with another intravenous sedative or hypnotic also administered with or without the use of adjunctive opioid or non‐opioid analgesic agents to provide PS in the ED setting.
Inclusion criteria
Any study in which propofol with or without the use of adjunctive opioid or non‐opioid analgesic agents was compared against another sedative or hypnotic with or without the use of adjunctive opioid or non‐opioid analgesic agents for PS in the ED setting.
Exclusion criteria
Any study in which two or more sedatives were used in either study arm.
Types of outcome measures
Primary outcomes
-
Adverse effects (as defined by the study authors).
-
Participant satisfaction (as defined by the study authors).
Secondary outcomes
-
Physician satisfaction (as defined by the study authors).
-
Awakening time (as defined by the study authors).
-
Procedural recall by participant.
-
Bispectral index (BIS) score during PS.
-
Incidence of hypoxia.
-
Need for ventilation.
-
Incidence of hypotension.
-
Minor complications (as defined by the study authors).
-
Major complications (as defined by the study authors).
-
Mortality.
-
Cost.
Search methods for identification of studies
Electronic searches
We performed a computer‐assisted search without language restriction for RCTs comparing propofol (Diprivan; Fresofol; Pofol; Propofol; Recofol) with alternative drugs used in the ED setting for PS. We searched the Cochrane Central Register of Controlled Trials (CENTRAL; Appendix 1) on The Cochrane Library (2013, Issue 9), MEDLINE (1950 to September week 2, 2013; Appendix 2), EMBASE (1980 to week 2, 2013; Appendix 3), CINAHL (Appendix 4) and ISI Web of Science (Appendix 5). We used the Cochrane sensitivity‐maximising RCT filter (Lefebvre 1996). We also searched the Current Controlled Trials metaRegister of Clinical Trials (compiled by Current Science) (September 2013). We re‐ran the search in February 2015. We will deal with any studies of interest when we update the review.
Searching other resources
We also searched the reference lists of review articles, relevant trials, textbooks and abstracts of scientific meetings to identify further RCTs. We reviewed the titles and abstracts to identify all potential RCTs. We obtained the full‐text versions of these articles. We made additional efforts to identify potential RCTs relevant to the topic from the following data sources:
-
foreign language literature;
-
grey literature (theses, internal reports, non‐peer reviewed journals);
-
references (and references of references) cited in primary sources;
-
other unpublished sources known to experts in the speciality (sought by personal communication);
-
raw data from published trials (sought by personal communication).
We did not impose a language restriction.
Data collection and analysis
We conducted data collection and analysis following the guidelines available in the Cochrane Handbook of Systematic Reviews of Interventions (Higgins 2011).
Selection of studies
Three authors (JG, GOC and SM) independently screened all titles and abstracts for potentially relevant studies. We retrieved full‐text copies of all papers that were deemed potentially eligible by consensus of two authors (JG and GOC) and screened them against the inclusion criteria. We resolved differences by consensus between the two authors (JG and GOC) and by consulting a third author (AW) as necessary.
Data extraction and management
Two authors (AM and ER) independently extracted data using a standardized data collection form that included information regarding the name of the first author, year of publication, study design, study population and study setting. In addition to information pertaining to participant characteristics, study inclusion and exclusion criteria, details of the interventions compared and study outcomes, we extracted information regarding study methodology. This included the method of randomization, allocation concealment, frequency and handling of withdrawals, and adherence to the intention‐to‐treat principle. We contacted the trialists to obtain missing data or to clarify study design features, where necessary. We resolved disagreements through discussion and consultation with a third author (AW) as required. We were not blinded to the names of the study authors, investigators, institutions or the results.
Assessment of risk of bias in included studies
Two authors (AM and ER) independently assessed and rated the methodological quality of each trial using The Cochrane Collaboration tool for assessing risk of bias (Higgins 2011). We judged the quality of the studies by evaluating the studies for the six domains found in Appendix 6. The six domains were as follows.
-
Random sequence generation.
-
Allocation concealment.
-
Blinding of participants and personnel.
-
Blinding of outcome assessment.
-
Incomplete outcome data.
-
Other bias (other sources of bias).
We evaluated each study and assessed each separately for these domains. We judged each explicitly as follows:
-
low risk of bias;
-
high risk of bias;
-
unclear risk (lack of information or uncertainty over the potential for bias).
We entered the data on what was reported to have happened in the study in the 'risk of bias' table in Review Manager 5 (RevMan 2014). We contacted trialists to obtain further information if clarity was required regarding an included study. We present a summary figure of the 'risk of bias in included studies' in the review. This provides a context for discussing the reliability of the results of this review. We resolved any disagreement by referring to a third author (AW) to reach a consensus.
Measures of treatment effect
We planned to calculate summary estimates of treatment effect with 95% confidence intervals (CI) for each comparison. For continuous data, we planned to use the mean difference (MD) whenever outcomes were measured in a standard way across studies. This has the advantage of summarizing results in natural units that are easily understood. We planned to use the standardized mean difference (SMD) if it was desirable to summarize results across studies with outcomes that are conceptually the same but measured in different ways (e.g. different pain scores). For dichotomous (or binary) data, we planned to describe results both as a relative measure (risk ratio (RR)) and an absolute measure (risk difference). Relative measures (such as RRs) can be used to combine studies but absolute measures (such as the risk difference) are particularly useful when considering trade‐offs between the likely benefits and likely harms of an intervention (Deeks 2008).
Dealing with missing data
No simple solution exists for the problem of missing data. We handled this problem by contacting the investigators, whenever possible, to ensure that no data were missing for their study. In addition, we made explicit the assumptions of whatever method was used to cope with missing data.
Assessment of heterogeneity
We planned to evaluate clinical heterogeneity (differences between studies in key characteristics of the participants, interventions or outcome measures). In the absence of clinical heterogeneity, we planned to use the I2 statistic to describe the percentage of total variation across studies that was due to heterogeneity rather than chance (Higgins 2003). We planned to consider an I2 > 50% as significant statistical heterogeneity. We also planned to use visual inspection of the graphic representation of studies with their 95% CI to assess heterogeneity. We planned to generate tables and graphs using the analysis module included in Review Manager 5 (RevMan 2014). We planned to represent pooled odds ratios (OR) pictorially as a 'forest plot' to permit visual examination of the degree of heterogeneity between studies.
Assessment of reporting biases
Detecting publication bias is difficult; it is better to avoid it (Glasziou 2001). We avoided publication bias by comprehensive literature searching and use of study registries (Glasziou 2001). We planned to use a graphical display (funnel plot) of the size of the treatment effect against the precision of the trial (1/standard error) to investigate publication bias, by examining for signs of asymmetry. Publication bias is associated with asymmetry (Light 1984). We planned to seek reasons other than publication bias if there was asymmetry; for example, poor methodological quality of smaller studies, true heterogeneity, artefact or chance (Egger 1997).
Data synthesis
Two authors (PS and JC) independently entered data into Review Manager 5 for statistical analysis (RevMan 2014). The results concentrated on the objectives and comparisons specified in the protocol of the review. Post hoc analyses were identified as such. We planned to analyse results using both fixed‐effect and random‐effects models, because for each model there are situations where the result is counterintuitive. We planned to give more emphasis to the random‐effects model if there was significant statistical heterogeneity (I2 > 50%) and the differences in the results were of practical importance. The random‐effects model takes into account between‐study variability as well as within‐study variability. We planned to also use a fixed‐effect model to test the robustness of the analysis and for outliers. We planned to consider the appropriateness of meta‐analysis in the presence of significant clinical or statistical heterogeneity. We planned to perform meta‐analyses using Review Manager 5 (RevMan 2014). For dichotomous (or binary) data, we planned to describe the results both as a relative measure (OR, RR, and relative risk reduction) and an absolute measure (risk difference). Relative measures (ORs and RRs) can be used to combine studies but absolute measures can be more informative than relative measures because they reflect the baseline risk as well as the change in risk with the intervention. For continuous data, we planned to use the MD whenever outcomes were measured in a standard way across studies. This has the advantage of summarizing results in natural units that are easily understood. If it was desirable to summarize results across studies with outcomes that were conceptually the same but measured in different ways (e.g. different pain scores), we planned to use SMDs.
We generated tables and graphs using the analysis module included in Review Manager 5 (RevMan 2014). We planned to represent pooled ORs pictorially as a 'forest plot' to permit visual examination of the degree of heterogeneity between studies.
We minimized publication bias by comprehensive literature searching (Glasziou 2001). In addition, we planned to use a graphical display (funnel plot) of the size of the treatment effect against the precision of the trial (1/standard error) to investigate publication bias.
We employed the Grades of Recommendation, Assessment, Development and Evaluation (GRADE) approach to assess the quality of evidence for each primary outcome (Langendam 2013), and the GRADE profiler (GRADEpro) allowed us to create a 'Summary of findings' table. This table provides outcome‐specific information concerning the overall quality of evidence from studies included in the comparison (summary of findings Table for the main comparison). The following outcomes were included in the summary of findings Table for the main comparison table:
-
adverse effects (as defined by the study authors);
-
participant satisfaction (as defined by the study authors);
-
pain with injection.
Using the GRADE approach, the quality of the evidence may be downgraded for factors such as study limitations, inconsistency of results, imprecision, indirectness of evidence or publication bias. The basis of our judgements using the GRADE approach is made explicit in the footnotes of the summary of findings Table for the main comparison.
Subgroup analysis and investigation of heterogeneity
We evaluated clinical heterogeneity (differences between studies in key characteristics of the participants, interventions or outcome measures). In the absence of clinical heterogeneity, we planned to use the I2 statistic to describe the percentage of total variation across studies that was due to heterogeneity rather than chance (Higgins 2003). We planned to consider an I2 > 50% as significant statistical heterogeneity. We also planned to use visual inspection of the graphic representation of studies with their 95% CI to assess heterogeneity.
We planned to investigate heterogeneity by performing four subgroup analyses based on intuitive reasons:
-
older people (participants aged 65 and older) because these participants have relatively limited cardiorespiratory reserve with an increased likelihood to experience adverse effects during PS;
-
single sedationist or operator versus separate operator and sedationist;
-
use of propofol in trauma versus non‐trauma emergencies;
-
PS using propofol in the ED setting by anaesthetist versus non‐anaesthetist.
Sensitivity analysis
We planned to perform sensitivity analyses to test how sensitive the results were to reasonable changes in the assumptions that were made and in the methods for combining the data (Lau 1998). We planned to perform sensitivity analysis regarding RCTs versus quasi‐RCTs and eventually good‐quality studies versus poor‐quality studies. We defined a good‐quality study as one that has all of the following domains: adequate allocation concealment, blinding of outcome assessment and data analysis performed according to the intention‐to‐treat principle. We defined a poor‐quality study as one that lacked one or more of these key domains.
Results
Description of studies
See: Characteristics of included studies; Characteristics of excluded studies.
Results of the search
We identified 13 abstracts from the 6273 results obtained by searching according to the methods mentioned in Search methods for identification of studies. Figure 1 presents the details. One included study had two abstract publications. Twelve abstracts qualified (by consensus) for full‐text analysis. We accessed all 12 full‐text versions of the abstracts, and two were excluded for the reasons detailed in Figure 1. Thus, 10 studies met the a priori criteria for inclusion in the final analysis.
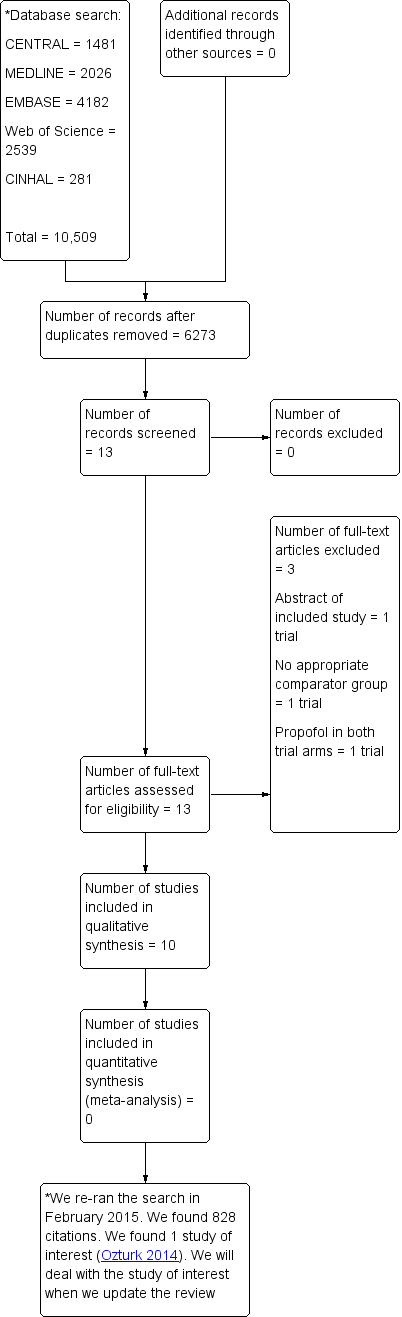
Study flow diagram.
We re‐ran the search in February 2015. We found 828 citations. We found one study of interest, which is mentioned in Characteristics of studies awaiting classification. We will deal with the study of interest when we update the review.
Included studies
The review included 10 studies (Ab‐Rahman 2010; Coll‐Vinent 2003; Dunn 2011; Godambe 2003; Havel 1999; Holger 2005; Miner 2007; Miner 2010; Parlak 2006; Taylor 2005) (Table 1). One study was eligible and is awaiting classification (Ozturk 2014).
| Study | Total number of participants randomized | Intervention 1 | Intervention 2 | Intervention 3 |
| 40 | Propofol/fentanyl | Midazolam/fentanyl | None | |
| 32 | Propofol | Etomidate | Midazolam | |
| 40 | Propofol/remifentanyl | Midazolam/fentanyl | None | |
| 113 | Propofol/fentanyl | Ketamine/midazolam | None | |
| 89 | Propofol | Midazolam | None | |
| 32 | Propofol | Midazolam | None | |
| 214 | Propofol | Etomidate | None | |
| 97 | Propofol | Ketamine | None | |
| 70 | Propofol/fentanyl | Midazolam/fentanyl | None | |
| 86 | Propofol | Midazolam/fentanyl | None |
Study participants
Two studies only included participants aged 18 years and younger (Godambe 2003; Havel 1999); four studies included participants aged 18 years and older (Coll‐Vinent 2003; Miner 2007; Miner 2010; Taylor 2005); one study included participants aged between 16 and 65 years (Dunn 2011); one study included participants aged between 18 and 65 years (Holger 2005); one study included two different age groups, younger than 65 years and older than 65 years, but did not report any specific lower age limit (Parlak 2006); and one study included only adults but did not specify the age range (Ab‐Rahman 2010).
Characteristics of interventions
The interventions compared with propofol in this review were diverse (Table 1).
Although three studies compared propofol with midazolam (Coll‐Vinent 2003; Havel 1999; Holger 2005), the three studies employed different drug dosing regimens for the comparator interventions. Furthermore, two studies involved adults (aged 18 to 65 years) (Coll‐Vinent 2003; Holger 2005), while one study involved children (aged 2 to 18 years) (Havel 1999).
Two studies compared propofol/fentanyl and midazolam/fentanyl, but the dosing regimens employed for the comparator interventions were different in the two studies (Ab‐Rahman 2010; Parlak 2006). Additionally, Ab‐Rahman 2010 reported recruiting "all trauma (except head injury) and non‐trauma adult patients" while Parlak 2006 recruited only people with atrial fibrillation requiring cardioversion.
Outcomes measured
Seven studies reported the first primary outcome measure of this review, adverse effects (as defined by the study authors) (Table 2). Three studies reported pain at the injection site (a well‐known adverse effect associated with propofol injection) (Coll‐Vinent 2003; Havel 1999; Taylor 2005). Four studies reported the second primary outcome measure of this review, participant satisfaction (as defined by the study authors) (Table 3).
| Study | Adverse effects reported |
| Myoclonus, bronchospasm, pain at injection site, re‐sedation | |
| Oversedation | |
| Agitation, emesis, laryngospasm, apnoea, delayed adverse reactions (nightmares and behavioural change) | |
| Pain with injection, oversedation, post‐discharge complications (nausea/vomiting, persistent sedation, fever and recall) | |
| Recovery agitation | |
| Desaturation, apnoea | |
| Moaning, partial airway obstruction, pain at intravenous site, vomiting |
| Study | Method used to assess participant satisfaction |
| Ordinal scale (not satisfied, moderately satisfied, satisfied, very satisfied) | |
| 100‐mm satisfaction visual analogue scale consisting of the question, How satisfied are you with the treatment you received during this procedure? With the words 'completely satisfied' and 'not satisfied at all' on either side of the 100‐mm line | |
| Quote: "after the patients returned to their baseline mental status, they were asked if they felt any pain during the procedure or were able to recall any of the procedure (yes/no). They were also asked if they were satisfied with the treatment they received during the procedure" | |
| Quote: "patient satisfaction subsequently was evaluated with a questionnaire including Likert‐type questions" |
Nine included studies reported one or more of the secondary outcome measures of this review, except mortality (Coll‐Vinent 2003; Dunn 2011; Godambe 2003; Havel 1999; Holger 2005; Miner 2007; Miner 2010; Parlak 2006; Taylor 2005). None of the included studies in this review explicitly reported mortality as an outcome measure. One included study did not report any of the secondary outcome measures of this review (Ab‐Rahman 2010).
Excluded studies
We excluded three trials (Ab‐Rahman 2008; Miner 2005; Miner 2009). One of the excluded trials was a prospective RCT of ED PS with propofol alone; there was no comparator intravenous sedative or hypnotic (Miner 2005). One trial was a non‐blinded prospective RCT of ED deep PS with propofol with or without an intravenous opioid analgesic (alfentanil); there was no comparator intravenous sedative or hypnotic (Miner 2009). One trial was an abstract publication of an included studies (Ab‐Rahman 2008). The Characteristics of excluded studies table and Figure 1 show the details of the excluded studies.
Awaiting classification
One study is awaiting classification (Ozturk 2014) (Characteristics of studies awaiting classification table).
Ongoing studies
We found no ongoing studies.
Risk of bias in included studies
We evaluated the overall quality of each study according to the methodology detailed in Assessment of risk of bias in included studies. The Characteristics of included studies table presents the different risk of bias domains. Figure 2 and Figure 3 present a graph and summary of the risk of bias of included studies.

Risk of bias graph: review authors' judgements about each risk of bias item presented as percentages across all included studies.

Risk of bias summary: review authors' judgements about each risk of bias item for each included study.
Allocation
Concerning allocation concealment, four of the included studies had no concealment of allocation (Dunn 2011; Holger 2005; Miner 2007; Miner 2010).
Blinding
In three of the included studies, the trial personnel were blinded but the participants were not blinded (Ab‐Rahman 2010; Parlak 2006; Taylor 2005). In two of the included studies, the trial personnel were not blinded but the participants were blinded (Godambe 2003; Havel 1999). There was no blinding in one included study (Coll‐Vinent 2003).
Incomplete outcome data
Three of the included studies had evidence of attrition bias as detailed in the Characteristics of included studies table (Ab‐Rahman 2010; Havel 1999; Holger 2005).
Selective reporting
There was no evidence of reporting bias in any of the included studies.
Other potential sources of bias
There was no obvious other potential sources of bias identified in the included trials. Given the relatively small number of included trials, we were unable to assess publication bias using the funnel plot approach (Higgins 2011).
Effects of interventions
Primary outcome measures
We created a 'Summary of findings' table that included the primary outcome measures of our review: adverse effects (as defined by the study authors) and participant satisfaction (as defined by the study authors) (summary of findings Table for the main comparison).
Adverse effects
Seven included studies reported adverse effects as an outcome measure (Coll‐Vinent 2003; Dunn 2011; Godambe 2003; Havel 1999; Miner 2010; Parlak 2006; Taylor 2005) (Table 2). Three included studies did not report adverse effects as an outcome measure (Ab‐Rahman 2010; Holger 2005; Miner 2007). The seven studies that reported adverse effects as an outcome measure could not be pooled for meta‐analysis because the studies employed different comparisons.
Propofol versus ketamine
The only trial comparing propofol versus ketamine reported no serious adverse events (Miner 2010). Recovery agitation was reported in four (8.0%) participants in the propofol group and 17 (36.2%) participants in the ketamine group (difference 28.2%, 95% CI 12.4% to 43.9%). Four participants in the ketamine group required treatment with intravenous midazolam for recovery agitation. The other 13 participants did not require additional medications for recovery agitation. All of these episodes resolved without further incident.
Propofol versus midazolam
The only trial comparing propofol versus midazolam assessed the following adverse effects: pain with injection, oversedation and post‐discharge complications (nausea/vomiting, persistent sedation, fever and recall) (Havel 1999). There was no significant difference between propofol and midazolam in terms of pain with injection (P value = 0.67; OR 1.65, 95% CI 0.21 to 15.02), oversedation (P value = 0.82; OR 0.91, 95% CI 0.52 to 1.68) or agitation (P value = 1.00; OR 0.7, 95% CI 0.08 to 5.53). There was also no difference between propofol and midazolam regarding the following post‐discharge complications: nausea/vomiting (P value = 0.5; OR 1.51, 95% CI 0.4 to 5.83), persistent sedation (P value = 0.25; OR 0.52, 95% CI 0.15 to 1.8), fever (P value = 0.45; OR 0.0, 95% CI 0.0 to 14.3) and recall (P value = 0.44; OR 2.21, 95% CI 0.33 to 18.42) (Havel 1999).
Propofol/fentanyl versus ketamine/midazolam
The only trial comparing propofol/fentanyl versus ketamine/midazolam reported no significant difference in the following adverse events: agitation (P value = 0.106), emesis (P value = 0.226), pain (P value = 0.497), laryngospasm (P value = 1.000) and apnoea (P value = 1.000) (Godambe 2003). Delayed adverse reactions (nightmares and behavioural change) were noted in 10% of the ketamine/midazolam group and 0% of the propofol/fentanyl group (Godambe 2003).
Propofol versus midazolam/fentanyl
The only trial comparing propofol versus midazolam/fentanyl reported no significant difference in the following specified adverse events: moaning (P value = 0.154; MD 17.8%, 95% CI ‐5.5% to 41%), partial airway obstruction (P value = 0.815; MD 0.7%, 95% CI ‐16% to 17.3%), pain at the intravenous site (P value = 0.627; MD 3.7%, 95% CI ‐7.7% to 14.6%) and vomiting (P value = 1; MD 2.1%, 95% CI ‐4.3% to 8.5%) (Taylor 2005).
Propofol versus etomidate versus midazolam (with and without flumazenil)
The only trial comparing propofol versus etomidate versus midazolam (with and without flumazenil) reported the following adverse effects: myoclonus (etomidate = 4, propofol = 0, midazolam = 0, midazolam/flumazenil = 0), bronchospasm (etomidate = 1, propofol = 1, midazolam = 0, midazolam/flumazenil = 0), pain at injection site (etomidate = 4), re‐sedation (midazolam/flumazenil = 5) (Coll‐Vinent 2003).
Propofol/fentanyl versus midazolam/fentanyl
In the only trial comparing propofol/fentanyl versus midazolam/fentanyl, two participants younger than 65 years who received midazolam/fentanyl desaturated, compared with one participant younger than 65 years who received propofol/fentanyl (Parlak 2006). In participants older than 65 years who received midazolam/fentanyl, 16 participants desaturated, compared with desaturation in four participants older than 65 years who received propofol/fentanyl (Parlak 2006).
Concerning apnoea, one participant younger than 65 years who received midazolam/fentanyl and one participant younger than 65 years who received propofol/fentanyl experienced apnoea (Parlak 2006). In participants older than 65 years, six participants who received midazolam/fentanyl and two participants who received propofol/fentanyl experienced apnoea (Parlak 2006).
Remifentanil/propofol versus morphine/midazolam
In the only trial comparing remifentanil/propofol versus morphine/midazolam, two participants given midazolam required flumazenil within 10 minutes of shoulder reduction to counter oversedation. One of these participants had been given additional morphine (total 20 mg), as shoulder reduction proved impossible within the morphine dose limit set by the trial. The trial reported no other adverse events (Dunn 2011).
Participant satisfaction
Four included studies reported participant satisfaction as an outcome measure (Coll‐Vinent 2003; Miner 2007; Miner 2010; Parlak 2006) (Table 3). Six included studies did not report participant satisfaction as an outcome measure (Ab‐Rahman 2010; Dunn 2011; Havel 1999; Godambe 2003; Holger 2005; Taylor 2005). The four included studies that reported participant satisfaction as an outcome measure could not be pooled for meta‐analysis because the studies employed different comparisons.
Propofol versus ketamine
The only included study comparing propofol versus ketamine reported that 100% of participants in both groups reported satisfaction with the procedure (Miner 2010).
Propofol versus etomidate
The only included study comparing propofol versus etomidate used a satisfaction visual analogue scale (VAS) (Miner 2007). This scale consisted of the question, How satisfied are you with the treatment you received during this procedure? with the words "completely satisfied" and "not satisfied at all" on either side of the 100‐mm line (Miner 2007). Participants who received propofol reported a higher participant satisfaction (10.3 mm, 95% CI 7.0 to 13.6) than that those who received etomidate (9.8 mm, 95% CI 6.1 to 13.6), but the difference was not statistically significant (MD ‐0.4, 95% CI ‐5.4 to 4.5).
Propofol versus midazolam
In the only included study comparing propofol versus midazolam, the participants were placed in four groups using a stratified randomization method: participants aged younger than 65 years old who received midazolam or propofol, and participant 65 years and older who received either midazolam or propofol (Parlak 2006). It reported no participant dissatisfaction in both the midazolam and the propofol group for the participants aged younger than 65 years; for participants 65 years and older, it reported "2 not sure" for both the midazolam group and the propofol group (Parlak 2006).
Propofol versus etomidate versus midazolam (with and without flumazenil)
The only included study comparing propofol versus etomidate versus midazolam (with and without flumazenil) measured participant satisfaction by using an ordinal scale (not satisfied, moderately satisfied, satisfied, very satisfied) (Coll‐Vinent 2003). In the etomidate group, seven participants were "very satisfied" and two participants were "satisfied"; in the propofol group, seven participants were "very satisfied" and two participants were "satisfied"; in the midazolam without flumazenil group, four participants were "very satisfied" and four participants were "satisfied"; in the midazolam with flumazenil group, two participants were "very satisfied" and four participants were "satisfied" (Coll‐Vinent 2003).
Secondary outcomes
Propofol versus ketamine
One trial comparing propofol versus ketamine reported the following secondary outcomes relevant to this review: procedural recall, incidence of hypoxia, need for ventilation and incidence of hypotension (Miner 2010). The trial did not report the following secondary outcomes relevant to this review: physician satisfaction, awakening time, BIS score during PS, mortality and cost (Miner 2010).
Incidence of hypoxia was defined as oxygen saturation of less than 92% at any time during the procedure. Need for ventilation was defined as clinical interventions related to respiratory depression (increased supplemental oxygen, airway adjunct used, airway repositioning and stimulation to induce breathing). Hypotension was defined as a systolic blood pressure (SBP) less than 100 mmHg. Adverse effects (complications) were reported without being subdivided into major and minor complications as specified in the protocol of this review (Miner 2010).
There was no significant difference in the following secondary outcome measures with propofol compared with ketamine: procedural recall, incidence of hypoxia and incidence of hypotension (Table 4) (Miner 2010). There was also no significant difference with propofol compared with ketamine regarding the need for ventilation: clinical interventions related to respiratory depression were present in 26 of 50 propofol participants and 19 of 47 ketamine participants (P value = 0.253; effect size ‐13.7%, 95% CI ‐33.8% to 6.4%).
| Secondary outcome measure | Odds ratio (95% confidence interval) |
| Procedural recall | 0.93 (0.28 to 3.1) |
| Incidence of hypoxia | 1.11 (0.34 to 3.59) |
| Incidence of hypotension | 0.94 (0.13 to 6.94) |
Propofol versus etomidate
One trial comparing propofol versus etomidate reported the following secondary outcomes: procedural recall by participant, BIS score during PS, incidence of hypoxia, need for ventilation and incidence of hypotension (Miner 2007). The trial did not report the following secondary outcomes relevant to this review: physician satisfaction, awakening time, complications, mortality and cost (Miner 2007).
Incidence of hypoxia was defined as oxygen saturation of less than 92% at any time during the procedure. Need for ventilation was defined as clinical interventions related to respiratory depression (increased supplemental oxygen, airway adjunct used, airway re‐positioning and stimulation to induce breathing). Hypotension was defined as a SBP less than 100 mmHg.
There was no significant difference in the following secondary outcome measures with propofol compared with etomidate: procedural recall, BIS nadir, incidence of hypoxia, need for ventilation and hypotension (decrease in SBP from baseline) (Table 5) (Miner 2007).
| Secondary outcome measure | Summary statistic (95% confidence interval) |
| Procedural recall | SMD ‐0.24 (‐0.51 to 0.03) |
| BIS nadir | MD 1.6 (‐4.1 to 6.2) |
| Incidence of hypoxia | OR 0.96 (0.38 to 2.41) |
| Need for ventilation | OR 1.21 (0.32 to 4.65) |
| Decrease in SBP from baseline | MD ‐4.1 (‐6.4% to 1.7%) |
MD: mean difference; OR: odds ratio; SMD: standardized mean difference.
Propofol versus midazolam
One trial comparing propofol versus midazolam reported the following secondary outcomes: awakening time, procedural recall, hypoxia, need for ventilation and hypotension (Havel 1999).
Hypoxia was defined as a pulse oximetry reading less than 93%. Hypotension was calculated by comparing lowest observed SBP measurement with previously defined 50th percentile SBP for age and gender. Adverse effects (complications) were reported without being subdivided into major and minor complications as specified in the protocol of this review.
There was no significant difference in the following measurements between groups: hypoxia P value = 1 (OR 1.08, 95% CI 0.24 to 4.76) and procedural recall (P value = 0.44; OR 2.21, 95% CI 0.33 to 18.42). No participants in either group required assisted ventilation or intubation. No participant in either group became hypotensive as defined by the study authors (Havel 1999).
There was a significant difference for awakening time (mean time from last drug dose to recovery) between the propofol group and the midazolam group (14.9 ± 11.1 minutes versus 76.4 ± 47.5 minutes; P value < 0.001) (Havel 1999).
One trial comparing propofol versus midazolam reported the following secondary outcomes: physician satisfaction, awakening times, procedural recall, hypoxia and cost (Holger 2005). The trial did not report the following secondary outcomes relevant to this review: BIS, need for ventilation, hypotension and mortality (Holger 2005).
Physician satisfaction was assessed with a 100‐mm VAS with the words "extremely unsatisfied", "extremely satisfied" at either end. This was measured for titration, sedation and recovery for both drugs. Awakening time for this study was described as "recovery" with the following features: "(1) normal vital signs; (2) orientation to person, place and time without slurred speech; (3) the ability to sit on the side of the bed unassisted; (4) ability to walk five steps and return unassisted" (if able to do this before the procedure). Hypoxia and hypotension were not defined.
There was no significant difference between the propofol group and the midazolam group for 24‐hour recall (P value not given). Hypoxia was "not noted" in any participant (Holger 2005).
There were significant differences for cost and physician satisfaction: participants in the midazolam group had significantly higher costs (P value < 0.001) and physician satisfaction was greater for propofol in terms of sedation titration (P value = 0.02) (Holger 2005).
The results of the two trials could not be pooled because different drug doses and different outcome measures were employed.
Propofol/fentanyl versus ketamine/midazolam
One trial comparing propofol/fentanyl versus ketamine/midazolam reported the following secondary outcomes relevant to this review: physician satisfaction, awakening time (RT and total sedation time (TST)), procedural recall, hypoxia, need for ventilation and hypotension. The trial did not report the following secondary outcome measures relevant to this review: BIS scores, mortality and cost (Godambe 2003).
Hypoxia was measured as "transient desaturation", which was defined as "any amount of time during which a patient's oxygen saturation was <90%". There was no awakening time but equivalents were TST defined as "time that elapsed from when the first dose of medication was given to when the patient returned to baseline", and RT defined as "time that elapsed from when the last dose of medication was given to when the participant returned to his or her baseline". Physician satisfaction was assessed using a 5‐point Likert scale (with 1 representing the least and 5 the highest level of satisfaction with the PS and analgesia) (Godambe 2003).
There was no significant difference between groups for the following secondary outcome measures: physician satisfaction score, recall, hypoxia and hypotension (Table 6) (Godambe 2003). However, there was significantly shorter RT and TST for propofol/fentanyl compared with ketamine/midazolam (P value < 0.0001) (Godambe 2003).
| Secondary outcome measure | P value |
| Physician satisfaction score | 0.245 |
| Recall | 1.0 |
| Hypoxia | 0.002 |
| Hypotension | 1.0 |
Propofol versus midazolam/fentanyl
One trial comparing propofol versus midazolam/fentanyl reported the following secondary outcomes relevant to this review: awakening time, recall, hypoxia, need for ventilation and hypotension. The trial did not report the following secondary outcome measures relevant to this review: physician satisfaction, BIS scores, mortality and cost (Taylor 2005).
Awakening time was recorded as two measures: time to first awakening and time to full wakefulness. Hypotension and hypoxia (decreased oxygen saturation) were recorded but not specifically defined. Adverse events (complications) were reported without being subdivided into major and minor complications as specified in the protocol of this review. Recorded adverse events were moaning, pain at the intravenous site, respiratory depression (defined as decreased rate or decreased oxygen saturation or partial obstruction, or a combination of these) and vomiting.
There was no significant difference for the following outcome measures: time to first awakening, recall, hypoxia and hypotension (Table 7) (Taylor 2005). No participant required ventilation (Taylor 2005).
| Secondary outcome measure | Mean difference (95% confidence interval) | P value |
| Time to first awakening | 4.6 (0.7 to 8.6) | 0.097 |
| Recall | 6.3% (‐6.1% to 18.6%) | 0.309 |
| Hypoxia | 3.1% (‐9.9% to 16%) | 0.69 |
| Hypotension | 2.6% (‐4.8% to 10.1%) | 0.442 |
There was a significantly shorter time to full wakefulness in the propofol group (P value < 0.001; MD 21.7, 95% CI 14.7 to 28.7) (Taylor 2005).
Propofol versus etomidate versus midazolam (with and without flumazenil)
One trial comparing propofol versus etomidate versus midazolam (with and without flumazenil) reported the following secondary outcomes relevant to this review: awakening time, recall, hypoxia, need for ventilation and hypotension. The trial did not report the following secondary outcome measures relevant to this review: physician satisfaction, BIS, mortality and cost (Coll‐Vinent 2003).
Awakening time was defined as the duration from the start of induction until spontaneous eye opening. Desaturation (hypoxia) was defined at oxygen saturation below 90%. There was no significant difference between the interventions in terms of desaturation and hypotension. The median awakening time was longer in the midazolam group (21 minutes; range one to 42 minutes) compared with the etomidate group (9.5 minutes; range five to 11 minutes), propofol group (eight minutes; range three to 15 minutes) and midazolam/flumazenil group (three minutes; range two to five minutes) (Coll‐Vinent 2003). Data for procedural recall was not reported. No participant required ventilatory support (Coll‐Vinent 2003).
Propofol/fentanyl versus midazolam/fentanyl
Two trials compared propofol/fentanyl versus midazolam/fentanyl (Ab‐Rahman 2010; Parlak 2006).
One trial employing this comparison reported the following secondary outcome measures relevant to this review: awakening time, recall, hypoxia and hypotension (Parlak 2006). The trial did not report the following secondary outcome measures relevant to this review: physician satisfaction, BIS, need for ventilation, mortality and cost (Parlak 2006).
Desaturation (hypoxia) was defined as blood oxygen level lower than 95%. Awakening time (RT) was assessed and defined by the authors as time to reach Ramsay Sedation Scale 2 (RSS‐2). SBP and diastolic blood pressure (DBP) were recorded at baseline (zero minutes), every five minutes for the first 30 minutes, and at 45 and 60 minutes (Parlak 2006).
There was no difference for recall of event (P value not given) between the groups. Although both SBP and DBP during the procedure were decreased in all groups, there was no statistically significant differences in SBP and DBP by time among the four groups (P value for SBP = 0.6; P value for DBP = 0.7). More episodes of apnoea were recorded in the over 65‐year‐old groups for both propofol and midazolam but this did not reach significance (P value = 0.39) (Parlak 2006).
There was a significantly shorter mean RT for both propofol groups (i.e. under 65 years, over 65 years), when compared with both midazolam groups (P value < 0.001 in both age groups; overall P value < 0.001) (Parlak 2006).
There were significantly more desaturations in the midazolam over 65‐year‐old group relative to the under 65‐year‐old group (P value < 0.05), and for propofol in the over 65‐year‐old group relative to the under 65‐year‐old group (P value < 0.05; overall P value < 0.001) (Parlak 2006).
One trial employing this comparison did not report any of the secondary outcome measures relevant to this review (Ab‐Rahman 2010).
Although the trial did not specifically report incidence of hypoxia or need for ventilation as an outcome measure, the outcome measures included respiratory rate, oxygen saturation and end‐tidal carbon dioxide (EtCO2) (Ab‐Rahman 2010). The trial reported no significant difference between the propofol/fentanyl group and the midazolam/fentanyl group with regard to respiratory rate pre‐procedure (P value = 0.574), intra‐procedure (P value = 0.082) and post‐procedure (P value = 0.554). Similarly, the trial reported no significant difference between the groups with regard to oxygen saturation pre‐procedure (P value = 0.226), intra‐procedure (P value = 0.106) and post‐procedure (P value = 0.215). The trial also reported no significant difference in EtCO2 between the propofol/fentanyl group and the midazolam/fentanyl group pre‐procedure (P value = 0.558), intra‐procedure (P value = 0.775) and post‐procedure (P value = 0.606).
Although the trial did not specifically report the incidence of hypotension as an outcome measure, the outcome measurements included SBP, DBP and mean arterial pressure (MAP). There was no statistically significant difference between the propofol/fentanyl group and the midazolam/fentanyl group with regard to SBP pre‐procedure (P value = 0.679), intra‐procedure (P value = 0.388) and post‐procedure (P value = 0.608). Similarly, there was no statistically significant difference between the groups with regard to DBP pre‐procedure (P value = 0.731), intra‐procedure (P value = 0.868) and post‐procedure (P value = 0.989). The trial also reported no significant difference in MAP between the propofol/fentanyl group and the midazolam/fentanyl group pre‐procedure (P value = 0.765), intra‐procedure (P value = 0.744) and post‐procedure (P value = 0.733).
Remifentanil/propofol versus morphine/midazolam
One trial compared remifentanil/propofol versus morphine/midazolam (Dunn 2011). It reported only one secondary outcome measure relevant to this review, awakening time (reported as RT).
The trial did not report the following secondary outcome measures relevant to this review: physician satisfaction, procedural recall by participant, BIS score during procedure, incidence of hypoxia, need for ventilation, incidence of hypotension, mortality and cost.
The trial reported that all 20 participants given remifentanil and propofol were completely recovered after 30 minutes, in contrast to the 20 participants given morphine and midazolam, where 17 out of 20 had recovered completely within one hour. The median RTs were 15 minutes (95% CI 15 to 20) for the remifentanil/propofol group and 45 minutes (95% CI 29 to 48) for the morphine/midazolam group (Dunn 2011).
Subgroup analysis
One small study involving 70 participants reported comparisons relevant to one of the subgroup analyses that we planned to perform: a subgroup analysis on older people (participants aged 65 and older) (Parlak 2006). However, due to the potential for false‐positive and false‐negative findings, it was not scientifically valid to do a subgroup analysis based on one small study.
It was not possible to perform the following subgroup analyses as stated in the protocol of this review because none of the included studies investigated the relevant comparisons: single sedationist or operator versus separate operator and sedationist, the use of propofol in trauma versus non‐trauma emergencies and PS using propofol in the ED setting by anaesthetist versus non‐anaesthetist.
Sensitivity analysis
It was not possible to perform a scientifically valid sensitivity analysis because the methodological quality of the included studies did not significantly differ.
Discussion
Summary of main results
This review summarized the current evidence from RCTs comparing intravenous propofol (with or without the use of adjunctive opioid or non‐opioid analgesic drugs) to other sedative agents (with or without the use of adjunctive opioid or non‐opioid analgesic drugs) for PS in the ED setting. We excluded trials employing propofol in different comparator arms (e.g. propofol compared with a combination of ketamine and propofol (ketofol)). The review found no evidence to support a difference in the primary outcome measures, adverse effects and participant satisfaction (as defined by the trialists). Specifically, seven of the 10 included studies reported adverse effects as an outcome measure and four of the 10 included studies reported participant satisfaction as an outcome measure.
The number of participants in the seven trials that reported adverse effects as an outcome measure ranged from 32 to 113. The alternative interventions employed in the trials were ketamine (Miner 2010), midazolam (Coll‐Vinent 2003; Havel 1999; Parlak 2006), midazolam/fentanyl (Dunn 2011; Taylor 2005), ketamine/midazolam (Godambe 2003), and etomidate (Coll‐Vinent 2003). The number of participants in the four trials that reported participant satisfaction as an outcome measure ranged from 32 to 214. The alternative interventions employed in the trials reporting participant satisfaction as an outcome measure were ketamine (Miner 2010), etomidate (Miner 2007), midazolam (Parlak 2006), and midazolam with and without flumazenil (Coll‐Vinent 2003). The four trials reported participant satisfaction using different methods. In terms of the participants in the trials reporting the primary outcome measures of this review, two trials recruited all adult ED participants (aged over 18 years) who were to receive PS (Miner 2007; Miner 2010), one trial recruited haemodynamically stable adult ED participants (aged over 18 years) undergoing cardioversion for a supraventricular arrhythmia (flutter or atrial fibrillation) (Coll‐Vinent 2003), one trial recruited ED and coronary care unit (CCU) participants undergoing elective cardioversion for atrial fibrillation (Parlak 2006), one trial recruited ED participants (aged 16 to 65 years) undergoing closed shoulder dislocation reduction (Dunn 2011), one trial recruited children (aged three to 18 years) undergoing PS for emergency orthopaedic procedures (Godambe 2003), and one trial recruited children (aged two to 18 years) with isolated extremity injuries necessitating closed reduction (Havel 1999). Due to the variability in the participants, the comparator interventions, the types of adverse effects reported and the method of reporting participant satisfaction (clinical heterogeneity) we could not pool the data regarding the primary outcome measures in a meta‐analysis.
Concerning the secondary outcome measures of this review, six of the included studies reported a significantly shorter awakening time (RT) with intravenous propofol compared with alternative sedative drugs (Coll‐Vinent 2003; Dunn 2011; Godambe 2003; Havel 1999; Parlak 2006; Taylor 2005). The alternative sedative drugs employed in these trials were: midazolam/fentanyl (Dunn 2011), midazolam without an adjunctive analgesic drug (Havel 1999; Parlak 2006), etomidate (Coll‐Vinent 2003), and ketamine/midazolam (Godambe 2003). The shorter awakening (recovery) times associated with propofol was consistent with its known ultra‐short half‐life (Caro 2012).
The two included studies that reported physician satisfaction as an outcome measure were conflicting. One study that compared propofol with midazolam reported that physician satisfaction, assessed using a 100‐mm VAS, was greater for propofol in terms of sedation titration (Holger 2005). The second study that compared propofol/fentanyl with ketamine/midazolam found no significant difference between the groups in terms of physician satisfaction assessed using a 5‐point Likert scale (Godambe 2003). While one of the studies recruited 40 adults (aged 18 to 65 years) undergoing any painful procedure that required sedation (Holger 2005), the other study recruited 113 children (aged three to 18 years) undergoing only orthopaedic PS (Godambe 2003). The clinical differences between these two studies and their conflicting findings mean that no firm conclusion can be drawn from this review regarding physician satisfaction when intravenous propofol is compared with alternative sedative drugs.
The only study that reported cost as an outcome measure found significantly higher costs with midazolam compared with propofol (Holger 2005). The cost‐effective analysis defined cost as drug cost (midazolam, USD10.91 per vial; propofol, USD7.98 per vial) plus nursing cost (mean of USD32.00 per hour, salary plus benefits); multiple vials were accounted for if necessary. The study reported that participants in the midazolam group had significantly higher costs compared with the propofol group, with a difference of USD11.99 per participant (P value < 0.001) (Holger 2005). However, the trialists reported that the actual relevance of the amount of this difference when compared with the total costs of the ED encounter may be debatable (Holger 2005). Additionally, the study employed a convenience sample of participants with a relatively small sample size (40 participants were enrolled; 32 participants completed the study and were included in the analysis). Therefore, the cost of intravenous propofol compared with alternative sedative drugs may be imprecise.
Regarding the other secondary outcome measures of this review, we found no evidence to support a difference between intravenous propofol and alternative sedative drugs for ED PS with regard to the following: procedural recall by participant, BIS score during PS, incidence of hypoxia, need for ventilation, incidence of hypotension and complications. Due to clinical heterogeneity (variability in participants recruited, interventions employed and the methods used in reporting the respective outcome measures) among the trials that reported these secondary outcome measures, the trial data could not be pooled for meta‐analysis.
Only one study reported comparisons relevant to one of the subgroup analyses that we planned to perform: a subgroup analysis on older people (participants aged 65 and older) (Parlak 2006). However, the small number of participants in each comparator group (ranging from 11 to 25) in the study means the findings were imprecise and no firm conclusions could be drawn regarding this subgroup analysis (Parlak 2006).
Overall completeness and applicability of evidence
The 10 included studies in this review had participants, interventions and outcomes that were appropriate to our objectives and outcomes, both primary and secondary. The main issues with the applicability of this evidence include the relatively small number of studies reporting each outcome measure, the high risk of bias in the included studies and the presence of significant clinical heterogeneity. The studies were conducted using people in the ED with diverse clinical conditions, including unspecified limb injury requiring PS (Godambe 2003; Havel 1999; Holger 2005), dislocated joint reduction (Dunn 2011; Miner 2007; Miner 2010; Taylor 2005), fracture reduction (Miner 2007; Miner 2010), tibial traction pin placement (Miner 2007; Miner 2010), incision and drainage of abscess (Holger 2005; Miner 2007; Miner 2010), chest tube insertion (Miner 2007; Miner 2010), cardioversion (Coll‐Vinent 2003; Miner 2007; Miner 2010; Parlak 2006), and foreign body removal (Miner 2007). The interventions compared with propofol were also very diverse and included etomidate (Coll‐Vinent 2003; Miner 2007), midazolam (Coll‐Vinent 2003; Havel 1999; Holger 2005; Parlak 2006), ketamine (Miner 2010), a combination of ketamine and midazolam (Godambe 2003), and a combination of midazolam and fentanyl (Ab‐Rahman 2010; Dunn 2011; Taylor 2005).
None of the included studies in this review explicitly reported mortality as an outcome measure. However, one of the studies comparing propofol/remifentanil with midazolam/morphine reported no other adverse events besides two participants given midazolam requiring flumazenil within 10 minutes of shoulder reduction to counter oversedation (Dunn 2011).
Quality of the evidence
Overall, the quality of the evidence evaluated with the GRADE methodology (within‐study risk of bias, directness of evidence, heterogeneity, precision of effect estimates and risk of publication bias) was in general very low (Langendam 2013). The included studies were prospective RCTs but none was of high quality. The included studies were clinically heterogeneous, employing different participants, comparator interventions and different methods of assessing the outcome measures of interest in this review.
Potential biases in the review process
We did not contact pharmaceutical companies, so it is theoretically possible that some relevant studies were not identified. However, in practical terms, the comprehensive nature of our literature search makes it unlikely that we have missed any other relevant studies. Otherwise, we firmly adhered to the protocol to perform the review and there is no identifiable obvious source of any other potential bias in the review process.
Agreements and disagreements with other studies or reviews
We found no published systematic reviews similar to our review. This review does not include a meta‐analysis.

Study flow diagram.
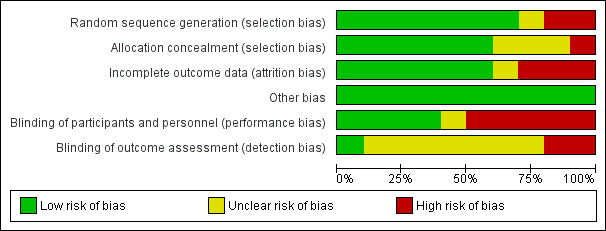
Risk of bias graph: review authors' judgements about each risk of bias item presented as percentages across all included studies.
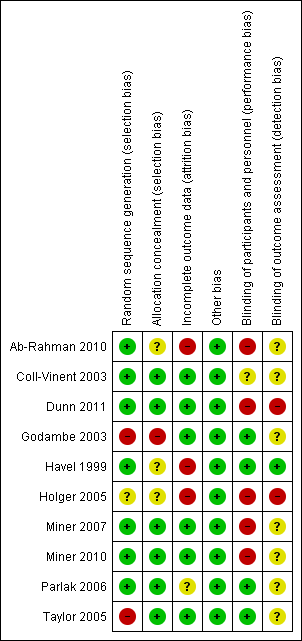
Risk of bias summary: review authors' judgements about each risk of bias item for each included study.
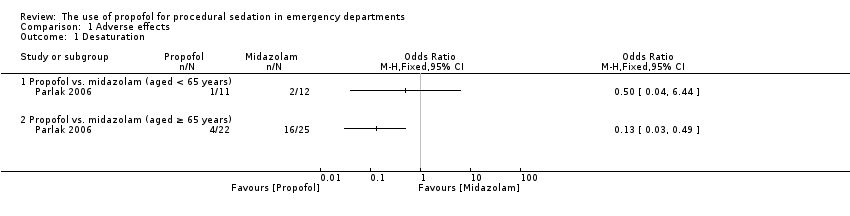
Comparison 1 Adverse effects, Outcome 1 Desaturation.
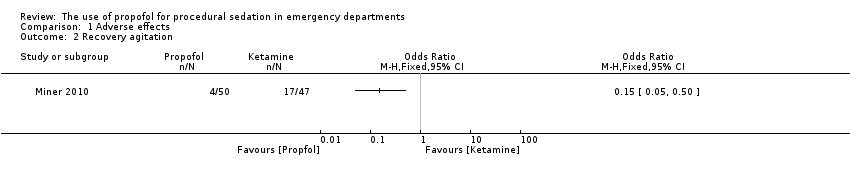
Comparison 1 Adverse effects, Outcome 2 Recovery agitation.
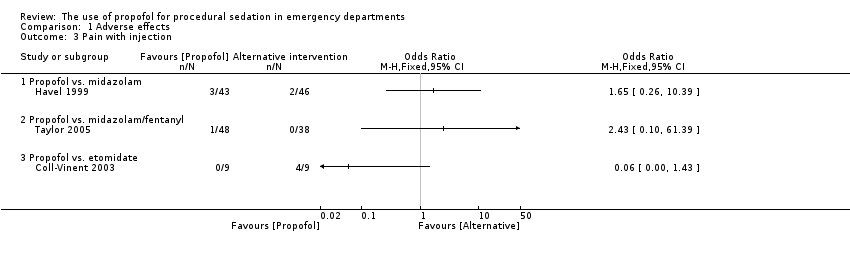
Comparison 1 Adverse effects, Outcome 3 Pain with injection.
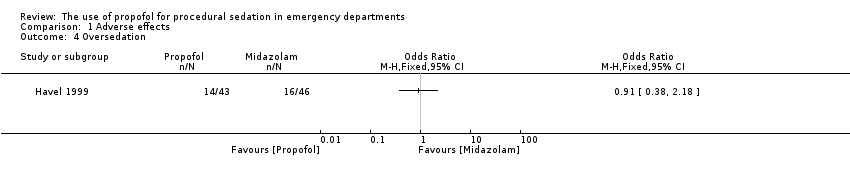
Comparison 1 Adverse effects, Outcome 4 Oversedation.
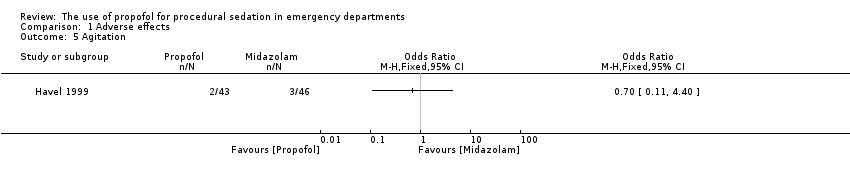
Comparison 1 Adverse effects, Outcome 5 Agitation.
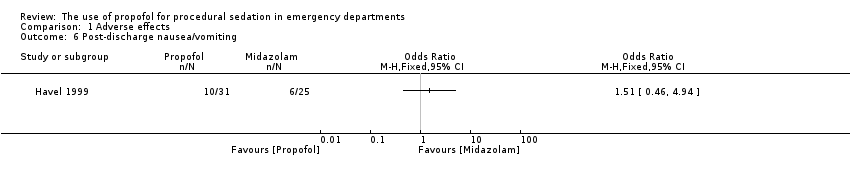
Comparison 1 Adverse effects, Outcome 6 Post‐discharge nausea/vomiting.
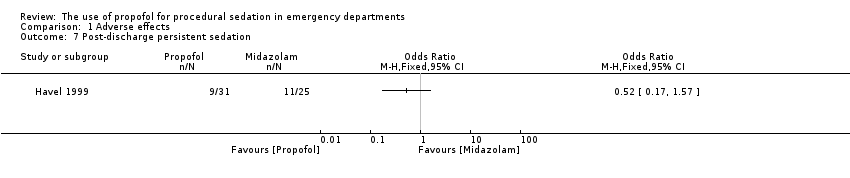
Comparison 1 Adverse effects, Outcome 7 Post‐discharge persistent sedation.

Comparison 1 Adverse effects, Outcome 8 Post‐discharge fever.
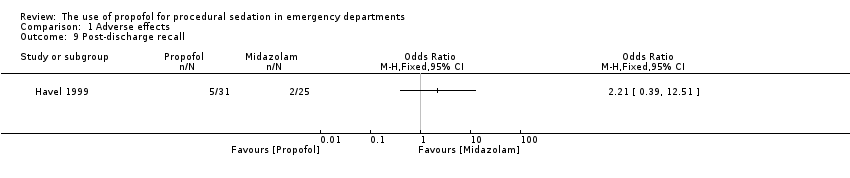
Comparison 1 Adverse effects, Outcome 9 Post‐discharge recall.

Comparison 1 Adverse effects, Outcome 10 Agitation.
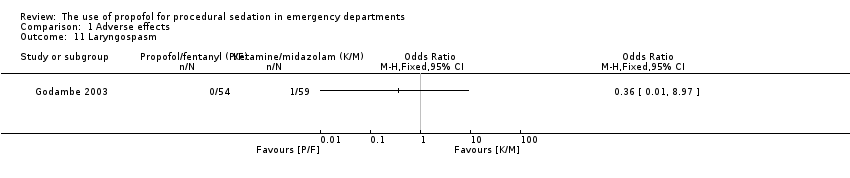
Comparison 1 Adverse effects, Outcome 11 Laryngospasm.

Comparison 1 Adverse effects, Outcome 12 Moaning.

Comparison 1 Adverse effects, Outcome 13 Partial airway obstruction.
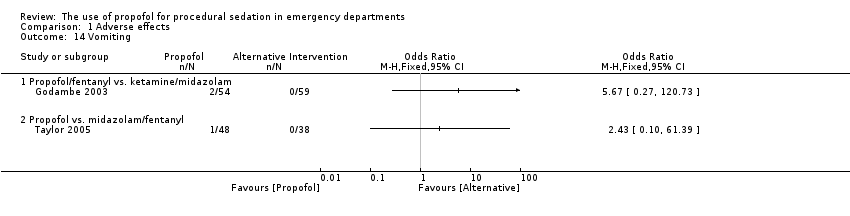
Comparison 1 Adverse effects, Outcome 14 Vomiting.

Comparison 1 Adverse effects, Outcome 15 Apnoea.
| Study | Propofol (n=109) | Etomidate (n=105) |
| Propofol vs. etomidate | ||
| Miner 2007 | 10.3 mm (95% CI 7.0 to 13.6) | 9.8 mm (95% CI 6.1 to 13.6) |
Comparison 2 Participant satisfaction, Outcome 1 Participant satisfaction using a visual analogue scale.
| Study | Propofol (n=50) | Ketamine (n=47) |
| Propofol vs. ketamine | ||
| Miner 2010 | 100% of patients reporting satisfaction with the procedure | 100% of patients reporting satisfaction with the procedure |
Comparison 2 Participant satisfaction, Outcome 2 Participant satisfaction by asking if satisfied with treatment received.
| Study | Propofol (n=11) | Midazolam (n=12) |
| Propofol vs. midazolam (aged < 65 years) | ||
| Parlak 2006 | All 11 patients satisfied with procedure | All 12 patients satisfied with procedure |
| Propofol vs. midazolam (aged ≥ 65 years) | ||
| Parlak 2006 | 20 patients satisfied with procedure; 2 not sure | 20 patients satisfied with procedure; 2 not sure |
Comparison 2 Participant satisfaction, Outcome 3 Participant satisfaction by using a Likert‐type questionnaire.
| Study | Propofol (n=9) | Etomidate (n=9) | Midazolam (n=8) | Midazolam with flumazenil (n=6) |
| Propofol vs. etomidate vs. midazolam (with or without flumazenil) | ||||
| Coll‐Vinent 2003 | 7 patients were "very satisfied"; 2 patients were "satisfied" | 7 patients were "very satisfied"; 2 patients were "satisfied" | 4 patients were "very satisfied"; 4 patients were "satisfied" | 2 patients were "very satisfied"; 4 patients were "satisfied" |
Comparison 2 Participant satisfaction, Outcome 4 Participant satisfaction using an ordinal scale.
| Intravenous propofol compared with alternative intravenous sedative or hypnotic for emergency department procedural sedation | ||||||
| Patient or population: emergency department procedural sedation | ||||||
| Outcomes | Illustrative comparative risks* (95% CI) | Relative effect | No of participants | Quality of the evidence | Comments | |
| Assumed risk | Corresponding risk | |||||
| Alternative intravenous sedative or hypnotic | Intravenous propofol | |||||
| Adverse effects (as defined by study authors) | Study population | Not estimable | 527 | ⊕⊝⊝⊝ | Clinical heterogeneity prevented a summary statistic | |
| 0 per 1000 | 0 per 1000 | |||||
| Participant satisfaction (as defined by study authors) | Study population | Not estimable | 413 | ⊕⊝⊝⊝ | Clinical heterogeneity prevented a summary statistic | |
| 0 per 1000 | 0 per 1000 | |||||
| Pain with injection | Study population | Not estimable | 193 | ⊕⊝⊝⊝ | Clinical heterogeneity prevented a summary statistic | |
| 0 per 1000 | 0 per 1000 | |||||
| *The basis for the assumed risk (e.g. the median control group risk across studies) is provided in footnotes. The corresponding risk (and its 95% confidence interval) is based on the assumed risk in the comparison group and the relative effect of the intervention (and its 95% CI). | ||||||
| GRADE Working Group grades of evidence | ||||||
| 1The 7 included studies all employed different comparator interventions (Coll‐Vinent 2003; Dunn 2011; Godambe 2003; Havel 1999; Miner 2010; Parlak 2006; Taylor 2005). The quality of evidence was rated down 3 levels for risk of bias because of very serious concerns about inadequate blinding. Coll‐Vinent 2003 reported that the physician responsible for observing time intervals and recovery time was not blinded to the agent used. Dunn 2011 employed no blinding. Godambe 2003 reported blinding of participants, parents and reviewers of the recorded procedure. Havel 1999 reported that blinding during sedation was achieved by shielding medications, infusion tubing and intravenous site from everyone but the study investigator. Miner 2010 reported that neither participants nor staff were blinded to the study drug being administered. Parlak 2006 reported that only the researcher collecting data was blinded to the study drug. Taylor 2005 reported that the doctor performing the procedure was blinded but not the sedation doctor. The quality of evidence was rated down 3 levels for imprecision because the reported CIs around the estimates of treatment effect were very wide. The quality of evidence was rated down 3 levels for inconsistency due to significant clinical heterogeneity in the studies reporting this outcome measure. The quality of evidence was rated down 1 level for indirectness because in 1 study the setting included the coronary care unit (Parlak 2006). The quality of evidence was rated down 3 levels for publication bias because the available evidence comes from small studies (6 of the 7 studies reporting this outcome measure employed fewer than 100 participants). 2The 4 included studies all employed different comparator interventions (Coll‐Vinent 2003; Miner 2007; Miner 2010; Parlak 2006). The quality of evidence was rated down three levels for risk of bias because of very serious concerns about inadequate blinding. Coll‐Vinent 2003 reported that the physician responsible for observing time intervals and recovery time was not blinded to the agent used. Miner 2010 and Miner 2007 reported that neither participants nor staff were blinded to the study drug being administered. Parlak 2006 reported that only the researcher collecting data was blinded to the study drug. The quality of evidence was rated down 3 levels for imprecision because the only reported CI around the estimates of treatment effect was very wide (Miner 2007). The quality of evidence was rated down 3 levels for inconsistency due to significant clinical heterogeneity in the studies reporting this outcome measure. The quality of evidence was rated down 1 level for indirectness because in 1 study the setting included the coronary care unit (Parlak 2006). The quality of evidence was rated down 3 levels for publication bias because the available evidence comes from small studies (3 of the 4 studies reporting this outcome measure employed fewer than 100 participants). 3The 3 included studies all employed different comparator interventions (Coll‐Vinent 2003; Havel 1999; Taylor 2005). The quality of evidence was rated down 3 levels for risk of bias because of very serious concerns about inadequate blinding. Coll‐Vinent 2003 reported that the physician responsible for observing time intervals and recovery time was not blinded to the agent used. Havel 1999 reported that blinding during sedation was achieved by shielding medications, infusion tubing and intravenous site from everyone but the study investigator. Taylor 2005 reported that the doctor performing the procedure was blinded but not the sedation doctor. The quality of evidence was rated down 3 levels for imprecision because the reported CIs around the estimates of treatment effect were very wide (Havel 1999; Taylor 2005). The quality of evidence was rated down 3 levels for inconsistency due to significant clinical heterogeneity in the studies reporting this outcome measure. The quality of evidence was not rated down for indirectness because all the studies reporting this outcome measure, which is important to participants, where applied to the emergency department participant population. The quality of evidence was rated down 3 levels for publication bias because the available evidence comes from small studies (all the studies reporting this outcome measure employed fewer than 100 participants). | ||||||
| Study | Total number of participants randomized | Intervention 1 | Intervention 2 | Intervention 3 |
| 40 | Propofol/fentanyl | Midazolam/fentanyl | None | |
| 32 | Propofol | Etomidate | Midazolam | |
| 40 | Propofol/remifentanyl | Midazolam/fentanyl | None | |
| 113 | Propofol/fentanyl | Ketamine/midazolam | None | |
| 89 | Propofol | Midazolam | None | |
| 32 | Propofol | Midazolam | None | |
| 214 | Propofol | Etomidate | None | |
| 97 | Propofol | Ketamine | None | |
| 70 | Propofol/fentanyl | Midazolam/fentanyl | None | |
| 86 | Propofol | Midazolam/fentanyl | None |
| Study | Adverse effects reported |
| Myoclonus, bronchospasm, pain at injection site, re‐sedation | |
| Oversedation | |
| Agitation, emesis, laryngospasm, apnoea, delayed adverse reactions (nightmares and behavioural change) | |
| Pain with injection, oversedation, post‐discharge complications (nausea/vomiting, persistent sedation, fever and recall) | |
| Recovery agitation | |
| Desaturation, apnoea | |
| Moaning, partial airway obstruction, pain at intravenous site, vomiting |
| Study | Method used to assess participant satisfaction |
| Ordinal scale (not satisfied, moderately satisfied, satisfied, very satisfied) | |
| 100‐mm satisfaction visual analogue scale consisting of the question, How satisfied are you with the treatment you received during this procedure? With the words 'completely satisfied' and 'not satisfied at all' on either side of the 100‐mm line | |
| Quote: "after the patients returned to their baseline mental status, they were asked if they felt any pain during the procedure or were able to recall any of the procedure (yes/no). They were also asked if they were satisfied with the treatment they received during the procedure" | |
| Quote: "patient satisfaction subsequently was evaluated with a questionnaire including Likert‐type questions" |
| Secondary outcome measure | Odds ratio (95% confidence interval) |
| Procedural recall | 0.93 (0.28 to 3.1) |
| Incidence of hypoxia | 1.11 (0.34 to 3.59) |
| Incidence of hypotension | 0.94 (0.13 to 6.94) |
| Secondary outcome measure | Summary statistic (95% confidence interval) |
| Procedural recall | SMD ‐0.24 (‐0.51 to 0.03) |
| BIS nadir | MD 1.6 (‐4.1 to 6.2) |
| Incidence of hypoxia | OR 0.96 (0.38 to 2.41) |
| Need for ventilation | OR 1.21 (0.32 to 4.65) |
| Decrease in SBP from baseline | MD ‐4.1 (‐6.4% to 1.7%) |
| MD: mean difference; OR: odds ratio; SMD: standardized mean difference. | |
| Secondary outcome measure | P value |
| Physician satisfaction score | 0.245 |
| Recall | 1.0 |
| Hypoxia | 0.002 |
| Hypotension | 1.0 |
| Secondary outcome measure | Mean difference (95% confidence interval) | P value |
| Time to first awakening | 4.6 (0.7 to 8.6) | 0.097 |
| Recall | 6.3% (‐6.1% to 18.6%) | 0.309 |
| Hypoxia | 3.1% (‐9.9% to 16%) | 0.69 |
| Hypotension | 2.6% (‐4.8% to 10.1%) | 0.442 |
| Outcome or subgroup title | No. of studies | No. of participants | Statistical method | Effect size |
| 1 Desaturation Show forest plot | 1 | Odds Ratio (M‐H, Fixed, 95% CI) | Totals not selected | |
| 1.1 Propofol vs. midazolam (aged < 65 years) | 1 | Odds Ratio (M‐H, Fixed, 95% CI) | 0.0 [0.0, 0.0] | |
| 1.2 Propofol vs. midazolam (aged ≥ 65 years) | 1 | Odds Ratio (M‐H, Fixed, 95% CI) | 0.0 [0.0, 0.0] | |
| 2 Recovery agitation Show forest plot | 1 | Odds Ratio (M‐H, Fixed, 95% CI) | Totals not selected | |
| 3 Pain with injection Show forest plot | 3 | Odds Ratio (M‐H, Fixed, 95% CI) | Totals not selected | |
| 3.1 Propofol vs. midazolam | 1 | Odds Ratio (M‐H, Fixed, 95% CI) | 0.0 [0.0, 0.0] | |
| 3.2 Propofol vs. midazolam/fentanyl | 1 | Odds Ratio (M‐H, Fixed, 95% CI) | 0.0 [0.0, 0.0] | |
| 3.3 Propofol vs. etomidate | 1 | Odds Ratio (M‐H, Fixed, 95% CI) | 0.0 [0.0, 0.0] | |
| 4 Oversedation Show forest plot | 1 | Odds Ratio (M‐H, Fixed, 95% CI) | Totals not selected | |
| 5 Agitation Show forest plot | 1 | Odds Ratio (M‐H, Fixed, 95% CI) | Totals not selected | |
| 6 Post‐discharge nausea/vomiting Show forest plot | 1 | Odds Ratio (M‐H, Fixed, 95% CI) | Totals not selected | |
| 7 Post‐discharge persistent sedation Show forest plot | 1 | Odds Ratio (M‐H, Fixed, 95% CI) | Totals not selected | |
| 8 Post‐discharge fever Show forest plot | 1 | Odds Ratio (M‐H, Fixed, 95% CI) | Totals not selected | |
| 9 Post‐discharge recall Show forest plot | 1 | Odds Ratio (M‐H, Fixed, 95% CI) | Totals not selected | |
| 10 Agitation Show forest plot | 1 | Odds Ratio (M‐H, Fixed, 95% CI) | Totals not selected | |
| 11 Laryngospasm Show forest plot | 1 | Odds Ratio (M‐H, Fixed, 95% CI) | Totals not selected | |
| 12 Moaning Show forest plot | 1 | Odds Ratio (M‐H, Fixed, 95% CI) | Totals not selected | |
| 13 Partial airway obstruction Show forest plot | 1 | Odds Ratio (M‐H, Fixed, 95% CI) | Totals not selected | |
| 14 Vomiting Show forest plot | 2 | Odds Ratio (M‐H, Fixed, 95% CI) | Totals not selected | |
| 14.1 Propofol/fentanyl vs. ketamine/midazolam | 1 | Odds Ratio (M‐H, Fixed, 95% CI) | 0.0 [0.0, 0.0] | |
| 14.2 Propofol vs. midazolam/fentanyl | 1 | Odds Ratio (M‐H, Fixed, 95% CI) | 0.0 [0.0, 0.0] | |
| 15 Apnoea Show forest plot | 1 | Odds Ratio (M‐H, Fixed, 95% CI) | Totals not selected | |
| 15.1 Propofol vs. midazolam (aged < 65 years) | 1 | Odds Ratio (M‐H, Fixed, 95% CI) | 0.0 [0.0, 0.0] | |
| 15.2 Propofol vs. midazolam (aged ≥ 65 years) | 1 | Odds Ratio (M‐H, Fixed, 95% CI) | 0.0 [0.0, 0.0] | |
| Outcome or subgroup title | No. of studies | No. of participants | Statistical method | Effect size |
| 1 Participant satisfaction using a visual analogue scale Show forest plot | Other data | No numeric data | ||
| 1.1 Propofol vs. etomidate | Other data | No numeric data | ||
| 2 Participant satisfaction by asking if satisfied with treatment received Show forest plot | Other data | No numeric data | ||
| 2.1 Propofol vs. ketamine | Other data | No numeric data | ||
| 3 Participant satisfaction by using a Likert‐type questionnaire Show forest plot | Other data | No numeric data | ||
| 3.1 Propofol vs. midazolam (aged < 65 years) | Other data | No numeric data | ||
| 3.2 Propofol vs. midazolam (aged ≥ 65 years) | Other data | No numeric data | ||
| 4 Participant satisfaction using an ordinal scale Show forest plot | Other data | No numeric data | ||
| 4.1 Propofol vs. etomidate vs. midazolam (with or without flumazenil) | Other data | No numeric data | ||