The use of propofol for procedural sedation in emergency departments
Information
- DOI:
- https://doi.org/10.1002/14651858.CD007399.pub2Copy DOI

- Database:
-
- Cochrane Database of Systematic Reviews
- Version published:
-
- 29 July 2015see what's new
- Type:
-
- Intervention
- Stage:
-
- Review
- Cochrane Editorial Group:
-
Cochrane Emergency and Critical Care Group
- Copyright:
-
- Copyright © 2018 The Cochrane Collaboration. Published by John Wiley & Sons, Ltd.
Article metrics
Altmetric:
Cited by:
Authors
Contributions of authors
Abel Wakai (AW), Carol Blackburn (CB), Aileen McCabe (AM), Emilia Reece (ER), Ger O'Connor (GOC), John Glasheen (JG), Paul Staunton (PS), John Cronin (JC), Christopher Sampson (CS), Siobhan C McCoy (SM), Ronan O'Sullivan (ROS), Fergal Cummins (FC)
Conceiving the review: AW.
Co‐ordinating the review: ROS.
Undertaking manual searches: AW and ROS.
Screening search results: JG, GOC and SM.
Organizing retrieval of papers: AW.
Screening retrieved papers against inclusion criteria: JG, GOC and SM.
Appraising quality of papers: AM, ER and CS.
Abstracting data from papers: AM and ER.
Writing to authors of papers for additional information: AW.
Providing additional data about papers: AW and ROS.
Obtaining and screening data on unpublished studies: AW and ROS.
Data management for the review: AW.
Entering data into Review Manager (RevMan 2014): PS and JC.
Review Manager (RevMan 2014) statistical data: AW, ROS and FC.
Double entry of data: (data entered by person one: PS; data entered by person two: JC).
Interpretation of data: AW, ROS and FC.
Statistical inferences: AW, ROS and CB.
Writing the review: AW, ROS and CB.
Performing previous work that was the foundation of the present study: AW, ROS and FC.
Guarantor for the review (one author): AW.
Responsible for reading and checking review before submission: AW, CB and ROS.
Declarations of interest
Abel Wakai: no known conflict of interest.
Carol Blackburn: no known conflict of interest.
Aileen McCabe: no known conflict of interest.
Emilia Reece: no known conflict of interest.
Ger O'Connor: no known conflict of interest.
John Glasheen: no known conflict of interest.
Paul Staunton: no known conflict of interest.
John Cronin: no known conflict of interest.
Christopher Sampson: no known conflict of interest.
Siobhan C McCoy: no known conflict of interest.
Ronan O'Sullivan: no known conflict of interest.
Fergal Cummins: no known conflict of interest.
Acknowledgements
We would like to thank Harald Herkner (content and statistical editor), and Michael Turturro and Vesa Kontinen (peer reviewers) for their help and editorial advice during the preparation of this systematic review.
Version history
| Published | Title | Stage | Authors | Version |
| 2015 Jul 29 | The use of propofol for procedural sedation in emergency departments | Review | Abel Wakai, Carol Blackburn, Aileen McCabe, Emilia Reece, Ger O'Connor, John Glasheen, Paul Staunton, John Cronin, Christopher Sampson, Siobhan C McCoy, Ronan O'Sullivan, Fergal Cummins | |
| 2008 Oct 08 | The use of propofol for procedural sedation in emergency departments | Protocol | Abel Wakai, Paul Staunton, Fergal Cummins, Ronan O'Sullivan | |
Differences between protocol and review
We made the following changes to the published protocol (Wakai 2008).
-
Byline: Carol Blackburn, Aileen McCabe, Emilia Reece, Ger O'Connor, John Glasheen, John Cronin, Christopher Sampson and Siobhan C McCoy joined the review team.
-
Under the section 'Types of interventions', we used the term 'opioid' in the review to replace the term 'narcotic' used in the protocol; similarly, we used the term 'non‐opioid' in the review to replace the term 'non‐narcotic' used in the protocol.
-
We have added the following two additional secondary outcomes, not present in the protocol, to the review: minor complications (as defined by the study authors) and major complications (as defined by the study authors).
-
Searching other resources: we did not contact pharmaceutical companies.
-
We added 'pain with injection' as an outcome measure in the 'Summary of findings' table.
Notes
As part of the pre‐publication editorial process, a content editor and five peer reviewers (who were external to the editorial team), one or more members of the Cochrane Consumer Network's international panel of consumers and the Anaesthesia Group's Trials Search Co‐ordinator commented on the protocol.
We would like to thank Harald Herkner, Simon Brown, Wilhelm Ruppen, Michael Beach, Simon Carley, Michael Ragg, Kathie Godfrey, Amy Woodruffe and Nete Villebro for their help and editorial advice during the preparation of the protocol (Wakai 2008).
We would also like to thank Dr. Ciarán Browne for his help in screening the search results.
Keywords
MeSH
Medical Subject Headings (MeSH) Keywords
- *Anesthesia;
- *Anesthetics, Intravenous [administration & dosage, adverse effects];
- *Emergency Service, Hospital;
- *Propofol [administration & dosage, adverse effects];
- Etomidate [administration & dosage];
- Fentanyl [administration & dosage];
- Ketamine [administration & dosage, adverse effects];
- Midazolam [administration & dosage];
- Randomized Controlled Trials as Topic;
Medical Subject Headings Check Words
Adolescent; Adult; Humans; Middle Aged;
PICOs
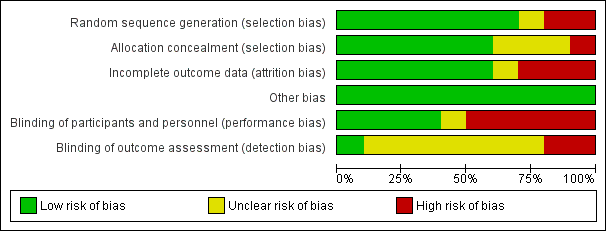
Risk of bias graph: review authors' judgements about each risk of bias item presented as percentages across all included studies.

Risk of bias summary: review authors' judgements about each risk of bias item for each included study.

Comparison 1 Adverse effects, Outcome 1 Desaturation.

Comparison 1 Adverse effects, Outcome 2 Recovery agitation.

Comparison 1 Adverse effects, Outcome 3 Pain with injection.

Comparison 1 Adverse effects, Outcome 4 Oversedation.

Comparison 1 Adverse effects, Outcome 5 Agitation.

Comparison 1 Adverse effects, Outcome 6 Post‐discharge nausea/vomiting.

Comparison 1 Adverse effects, Outcome 7 Post‐discharge persistent sedation.

Comparison 1 Adverse effects, Outcome 8 Post‐discharge fever.

Comparison 1 Adverse effects, Outcome 9 Post‐discharge recall.

Comparison 1 Adverse effects, Outcome 10 Agitation.

Comparison 1 Adverse effects, Outcome 11 Laryngospasm.

Comparison 1 Adverse effects, Outcome 12 Moaning.

Comparison 1 Adverse effects, Outcome 13 Partial airway obstruction.

Comparison 1 Adverse effects, Outcome 14 Vomiting.

Comparison 1 Adverse effects, Outcome 15 Apnoea.
| Study | Propofol (n=109) | Etomidate (n=105) |
| Propofol vs. etomidate | ||
| Miner 2007 | 10.3 mm (95% CI 7.0 to 13.6) | 9.8 mm (95% CI 6.1 to 13.6) |
Comparison 2 Participant satisfaction, Outcome 1 Participant satisfaction using a visual analogue scale.
| Study | Propofol (n=50) | Ketamine (n=47) |
| Propofol vs. ketamine | ||
| Miner 2010 | 100% of patients reporting satisfaction with the procedure | 100% of patients reporting satisfaction with the procedure |
Comparison 2 Participant satisfaction, Outcome 2 Participant satisfaction by asking if satisfied with treatment received.
| Study | Propofol (n=11) | Midazolam (n=12) |
| Propofol vs. midazolam (aged < 65 years) | ||
| Parlak 2006 | All 11 patients satisfied with procedure | All 12 patients satisfied with procedure |
| Propofol vs. midazolam (aged ≥ 65 years) | ||
| Parlak 2006 | 20 patients satisfied with procedure; 2 not sure | 20 patients satisfied with procedure; 2 not sure |
Comparison 2 Participant satisfaction, Outcome 3 Participant satisfaction by using a Likert‐type questionnaire.
| Study | Propofol (n=9) | Etomidate (n=9) | Midazolam (n=8) | Midazolam with flumazenil (n=6) |
| Propofol vs. etomidate vs. midazolam (with or without flumazenil) | ||||
| Coll‐Vinent 2003 | 7 patients were "very satisfied"; 2 patients were "satisfied" | 7 patients were "very satisfied"; 2 patients were "satisfied" | 4 patients were "very satisfied"; 4 patients were "satisfied" | 2 patients were "very satisfied"; 4 patients were "satisfied" |
Comparison 2 Participant satisfaction, Outcome 4 Participant satisfaction using an ordinal scale.
| Intravenous propofol compared with alternative intravenous sedative or hypnotic for emergency department procedural sedation | ||||||
| Patient or population: emergency department procedural sedation | ||||||
| Outcomes | Illustrative comparative risks* (95% CI) | Relative effect | No of participants | Quality of the evidence | Comments | |
| Assumed risk | Corresponding risk | |||||
| Alternative intravenous sedative or hypnotic | Intravenous propofol | |||||
| Adverse effects (as defined by study authors) | Study population | Not estimable | 527 | ⊕⊝⊝⊝ | Clinical heterogeneity prevented a summary statistic | |
| 0 per 1000 | 0 per 1000 | |||||
| Participant satisfaction (as defined by study authors) | Study population | Not estimable | 413 | ⊕⊝⊝⊝ | Clinical heterogeneity prevented a summary statistic | |
| 0 per 1000 | 0 per 1000 | |||||
| Pain with injection | Study population | Not estimable | 193 | ⊕⊝⊝⊝ | Clinical heterogeneity prevented a summary statistic | |
| 0 per 1000 | 0 per 1000 | |||||
| *The basis for the assumed risk (e.g. the median control group risk across studies) is provided in footnotes. The corresponding risk (and its 95% confidence interval) is based on the assumed risk in the comparison group and the relative effect of the intervention (and its 95% CI). | ||||||
| GRADE Working Group grades of evidence | ||||||
| 1The 7 included studies all employed different comparator interventions (Coll‐Vinent 2003; Dunn 2011; Godambe 2003; Havel 1999; Miner 2010; Parlak 2006; Taylor 2005). The quality of evidence was rated down 3 levels for risk of bias because of very serious concerns about inadequate blinding. Coll‐Vinent 2003 reported that the physician responsible for observing time intervals and recovery time was not blinded to the agent used. Dunn 2011 employed no blinding. Godambe 2003 reported blinding of participants, parents and reviewers of the recorded procedure. Havel 1999 reported that blinding during sedation was achieved by shielding medications, infusion tubing and intravenous site from everyone but the study investigator. Miner 2010 reported that neither participants nor staff were blinded to the study drug being administered. Parlak 2006 reported that only the researcher collecting data was blinded to the study drug. Taylor 2005 reported that the doctor performing the procedure was blinded but not the sedation doctor. The quality of evidence was rated down 3 levels for imprecision because the reported CIs around the estimates of treatment effect were very wide. The quality of evidence was rated down 3 levels for inconsistency due to significant clinical heterogeneity in the studies reporting this outcome measure. The quality of evidence was rated down 1 level for indirectness because in 1 study the setting included the coronary care unit (Parlak 2006). The quality of evidence was rated down 3 levels for publication bias because the available evidence comes from small studies (6 of the 7 studies reporting this outcome measure employed fewer than 100 participants). 2The 4 included studies all employed different comparator interventions (Coll‐Vinent 2003; Miner 2007; Miner 2010; Parlak 2006). The quality of evidence was rated down three levels for risk of bias because of very serious concerns about inadequate blinding. Coll‐Vinent 2003 reported that the physician responsible for observing time intervals and recovery time was not blinded to the agent used. Miner 2010 and Miner 2007 reported that neither participants nor staff were blinded to the study drug being administered. Parlak 2006 reported that only the researcher collecting data was blinded to the study drug. The quality of evidence was rated down 3 levels for imprecision because the only reported CI around the estimates of treatment effect was very wide (Miner 2007). The quality of evidence was rated down 3 levels for inconsistency due to significant clinical heterogeneity in the studies reporting this outcome measure. The quality of evidence was rated down 1 level for indirectness because in 1 study the setting included the coronary care unit (Parlak 2006). The quality of evidence was rated down 3 levels for publication bias because the available evidence comes from small studies (3 of the 4 studies reporting this outcome measure employed fewer than 100 participants). 3The 3 included studies all employed different comparator interventions (Coll‐Vinent 2003; Havel 1999; Taylor 2005). The quality of evidence was rated down 3 levels for risk of bias because of very serious concerns about inadequate blinding. Coll‐Vinent 2003 reported that the physician responsible for observing time intervals and recovery time was not blinded to the agent used. Havel 1999 reported that blinding during sedation was achieved by shielding medications, infusion tubing and intravenous site from everyone but the study investigator. Taylor 2005 reported that the doctor performing the procedure was blinded but not the sedation doctor. The quality of evidence was rated down 3 levels for imprecision because the reported CIs around the estimates of treatment effect were very wide (Havel 1999; Taylor 2005). The quality of evidence was rated down 3 levels for inconsistency due to significant clinical heterogeneity in the studies reporting this outcome measure. The quality of evidence was not rated down for indirectness because all the studies reporting this outcome measure, which is important to participants, where applied to the emergency department participant population. The quality of evidence was rated down 3 levels for publication bias because the available evidence comes from small studies (all the studies reporting this outcome measure employed fewer than 100 participants). | ||||||
| Study | Total number of participants randomized | Intervention 1 | Intervention 2 | Intervention 3 |
| 40 | Propofol/fentanyl | Midazolam/fentanyl | None | |
| 32 | Propofol | Etomidate | Midazolam | |
| 40 | Propofol/remifentanyl | Midazolam/fentanyl | None | |
| 113 | Propofol/fentanyl | Ketamine/midazolam | None | |
| 89 | Propofol | Midazolam | None | |
| 32 | Propofol | Midazolam | None | |
| 214 | Propofol | Etomidate | None | |
| 97 | Propofol | Ketamine | None | |
| 70 | Propofol/fentanyl | Midazolam/fentanyl | None | |
| 86 | Propofol | Midazolam/fentanyl | None |
| Study | Adverse effects reported |
| Myoclonus, bronchospasm, pain at injection site, re‐sedation | |
| Oversedation | |
| Agitation, emesis, laryngospasm, apnoea, delayed adverse reactions (nightmares and behavioural change) | |
| Pain with injection, oversedation, post‐discharge complications (nausea/vomiting, persistent sedation, fever and recall) | |
| Recovery agitation | |
| Desaturation, apnoea | |
| Moaning, partial airway obstruction, pain at intravenous site, vomiting |
| Study | Method used to assess participant satisfaction |
| Ordinal scale (not satisfied, moderately satisfied, satisfied, very satisfied) | |
| 100‐mm satisfaction visual analogue scale consisting of the question, How satisfied are you with the treatment you received during this procedure? With the words 'completely satisfied' and 'not satisfied at all' on either side of the 100‐mm line | |
| Quote: "after the patients returned to their baseline mental status, they were asked if they felt any pain during the procedure or were able to recall any of the procedure (yes/no). They were also asked if they were satisfied with the treatment they received during the procedure" | |
| Quote: "patient satisfaction subsequently was evaluated with a questionnaire including Likert‐type questions" |
| Secondary outcome measure | Odds ratio (95% confidence interval) |
| Procedural recall | 0.93 (0.28 to 3.1) |
| Incidence of hypoxia | 1.11 (0.34 to 3.59) |
| Incidence of hypotension | 0.94 (0.13 to 6.94) |
| Secondary outcome measure | Summary statistic (95% confidence interval) |
| Procedural recall | SMD ‐0.24 (‐0.51 to 0.03) |
| BIS nadir | MD 1.6 (‐4.1 to 6.2) |
| Incidence of hypoxia | OR 0.96 (0.38 to 2.41) |
| Need for ventilation | OR 1.21 (0.32 to 4.65) |
| Decrease in SBP from baseline | MD ‐4.1 (‐6.4% to 1.7%) |
| MD: mean difference; OR: odds ratio; SMD: standardized mean difference. | |
| Secondary outcome measure | P value |
| Physician satisfaction score | 0.245 |
| Recall | 1.0 |
| Hypoxia | 0.002 |
| Hypotension | 1.0 |
| Secondary outcome measure | Mean difference (95% confidence interval) | P value |
| Time to first awakening | 4.6 (0.7 to 8.6) | 0.097 |
| Recall | 6.3% (‐6.1% to 18.6%) | 0.309 |
| Hypoxia | 3.1% (‐9.9% to 16%) | 0.69 |
| Hypotension | 2.6% (‐4.8% to 10.1%) | 0.442 |
| Outcome or subgroup title | No. of studies | No. of participants | Statistical method | Effect size |
| 1 Desaturation Show forest plot | 1 | Odds Ratio (M‐H, Fixed, 95% CI) | Totals not selected | |
| 1.1 Propofol vs. midazolam (aged < 65 years) | 1 | Odds Ratio (M‐H, Fixed, 95% CI) | 0.0 [0.0, 0.0] | |
| 1.2 Propofol vs. midazolam (aged ≥ 65 years) | 1 | Odds Ratio (M‐H, Fixed, 95% CI) | 0.0 [0.0, 0.0] | |
| 2 Recovery agitation Show forest plot | 1 | Odds Ratio (M‐H, Fixed, 95% CI) | Totals not selected | |
| 3 Pain with injection Show forest plot | 3 | Odds Ratio (M‐H, Fixed, 95% CI) | Totals not selected | |
| 3.1 Propofol vs. midazolam | 1 | Odds Ratio (M‐H, Fixed, 95% CI) | 0.0 [0.0, 0.0] | |
| 3.2 Propofol vs. midazolam/fentanyl | 1 | Odds Ratio (M‐H, Fixed, 95% CI) | 0.0 [0.0, 0.0] | |
| 3.3 Propofol vs. etomidate | 1 | Odds Ratio (M‐H, Fixed, 95% CI) | 0.0 [0.0, 0.0] | |
| 4 Oversedation Show forest plot | 1 | Odds Ratio (M‐H, Fixed, 95% CI) | Totals not selected | |
| 5 Agitation Show forest plot | 1 | Odds Ratio (M‐H, Fixed, 95% CI) | Totals not selected | |
| 6 Post‐discharge nausea/vomiting Show forest plot | 1 | Odds Ratio (M‐H, Fixed, 95% CI) | Totals not selected | |
| 7 Post‐discharge persistent sedation Show forest plot | 1 | Odds Ratio (M‐H, Fixed, 95% CI) | Totals not selected | |
| 8 Post‐discharge fever Show forest plot | 1 | Odds Ratio (M‐H, Fixed, 95% CI) | Totals not selected | |
| 9 Post‐discharge recall Show forest plot | 1 | Odds Ratio (M‐H, Fixed, 95% CI) | Totals not selected | |
| 10 Agitation Show forest plot | 1 | Odds Ratio (M‐H, Fixed, 95% CI) | Totals not selected | |
| 11 Laryngospasm Show forest plot | 1 | Odds Ratio (M‐H, Fixed, 95% CI) | Totals not selected | |
| 12 Moaning Show forest plot | 1 | Odds Ratio (M‐H, Fixed, 95% CI) | Totals not selected | |
| 13 Partial airway obstruction Show forest plot | 1 | Odds Ratio (M‐H, Fixed, 95% CI) | Totals not selected | |
| 14 Vomiting Show forest plot | 2 | Odds Ratio (M‐H, Fixed, 95% CI) | Totals not selected | |
| 14.1 Propofol/fentanyl vs. ketamine/midazolam | 1 | Odds Ratio (M‐H, Fixed, 95% CI) | 0.0 [0.0, 0.0] | |
| 14.2 Propofol vs. midazolam/fentanyl | 1 | Odds Ratio (M‐H, Fixed, 95% CI) | 0.0 [0.0, 0.0] | |
| 15 Apnoea Show forest plot | 1 | Odds Ratio (M‐H, Fixed, 95% CI) | Totals not selected | |
| 15.1 Propofol vs. midazolam (aged < 65 years) | 1 | Odds Ratio (M‐H, Fixed, 95% CI) | 0.0 [0.0, 0.0] | |
| 15.2 Propofol vs. midazolam (aged ≥ 65 years) | 1 | Odds Ratio (M‐H, Fixed, 95% CI) | 0.0 [0.0, 0.0] | |
| Outcome or subgroup title | No. of studies | No. of participants | Statistical method | Effect size |
| 1 Participant satisfaction using a visual analogue scale Show forest plot | Other data | No numeric data | ||
| 1.1 Propofol vs. etomidate | Other data | No numeric data | ||
| 2 Participant satisfaction by asking if satisfied with treatment received Show forest plot | Other data | No numeric data | ||
| 2.1 Propofol vs. ketamine | Other data | No numeric data | ||
| 3 Participant satisfaction by using a Likert‐type questionnaire Show forest plot | Other data | No numeric data | ||
| 3.1 Propofol vs. midazolam (aged < 65 years) | Other data | No numeric data | ||
| 3.2 Propofol vs. midazolam (aged ≥ 65 years) | Other data | No numeric data | ||
| 4 Participant satisfaction using an ordinal scale Show forest plot | Other data | No numeric data | ||
| 4.1 Propofol vs. etomidate vs. midazolam (with or without flumazenil) | Other data | No numeric data | ||