Detección de galactomananos para la aspergilosis invasiva en pacientes inmunocomprometidos
Información
- DOI:
- https://doi.org/10.1002/14651858.CD007394.pub2Copiar DOI

- Base de datos:
-
- Cochrane Database of Systematic Reviews
- Versión publicada:
-
- 30 diciembre 2015see what's new
- Tipo:
-
- Diagnostic
- Etapa:
-
- Review
- Grupo Editorial Cochrane:
-
Grupo Cochrane de Vías respiratorias
- Copyright:
-
- Copyright © 2017 The Cochrane Collaboration. Published by John Wiley & Sons, Ltd.
Cifras del artículo
Altmetric:
Citado por:
Autores
Contributions of authors
ML: drafted protocol; searches; study selection and data extraction; analyses; drafted review.
YD: study selection and data extraction; commented on protocol and review.
JW: study selection and data extraction in second round of update (2014); translation of Chinese articles.
CV: study selection and data extraction; commented on protocol and review.
HB: data extraction; commented on protocol and review.
LH: data extraction; commented on protocol and review.
RS: data extraction; commented on protocol and review.
JBR: data analysis; commented on review.
MZ: data extraction and translation of Chinese articles in first‐round (2011) update.
PMB: commented on protocol and review.
CVG: initiator; commented on protocol and review.
Sources of support
Internal sources
-
None, Other.
The authors declare that no funding was received for this systematic review.
External sources
-
None, Other.
The authors declare that no funding was received for this systematic review.
Declarations of interest
Authors ML, YD, JW, CV, HB, LH, RS, JBR, MZ, PMB, CVG state no conflicts of interest.
Acknowledgements
The Cochrane Diagnostic Test Accuracy Editorial Team helped to edit this review and commented critically on the review.
This project was supported by the National Institute for Health Research, via Cochrane Infrastructure funding to the Cochrane Airways Group. The views and opinions expressed therein are those of the authors and do not necessarily reflect those of the Systematic Reviews Programme, NIHR, NHS or the Department of Health.
Version history
| Published | Title | Stage | Authors | Version |
| 2015 Dec 30 | Galactomannan detection for invasive aspergillosis in immunocompromised patients | Review | Mariska MG Leeflang, Yvette J Debets‐Ossenkopp, Junfeng Wang, Caroline E Visser, Rob JPM Scholten, Lotty Hooft, Henk A Bijlmer, Johannes B Reitsma, Mingming Zhang, Patrick MM Bossuyt, Christina M Vandenbroucke‐Grauls | |
| 2008 Oct 07 | Galactomannan detection for invasive aspergillosis in immunocompromized patients | Review | Mariska M. Leeflang, Yvette J Debets‐Ossenkopp, Caroline E Visser, Rob JPM Scholten, Lotty Hooft, Henk A Bijlmer, Johannes B Reitsma, Patrick MM Bossuyt, Christina M Vandenbroucke‐Grauls | |
Differences between protocol and review
We stated that we would contact authors and industry and this has not been done. This is now stated in the 'Methods' section.
We limited the accepted reference standard to EORTC(‐like) criteria. We originally stated that it would be either autopsy, combined with a positive culture or with histopathological evidence, or the EORTC/MSG criteria, or the demonstration of hyphal invasion in biopsies, combined with a positive culture. The rationale for this is that autopsy is almost never done and that biopsy and culture are included in the EORTC/MSG criteria.
QUADAS‐2 did not exist when the protocol was written; we updated the review to incorporate QUADAS‐2.
We did not calculate likelihood ratios and odds ratios, as described in the protocol. The reason for this is that we think that the value of this test is better described by explaining the consequences of false positive (1‐specificity) and false negative (1‐sensitivity) results.
We added some extra explanation about the independence of index and reference tests to the 'Methods' section (under 'Assessment of methodological quality').
In the protocol we stated that we would investigate the effect of: cut‐off values, reference standard, distinctive groups of patients, children versus adults and the use of antifungal therapy. In the review we did investigate the effects of: cut‐off values, reference standard and clinical subgroups (children versus adults; distinctive groups of patients (high‐risk versus low‐risk); use of antifungal prophylaxis; use of antifungal therapy).
In the protocol we stated that the main purpose for a test for invasive aspergillosis would be to guide therapy. During the review process, we discovered that the test is used in many different ways and in most studies it is not used to guide therapy (although a test that could guide therapy would still be ideal). We have therefore changed the text in such a way that there is less focus on guidance of therapy.
In the protocol we did not mention that we would divide the four reference categories into diseased versus non‐diseased, because at the time the protocol was written we were not aware that this could be an issue.
Notes
No published notes.
Keywords
MeSH
Medical Subject Headings (MeSH) Keywords
Medical Subject Headings Check Words
Humans;

Study flow diagram.

Methodological quality graph: Review authors' judgements about each methodological quality item presented as percentages across all included studies.

Methodological quality summary: Review authors' judgements about each methodological quality item for each included study.
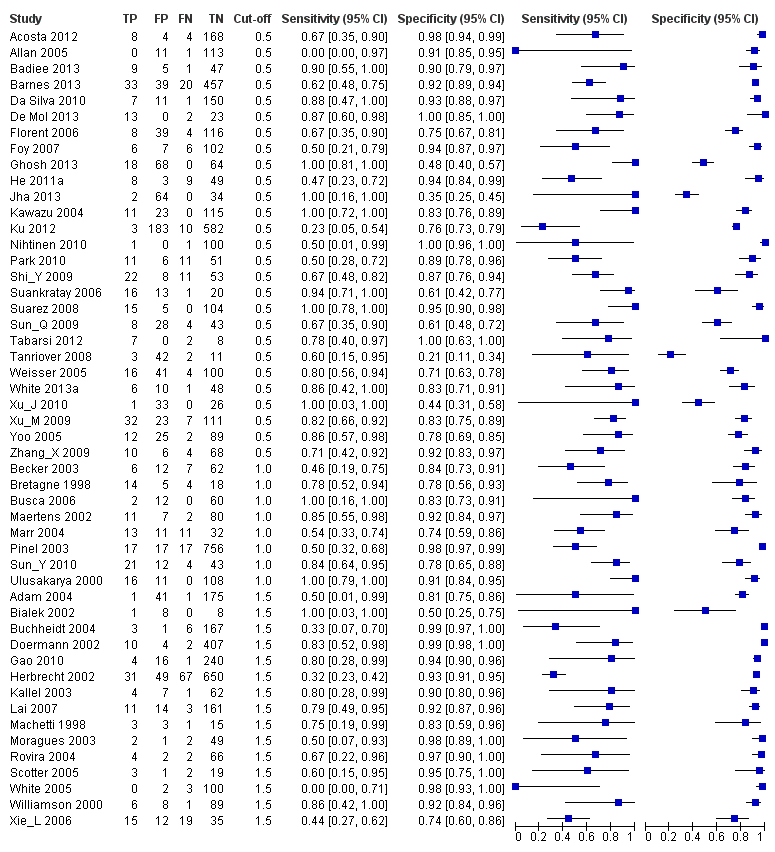
Forest plots of sensitivity and specificity. The squares represent the sensitivity and specificity of one study, the black line its confidence interval. Studies are grouped by reported cut‐off value. If a study reported accuracy data for more than one cut‐off, its results are included in more than one subgroup. TP = True Positive; FP = False Positive; FN = False Negative; TN = True Negative.
Forest plot of the included studies. TP = True Positive; FP = False Positive; FN = False Negative; TN = True Negative. Between brackets the 95% confidence intervals (CI) of sensitivity and specificity. The figure shows the estimated sensitivity and specificity of the study (blue square) and its 95% confidence interval (black horizontal line).

Plot of sensitivity versus specificity for all 54 studies, with different symbols for the different cut‐off values. The width of the symbols is proportional to the inverse standard error of the specificity in every study and the height of the symbols is proportional to the inverse standard error of the sensitivity.

Summary ROC plots for galactomannan test at three different cut‐off values. The graph shows the point estimates of sensitivity and specificity (solid dots) and the 95% confidence regions (dotted lines) around it. Data for individual studies are not shown in this plot.

Sensitivity analyses

Platelia ‐ all cut‐offs.

Platelia in children.
| What is the diagnostic accuracy of the galactomannan ELISA for invasive aspergillosis for different cut‐off values? Patients/population: immunocompromised patients, mostly haematology patients Prior testing: varied, mostly underlying disease or symptoms (fever, neutropenia) Setting: mainly haematology or cancer departments, mainly inpatients Index test: a sandwich ELISA for galactomannan, an Aspergillus antigen Importance: depends on the time‐gain the test may give Reference standard: gold standard is autopsy, but that is almost never done; in most studies therefore the reference standard is composed of clinical and microbiological criteria Studies: patient series or case‐control studies, not using an in‐house test and not excluding possibly infected patients. Studies had to report cut‐off values that were used (n = 29). Each study can be present in more than one subgroup | |||||
| Subgroup | Effect (95% CI) | No. of participants (studies) | Prevalence (median, range) | Comments | What do these results mean? |
| Cut‐off 0.5 | Sensitivity 0.78 (0.70 to 0.85) Specificity 0.85 (0.78 to 0.91) | 394 proven or probable 3549 possible or no IA (27) | Median 11% (IQR 6.5% to 16%) | — | With a prevalence of 11%*, 11 out of 100 patients will develop IA Of these, 2 will be missed by the Platelia test (22% of 11), but will be tested again Of the 89 patients without IA, 13 will be unnecessarily referred for CT scanning |
| Cut‐off 1.0 | Sensitivity 0.71 (0.63 to 0.78) Specificity 0.90 (0.86 to 0.93) | 145 proven or probable 1246 possible or no IA (8) | Median 13% (IQR 4.2% to 31%) | — | With a prevalence of 11%*, 11 out of 100 patients will develop IA Of these, 3 will be missed by the Platelia test (29% of 11), but will be tested again Of the 89 patients without IA, 9 will be unnecessarily referred for CT scanning |
| Cut‐off 1.5 | Sensitivity 0.63 (0.49 to 0.77) Specificity 0.93 (0.89 to 0.97) | 209 proven or probable 2412 possible or no IA (15) | Median 7.4% (IQR 4.3% to 16%) | — | With a prevalence of 11%*, 11 out of 100 patients will develop IA Of these, 4 will be missed by the Platelia test (36% of 11), but will be tested again Of the 89 patients without IA, only 6 will be unnecessarily referred for CT scanning |
| Children | Sensitivity 0.84 (0.66 to 0.93) Specificity 0.88 (0.60 to 0.97) | 47 proven or probable 308 possible or no IA (in 6 studies) | Median 16% (IQR 10% to 16%) | 5 studies had a cut‐off of 0.5 and one had a cut‐off of 1.5 | Of the 100 children, 16 had IA |
| * Median prevalence over all studies was 11% (range 0.8% to 56%). CI: confidence interval; CT: computerised tomography; ELISA: enzyme‐linked immunosorbent assay; IA: invasive aspergillosis; IQR: interquartile range | |||||
| Proven IA | Histopathologic or cytopathologic examination showing hyphae from needle aspiration or biopsy specimen with evidence of associated tissue damage; or positive culture result for a sample obtained by sterile procedure from a normally sterile and clinically or radiologically abnormal site consistent with infection |
| Probable IA | At least 1 host factor criterion; and 1 microbiological criterion; and 1 major (or 2 minor) clinical criteria from abnormal site consistent with infection |
| Possible IA | At least 1 host factor criterion; and 1 microbiological or 1 major (or 2 minor) clinical criteria from abnormal site consistent with infection. This category is not recommended for use in clinical trials of antifungal agents |
| Host factor criteria are, for example, neutropenia, persistent fever, predisposing conditions, prolonged use of corticosteroids. Microbiological criteria are positive culture from sputum, bronchoalveolar lavage fluid (BAL) samples or from sinus aspirate specimen; positive result for Aspergillus antigen in specimens of BAL, cerebrospinal fluid or two or more blood samples. Major clinical criteria are, for example, new infiltrates on CT imaging (e.g. halo sign), suggestive radiological findings. Minor clinical criteria are suggestive symptoms and signs. The exact definitions of the EORTC/MSG criteria and their host factor, microbiological or clinical criteria can be found here (Ascioglu 2002). CT: computerised tomography; EORTC: European Organization for Research and Treatment of Cancer; MSG: Mycoses Study Group | |
| Cut‐off | Analysis | Studies (n) | Sensitivity (95% CI) | Specificity (95% CI) |
| 0.5 | 27 | 0.78 (0.70 to 0.85) | 0.85 (0.78 to 0.91) | |
| Single sample | 13 | 0.79 (0.69 to 0.88) | 0.80 (0.71 to 0.90) | |
| Subsequent samples | 14 | 0.77 (0.67 to 0.87) | 0.88 (0.81 to 0.94) | |
| 1.0 | 8 | 0.71 (0.63 to 0.78) | 0.90 (0.86 to 0.93) | |
| Single sample | 4 | 0.72 (0.62 to 0.82) | 0.87 (0.81 to 0.93) | |
| Subsequent samples | 4 | 0.70 (0.59 to 0.80) | 0.92 (0.88 to 0.96) | |
| 1.5 | 15 | 0.63 (0.49 to 0.77) | 0.93 (0.89 to 0.97) | |
| Single sample | 8 | 0.64 (0.48 to 0.80) | 0.92 (0.86 to 0.97) | |
| Subsequent samples | 7 | 0.61 (0.45 to 0.78) | 0.95 (0.91 to 0.98) | |
| CI: confidence interval | ||||
| Cut‐off value and analysis | Proven and probable versus possible and no IA | Proven versus probable, possible and no IA | Proven, probable and possible versus no IA | ||||||
| n | Sensitivity (95% CI) | Specificity (95% CI) | n | Sensitivity (95% CI) | Specificity (95% CI) | n | Sensitivity (95% CI) | Specificity (95% CI) | |
| 0.5 ODI | 27 | 0.78 (0.70 to 0.85) | 0.85 (0.78 to 0.91) | 18 | 0.89 (0.79 to 0.99) | 0.72 (0.62 to 0.82) | 19 | 0.55 (0.41 to 0.69) | 0.87 (0.80 to 0.94) |
| 1.0 ODI | 8 | 0.71 (0.63 to 0.78) | 0.90 (0.86 to 0.93) | 8 | 0.79 (0.70 to 0.89) | 0.83 (0.78 to 0.88) | 8 | 0.54 (0.44 to 0.65) | 0.93 (0.90 to 0.96) |
| 1.5 ODI | 15 | 0.63 (0.49 to 0.77) | 0.93 (0.89 to 0.97) | 14 | 0.65 (0.48 to 0.83) | 0.91 (0.86 to 0.96) | 14 | 0.54 (0.36 to 0.71) | 0.97 (0.94 to 0.99) |
| CI: confidence interval; IA: invasive aspergillosis; ODI: optical density index | |||||||||
| Test | No. of studies | No. of participants |
| 1 Platelia ‐ all cut‐offs Show forest plot | 50 | 7955 |
| 2 Platelia in children Show forest plot | 7 | 472 |