Detección de galactomananos para la aspergilosis invasiva en pacientes inmunocomprometidos
Appendices
Appendix 1. Electronic searches
| A. MEDLINE (through PubMed) 1. "Aspergillus"[MeSH] 2. "Aspergillosis"[MeSH] 3. "Pulmonary Aspergillosis"[MeSH] 4. aspergill*[tiab] 5. fungal infection[tw] 6. (invasive[tiab] AND fungal[tiab]) 7. #1 OR #2 OR #3 OR #4 OR #5 OR 6 43462 hits 8. "Serology"[MeSH] 9. Serology"[MeSH] 10. (serology[tiab] OR serodiagnosis[tiab] OR serologic[tiab]) 11. #8 OR #9 OR #10 190568 hits 12. "Immunoassay"[MeSH] 13. (immunoassay[tiab] OR immunoassays[tiab]) 14. (immuno assay[tiab] OR immuno assays[tiab]) 15. (ELISA[tiab] OR ELISAs[tiab] OR EIA[tiab] OR EIAs[tiab]) 16. immunosorbent[tiab] 17. #12 OR #13 OR #14 OR #15 OR #16 452423 hits 18. Platelia[tw] 19. "Mannans"[MeSH] 20. galactomannan[tw] 21. #18 OR #19 OR #20 3860 hits 22. #11 OR #17 OR #21 609778 hits 23. #7 AND #22 2621 hits |
| B. EMBASE (through OVID) 1. exp aspergillosis/ 2. aspergill*.ti,ab. 3. exp Aspergillus/ 4. (fungal adj2 infection).mp. 5. (fungal adj2 invasive).mp. 6. 1 or 2 or 3 or 4 or 5 52624 hits 7. exp serology/ 8. exp serodiagnosis/ 9. (serology or serodiagnosis).ti,ab. 10. exp immunoassay/ 11. immunoassay*.mp. 12. immuno assay*.mp. 13. immunosorbent.mp. 14. ELISA.ti,ab. 15. (EIA or EIAs).ti,ab. 16. Platelia.mp. 17. galactomannan.ti,ab. 18. exp mannan/ 19. or/ 7‐18 480456 hits 20. 6 and 19 2773 hits |
| C. ISI Web of Knowledge 1. Topic=(Aspergillosis OR aspergillus) OR Title=(Aspergillosis OR aspergillus) 2. TS=(aspergill*) OR TI=(aspergill*) 3. TS=(fungal SAME infection*) OR TI=(fungal SAME infection*) 4. TS=(invasive SAME fungal) OR TI=(invasive SAME fungal) 5. #1 OR #2 OR #3 OR #4 (59479 hits) 6. TS=(immunosorbent) OR TI=(immunosorbent) 7. TS=(ELISA) OR TI=(ELISA) OR TS=(ELISAs) OR TI=(ELISAs) 8. TS=(EIA) OR TI=(EIA) OR TS=(EIAs) OR TI=(EIsA) 9. TS=(Platelia) OR TI=(Platelia) OR FT=(Platelia) 10. TS=(galactomannan) OR TI=(galactomannan) 11. TS=(serology) OR TS=(serodiagnosis) 12. #6 OR #7 OR #8 OR #9 OR #10 OR #11 (>100000 hits) 13. #5 AND #12 (1749 hits) |
Appendix 2. QUADAS‐2 checklist
1. Patient selection domain ‐ risk of bias
1a. Was a consecutive or random sample of patients enrolled?
YES ‐ if this was clearly stated in the methods section or if the study stated that 'all' eligible patients were enrolled.
NO ‐ if it was clear that the clinician made the selection.
UNCLEAR ‐ if we could not decide between YES or NO.
1b. Was a case‐control design avoided?
This was scored YES for all included studies, as case‐control designs were excluded.
1c. Did the study avoid inappropriate exclusions?
YES ‐ if, for example, only solid tumour transplants were excluded or if no one was excluded.
NO ‐ if, for example, exclusion was done based on EORTC criteria or index test results. Studies excluding 'possible IA' patients were excluded.
UNCLEAR ‐ if it was not clear whether excluded patients were inappropriately excluded.
RISK OF BIAS:
HIGH ‐ when at least one question was answered with 'NO'.
LOW ‐ when at least two questions were answered with 'YES'.
UNCLEAR: all other situations.
CONCERNS RE. APPLICABILITY: We made an inventory of whether participants were inpatients or outpatients, the age groups of the participants and the cause of their increased risk for IA (neutropenia, corticosteroids etc).
HIGH CONCERN ‐ xxx
LOW CONCERN ‐ xxx
UNCLEAR CONCERN ‐ xxx
2. Index tests domain
2a. Were the index test results interpreted without knowledge of the results of the reference standard?
YES ‐ if the index test was done before the reference standard was assessed, or when the authors clearly stated that the assessment of the index test was blinded.
NO ‐ if the authors stated that the assessment of the index test was not blinded.
UNCLEAR ‐ all other situations.
2b. If a threshold was used, was it pre‐specified?
YES ‐ if the threshold was mentioned in the methods section, or if the authors stated that they followed the manufacturer's directions (which include guidance on the threshold).
NO ‐ if the authors drew a ROC plot, or if multiple thresholds (outside the commonly reported ones of 0.5, 1.0 and 1.5) were reported, or if the authors stated that the threshold they used was the optimal threshold in their study.
UNCLEAR ‐ all other situations.
RISK OF BIAS:
HIGH ‐ when at least one question was answered with 'NO'.
LOW ‐ when only 2b was answered 'YES' and 2a with 'UNCLEAR' (as the galactomannan test is a laboratory test) or when both questions were answered with 'YES'.
UNCLEAR: if both were answered 'UNCLEAR'.
CONCERNS RE. APPLICABILITY:
HIGH CONCERN ‐ if a threshold was used that was not one of the more commonly used thresholds (i.e. 0.5 or 1.0 or 1.5).
LOW CONCERN ‐ if a threshold of 0.5, 1.0 or 1.5 was used; all studies used a commercially available and thus relatively standard and commonly available test.
UNCLEAR CONCERN ‐ if the threshold used was not clear, or if it was not entirely clear whether the authors evaluated the Platelia® kit.
3. Reference standard domain
3a. Is the reference standards likely to correctly classify the target condition?
As we regarded the EORTC/MSG criteria as being acceptable, this item was always fulfilled by all included studies. We did, however, register whether the authors of the primary study used the exact criteria of the EORTC/MSG and (if reported) how they were interpreted. If they only mentioned that they did divide their patients into categories, but did not explain on what basis, we scored this item as 'unclear'.
3b. Were the reference standard results interpreted without knowledge of the results of the index tests?
YES ‐ when the authors clearly stated that the assessment of the index test was blinded.
NO ‐ if the authors stated that the assessment of the index test was not blinded, or if the index test formed part of the reference standard (incorporation bias).
UNCLEAR ‐ all other situations.
RISK OF BIAS:
HIGH ‐ when at least one question was answered with 'NO'.
LOW ‐ when both questions were answered 'YES'.
UNCLEAR ‐ if one was answered 'UNCLEAR' and the other 'YES' or if both were answered 'UNCLEAR'.
CONCERNS RE. APPLICABILITY:
HIGH CONCERN ‐ if the EORTC criteria were used in a different way than described in the reference papers from 2002 and 2008 (e.g. if the authors used five or three categories instead of four).
LOW CONCERN ‐ if the EORTC criteria were used in the same way as described in the reference papers from 2002 and 2008.
UNCLEAR CONCERN ‐ if it was not clear how the EORTC criteria were implemented.
4. Flow and timing domain
4a. Was there an appropriate interval between index test and reference standard?
The calculation of the diagnostic accuracy of a test is more reliable when the time between the Platelia test and the final diagnosis is not too long. If the galactomannan test is negative on day 1 and the patient is diagnosed as having IA on day 20, this test result will be regarded as a false negative result. The patient's true status on day 1, however, was not known in this case and the false negative result may have been a true negative result at that moment. We judged a time interval of less than 15 days as appropriate (YES).
4b. Did all patients receive the same reference standard?
The reference test was in most studies a composite reference while the index test was often used as screening tool to monitor whether patients developed IA. So some patients fulfilled more criteria than others. However, we considered the EORTC criteria as one reference standard. Partial verification would have been a problem in studies were only autopsy is used as reference standard, because it is only done when a patient dies and his or her family gives permission.
4c. Were all patients included in the analysis?
YES ‐ if all included patients also ended up in the 2 x 2 table.
NO ‐ if there was a discrepancy between these two numbers.
UNCLEAR ‐ if it was unclear whether patients were missing or not.
RISK OF BIAS:
HIGH ‐ when at least one question was answered with 'NO'.
LOW ‐ when at least two questions were answered 'YES' and the remaining one with 'UNCLEAR'.
UNCLEAR ‐ all other situations.

Study flow diagram.

Methodological quality graph: Review authors' judgements about each methodological quality item presented as percentages across all included studies.

Methodological quality summary: Review authors' judgements about each methodological quality item for each included study.
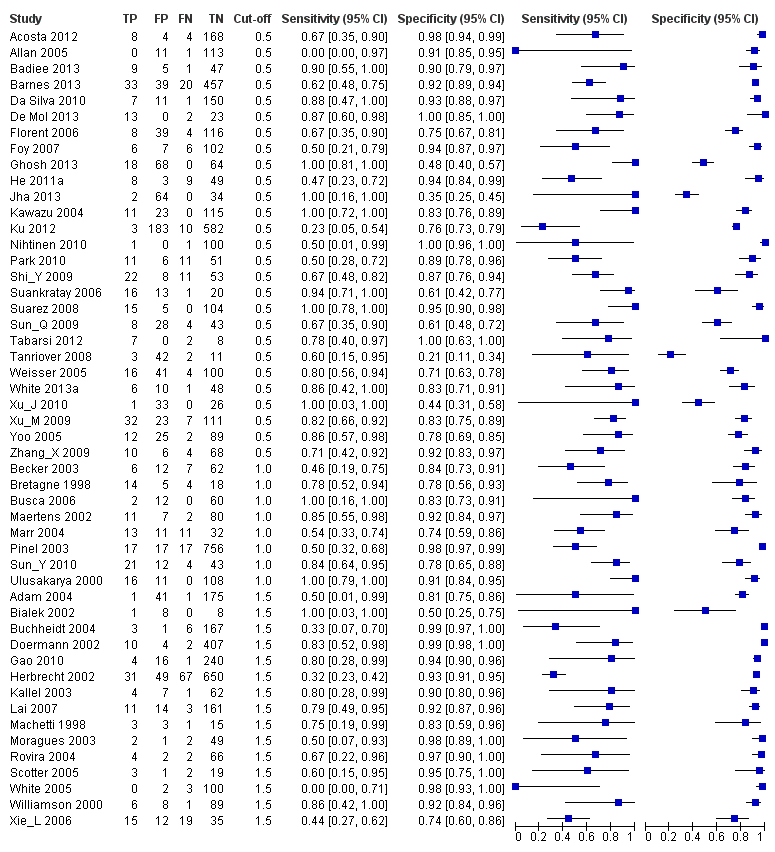
Forest plots of sensitivity and specificity. The squares represent the sensitivity and specificity of one study, the black line its confidence interval. Studies are grouped by reported cut‐off value. If a study reported accuracy data for more than one cut‐off, its results are included in more than one subgroup. TP = True Positive; FP = False Positive; FN = False Negative; TN = True Negative.
Forest plot of the included studies. TP = True Positive; FP = False Positive; FN = False Negative; TN = True Negative. Between brackets the 95% confidence intervals (CI) of sensitivity and specificity. The figure shows the estimated sensitivity and specificity of the study (blue square) and its 95% confidence interval (black horizontal line).

Plot of sensitivity versus specificity for all 54 studies, with different symbols for the different cut‐off values. The width of the symbols is proportional to the inverse standard error of the specificity in every study and the height of the symbols is proportional to the inverse standard error of the sensitivity.

Summary ROC plots for galactomannan test at three different cut‐off values. The graph shows the point estimates of sensitivity and specificity (solid dots) and the 95% confidence regions (dotted lines) around it. Data for individual studies are not shown in this plot.

Sensitivity analyses

Platelia ‐ all cut‐offs.

Platelia in children.
| What is the diagnostic accuracy of the galactomannan ELISA for invasive aspergillosis for different cut‐off values? Patients/population: immunocompromised patients, mostly haematology patients Prior testing: varied, mostly underlying disease or symptoms (fever, neutropenia) Setting: mainly haematology or cancer departments, mainly inpatients Index test: a sandwich ELISA for galactomannan, an Aspergillus antigen Importance: depends on the time‐gain the test may give Reference standard: gold standard is autopsy, but that is almost never done; in most studies therefore the reference standard is composed of clinical and microbiological criteria Studies: patient series or case‐control studies, not using an in‐house test and not excluding possibly infected patients. Studies had to report cut‐off values that were used (n = 29). Each study can be present in more than one subgroup | |||||
| Subgroup | Effect (95% CI) | No. of participants (studies) | Prevalence (median, range) | Comments | What do these results mean? |
| Cut‐off 0.5 | Sensitivity 0.78 (0.70 to 0.85) Specificity 0.85 (0.78 to 0.91) | 394 proven or probable 3549 possible or no IA (27) | Median 11% (IQR 6.5% to 16%) | — | With a prevalence of 11%*, 11 out of 100 patients will develop IA Of these, 2 will be missed by the Platelia test (22% of 11), but will be tested again Of the 89 patients without IA, 13 will be unnecessarily referred for CT scanning |
| Cut‐off 1.0 | Sensitivity 0.71 (0.63 to 0.78) Specificity 0.90 (0.86 to 0.93) | 145 proven or probable 1246 possible or no IA (8) | Median 13% (IQR 4.2% to 31%) | — | With a prevalence of 11%*, 11 out of 100 patients will develop IA Of these, 3 will be missed by the Platelia test (29% of 11), but will be tested again Of the 89 patients without IA, 9 will be unnecessarily referred for CT scanning |
| Cut‐off 1.5 | Sensitivity 0.63 (0.49 to 0.77) Specificity 0.93 (0.89 to 0.97) | 209 proven or probable 2412 possible or no IA (15) | Median 7.4% (IQR 4.3% to 16%) | — | With a prevalence of 11%*, 11 out of 100 patients will develop IA Of these, 4 will be missed by the Platelia test (36% of 11), but will be tested again Of the 89 patients without IA, only 6 will be unnecessarily referred for CT scanning |
| Children | Sensitivity 0.84 (0.66 to 0.93) Specificity 0.88 (0.60 to 0.97) | 47 proven or probable 308 possible or no IA (in 6 studies) | Median 16% (IQR 10% to 16%) | 5 studies had a cut‐off of 0.5 and one had a cut‐off of 1.5 | Of the 100 children, 16 had IA |
| * Median prevalence over all studies was 11% (range 0.8% to 56%). CI: confidence interval; CT: computerised tomography; ELISA: enzyme‐linked immunosorbent assay; IA: invasive aspergillosis; IQR: interquartile range | |||||
| Proven IA | Histopathologic or cytopathologic examination showing hyphae from needle aspiration or biopsy specimen with evidence of associated tissue damage; or positive culture result for a sample obtained by sterile procedure from a normally sterile and clinically or radiologically abnormal site consistent with infection |
| Probable IA | At least 1 host factor criterion; and 1 microbiological criterion; and 1 major (or 2 minor) clinical criteria from abnormal site consistent with infection |
| Possible IA | At least 1 host factor criterion; and 1 microbiological or 1 major (or 2 minor) clinical criteria from abnormal site consistent with infection. This category is not recommended for use in clinical trials of antifungal agents |
| Host factor criteria are, for example, neutropenia, persistent fever, predisposing conditions, prolonged use of corticosteroids. Microbiological criteria are positive culture from sputum, bronchoalveolar lavage fluid (BAL) samples or from sinus aspirate specimen; positive result for Aspergillus antigen in specimens of BAL, cerebrospinal fluid or two or more blood samples. Major clinical criteria are, for example, new infiltrates on CT imaging (e.g. halo sign), suggestive radiological findings. Minor clinical criteria are suggestive symptoms and signs. The exact definitions of the EORTC/MSG criteria and their host factor, microbiological or clinical criteria can be found here (Ascioglu 2002). CT: computerised tomography; EORTC: European Organization for Research and Treatment of Cancer; MSG: Mycoses Study Group | |
| Cut‐off | Analysis | Studies (n) | Sensitivity (95% CI) | Specificity (95% CI) |
| 0.5 | 27 | 0.78 (0.70 to 0.85) | 0.85 (0.78 to 0.91) | |
| Single sample | 13 | 0.79 (0.69 to 0.88) | 0.80 (0.71 to 0.90) | |
| Subsequent samples | 14 | 0.77 (0.67 to 0.87) | 0.88 (0.81 to 0.94) | |
| 1.0 | 8 | 0.71 (0.63 to 0.78) | 0.90 (0.86 to 0.93) | |
| Single sample | 4 | 0.72 (0.62 to 0.82) | 0.87 (0.81 to 0.93) | |
| Subsequent samples | 4 | 0.70 (0.59 to 0.80) | 0.92 (0.88 to 0.96) | |
| 1.5 | 15 | 0.63 (0.49 to 0.77) | 0.93 (0.89 to 0.97) | |
| Single sample | 8 | 0.64 (0.48 to 0.80) | 0.92 (0.86 to 0.97) | |
| Subsequent samples | 7 | 0.61 (0.45 to 0.78) | 0.95 (0.91 to 0.98) | |
| CI: confidence interval | ||||
| Cut‐off value and analysis | Proven and probable versus possible and no IA | Proven versus probable, possible and no IA | Proven, probable and possible versus no IA | ||||||
| n | Sensitivity (95% CI) | Specificity (95% CI) | n | Sensitivity (95% CI) | Specificity (95% CI) | n | Sensitivity (95% CI) | Specificity (95% CI) | |
| 0.5 ODI | 27 | 0.78 (0.70 to 0.85) | 0.85 (0.78 to 0.91) | 18 | 0.89 (0.79 to 0.99) | 0.72 (0.62 to 0.82) | 19 | 0.55 (0.41 to 0.69) | 0.87 (0.80 to 0.94) |
| 1.0 ODI | 8 | 0.71 (0.63 to 0.78) | 0.90 (0.86 to 0.93) | 8 | 0.79 (0.70 to 0.89) | 0.83 (0.78 to 0.88) | 8 | 0.54 (0.44 to 0.65) | 0.93 (0.90 to 0.96) |
| 1.5 ODI | 15 | 0.63 (0.49 to 0.77) | 0.93 (0.89 to 0.97) | 14 | 0.65 (0.48 to 0.83) | 0.91 (0.86 to 0.96) | 14 | 0.54 (0.36 to 0.71) | 0.97 (0.94 to 0.99) |
| CI: confidence interval; IA: invasive aspergillosis; ODI: optical density index | |||||||||
| Test | No. of studies | No. of participants |
| 1 Platelia ‐ all cut‐offs Show forest plot | 50 | 7955 |
| 2 Platelia in children Show forest plot | 7 | 472 |