Rituximab para la artritis reumatoide
Resumen
Antecedentes
El rituximab es un agente biológico selectivo que bloquea la actividad de los linfocitos B para tratar la artritis reumatoide (AR) refractaria. Es un anticuerpo monoclonal quimérico dirigido contra el CD 20 que se promueve como tratamiento para los pacientes que no logran responder a otros productos biológicos. Existen pruebas que sugieren que el rituximab es efectivo y bien tolerado cuando se usa en combinación con metotrexato para la AR.
Objetivos
Evaluar los efectos beneficiosos y perjudiciales del rituximab para el tratamiento de la AR.
Métodos de búsqueda
Se realizó una búsqueda (hasta enero 2014) en bases de datos electrónicas (The Cochrane Library, MEDLINE, EMBASE,CINAHL, Web of Science), registros de ensayos clínicos y sitios web de organismos reguladores. También se examinaron las listas de referencias de revisiones integrales.
Criterios de selección
Todos los ensayos controlados que comparaban el tratamiento con rituximab como monoterapia o en combinación con cualquier fármaco antirreumático modificador de la enfermedad (FARME) (tradicional o biológico) versus placebo u otro (FARME) (tradicional o biológico) en pacientes adultos con AR activa.
Obtención y análisis de los datos
Dos revisores evaluaron de forma independiente el riesgo de sesgo y extrajeron los datos de cada estudio.
Resultados principales
Se incluyeron ocho estudios con 2720 pacientes. En seis estudios, no se pudo evaluar el sesgo de selección y se consideró que dos estudios tenían un bajo riesgo de sesgo. El nivel de las pruebas varió de bajo a alto, aunque se consideró moderado para la mayoría de los resultados. Se ha priorizado el informe del rituximab (dos dosis de 1000 mg) en combinación con metotrexato debido a que la misma es la dosis aprobada y la combinación usada más comúnmente. También se informaron datos sobre otras combinaciones y dosis como información complementaria en la sección de resultados de la revisión.
Las tasas de respuesta del American College of Rheumatology (ACR) 50 presentaron mejorías estadísticamente significativas con rituximab (dos dosis de 1000 mg) en combinación con metotrexato en comparación con metotrexato solo entre las 24 y las 104 semanas. El CR para el logro de un ACR 50 a las 24 semanas fue de 3,3 (IC del 95%: 2,3 a 4,6); 29% de los pacientes que recibieron rituximab (dos dosis de 1000 mg) en combinación con metotrexato lograron el ACR 50 en comparación con un 9% de los controles. El beneficio absoluto del tratamiento (BAT) fue de 21% (IC del 95%: 16% a 25%) con un número necesario a tratar (NNT) de 6 (IC de 95%: 4 a 9).
A las 52 semanas, el CR para el logro de la remisión clínica (Disease Activity Score [DAS] 28 articulaciones < 2,6) con rituximab (dos dosis de 1000 mg) en combinación con metotrexato en comparación con monoterapia con metotrexato fue de 2,4 (IC del 95%: 1,7 a 3,5); un 22% de los pacientes que recibieron rituximab (dos dosis de 1000 mg) en combinación con metotrexato lograron la remisión clínica en comparación con un 11% de los controles. El BAT fue de 11% (IC del 95%: 2% a 20%) con un NNT de 7 (IC del 95%: 4 a 13).
A las 24 semanas, el CR para el logro de una mejoría clínicamente significativa (MCS) en el Health Assessment Questionnaire (HAQ) (> 0,22) para los pacientes que recibieron rituximab combinado con metotrexato en comparación con los pacientes que recibieron metotrexato solo fue de 1,6 (IC del 95%: 1,2 a 2,1). El BAT fue de 24% (IC del 95%: 12% 36%) con un NNT de 5 (IC de 95%: 3 a 13). A las 104 semanas, el CR para el logro de una MCS en el HAQ (> 0,22) fue de 1,4 (IC del 95%: 1,3 a 1,6). El BAT fue de 24% (IC del 95%: 16% a 31%) con un NNT de 5 (IC de 95%: 3 a 7).
A las 24 semanas, el CR para la prevención de la progresión radiográfica en los pacientes que recibieron rituximab (dos dosis de 1000 mg) en combinación con metotrexato fue de 1,2 (IC del 95%: 1,0 a 1,4) en comparación con metotrexato solo; el 70% de los pacientes que recibieron rituximab (dos dosis de 1000 mg) en combinación con metotrexato no presentaron ninguna progresión radiográfica en comparación con un 59% de los controles. El BAT fue de 11% (IC del 95%: 2% a 19%) y el NNT fue de 10 (IC del 95%: 5 a 57). Se observaron beneficios similares a las 52 a 56 semanas y a las 104 semanas.
Significativamente más pacientes desde un punto de vista estadístico lograron una MCS en los componentes físicos y mentales de la calidad de vida, medido con el Short Form (SF)‐36, en el grupo tratado con rituximab (dos dosis de 1000 mg) en combinación con metotrexato en comparación con metotrexato solo entre las 24 y las 52 semanas (CR 2,0; IC del 95%: 1,1 a 3,4; NNT 4; IC del 95%: 3 a 8 y CR 1,4; IC del 95%: 1,1 a 1,9; NNT8, IC del 95%: 5 a 19, respectivamente); 34 y 13 pacientes más de 100 mostraron una mejoría en el componente físico de la medida de la calidad de vida en comparación con metotrexato solo (IC del 95%: 5% a 84%; IC del 95%: 7% a 8%, respectivamente).
No hubo pruebas de una diferencia estadísticamente significativa en las tasas de retiros debido a los eventos adversos o por otras razones (o sea, revocación del consentimiento, violación, razones administrativas, imposibilidad de retornar) en cualquiera de los grupos. Sin embargo, estadística y significativamente más pacientes que recibieron el fármaco de control se retiraron del estudio en comparación con los que recibieron rituximab (dos dosis de 1000 mg) en combinación con metotrexato en todo momento (CR 0,40; IC del 95%: 0,32 a 0,50; CR 0,61; IC del 95%: 0,40 a 0,91; CR 0,48; IC del 95%: 0,28 a 0,82; CR 0,58; IC del 95%: 0,45 a 0,75; respectivamente). A las 104 semanas, un 37% se retiró del grupo de control y un 20% se retiró del grupo de rituximab (dos dosis de 1000 mg) en combinación con metotrexato. La diferencia de riesgos absoluta (DRA) fue de ‐20% (IC del 95%: ‐34% a ‐5%) con un número necesario a dañar (NNH) de 7 (IC de 95%: 5 a 11).
Una mayor proporción de pacientes que recibieron rituximab (dos dosis de 1000 mg) en combinación con metotrexato desarrolló eventos adversos después de la primera infusión en comparación con los que recibieron monoterapia con metotrexato e infusiones de placebo (CR 1,6; IC del 95%: 1,3 a 1,9); un 26% de los que recibieron rituximab más metotrexato informaron más eventos asociados con la primera infusión en comparación con un 16% de los del régimen de control con una DRA del 9% (IC del 95%: 5% a 13%) y un NNH de 11 (IC de 95%: 21 a 8). Sin embargo, no se observaron diferencias estadísticamente significativas en las tasas de eventos adversos graves.
Conclusiones de los autores
Las pruebas de ocho estudios indican que el rituximab (dos dosis de 1000 mg) en combinación con metotrexato es significativamente más efectivo que el metotrexato solo para mejorar los síntomas de la AR y prevenir la progresión de la enfermedad.
PICO
Resumen en términos sencillos
Rituximab para la artritis reumatoide
Se examinó la investigación publicada hasta enero 2014 sobre el efecto del rituximab para personas con artritis reumatoide. De ocho estudios que evaluaron a 2720 pacientes con artritis reumatoide, se encontró que el rituximab probablemente:
‐ mejoró el dolor, la función y otros síntomas;
‐ redujo la actividad de la enfermedad;
‐ redujo el daño a las articulaciones según lo observado en la radiografía.
A menudo no se cuenta con información precisa acerca de los efectos secundarios y las complicaciones. Lo anterior es particularmente cierto para los efectos secundarios raros pero graves. Los efectos secundarios posibles son reacciones a la infusión, trastornos vasculares e infecciones.
¿Qué es la artritis reumatoide y qué es el rituximab?
Cuando se tiene artritis reumatoide, el sistema inmunitario, que combate normalmente la infección, ataca el recubrimiento de las articulaciones. Lo anterior hace que las articulaciones se inflamen, se pongan rígidas y duelan. En la actualidad no existe cura para la AR, de modo que los tratamientos procuran aliviar el dolor y mejorar la capacidad de movimiento.
El rituximab actúa mediante el bloqueo de la actividad de los linfocitos B, un tipo de célula inmunitaria que causa la tumefacción y el daño de la articulación en pacientes con artritis reumatoide. El rituximab se administra por vía intravenosa. El rituximab es de gran interés para los pacientes con artritis reumatoide de acuerdo con las mejorías en los síntomas y la progresión radiográfica, y la tasa baja de efectos secundarios a corto plazo.
¿Qué les sucede a los pacientes con artritis reumatoide que reciben rituximab más metotrexato?
ACR 50 (número de articulaciones con sensibilidad y tumefacción, dolor y discapacidad)
‐ 21 pacientes más de 100 presentaron mejorías de los síntomas después de seis meses con rituximab más metotrexato en comparación con metotrexato solo (mejoría absoluta del 21%)*.
‐ 29 pacientes de 100 presentaron mejorías con rituximab más metotrexato en comparación con nueve de cada 100 que recibieron metotrexato solo.
Actividad de la enfermedad
‐ 11 pacientes más de 100 lograron la remisión de la artritis reumatoide después de un año con rituximab más metotrexato en comparación con metotrexato solo (mejoría absoluta del 11%).
‐ 22 pacientes de 100 que recibieron rituximab más metotrexato lograron la remisión en comparación con 11 de cada 100 que recibieron metotrexato solo.
Función física
‐ 24 pacientes más de 100 lograron una mejoría significativa en la función física después de dos años con rituximab más metotrexato en comparación con metotrexato solo (mejoría absoluta del 24%).
‐ 85 pacientes de 100 que recibieron rituximab más metotrexato lograron una mejoría significativa en la función física en comparación con 61 de cada 100 que recibieron metotrexato solo.
Radiografías de las articulaciones
‐ 19 pacientes más de 100 no presentaron daños en las articulaciones después de dos años con rituximab más metotrexato en comparación con metotrexato solo (mejoría absoluta del 19%)*.
‐ 57 pacientes de 100 que recibieron rituximab más metotrexato no presentaron daños en las articulaciones en comparación con 39 de cada 100 que recibieron metotrexato solo.
Calidad de vida ‐ componente físico (salud general, dolor, y capacidad para realizar las actividades físicas)
‐ 34 pacientes más de 100 percibieron que la salud general, el dolor y la capacidad de realizar las actividades físicas fueron mejores después de entre seis y 12 meses con rituximab más metotrexato en comparación con metotrexato solo (mejoría absoluta del 34%)*.
‐ 70 pacientes de 100 que recibieron rituximab más metotrexato percibieron que la salud general, el dolor y la capacidad de realizar las actividades físicas fueron mejores en comparación con 36 de cada 100 que recibieron metotrexato solo.
Calidad de vida ‐ componente mental
‐ 13 pacientes más de 100 percibieron que el bienestar mental fue mejor después de entre seis y 12 meses con rituximab más metotrexato en comparación con metotrexato solo (mejoría absoluta del 13%).
‐ 48 pacientes de 100 que recibieron rituximab más metotrexato consideraron que el bienestar mental fue mejor en comparación con 35 de 100 que recibieron metotrexato solo.
Interrupciones debidas a eventos adversos
‐ dos pacientes menos de 100 interrumpieron el tratamiento con rituximab más metotrexato debido a los efectos secundarios después de dos años en comparación con metotrexato solo (retiros absolutos del ‐2%).
‐ tres pacientes de 100 que recibieron rituximab más metotrexato interrumpieron el tratamiento con metotrexato debido a los efectos secundarios en comparación con cinco de 100 que recibieron un placebo.
Eventos adversos graves
‐ cuatro pacientes menos de 100 presentaron efectos secundarios graves después de dos años con rituximab más metotrexato en comparación con metotrexato solo (daños absolutos del ‐4%).
‐ 13 pacientes de 100 que recibieron rituximab más metotrexato presentaron efectos secundarios en comparación con 17 de cada 100 que recibieron metotrexato solo.
*diferencia de unidad de 1% debido al redondeo.
Conclusiones de los autores
Summary of findings
| Rituximab (2 x 1000 mg) plus methotrexate compared to methotrexate monotherapy for rheumatoid arthritis | ||||||||
| Patient or population: patients with rheumatoid arthritis | ||||||||
| Outcomes | Follow‐up (weeks) | Illustrative comparative risks* (95% CI) | Relative effect | No of participants | Quality of the evidence | Comments | ||
| Assumed risk | Corresponding risk | |||||||
| Methotrexate monotherapy | Rituximab (2 x 1000 mg) plus methotrexate | |||||||
| Clinical improvement American College of Rheumatology 50% improvement criteria | 24 | 88 per 1000 | 286 per 1000 | RR 3.3 | 1165 | ⊕⊕⊕⊝ | Absolute treatment benefit 21% (95% CI 16% to 25%); Relative per cent change 225% (95% CI 131% to 358%); NNTB 6 (95% CI 9 to 4) | |
| 48 to 56 | 331 per 1000 | 742 per 1000 | RR 2.2 | 852 | ⊕⊕⊕⊝ | Absolute treatment benefit 24% (95% CI 18% to 30%); Relative per cent change 124% (95% CI 26% to 295%); NNTB 4 (95% CI 6 to 3) | ||
| 104 | 377 per 1000 | 562 per 1000 | RR 1.5 | 579 | ⊕⊕⊕⊝ | Absolute treatment benefit 17% (95% CI 8% to 27%); Relative per cent change 149% (95% CI 25% to 77%); NNTB 6 (95% CI 11 to 4) | ||
| Clinical remission (Disease Activity Score‐28 joint count < 2.6) (Scale from 2 to 10) | 24 | 11 per 1000 | 99 per 1000 | RR 9.1 | 834 | ⊕⊕⊕⊝ | Not statistically significant. Absolute treatment benefit 8% (95% CI 6% to 11%); Relative per cent change 809% (95% CI ‐24% to 1072%); NNTB N/A | |
| 48 to 52 | 112 per 1000 | 221 per 1000 | RR 2.4 | 772 | ⊕⊕⊕⊝ | Absolute treatment benefit 11% (95% CI 2% to 20%); Relative per cent change 142% (95% CI 70% to 246%); NNTB 7 (95% 13 CI to 4) | ||
| 104 | 129 per 1000 | 320 per 1000 | RR 2.5 | 499 | ⊕⊕⊕⊝ | Absolute treatment benefit 19% (95% CI 12% to 26%); Relative per cent change 149% (95% CI 72% to 261%); NNTB 6 (95% 11 CI to 3) | ||
| Physical function (HAQ‐DI MCID = ‐0.22) | 24 | 387 per 1000 | 623 per 1000 | RR 1.6 | 1161 | ⊕⊕⊕⊕ | Absolute treatment benefit 24% (95% CI 12% to 36%); Relative per cent change 61% (95% CI 22% to 112%); NNTB 5 (95% CI 13 to 3) | |
| 48 to 56 | 726 per 1000 | 1000 per 1000 | RR 1.6 | 562 | ⊕⊕⊕⊕ | Absolute treatment benefit 24% (95% CI ‐5% to 52%); Relative per cent change 57% (95% CI ‐29% to 244%); NNTB N/A | ||
| 72 | 200 per 1000 | 464 per 1000 | RR 2.3 | 43 | ⊕⊕⊕⊕ | Absolute treatment benefit 26% (95% CI ‐1% to 54%); Relative per cent change 132% (95% CI ‐22% to 589%); NNTB N/A | ||
| 104 | 608 per 1000 | 845 per 1000 | RR 1.4 | 523 | ⊕⊕⊕⊕ | Absolute treatment benefit 24% (95% CI 16% to 31%); Relative per cent change 39% (95% CI 25% to 55%); NNTB 5 (95% CI 7 to 3) | ||
| No radiographic progression in total Genant‐modified Sharp score (range 0 to 290) | 24 | 591 per 1000 | 697 per 1000 | RR 1.2 | 476 | ⊕⊕⊕⊝ | Absolute treatment benefit 11% (95% CI 2% to 19%); Relative per cent change 18% (95%CI 3% to 35%); NNTB 10 (95% CI 57 to 5) | |
| 56 | 500 per 1000 | 625 per 1000 | RR 1.3 | 940 | ⊕⊕⊕⊝ | Absolute treatment benefit 12% (95% CI 6% to 19%); Relative per cent change 25% (95%CI 11% to 40%); NNTB 8 (95% CI 19 to 5) | ||
| 104 | 379 per 1000 | 568 per 1000 | RR 1.5 | 945 | ⊕⊕⊕⊝ | Absolute treatment benefit 19% (95% CI 13% to 25%); Relative per cent change 50% (95%CI 30% to 73%); NNTB 6 (95% CI 9 to 4) | ||
| Health‐related quality of life | SF‐36 PCS MCID = ‐5 or 5.42 | 24 to 52 | 355 per 1000 | 697 per 1000 (405 to 1000) | RR 2.0 (1.1 to 3.4) | 1,526 (4 studies) | ⊕⊕⊕⊕ | Absolute treatment benefit 34% (95% CI 5% to 84%); Relative percent change 96% (95%CI 14% to 226%); NNTB 4 (95% CI 8 to 3) |
| SF‐36 MCS MCID = ‐5 or 6.33 | 24 to 52 | 345 per 1000 | 475 per 1000 (352 to 638) | RR 1.4 (1.1 to 1.9) | 1282 (3 studies) | ⊕⊕⊕⊕ | Absolute treatment benefit 13% (95% CI 7% to 18%); Relative per cent change 43% (95% CI 6% to 92%); NNTB 8 (95% CI 19 to 5) | |
| Discontinuations due to adverse events | 24 | 10 per 1000 | 21 per 1000 | RR 2.1 | 1385 | ⊕⊕⊕⊝ | Not statistically significant; Absolute risk difference 1% (95% CI 0% to 3%); Relative per cent change 107% (95% CI ‐12% to 388%); NNTH N/A | |
| 48‐52 | 24 per 1000 | 24 per 1000 | RR 1.0 | 927 | ⊕⊕⊕⊕ | Not statistically significant; Absolute risk difference 0% (95% CI ‐2% to 2%); Relative per cent change 0% (95% CI ‐56% to 129%); NNTH N/A | ||
| 72 | 75 per 1000 | 25 per 1000 | RR 0.33 | 80 | ⊕⊕⊕⊝ | Not statistically significant; Absolute risk difference ‐5% (95% CI ‐14% to 4%); Relative per cent change ‐67% (95% CI ‐96% to 207%); NNTH N/A | ||
| 104 | 55 per 1000 | 31 per 1000 | RR 0.56 | 579 | ⊕⊕⊕⊕ | Not statistically significant; Absolute risk difference ‐2% (95% CI ‐6% to 1%); Relative per cent change ‐44% (95% CI ‐45% to 25%); NNTH N/A | ||
| Serious adverse events | 24 | 75 per 1000 | 75 per 1000 | RR 1 | 1280 | ⊕⊕⊕⊝ | Not statistically significant; Absolute risk difference 0% (95% CI ‐3% to 3%); Relative per cent change 0% (95% CI ‐32% to 45%); NNTH N/A | |
| 48 to 56 | 103 per 1000 | 97 per 1000 | RR 0.94 | 579 | ⊕⊕⊕⊕ | Not statistically significant; Absolute risk difference ‐1% (95% CI ‐6% to 4%); Relative per cent change ‐6% (95% CI ‐43% to 53%); NNTH N/A | ||
| 104 | 169 per 1000 | 132 per 1000 | RR 0.78 | 499 | ⊕⊕⊕⊝ | Not statistically significant; Absolute risk difference ‐4% (95% CI ‐10% to 3%); Relative per cent change ‐22% (95% CI ‐49% to 19%); NNTH N/A | ||
| *The basis for the assumed risk (e.g. the median control group risk across studies) is provided in footnotes. The corresponding risk (and its 95% confidence interval) is based on the assumed risk in the comparison group and the relative effect of the intervention (and its 95% CI). | ||||||||
| GRADE Working Group grades of evidence | ||||||||
| 1 Only one study was graded as having low risk of bias | ||||||||
Antecedentes
Descripción de la afección
La artritis reumatoide (AR) es una artritis inflamatoria crónica que causa morbilidad significativa y puede dar lugar a una pérdida considerable de la función(Grassi 1998; Wolfe 1996). La intervención temprana puede controlar el dolor y el edema de las articulaciones y reducir el riesgo de discapacidad y de daño permanente en las articulaciones. Los fármacos antirreumáticos que modifican la enfermedad (FARME) siguen siendo el tratamiento inicial preferido para la AR; se ha observado que reducen la actividad de la enfermedad, retrasan las erosiones de las articulaciones y mejoran la calidad de vida del paciente (Fries 1996; Lopez‐Olivo 2014). Lamentablemente, muchos pacientes no logran responder de forma adecuada o necesitan interrumpir el tratamiento debido a los efectos secundarios. Los fármacos biológicos han mostrado efectividad en los pacientes que no responden a los FARME (Breedveld 2006; Lethaby 2013; Lipsky 2000; Maxwell 2009; Navarro‐Sarabia 2005; Singh 2009; Singh 2010; Singh 2010a).
Descripción de la intervención
El rituximab (MabThera o Rituxan) es un anticuerpo monoclonal quimérico diseñado genéticamente que se dirige al CD20 (Dörner 2003; Olsen 2004). En 2006, el rituximab se aprobó para el uso en los pacientes con AR. Cada ciclo abarca dos infusiones intravenosas de 1000 mg el día 0 y 15. Los ciclos son administrados a intervalos de al menos cuatro meses. El costo del rituximab varía a través de los ámbitos de asistencia sanitaria.
De qué manera podría funcionar la intervención
El rituximab es un agente biológico selectivo que bloquea la actividad del CD20 en los linfocitos B y se utiliza para el tratamiento de los pacientes adultos con AR activa que no logran responder a otros FARME biológicos (Cohen 2006; Higashida 2005). Los linfocitos B desempeñan una función crucial en la patogenia de la AR. Se han asociado con auto‐anticuerpos (factor reumatoide [FR] y anticuerpos proteicos anti‐citrulinados [anti‐CCP, por sus siglas en inglés]) y se han encontrado en la sinovia inflamada donde pueden dar lugar a daño en el hueso y el cartílago de las articulaciones(Boumas 2009). La mayoría de las reacciones a las infusiones de rituximab son leves a moderadas y ocurren durante la primera infusión (Mohrbacher 2005). Las reacciones a infusiones e infecciones inducidas por rituximab son los eventos adversos más frecuentes. Puede administrarse paracetamol, agentes antihistamínicos y glucocorticoides antes de cada infusión para reducir la incidencia y la gravedad de las reacciones a infusiones. El tratamiento médico debe estar disponible durante la administración de rituximab para tratar las reacciones graves a las infusiones.
Por qué es importante realizar esta revisión
Hay pruebas para sugerir que el rituximab es efectivo y bien tolerado cuando se utiliza en combinación con metotrexato para el tratamiento de la AR (Edwards 2001; Edwards 2004). Esta revisión sintetiza las pruebas más actuales sobre la administración de rituximab para la AR, e informa a los médicos, los pacientes y los elaboradores de políticas acerca de su eficacia y seguridad cuando se lo utiliza solo o combinado con otro FARME.
Objetivos
Evaluar los efectos beneficiosos y perjudiciales del rituximab para el tratamiento de la AR.
Métodos
Criterios de inclusión de estudios para esta revisión
Tipos de estudios
Todos los ensayos controlados aleatorios (ECA) o ensayos clínicos controlados (ECC) que compararan rituximab en combinación con cualquier FARME o rituximab solo versus placebo, otros FARME o cualquier agente biológico durante un periodo de ensayo mínimo de cuatro meses. Se aceptaron ECA con pacientes que recibían tratamiento concomitante incluidas las dosis estables de corticosteroides o fármacos antiinflamatorios no esteroides.
Tipos de participantes
Pacientes de al menos 18 años de edad que cumplían los criterios revisados del American College of Rheumatology (ACR) 1987 (Arnett 1988) para la AR y la enfermedad activa según lo descrito por los autores con relación a las medidas de resultado.
Tipos de intervenciones
Los estudios que informaban la eficacia o la seguridad del rituximab como monoterapia o en combinación con cualquier FARME (tradicional o biológico) versus placebo u otro FARME (tradicional o biológico) reunieron los requisitos para la inclusión. Se ha priorizado el informe del rituximab (dos dosis de 1000 mg) en combinación con metotrexato debido a que esta es la combinación utilizada más comúnmente y la dosis aprobada. También se informaron datos adicionales en la sección de resultados de la revisión como información complementaria sobre: (i) la monoterapia con rituximab versus monoterapia con metotrexato, (ii) rituximab (dos dosis de 500 mg) en combinación con metotrexato versus metotrexato, (iii) rituximab (dos dosis de 1000 mg) en combinación con ciclofosfamida versus monoterapia con rituximab y (iv) rituximab en combinación con metotrexato y un inhibidor del factor de necrosis tumoral (FNT) versus metotrexato en combinación con un inhibidor del FNT.
Tipos de medida de resultado
Los resultados primarios de eficacia incluidos en esta revisión fueron la respuesta de la AR al tratamiento con rituximab según lo definido por la serie central de medidas de la actividad de la enfermedad del ACR (Felson 1995), la Organización Mundial de la Salud (World Health Organization, WHO), y el grupo principal de medidas de actividad de la enfermedad de la International League of Associations for Rheumatology (ILAR ) (Furst 1994).
Resultados primarios
1. Criterios de mejoría. Medidos con la respuesta en el ACR 50, que representa una mejoría del 50% en los recuentos de las articulaciones con sensibilidad y tumefacción, más una mejoría del 50% en tres de los cinco componentes centrales (Felson 1995)
2. Remisión de la enfermedad. Medida con las Disease Activity Scores (DAS) < 2,6 (Prevoo 1995)
3. Estado funcional. Medido con el Health Assessment Questionnaire (HAQ)(Fries 1982)
4. Progresión radiográfica para los estudios con un mínimo de seis meses de duración, incluidas las puntuaciones de Sharp/Genant, Sharp/van der Heijde, y Larsen (Genant 1998; Larsen 1973; van der Heijde 1999)
5. Calidad de vida relacionada con la salud. Medida con el Medical Outcomes Study Short‐Form Health Survey (SF‐36)
6. Retiros debidos a eventos adversos
7. Eventos adversos graves
Resultados secundarios
1. Respuestas en el ACR 20 y en el ACR 70; que representan una mejoría del 20% o 70% en los recuentos de articulaciones con sensibilidad y tumefacción más una mejoría del 20%, 50%, o 70% en tres de los cinco componentes centrales (Felson 1995)
2. Criterios de respuesta del The European League Against Rheumatism (EULAR), que incluyen no sólo el cambio en la actividad de la enfermedad sino también la actividad actual de la enfermedad. Con EULAR, los pacientes se clasifican como los que responden si se observa un cambio significativo en la DAS y una actividad baja de la enfermedad actual. Incluye tres categorías: buenos, moderados y los que no responden (Van Gestel 1996)
3. Componentes individuales de la serie central del ACR: recuento de articulaciones sensibles (RAS), recuento de articulaciones con tumefacción (RAT), evaluación del paciente del dolor con una escala analógica visual de 10 cm o una escala de Likert, evaluación global paciente de la actividad de la enfermedad, evaluación global del médico de la actividad de la enfermedad con una escala analógica visual de 10 cm o una escala de Likert, HAQ, o reactivos de la fase aguda como la tasa de sedimentación de eritrocitos Westergren o la proteína C‐reactiva (Felson 1995)
4. Medidas de resultado informadas por los pacientes como la escala de fatiga de la Functional Assessment of Chronic Illness Therapy (FACIT‐F)
5. Retiros (totales, debidos a la falta de eficacia, y debidos a otras razones)
6. eventos adversos (totales, infecciones, infecciones graves, muertes, reacciones agudas a la infusión, cardiovasculares y neoplasias malignas)
Results
Description of studies
Results of the search
Our search resulted in 5099 records; 2100 citations were selected for a further review based on their title or abstract. After review of the abstracts, 28 full text articles were retrieved. Twelve articles were excluded after reviewing the full publication (see Characteristics of excluded studies for further details). A total of 16 publications (8 studies) met the inclusion criteria. See Figure 1 for a flow diagram of the search results.

Flow diagram of included studies.
aStudy reported results on cycle 1 and cycle 2 (re‐treatment)
bRe‐treatment was permitted at 24 weeks for patients not responding at least 20%
Included studies
Please refer to the table Characteristics of included studies for an overview of the included studies.
Design
Seven studies were randomised, double‐blind, placebo‐controlled trials (Cohen 2006 (REFLEX); Edwards 2004 (WA16291); Emery 2006 (DANCER); Emery 2010 (SERENE); Greenwald 2011 (TAME); Rubbert‐Roth2010 (MIRROR); Tak 2010 (IMAGE)) and one was randomised but unblinded (Owczarczyk 2008). The randomisation ratios ranged between 1:1:1 and 3:2 for treatment to control.
Sample sizes
Sample sizes ranged from 161 in Edwards 2004 (WA16291) to 748 in the Tak 2010 (IMAGE) study.
Setting
Seven trials were multicentre studies including centres across the US, Canada, Israel, Australia, Brazil, Mexico, New Zealand, and several European countries (Cohen 2006 (REFLEX); Edwards 2004 (WA16291); Emery 2006 (DANCER); Emery 2010 (SERENE); Greenwald 2011 (TAME); Rubbert‐Roth2010 (MIRROR); Tak 2010 (IMAGE).
Participants
Eight trials with 2720 patients were included in this review: 837 patients were randomised to a traditional DMARD (methotrexate or cyclophosphamide), 60 patients to rituximab monotherapy, 1791 to rituximab (either 500 or 1000 mg) combined with a traditional DMARD, and 32 to rituximab in combination with methotrexate and a TNF inhibitor. Only one trial did not report on gender (Owczarczyk 2008), but for the remaining studies the majority of included patients were women (2268) with percentages ranging from 73% to 94%. The average age of the participants in all of the trials was 51.1 ± 13 years. The average disease duration ranged between 0.91 and 12 years. Five studies enrolled patients with a disease duration greater than six months (Cohen 2006 (REFLEX); Emery 2006 (DANCER); Emery 2010 (SERENE); Greenwald 2011 (TAME); Rubbert‐Roth2010 (MIRROR); another study enrolled patients that had a disease duration ≥ one year (Owczarczyk 2008); one study did not specify disease duration in their enrolment criteria, but the disease duration range was 9 to 12 years Edwards 2004 (WA16291). Only one study included patients with a disease duration of ≥ 8 weeks and ≤ 4 years (Tak 2010 (IMAGE)).
All studies, except Tak 2010 (IMAGE), included patients receiving ongoing treatment with methotrexate at a dosage of 10 to 25 mg/week for at least 12 to 16 weeks prior to study enrolment. In Tak 2010 (IMAGE) all patients were methotrexate‐naive and 69% to 72% of the patients were DMARDs‐naive. Table 1 summarizes the inclusion and exclusion criteria for each trial and reported mean of previous DMARDs (range between 1.1 and 2.6), per cent of patients with prior anti‐TNF inhibitor treatment (range between 25% and 100%) and mean methotrexate dose per group (range between 12.5 and 17.5).
| Study | Arms | n | Age, mean + SD* | Females, % | Disease duration, mean years | Rheumatoid factor, mean IU/litre | Previous DMARDs, mean no | Prior anti‐TNFα treatment, % | MTX dose, mean mg/week |
| Cohen 2006 (REFLEX) | PBO + MTX | 209 | 52.8 ± 12.6 | 81 | 11.7 ± 7.7 | 317.4 ± 870.2 | 2.4 ± 1.8 | 90† | 16.7 ± 9.9 |
| RTX 2 (100 mg courses) + MTX | 308 | 52.2 ± 12.2 | 81 | 12.1 ± 8.3 | 324.3 ± 613.5 | 2.6 ± 1.8 | 92† | 16.4 ± 8.8 | |
| Edwards 2004 (WA16291) | PBO + MTX | 40 | 54 ± 11 | 80 | 11 ± 7 | ‐ | 2.6 ± 1.3 | ‐ | 12.5 to 15‡ |
| RTX 2 (100 mg courses) + MTX | 40 | 53 ± 10 | 75 | 12 ± 7 | ‐ | 2.5 ± 1.4 | ‐ | 12.5 to 15‡ | |
| RTX 2 (100 mg courses) | 40 | 54 ± 10 | 73 | 9 ± 6 | ‐ | 2.5 ± 1.6 | ‐ | 12.5 to 15‡ | |
| RTX 2 (100 mg courses) + CTX | 41 | 54 ± 12 | 83 | 10 ± 6 | ‐ | 2.6 ± 1.4 | ‐ | 12.5 to 15‡ | |
| Emery 2006 (DANCER) | PBO + MTX | 149 | 51.1 | 80 | 9.3 | 437 | 2.2 | 26 | 15.6 |
| RTX 2 (500 mg courses) + MTX | 124 | 51.4 | 83 | 11.1 | 421 | 2.5 | 33 | 16 | |
| RTX 2 (100 mg courses) + MTX | 192 | 51.1 | 80 | 10.8 | 437 | 2.5 | 28 | 14.9 | |
| Emery 2010 (SERENE) | PBO + MTX | 172 | 52.2 ± 12.4 | 85.5 | 7.5 ± 7.6 | 75.0% positive | 1.1 ± 1.1c | ‐ | 16.6 ± 4.3 |
| RTX 2 (500 mg courses) + MTX | 167 | 51.9 ± 12.9 | 79.6 | 7.1 ± 7.0 | 75.4% positive | 1.2 ± 1.3c | ‐ | 15.4 ± 4.0 | |
| RTX 2 (1000 mg courses) + MTX | 170 | 51.3 ± 12.6 | 81.2 | 6.6 ± 7.3 | 73.5% positive | 1.1 ± 1.1c | ‐ | 16.1 ± 4.3 | |
| Greenwald 2011 (TAME) | MTX + TNFi | 18 | 50.4 | 94 | 10.7 ± 7.5 | 178.6 ± 242.8 | ‐ | 100 | 17.5 ± 4.2 |
| RTX 2 (500 mg courses) + MTX + TNFi | 32 | 49.7 | 85 | 10.3 ± 6.7 | 341.9 ± 521.0 | ‐ | 97 | 16.1 ± 4.2 | |
| Owczarczyk 2008 | RTX | 20 | 55 ± 9 | ‐ | 12 ± 8 | 329 ± 724 | ‐ | 1.47 ± 1.17 | ‐ |
| RTX + MTX | 20 | 53 ± 12 | ‐ | 9 ± 9.6 | 479 ± 574 | ‐ | 0.45 ± 0.75 | ‐ | |
| Rubbert‐Roth 2010 (MIRROR) | RTX (500 mg courses) + MTX | 134 | 53.6 ± 12.8 | 82.1 | 9 + 7.4 | 235.5 ± 4.16 | 2.0 ± 1.5 | 27.6 | 15.2 ± 4.7 |
| RTX 2 (1000mg courses) + MTX | 93 | 51.3 ± 12.2 | 82.8 | 7.7 + 7.4 | 232.4 ± 366.1 | 1.8 ± 1.4 | 24.6 | 15.2 ± 4.7 | |
| Tak 2010 (IMAGE) | PBO + MTX | 249 | 48.1 ± 12.7 | 77 | 0.91 (1.1) | 87% positive | 70% DMARD‐naive | ‐ | ‐ |
| RTX 2 (500 mg courses) + MTX | 249 | 47.9 ± 13.4 | 82 | 0.99 (1.1) | 87% positive | 72% DMARD‐naive | ‐ | ‐ | |
| RTX 2 (1000 mg courses) + MTX | 250 | 47.9 ± 13.3 | 85 | 0.92 (1.3) | 85% positive | 69% DMARD‐naive | ‐ | ‐ |
*when reported
†Inadequate efficacy of anti‐TNF agents (%)
‡ Median dose per week
aPatients were followed 36 weeks in the group receiving rituximab plus MTX and 12 weeks in the group receiving MTX monotherapy
bAn upper age limit of 65 years was used because of known attenuation of vaccine response in older patients
cExcludes MTX
DMARD = Disease Modifying Anti‐Rheumatic Drug; mg = milligrams; MTX = methotrexate; PBO = placebo; RTX = rituximab.
Interventions
Table 1 lists the treatment groups per trial.
-
Seven trials included an arm of two courses of rituximab 1000 mg in addition to methotrexate (Cohen 2006 (REFLEX); Edwards 2004 (WA16291); Emery 2006 (DANCER); Emery 2010 (SERENE); Owczarczyk 2008; Rubbert‐Roth2010 (MIRROR); Tak 2010 (IMAGE).
-
One trial included a treatment group of rituximab in combination with an intravenous infusion of cyclophosphamide 750 mg on days 3 and 17 (Edwards 2004 (WA16291).
-
Two trials included one treatment arm where patients received rituximab alone (Edwards 2004 (WA16291); Owczarczyk 2008).
-
Five trials included an arm of two courses of rituximab 500 mg (Emery 2006 (DANCER); Emery 2010 (SERENE); Greenwald 2011 (TAME); Rubbert‐Roth2010 (MIRROR); Tak 2010 (IMAGE)).
-
Five trials included one control group (placebo plus methotrexate) (Cohen 2006 (REFLEX); Edwards 2004 (WA16291); Emery 2006 (DANCER); Emery 2010 (SERENE); Tak 2010 (IMAGE).
-
Greenwald 2011 (TAME) compared combined rituximab plus methotrexate plus TNF inhibitor (adalimumab or etanercept) with methotrexate plus TNF inhibitor.
The dosing schedule in all trials included one course of two intravenous injections applied on days 1 and 15. In four trials re‐treatment was permitted (Cohen 2006 (REFLEX); Edwards 2004 (WA16291); Emery 2010 (SERENE); Tak 2010 (IMAGE)). Rubbert‐Roth2010 (MIRROR) randomised patient to three rituximab re‐treatment regimes: i) two courses of 500 mg followed by two courses of 500 mg; ii) two courses of 500 mg followed by an increased dose (two 1000 mg doses); or iii) two courses of 1000 mg followed by two courses of 1000 mg. Data from this study were included only for the dose comparison of this review (rituximab 500 mg versus rituximab 1000 mg) at 24 weeks, before re‐treatment occurred.
In all trials administration of rituximab was accompanied with intravenous methylprednisolone (100 mg injected 30 min before each infusion). Concomitant treatment included folate (≥ 5 mg/wk), oral prednisone (60 mg on days 2 to 7; 30 mg on days 8 to 14; after that ≤ 10 mg/day), and NSAIDs in stable doses. In Emery 2006 (DANCER) each treatment group was divided into three subgroups: i) without glucocorticoids, ii) methylprednisolone 100 mg given intravenously 30 to 60 min before, iii) methylprednisolone 100 mg given intravenously + oral prednisone 60 mg on day 27 and 30 mg on days 8 to 14.
Outcomes
The major outcome measured in five trials was the proportion of patients meeting the ACR response criteria. Cohen 2006 (REFLEX), Emery 2006 (DANCER), Emery 2010 (SERENE), and Rubbert‐Roth2010 (MIRROR) defined the response as at least 20% improvement from baseline values in the individual ACR core set variables. Edwards 2004 (WA16291) used ACR 50 as the primary endpoint. Owczarczyk 2008 used the Disease Activity Score in 28 joints (DAS28) and Greenwald 2011 (TAME) the proportion of patients developing at least one serious infection. Only one study used radiographic changes as the primary endpoint (Tak 2010 (IMAGE)).
Minor outcomes included ACR 50, ACR 70, individual ACR criteria components, DAS28, EULAR responses, patient‐reported outcomes (health‐related quality of life, disability score, fatigue). To evaluate safety, studies included occurrence of adverse events, serious adverse events, presence of human anti‐chimeric antibodies, and discontinuations due to lack of efficacy, adverse events, other reasons (for example, withdrawal of consent, protocol violation), and death.
Duration
The duration of trials ranged from 24 weeks to 104 weeks (Edwards 2004 (WA16291); Tak 2010 (IMAGE)). Most trials reported the timing of the primary outcome at 24 weeks. Findings were reported at 12, 16, 24 to 36, 48 to 56, 72, and 104 weeks.
Funding
Seven trials were sponsored by Genetech, Hoffman‐La Roche, or Biogen Idec. One study did not disclose the source of funding (Owczarczyk 2008) but reported no conflict of interest.
Excluded studies
The Characteristics of excluded studies table and Figure 1 list the studies excluded. Twelve studies were excluded: four were excluded because they were non‐comparative studies (Assous 2008; Bokarewa 2007; Galarza 2008; Kavanaugh 2008 (ARISE)); one reported data only on pharmacokinetics (Ng 2005); one was an open‐label extension (Keystone 2007); one reported results after re‐treatment (both groups, control and intervention, were exposed to rituximab before randomisation) (Mease 2010 (SUNRISE)); one was a before and after study (Teng 2007); two studies were comparisons between patients who received one cycle versus patients who received two cycles of rituximab (Haraoui 2011 (RESET); Teng 2009); one study did not reported clinical outcomes (van den Bemt 2009); and one reported safety data but the follow‐up duration of the treatment groups was different and results could not be compared (Bingham 2010 (SIERRA)).
Risk of bias in included studies
The ratings for the risk of bias items for each included study are shown in Figure 2, and the ratings for each risk of bias item presented as percentages across all included studies are shown in Figure 3.
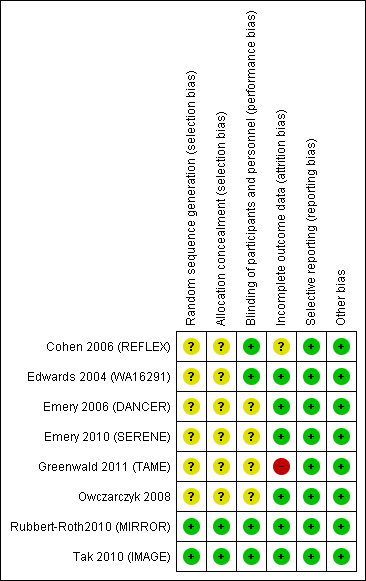
Risk of bias summary: review authors' judgements about each risk of bias item for each included study.

Risk of bias graph: review authors' judgements about each risk of bias item presented as percentages across all included studies.
Allocation
Seven studies were reported as randomised studies (Cohen 2006 (REFLEX); Edwards 2004 (WA16291); Emery 2006 (DANCER); Emery 2010 (SERENE); Greenwald 2011 (TAME); Rubbert‐Roth2010 (MIRROR); Tak 2010 (IMAGE)). However, five of these trials did not report their method of randomisation or allocation concealment in the published article and additional information was not available (Cohen 2006 (REFLEX); Edwards 2004 (WA16291); Emery 2006 (DANCER); Emery 2010 (SERENE); Greenwald 2011 (TAME)). Only two studies were judged to provide sufficient details on this item (Rubbert‐Roth2010 (MIRROR); Tak 2010 (IMAGE)). Sequence generation was through an interactive voice response system and the allocation was concealed for the sponsor, investigators, and patients until data analysis was performed.
Blinding
One trial was open‐label (Owczarczyk 2008). Three studies were reported as double‐blind trials with no further details reported (Emery 2006 (DANCER); Emery 2010 (SERENE); Greenwald 2011 (TAME)). In Cohen 2006 (REFLEX), Edwards 2004 (WA16291), Rubbert‐Roth2010 (MIRROR), and Tak 2010 (IMAGE) the method of blinding was not described but it was mentioned that patients, study sponsor, and investigators were unaware of the treatment assignment of each patient.
Incomplete outcome data
In Owczarczyk 2008 all analyses were based on the 40 patients originally enrolled. Cohen 2006 (REFLEX), Emery 2010 (SERENE), Greenwald 2011 (TAME), and Tak 2010 (IMAGE) performed a modified intention‐to‐treat (ITT) analysis; that is, only those participants who received at least one infusion of study medication were accounted for. Emery 2006 (DANCER) reported an ITT analysis only for categorical variables. Only two studies reported an ITT analysis (where all patients who were randomised were accounted for) for all outcome measures (Edwards 2004 (WA16291); Rubbert‐Roth2010 (MIRROR)).
Missing data were imputed using last observation carried forward (LOCF) in Edwards 2004 (WA16291). In three studies, for patients who withdrew prematurely from the study or who started rescue therapy missing categorical endpoints were imputed as non‐responders and continuous variables as the LOCF (Emery 2006 (DANCER); Emery 2010 (SERENE); Rubbert‐Roth2010 (MIRROR)). In Tak 2010 (IMAGE) missing data were imputed by linear extrapolation. In one study missing data were not imputed (Greenwald 2011 (TAME)).
Fewer patients in the placebo plus methotrexate group completed the studies compared to the rituximab arms. The most common reason for withdrawal in this group was lack of efficacy.
Selective reporting
All trials reported outcome measures as recommended by the Outcome Measures in Rheumatology (OMERACT) group (Tugwell 1992).
Other potential sources of bias
Seven studies were supported by the manufacturer of the drug. In some cases the authors of the publications were staff of the pharmaceutical company that provided funding. One study (Owczarczyk 2008) did not disclose the source of funding but no conflicts of interest were reported. There was no evidence of other biases that had the potential to affect the results in the clinical trials.
Effects of interventions
We included the following comparison groups: (i) rituximab monotherapy (two 1000 mg doses) versus methotrexate monotherapy; (ii) rituximab (two 500 mg doses) in combination with methotrexate versus methotrexate; (iii) rituximab (two 1000 mg doses) in combination with methotrexate versus methotrexate; (iv) rituximab (two 1000 mg doses) in combination with cyclophosphamide versus methotrexate; and (v) rituximab (two 500 mg courses) in combination with methotrexate and TNF inhibitor versus methotrexate in combination with TNF inhibitor. We have prioritised reporting of rituximab (two 1000 mg doses) in combination with methotrexate since this is the most commonly used combination and approved dose.
Eight trials with 2720 patients were included in this study; 119 patients from the Rubbert‐Roth2010 (MIRROR) who received rituximab (two 500 mg doses) and had a dose increase (two 1000 mg doses) were excluded from our analysis. Of the 2720 participants, 675 were randomised to rituximab (two 500 mg doses), 1075 to rituximab (two 1000 mg doses), 60 to rituximab monotherapy, 41 to rituximab + cyclophosphamide, 32 to rituximab plus TNF inhibitor, and 837 to control. Results for efficacy, withdrawals, and toxicity are shown separately.
A. Efficacy
See 'Types of outcomes' in methods section for description of measures presented below.
Rituximab (two 1000 mg doses) + methotrexate versus methotrexate
Five studies (1664 patients) compared rituximab (two 1000 mg doses) plus methotrexate to methotrexate alone (Cohen 2006 (REFLEX); Edwards 2004 (WA16291); Emery 2006 (DANCER); Emery 2010 (SERENE); Tak 2010 (IMAGE)).
ACR response
For rituximab (two 1000 mg doses) with methotrexate compared to methotrexate monotherapy, the RR for achieving an ACR 20 at 24 weeks was 2.2 (95% CI 1.9 to 2.7); 53% of those receiving combined rituximab and methotrexate achieved an ACR 20 response (compared to 23% of controls) with an absolute treatment benefit (ATB) of 30% (95% CI 25% to 35%) and a number needed to treat (NNT) of 4 people (95% CI 6 to 3). This statistically significant difference was also observed at 52 weeks but not at 104 weeks (Analysis 1.1).
ACR 50, 70, and 90 response rates were significantly improved with rituximab (two 1000 mg doses) when compared with control at 24, 48 to 56, and 104 weeks (Analysis 1.2; Analysis 1.3; Analysis 1.4).
The RR for achieving an ACR 50 with rituximab (two 1000 mg doses) in addition to methotrexate at 24 weeks was 3.3 (95% CI 2.3 to 4.6); 29% of those receiving rituximab plus methotrexate achieved an ACR 50 response compared to 9% of controls, with an ATB of 21% (95% CI 16% to 25%) and a NNT of 6 people (95% CI 9 to 4) (Figure 4; summary of findings Table for the main comparison).

Twenty‐nine out of every 100 rituximab plus methotrexate recipients experience a clinical improvement of 50% versus 9 methotrexate recipients.
The RR for achieving an ACR 70 with rituximab plus methotrexate at 24 weeks was 3.9 (95% CI 1.8 to 8.3); 14% of those in the rituximab plus methotrexate group achieved an ACR 70 response compared to 4% of controls, with an ATB of 11% (95% CI 6% to 15%) and a NNT of 10 people (95% CI 34 to 4).
Only one study reported ACR 90. The RR for achieving an ACR 90 with rituximab in addition to methotrexate at 52 weeks was 1.8 (95% CI 1.1 to 3.0); 16% of those in the rituximab plus methotrexate group achieved an ACR 90 response compared to 9% of controls, with an ATB of 7% (95% CI 1% to 13%) and a NNT of 14 people (95% CI 51 to 7).
Disease activity
A significant mean reduction from baseline in DAS28 scores between rituximab and the control group was observed at 24, 48 to 56, and 104 weeks (MD ‐1.2, 95% CI ‐1.5 to ‐0.92; MD ‐1.2, 95% CI ‐1.4 to ‐0.93; MD ‐1.6, 95% CI ‐1.8 to ‐1.4, respectively) (Analysis 1.5).
Compared to patients receiving methotrexate monotherapy, patients receiving rituximab plus methotrexate were significantly more likely to have a low DAS (DAS28 ≤ 3.2) at 24, 52, and 104 weeks or be in clinical remission (DAS28 ≤ 2.6) at 52 and 104 weeks (Analysis 1.6; Analysis 1.7). The RR for achieving clinical remission with rituximab (two 1000 mg doses) in addition to methotrexate at 52 weeks was 2.4 (95% CI 1.7 to 3.5); 22% of those in the rituximab plus methotrexate group achieved clinical remission compared to 11% of controls, with an ATB of 11% (95% CI 2% to 20%) and a NNT of 7 people (95% CI 13 to 4).
Patients in the rituximab group were more likely to have a moderate or good EULAR response than those patients in the control group at 24, 48, and 104 weeks (RR 1.9, 95% CI 1.6 to 2.4; RR 2.3, 95% CI 1.7 to 3.1; RR 2.1, 95% CI 1.6 to 2.6, respectively) (Analysis 1.8). At 24 weeks, 55% of those in the rituximab plus methotrexate group achieved a moderate or good EULAR response (compared to 27% of controls) with an ATB of 29% (95% CI 14% to 43%) and a NNT of 4 people (95% CI 7 to 3).
Patient‐reported outcomes
There was significant improvement noted in function scores with rituximab combined with methotrexate when compared with methotrexate monotherapy at 24, 48 to 52, and 104 weeks (MD ‐0.24, 95% CI ‐0.30 to ‐0.18; MD ‐0.29, 95% CI ‐0.38 to ‐0.20; MD ‐0.44, 95% CI ‐0.54 to ‐0.34, respectively) (Analysis 1.9). At 24 weeks, the pooled RR for clinically meaningful improvement in HAQ (> 0.22) was 1.6 (95% CI 1.2 to 2.1) with an ATB of 24% (95% CI 12% to 36%) and a NNT of 5 people (95% CI 13 to 3). At 104 weeks, the pooled RR for clinically meaningful improvement in HAQ (> 0.22) was 1.4 (95% CI 1.3 to 1.6) with an ATB of 24% (95% CI 16% to 31%) and a NNT of 5 people (95% CI 7 to 3). No statistically significant differences were found at 48 to 56 and 72 weeks (Analysis 1.10).
There was significant improvement in the physical component score of the quality of life measurement (SF‐36) with rituximab plus methotrexate when compared with methotrexate monotherapy at 24 to 52 weeks (MD ‐4.1, 95% CI ‐4.5 to ‐3.3) (Analysis 1.11). At 24 to 52 weeks, the pooled RR for clinically meaningful improvement in the physical component score (PCS) (SF‐36 PCS ≥ 5) was 2.0 (95% CI 1.1 to 3.4) with an ATB of 34% (95% CI 5% to 84%) and a NNT of 4 people (95% CI 83 to 3) (Analysis 1.12).
There was significant improvement in the mental component score (MCS) of the quality of life measurement (SF‐36) with rituximab plus methotrexate when compared with methotrexate monotherapy at 24 to 52 weeks (MD ‐2.22, 95% CI ‐3.52 to ‐0.92) (Analysis 1.13). At 24 to 52 weeks, the pooled RR for a clinically meaningful improvement in the mental component score (SF‐36 MCS ≥ 5) was 1.4 (95% CI 1.1 to 1.9) with an ATB of 13% (95% CI 7% to 18%) and a NNT of 8 people (95% CI 51 to 4) (Analysis 1.14).
There was a significant reduction in the fatigue score (FACIT‐F) with rituximab plus methotrexate when compared with methotrexate monotherapy at 24 to 52 weeks (MD ‐5.22, 95% CI ‐7.71 to ‐2.74) (Analysis 1.15). At 24 to 52 weeks, the pooled RR for clinically meaningful improvement in the fatigue score (FACIT ≥ 4) was 1.6 (95% CI 1.0 to 2.5) with an ATB of 24% (95% CI 6% to 41%) and a NNT of 4 people (95% CI 17 to 2) (Analysis 1.16). There was a statistically significant difference in the pain score reduction from baseline with rituximab plus methotrexate when compared with methotrexate monotherapy at 24 to 52 weeks (MD ‐13.89, 95% CI ‐21.31 to ‐6.48) (Analysis 1.17).
Radiographic scores
Two studies reported results on structural joint changes (Cohen 2006 (REFLEX); Tak 2010 (IMAGE)) using the Genant‐modified Sharp score (range 0 to 290) (Genant 1998). There was evidence of a statistically significant difference from baseline in the radiographic scores (total Sharp score (TSS), erosion score (ES), and joint space narrowing score (JSNS)) with rituximab plus methotrexate compared to methotrexate alone at 24, 52 to 56, and 104 weeks (Analysis 1.18; Analysis 1.19; Analysis 1.20). The RR for no radiographic progression at 24 weeks was 1.2 (95% CI 1.0 to 1.4); 70% of those on rituximab plus methotrexate had no radiographic progression compared to 59% of controls, with an ATB of 11% (95% CI 2% to 19%) and a NNT of 10 people (95% CI 57 to 5). Similar benefits were observed at 52 to 56 and 104 weeks (Analysis 1.21). The RR for no worsening of erosions at 52 weeks was 1.3 (95% CI 1.1 to 1.5); 70% of those on rituximab plus methotrexate achieved clinical remission compared to 51% of controls, with an ATB of 19% (95% CI 12% to 25%) and a NNT of 7 people (95% CI 22 to 4). Similar benefits were observed at 104 weeks (RR 1.5, 95% CI 1.3 to 1.7) but no statistically significant differences were observed at 24 weeks (Analysis 1.22).
Other comparisons
Rituximab (two 1000 mg doses) monotherapy versus methotrexate monotherapy
Only one study (80 patients) compared the use of rituximab monotherapy to methotrexate monotherapy (Edwards 2004 (WA16291)).
ACR response
At 24 weeks, ACR 20 response rates were significantly improved with 1000 mg of rituximab (on days 1 and 15) alone compared to methotrexate alone (RR 1.7, 95% CI 1.1 to 2.8) (Analysis 2.1), with an ATB of 28% (95% CI 6% to 49%) and a NNT of 4 people (95% CI 17 to 2).
Similarly, the RR for achieving an ACR 50 response at 24 weeks was 2.6 (95% CI 1.0 to 6.6); 33% of those in the rituximab alone group achieved an ACR 50 response compared to 13% of those in the methotrexate alone group (Analysis 2.2). These statistically significant differences disappeared at 48 weeks and 104 weeks. In addition, no statistically significant differences between groups were observed on the ACR 70 response rates at 24, 48, and 104 weeks (Analysis 2.3).
Disease activity
There was evidence of a significant reduction from baseline in the DAS28 at 24 weeks between rituximab alone and the methotrexate alone group (MD ‐0.90, 95% CI ‐1.47 to ‐0.33) (Analysis 2.4). Patients treated with rituximab alone (1000 mg on days 1 and 15) were also 1.7 times more likely to have a moderate or good EULAR response than those patients in the methotrexate alone group (RR 1.70, 95% CI 1.21 to 2.38) (Analysis 2.5).
Patient‐reported outcomes
For the functional scale, there was a statistically significant improvement noted in HAQ scores with rituximab alone compared to methotrexate alone. HAQ scores were statistically significantly better with rituximab alone, with a MD of ‐0.40 (95% CI ‐0.65 to ‐0.15) at 24 weeks, but the statistically significant difference disappeared at 48 and 72 weeks (Analysis 2.6). A clinically meaningful improvement in physical function was defined as decreases from baseline on the HAQ of at least 0.25. Patients on rituximab alone were more likely to achieve the minimal clinically important difference (MCID) in the HAQ Disability Index (HAQ‐DI) compared with patients receiving methotrexate at 24 weeks only (Analysis 2.7).
Rituximab (two 500 mg doses) + methotrexate versus methotrexate
Three studies (1082 patients) compared rituximab (two doses of 500 mg) plus methotrexate to methotrexate alone (Emery 2006 (DANCER); Emery 2010 (SERENE); Tak 2010 (IMAGE)).
ACR response
For rituximab (two 500 mg doses) plus methotrexate compared to methotrexate monotherapy, the RR for achieving an ACR 20 was 2.2 (95% CI 1.7 to 2.7) at 24 weeks; 55% of those in the rituximab group achieved an ACR 20 response compared to 25% of controls with an ATB of 30% (95% CI 22% to 37%) and a NNT of 4 people (95% CI 6 to 3) (Analysis 3.1).
For achieving an ACR 50, the RR was 2.7 at 24 weeks (95% CI 1.9 to 3.9); 29% achieved an ACR 50 compared to 10% of controls with an ATB of 18% (95% CI 12% to 25%) and a NNT of 6 people (95% CI 12 to 4). This statistically significant difference was maintained at 48 to 52 and 104 weeks (Analysis 3.2).
The RR for achieving an ACR 70 was 2.1 at 24 weeks (95% CI 1.1 to 3.8); 10% of those in the rituximab group achieved an ACR 70 response compared to 5% of controls with an ATB of 5% (95% CI 1% to 10%) and a NNT of 19 people (95% CI 143 to 8). At 104 weeks, patients in the rituximab (two 500 mg doses) plus methotrexate group were also more likely to achieve an ACR 70 response compared with patients in the methotrexate monotherapy group (RR 1.7, 95% CI 1.3 to 2.2) (Analysis 3.3).
The RR for achieving an ACR 90 was 2.2 at 52 weeks (95% CI 1.3 to 3.6) (Analysis 3.4).
Disease activity
There was a statistically significant reduction from baseline in the DAS28 in favour of rituximab in addition to methotrexate at 24, 52, and 104 weeks (MD ‐0.96, 95% CI ‐1.1 to ‐0.81; MD ‐0.99, 95% CI ‐1.2 to ‐0.77; MD ‐1.6; 95% CI ‐1.8 to ‐1.4, respectively) (Analysis 3.5). The RR for achieving low disease activity (DAS28 ≤ 3.2) at 24 weeks was 3.7 (95% CI 1.8 to 7.9) for combined rituximab (two 500 mg doses) plus methotrexate compared to methotrexate alone. Similar statistically significant differences were observed at 48 to 52 weeks and 104 weeks (Analysis 3.6). Clinical remission (DAS28 < 2.6) was more likely to be achieved by patients in the rituximab group compared to controls at 24, 52, and 104 weeks (RR 4.0, 95% CI 1.4 to 11.8; RR 2.0, 95% CI 1.4 to 3.0; RR 2.7, 95% CI 1.8 to 3.8, respectively) (Analysis 3.7).
The RR for a moderate or good EULAR response at 24 weeks was 1.9 (95% CI 1.6 to 2.2) (Analysis 3.8); 49% of those in the rituximab group achieved a moderate or good EULAR response compared to 27% of controls with an ATB of 23% (95% CI 17% to 28%) and a NNT of 5 people (95% CI 7 to 4). This statistically significant difference was also observed at 52 and 104 weeks (Analysis 3.8).
Patient‐reported outcomes
For rituximab plus methotrexate there was a significant improvement in function scores (HAQ) when compared with methotrexate monotherapy at 24, 52, and 104 weeks (MD ‐0.22, 95% CI ‐0.30 to ‐0.14; MD ‐0.28, 95% CI ‐0.37 to ‐0.18; MD ‐0.34, 95% CI ‐0.44 to ‐0.24, respectively) (Analysis 3.9). The RR for a clinically meaningful improvement in HAQ for rituximab plus methotrexate compared with methotrexate alone was 1.6 (95% CI 1.2 to 2.1) at 24 weeks. The ATB for HAQ ≥ 0.22 was 23% (95% CI 13% to 34%). The NNT in order to achieve a HAQ ≥ 0.22 was 5 people (95% CI 14 to 3). Similar statistically significant differences were observed at 52 and 104 weeks (Analysis 3.10).
There was a statistically significant reduction in the PCS of the quality of life measurement (SF‐36) in favour of rituximab in addition to methotrexate at 24 to 52 weeks (MD ‐3.5, 95% CI ‐4.5 to ‐2.6) (Analysis 3.11). The RR for a clinically meaningful improvement in SF‐36 PCS (≥ 5) for rituximab plus methotrexate compared with methotrexate alone was 1.8 (95% CI 1.2 to 2.8) at 24 weeks but this statistically significant difference was not observed at 52 weeks (Analysis 3.12).
There was a statistically significant reduction in the MCS of the quality of life measurement (SF‐36) in favour of rituximab in addition to methotrexate at 24 to 52 weeks (MD ‐1.8, 95% CI ‐3.3 to ‐0.36) (Analysis 3.13). However, the RR for a clinically meaningful improvement in SF‐36 MCS (≥ 6.33) was similar between groups (Analysis 3.14).
There was a statistically significant reduction in the fatigue score (FACIT‐F) in favour of rituximab in addition to methotrexate at 24 to 52 weeks (MD ‐3.1, 95% CI ‐4.4 to ‐1.8) (Analysis 3.15). The RR for a clinically meaningful improvement in FACIT‐F (MCID of ≥ 3.5) for rituximab plus methotrexate compared with methotrexate alone was 1.6 (95% CI 1.2 to 2.1) at 24 weeks (Analysis 3.16). In addition, there was a statistically significant reduction in the visual analogue scale of pain in favour of rituximab in addition to methotrexate at 24 to 52 weeks (MD ‐8.3, 95% CI ‐12.3 to ‐4.4) (Analysis 3.17).
Radiographic scores
For this comparison the only study that reported results for structural joint changes was the Tak 2010 (IMAGE) study. There was evidence of a statistically significant difference from baseline in the radiographic scores (TSS, ES and JSNS) between rituximab (two 500 mg doses) plus methotrexate compared to control only at 104 weeks (Analysis 3.18; Analysis 3.19; Analysis 3.20). Also, there were more patients in the rituximab plus methotrexate group with no radiographic progression or no worsening of erosion compared with the methotrexate monotherapy group at 24 weeks (RR 1.3, 95% CI 1.1 to 1.6; RR 1.4, 95% CI 1.1 to 1.7, respectively) (Analysis 3.21; Analysis 3.22).
Rituximab (two 1000 mg doses) + cyclophosphamide versus methotrexate
One study (80 patients) compared rituximab (two 1000 mg doses) plus cyclophosphamide (two 750 mg doses intravenously) with methotrexate (Edwards 2004 (WA16291)).
ACR response
For rituximab plus cyclophosphamide compared to methotrexate monotherapy, the RR for achieving an ACR 20 at 24 and 48 weeks was 2.0 (95% CI 1.3 to 3.1) and 2.4 (95% CI 1.2 to 4.9), respectively (Analysis 4.1). The RR for achieving an ACR 50 at 24 and 48 weeks was 3.3 (95% CI 1.4 to 8.1) and 4.9 (95% CI 1.1 to 20.9), respectively. The ACR 20 and ACR 50 at 104 weeks, and ACR 70 at 24, 48, and 104 weeks were not different between groups (Analysis 4.3).
Disease activity
A statistically significant reduction in DAS28 score from baseline (MD ‐1.30, 95% CI ‐1.89 to ‐0.71) favoured rituximab plus cyclophosphamide in comparison with methotrexate alone (Analysis 4.4). The RR for achieving a moderate or good EULAR response was 1.71 (95% CI 1.22 to 2.39) (Analysis 4.5); 85% on rituximab plus cyclophosphamide achieved a moderate or good response compared to 50% of controls with an ATB of 35% (95% CI 16% to 54%) and a NNT of 3 people (95% CI 6 to 2).
Patient‐reported outcomes
No statistically significant differences were found for functional scores (HAQ) and rates of clinically meaningful improvements in functional scores (HAQ ≤ 0.22) (Analysis 4.6; Analysis 4.7).
Rituximab + methotrexate + TNF inhibitor versus methotrexate + TNF inhibitor
One study (51 patients) compared rituximab (two 500 mg doses) plus methotrexate plus a TNF inhibitor (adalimumab or etanercept) to methotrexate plus TNF inhibitor (Greenwald 2011 (TAME)); 100% of the patients in the rituximab group had previously been exposed to TNF inhibitor (at least 12 weeks prior to study enrolment) compared to 97% of the patients in the control group. The mean duration of prior TNF inhibitor use was 2.1 years in the rituximab group versus 2.4 years in the control group.
ACR response
No statistically significant differences were noted in the ACR response rates (20 and 50) between patients receiving combined rituximab plus methotrexate plus a TNF inhibitor and methotrexate plus a TNF inhibitor (Analysis 5.1; Analysis 5.2).
Disease activity
No statistically significant differences were noted between groups in the rates of patients achieving low disease activity (DAS28 ≤ 3.2) or clinical remission (DAS28 < 2.6) (Analysis 5.3; Analysis 5.4).
Patient‐reported outcomes
Patients in the combined rituximab plus methotrexate plus TNF inhibitor group were more likely to achieve a clinically meaningful improvement in functional score (HAQ ≤ 0.22) compared with patients in the methotrexate plus TNF inhibitor group at 28 weeks (RR 3.8, 95% CI 1.6 to 9.2); 84% achieved a clinically meaningful improvement in functional score in the group with rituximab compared to 22% of controls with an ATB of 63% (95% CI 40% to 85%) and a NNT of 2 people (95% CI 3 to 1) (Analysis 5.5).
B. Safety
Study withdrawals
Withdrawals were reported as: total withdrawals, withdrawal because of lack of efficacy, withdrawal because of adverse events, and withdrawal because of other reasons.
Rituximab (two 1000 mg doses) + methotrexate versus methotrexate
Total withdrawals
Statistically significantly more people withdrew from the control group than from the rituximab group at 24, 48 to 52, 72, and 104 weeks (RR 0.40, 95% CI 0.32 to 0.50; RR 0.61, 95% CI 0.40 to 0.91; RR 0.48, 95% CI 0.28 to 0.82; RR 0.58, 95% CI 0.45 to 0.75, respectively). At 24 weeks, 28% withdrew from the control group and 12% withdrew from the combined rituximab group with an absolute risk difference (ARD) of ‐14% (95% CI ‐26% to ‐1%) and a number needed to harm (NNH) of 6 people (95% CI 6 to 8). At 48 to 52 weeks, 38% withdrew from the control group and 30% withdrew from the combined rituximab group with an ARD of ‐16% (95% CI ‐28% to ‐3%) and a NNH of 7 people (95% CI 5 to 30). At 72 weeks, 62% withdrew from the control group and 30% withdrew from the combined rituximab group with an ARD of ‐33% (95% CI ‐53% to ‐12%) and a NNH of 4 people (95% CI 3 to 9). At 104 weeks, 37% withdrew from the control group and 20% withdrew from the combined rituximab group with an ARD of ‐20% (95% CI ‐34% to ‐5%) and a NNH of 7 people (95% CI 5 to 11) (Analysis 6.1).
Lack of efficacy
Withdrawal rates were reduced in the rituximab group compared to the control group at 24, 48 to 52, and 104 weeks (RR 0.30, 95% CI 0.23 to 0.39; RR 0.15, 95% CI 0.06 to 0.36; RR 0.24, 95% CI 0.09 to 0.64, respectively) (Analysis 6.2).
Adverse events and other reasons
There was no evidence of a statistically significant difference in the rates of withdrawals because of adverse events or other reasons (that is, withdrawal of consent, violation, administrative, failure to return) in either group (Analysis 6.3; Analysis 6.4).
Other comparisons
Rituximab (two 1000 mg doses) monotherapy versus methotrexate monotherapy
Total withdrawals and adverse events
There were no statistically significant differences between groups in the rates of total withdrawals (Analysis 7.1) or withdrawals due to adverse events (Analysis 7.3).
Lack of efficacy
Withdrawals due to lack of efficacy were reduced in the rituximab monotherapy compared with the methotrexate monotherapy at 104 weeks (RR 0.29, 95% CI 0.12 to 0.72). No other statistically significant differences were observed at 24, 48, or 72 weeks (Analysis 7.2).
Other reasons
Patients in the rituximab group were twice as likely to discontinue treatment for other reasons (that is, withdrawal of consent, unknown reasons) compared to patients in the methotrexate group at 104 weeks (95% CI 1.2 to 3.3) (Analysis 7.3; Analysis 7.4).
Rituximab (two 500 mg doses) + methotrexate versus methotrexate
Total withdrawals
The total discontinuation rates were lower in the rituximab plus methotrexate group compared with the methotrexate monotherapy group at 24, 48 to 52, and 104 weeks (RR 0.30, 95% CI 0.18 to 0.50; RR 0.64, 95% CI 0.43 to 0.94; RR 0.51, 95% CI 0.36 to 0.73, respectively) (Analysis 8.1).
Lack of efficacy
Withdrawals rates were reduced in the rituximab group compared to the methotrexate controls at 24 and 48 to 52 weeks (RR 0.20, 95% CI 0.10 to 0.39; RR 0.37, 95% CI 0.19 to 0.73, respectively). At 24 weeks, 3% withdrew from the combined rituximab plus methotrexate group and 17% withdrew from the methotrexate monotherapy group with an ARD of ‐13% (95% CI ‐17% to ‐9%) and a NNH of 8 people (95% CI 7 to 10) (Analysis 8.2).
Adverse events and other reasons
There was no evidence of a statistically significant difference in the rates of withdrawals because of adverse events or other reasons (that is, withdrawal of consent, violation, administrative, failure to return) in either group (Analysis 8.4).
Rituximab (two 1000 mg doses) + cyclophosphamide versus methotrexate
Total withdrawals
There was no evidence of a statistically significant difference in the rates of total withdrawals between groups (Analysis 9.1).
Lack of efficacy
Statistically significantly more people withdrew from the methotrexate monotherapy group than from the combined rituximab plus cyclophosphamide group at 104 weeks (RR 0.23, 95% CI 0.08 to 0.62). By the second year, 43% had withdrawn from the monotherapy group and 10% had withdrawn from the combined group with an ARD of ‐33% (95% CI ‐51% to ‐15%) and a NNH of 4 people (95% CI 3 to 7) (Analysis 9.2).
Adverse events
There was no evidence of a statistically significant difference between groups in the rates of withdrawals due to adverse events (Analysis 9.3).
Other reasons
Withdrawals due to reasons other than lack of efficacy and adverse events (that is, withdrawal of consent, unknown reasons) were significantly increased in the combination group compared to the methotrexate alone group at 104 weeks (RR 1.9, 95% CI 1.1 to 3.1); 61% withdrew in the rituximab plus cyclophosphamide group compared to 33% of the methotrexate monotherapy group with an ARD of 28% (95% CI 8% to 49%) and a NNH of 4 people (95% CI 13 to 2) (Analysis 9.4).
Rituximab + methotrexate + TNF inhibitor versus methotrexate + TNF inhibitor
Total withdrawals and adverse events
There was no evidence of statistically significant differences between groups in the rates of total withdrawals or withdrawals because of adverse events (Analysis 10.1; Analysis 10.2).
Adverse events
Rituximab (two 1000 mg doses) + methotrexate versus methotrexate
A greater proportion of patients receiving combined rituximab plus methotrexate developed adverse events after their first infusion than those taking methotrexate monotherapy (RR 1.6, 95% CI 1.3 to 2.0); 28% of those taking rituximab plus methotrexate reported more events associated with their first infusion compared to 18% of controls with an ARD of 9% (95% CI 5% to 13%) and a NNH of 11 people (95% CI 21 to 8) (Analysis 11.16). Similarly, vascular disorders (as reported in Emery 2010 (SERENE); Tak 2010 (IMAGE)) plus hypertension events as reported in Edwards 2004 (WA16291) and Emery 2006 (DANCER) were more commonly reported in the combination group compared to the methotrexate monotherapy group (RR 1.54, 95% CI 1.00 to 2.38) (Analysis 11.29). In addition, at 24 weeks, there was a trend toward higher rates of hypertension in patients receiving combined rituximab plus methotrexate compared to patients receiving methotrexate monotherapy (RR 1.6, 95% CI 0.96 to 2.6) (Analysis 11.15). At two years, a trend toward higher rates of infections (serious or not) in patients receiving combined rituximab plus methotrexate compared to patients receiving methotrexate monotherapy was observed (RR 1.1, 95% CI 0.95 to 1.3) (Analysis 11.3). No other statistically significant differences were noted (Analysis 11.1; Analysis 11.2; Analysis 11.4; Analysis 11.5; Analysis 11.6; Analysis 11.7; Analysis 11.8; Analysis 11.9; Analysis 11.10; Analysis 11.11; Analysis 11.12; Analysis 11.13; Analysis 11.14; Analysis 11.17; Analysis 11.18; Analysis 11.19; Analysis 11.20; Analysis 11.21; Analysis 11.22; Analysis 11.23; Analysis 11.24; Analysis 11.25; Analysis 11.26; Analysis 11.27; Analysis 11.28).
Other comparisons
Rituximab (two 1000 mg doses) monotherapy versus methotrexate monotherapy
There was no evidence of statistically significant differences in the rates of adverse events between groups (Analysis 12.1; Analysis 12.2; Analysis 12.3; Analysis 12.4; Analysis 12.5; Analysis 12.6; Analysis 12.7; Analysis 12.9; Analysis 12.11; Analysis 12.12; Analysis 12.13; Analysis 12.14; Analysis 12.15) except for cough and disease exacerbation at 24 weeks (Analysis 12.8; Analysis 12.10). Patients in the rituximab monotherapy group had greater odds of increased cough compared with patients in the methotrexate monotherapy group (Peto OR 8.22, 95% CI 1.36 to 49.69). Exacerbation of rheumatoid arthritis was decreased in the rituximab monotherapy group compared with the methotrexate monotherapy group (RR 0.38, 95% CI 0.16 to 0.86).
Rituximab (two 500 mg doses) + methotrexate versus methotrexate
A greater proportion of patients in the combined rituximab 500 mg plus methotrexate group developed infusion‐related reactions during the second infusion of their first course compared with patients in the methotrexate monotherapy group at 24 weeks (RR 1.51, 95% CI 1.10 to 2.09) (Analysis 13.16). No other statistically significant differences in the rates of adverse events were observed between groups (Analysis 13.1; Analysis 13.2; Analysis 13.3; Analysis 13.4; Analysis 13.5; Analysis 13.6; Analysis 13.7; Analysis 13.8; Analysis 13.9; Analysis 13.10; Analysis 13.11; Analysis 13.12; Analysis 13.13; Analysis 13.14; Analysis 13.15; Analysis 13.17; Analysis 13.18; Analysis 13.19; Analysis 13.20; Analysis 13.21; Analysis 13.22; Analysis 13.23; Analysis 13.24; Analysis 13.25; Analysis 13.26).
Rituximab (two 1000 mg doses) + cyclophosphamide versus methotrexate
No statistically significant differences in the rates of adverse events were observed between groups (Analysis 14.1; Analysis 14.2; Analysis 14.3; Analysis 14.4; Analysis 14.5; Analysis 14.6; Analysis 14.7; Analysis 14.8; Analysis 14.9; Analysis 14.10; Analysis 14.11; Analysis 14.12; Analysis 14.13; Analysis 14.14; Analysis 14.15; Analysis 14.16).
Rituximab + methotrexate + TNF inhibitor versus methotrexate + TNF inhibitor
No statistically significant differences in the rates of adverse events were observed between groups (Analysis 15.1; Analysis 15.2; Analysis 15.3; Analysis 15.4; Analysis 15.5; Analysis 15.6; Analysis 15.7; Analysis 15.8; Analysis 15.9; Analysis 15.10; Analysis 15.11; Analysis 15.12; Analysis 15.13; Analysis 15.14; Analysis 15.15; Analysis 15.16; Analysis 15.17; Analysis 15.18; Analysis 15.19; Analysis 15.20; Analysis 15.21; Analysis 15.22; Analysis 15.23; Analysis 15.24; Analysis 15.25; Analysis 15.26; Analysis 15.27).
C. Subgroup and sensitivity analyses
Subgroup and sensitivity analyses were performed comparing rituximab 1000 mg plus methotrexate versus methotrexate at 24 to 52 weeks for ACR 50 responses on disease duration (≤ 4 years versus > 4 years), previous treatment (methotrexate‐naive versus DMARDs failure versus DMARD and TNF inhibitor failure), and study quality (low versus high risk of bias). In addition, we conducted subgroup analyses to compare different dosages (500 mg versus 1000 mg), use of concomitant treatment (methotrexate versus cyclophosphamide), and RF or anti‐CCP (positive versus negative).
Disease duration
Five studies (1664) patients) were used for this comparison (Cohen 2006 (REFLEX); Edwards 2004 (WA16291); Emery 2006 (DANCER); Emery 2010 (SERENE); Tak 2010 (IMAGE)). Only one study included participants with a disease duration of ≤ four years (Tak 2010 (IMAGE)). The RR for achieving an ACR 50 response was greater for patients with longer disease duration (> 4 years) compared with patients at ≤ 4 years of being diagnosed (RR 3.4, 95% CI 2.5 to 4.6; RR 1.6; 95% CI 1.3 to 1.8, respectively) (Analysis 16.1). For those patients with longer disease duration, 29% of those in the rituximab plus methotrexate groups achieved an ACR 50 response compared to 9% of controls; while for those patients with shorter disease duration 65% of those in the rituximab plus methotrexate groups achieved an ACR 50 response compared to 42% of controls.
Previous treatment
We grouped the studies (1664 patients) according to whether enrolled patients were methotrexate‐naive (Tak 2010 (IMAGE)), had an inadequate response to methotrexate or other traditional DMARDs without prior exposure to TNF inhibitors (Edwards 2004 (WA16291); Emery 2010 (SERENE)), or had failed TNF inhibitors (Cohen 2006 (REFLEX); Emery 2006 (DANCER); Greenwald 2011 (TAME); Owczarczyk 2008; Rubbert‐Roth2010 (MIRROR)). A greater RR for the ACR 50 was observed in the studies including patients with prior exposure to TNF inhibitors and traditional DMARDs or failure with traditional DMARDs compared to the studies including only methotrexate‐naive patients (RR 1.6, 95% CI 1.3 to 1.8; RR 2.9; 95% CI 1.9 to 4.6; RR 3.8, 95% CI 2.5 to 5.7, respectively) (Analysis 17.1).
Study quality
Two studies (579 patients) were judged to have a lower risk of bias (Edwards 2004 (WA16291); Tak 2010 (IMAGE)) and three studies (1085 patients) did not report on at least three domains of the risk of bias tool (Cohen 2006 (REFLEX); Emery 2006 (DANCER); Emery 2010 (SERENE)). From the ACR 50 responses, the RRs were 2.0 (95% CI 0.96 to 4.26) and 3.27 (95% CI 2.1 to 5.1) for the low versus high risk studies, respectively.
Dosage
Four trials (1308 patients) provided data for this comparison (Emery 2006 (DANCER); Emery 2010 (SERENE); Rubbert‐Roth2010 (MIRROR); Tak 2010 (IMAGE)). The effect of the use of two rituximab 500 mg doses was directly compared with two rituximab 1000 mg doses. No statistically significant differences were observed for ACR responses and numerous other outcomes (Analysis 19.1; Analysis 19.2; Analysis 19.3; Analysis 19.4; Analysis 19.5; Analysis 19.6; Analysis 19.7; Analysis 19.8; Analysis 19.9; Analysis 19.10; Analysis 19.11; Analysis 19.13; Analysis 19.15; Analysis 19.17; Analysis 19.19; Analysis 19.21; Analysis 19.22; Analysis 19.23; Analysis 19.24; Analysis 19.25; Analysis 19.26; Analysis 19.28; Analysis 19.29; Analysis 19.30; Analysis 19.31; Analysis 19.32; Analysis 19.33; Analysis 19.34; Analysis 19.35; Analysis 19.36; Analysis 19.37; Analysis 19.38; Analysis 19.39; Analysis 19.41; Analysis 19.42; Analysis 19.44; Analysis 19.45; Analysis 19.46; Analysis 19.47; Analysis 19.48; Analysis 19.49; Analysis 19.50). However, at 24 to 48 weeks, a greater proportion of patients on rituximab 1000 mg achieved a clinically meaningful improvement in the fatigue score (FACIT‐F ≥ 3.5) compared with the patients on rituximab 500 mg (RR 1.2, 95% CI 1.0 to 1.4) with an ATB of 11% (95% CI 2% to 20%) and a NNT of 9 people (95% CI 50 to 5) (Analysis 19.16). Also, although not statistically significant, higher rates were observed with the rituximab 1000 mg dose compared with the 500 mg dose in the clinically meaningful improvements in the physical and mental component scores of the quality of life measure (SF‐36 ≤ 5) (Analysis 19.12; Analysis 19.14). There was a significant reduction from baseline in the total radiographic score for those who received rituximab 1000 mg plus methotrexate (mean score ‐0.41) compared to those who received rituximab 500 mg plus methotrexate (mean score ‐0.76) at 104 weeks (MD 0.35, 95% CI 0.01 to 0.69) (Analysis 19.18). The difference from baseline in the erosion scores was also statistically significantly less in those who received the combination of rituximab 1000 mg and methotrexate (mean score ‐0.11) compared to those who received combined rituximab 500 mg plus methotrexate (mean score ‐0.18) at 104 weeks (MD 0.27, 95% CI 0.04 to 0.50) (Analysis 19.20). Rates of total adverse events were similar in patients receiving combined rituximab 1000 mg plus methotrexate compared to patients receiving rituximab 500 mg plus methotrexate at 24, 48 to 52, and 104 weeks (RR 1.0, 95% CI 0.95 to 1.1; RR 1.0, 95% CI 0.95 to 1.1; RR 1.1, 95% CI 0.97 to 1.1, respectively) (Analysis 19.27). Higher rates of adverse events after the first infusion of rituximab were observed in patients receiving 1000 mg compared with patients receiving 500 mg with borderline significance at 24 weeks (RR 1.4, 95% CI 1.0 to 1.8) (Analysis 19.40). Similarly, a non‐significant tendency toward higher rates of adverse events was observed in patients receiving a third course of 1000 mg rituximab compared to patients receiving 500 mg at 52 weeks (RR 4.5, 95% CI 0.98 to 20.6) (Analysis 19.43).
Concomitant treatment
Data were retrieved from one study (81 patients) (Edwards 2004 (WA16291)). The use of methotrexate as a concomitant treatment versus using cyclophosphamide with rituximab 1000 mg was evaluated. No statistically significant differences were observed in ACR responses or DAS (Analysis 20.1; Analysis 20.2; Analysis 20.3Analysis 20.4; Analysis 20.5). However, for rituximab (two 1000 mg doses) combined with cyclophosphamide there was a significant improvement in functional scores (HAQ) when compared with combined rituximab plus methotrexate at 72 and 104 weeks (MD 0.30, 95% CI 0.01 to 0.59; MD 0.50; 95% CI 0.15 to 0.85, respectively); no statistically significant differences were observed at 24 weeks (Analysis 20.6). Patients in the combined rituximab plus cyclophosphamide group were less likely to achieve a clinically meaningful improvement in functional score (HAQ ≤ 0.22) compared with patients in the rituximab plus methotrexate group at 48 weeks (RR 0.56, 95% CI 0.35 to 0.90). Only 38% achieved a clinically meaningful improvement in functional score compared to 68% of patients receiving rituximab plus methotrexate with an ARD of 30% (95% CI 52% to 8%). No statistically significant differences were observed at 24, 72, and 104 weeks (Analysis 20.7). Statistically significantly more people withdrew from the combined rituximab plus cyclophosphamide group than from the combined rituximab plus methotrexate group at 104 weeks (RR 1.4, 95% CI 1.0 to 2.0). By the second year, 78% from the rituximab plus cyclophosphamide group had withdrawn and 55% had withdrawn from the combined rituximab plus methotrexate group with an ARD of 23% (95% CI 3% to 43%) and a NNH of 4 people (95% CI 33 to 2) Analysis 20.8). No statistically significant differences were observed in safety outcomes (Analysis 20.9; Analysis 20.10; Analysis 20.11; Analysis 20.12; Analysis 20.13; Analysis 20.14; Analysis 20.15; Analysis 20.16; Analysis 20.17; Analysis 20.18; Analysis 20.19; Analysis 20.20; Analysis 20.21; Analysis 20.22; Analysis 20.23; Analysis 20.24; Analysis 20.25; Analysis 20.26; Analysis 20.27).
We also compared rituximab combined with either methotrexate or cyclophosphamide versus rituximab monotherapy (no concomitant treatment). Data were retrieved from one study (121 patients) (Edwards 2004 (WA16291)). The ACR 20 response rates were significantly improved with rituximab 1000 mg combined with methotrexate compared to rituximab monotherapy at 48 and 104 weeks (RR 2.0, 95% CI 1.2 to 3.3; RR 4.3, 95% CI 1.3 to 14.1, respectively) (Analysis 21.1). The pooled RR for achieving an ACR 50 with rituximab 1000 mg plus methotrexate compared with rituximab monotherapy at 48 weeks was RR 2.3 (95% CI 1.0 to 5.5) (Analysis 21.2). There was a statistically significant reduction in the DAS28 in favour of combined rituximab 1000 mg and methotrexate compared to rituximab monotherapy at 24 weeks (MD ‐1.1, 95% CI ‐1.8 to ‐0.36) (Analysis 21.4). The RR for achieving a moderate or good EULAR response at 104 weeks was 3.3 (95% CI 1.2 to 9.1) (Analysis 21.5); 33% of those in the rituximab combined with methotrexate group achieved a moderate or good EULAR response compared to 10% of patients receiving rituximab alone, with an ATB of 23% (95% CI 5% to 40%) and a NNT of 5 people (95% CI 84 to 2). There was a higher percentage of patients achieving a clinically meaningful improvement in physical function (HAQ ≤ 0.22) in the rituximab combined with methotrexate group compared with the rituximab monotherapy group only at 48 weeks (RR 1.63, 95% CI 1.02 to 2.60) (Analysis 21.7). The ATB was 26% (95% CI 4 to 49) with a NNT of 4 people (95% CI 250 to 2). Significantly more people withdrew from the rituximab monotherapy group than from the combined rituximab 1000 mg plus methotrexate group at 48 to 52, 72, and 104 weeks (RR 0.22, 95% CI 0.05 to 0.96; RR 0.52, 95% CI 0.30 to 0.90; RR 0.61, 95% CI 0.45 to 0.82, respectively). By the second year, 90% from the control group had withdrawn and 55% had withdrawn from the combined rituximab plus methotrexate group with an ARD of ‐35% (95% CI ‐53% to ‐17%) and a NNH of 3 people (95% CI 3 to 7) (Analysis 21.8). No other statistically significant differences were noted (Analysis 21.3; Analysis 21.6; Analysis 21.9; Analysis 21.10; Analysis 21.11; Analysis 21.12; Analysis 21.13; Analysis 21.14; Analysis 21.15; Analysis 21.16; Analysis 21.17; Analysis 21.18; Analysis 21.19; Analysis 21.20; Analysis 21.21; Analysis 21.22; Analysis 21.23; Analysis 21.24; Analysis 21.25; Analysis 21.26; Analysis 21.27).
No statistically significant differences were noted between patients receiving combined rituximab plus cyclophosphamide and rituximab monotherapy (Analysis 22.1; Analysis 22.2; Analysis 22.3; Analysis 22.4; Analysis 22.5Analysis 22.6; Analysis 22.7; Analysis 22.8; Analysis 22.9; Analysis 22.10; Analysis 22.11; Analysis 22.12; Analysis 22.13; Analysis 22.14; Analysis 22.15; Analysis 22.16; Analysis 22.17; Analysis 22.18; Analysis 22.19; Analysis 22.20; Analysis 22.21; Analysis 22.22; Analysis 22.23; Analysis 22.24; Analysis 22.25; Analysis 22.26).
Anti‐CCP and rheumatoid factor (RF)
Four studies provided data on whether RF or anti‐CCP status predicted the response to treatment (Cohen 2006 (REFLEX); Emery 2006 (DANCER); Owczarczyk 2008; Tak 2010 (IMAGE). However, data could not be pooled because the numbers were not reported for all groups for the same outcomes. Owczarczyk 2008 did not find a statistically significant difference in the DAS28 at week 24 between patients with RF positive and RF negative disease (1.57 versus 1.55, respectively). In Cohen 2006 (REFLEX) fewer RF negative patients achieved an ACR20 response at week 24 compared with RF positive patients. Rates in the placebo group were 12% for RF negative patients versus 19% for the RF positive patients, and in the rituximab group rates were 41% versus 54%, respectively. The differences observed in the ACR 20 response rates between groups were statistically significant for both subgroups (RF positive P value < 0.0001; RF negative P value < 0.0009) and no statistically significant interaction was found between ACR 20 response and baseline RF status (P = 0.9). Emery 2006 (DANCER) observed a mean decrease in RF levels in the active rituximab groups ranging from 11.5% to 47.9% and a mean increase in RF levels in the placebo groups ranging from 7.1% to 37.4%. The ACR 20 improved in the RF positive subgroup treated with rituximab 1000 mg compared to methotrexate (RR 1.9, 95% CI 1.4 to 2.7). However, when analyses were performed in both subpopulations (RF positive and RF negative) 52% of the rituximab (two 1000 mg doses) group achieved an ACR 20 response at week 24 compared with 32% of the methotrexate group. In an exploratory analysis including only RF negative patients the ACR 20 response at 24 weeks was achieved by 48% in the rituximab group versus 52% in the methotrexate group. Tak 2010 (IMAGE) also reported higher ACR 50 responses and no radiographic progression rates for RF and anti‐CCP positive patients compared with RF and anti‐CCP negative patients. The OR of no radiographic progression for patients on rituximab 1000 mg plus methotrexate compared to methotrexate alone in the RF or anti‐CCP positive subpopulation was 2.2 (95% CI 1.5 to 3.2) and for the RF or anti‐CCP negative subpopulation the OR was 1.8 (95% CI 0.56 to 6.0).
Publication bias
Publication bias was assessed using a funnel plot of the ACR 50 response for the comparison of combined rituximab 1000 mg plus methotrexate versus methotrexate alone at 24 to 104 weeks (Analysis 1.2). Figure 5 shows the resulting funnel plot. Only five trials were included in the assessment and no clear symmetry could be observed in the plot. Five trials (Cohen 2006 (REFLEX); Edwards 2004 (WA16291); Emery 2006 (DANCER); Emery 2010 (SERENE); Tak 2010 (IMAGE)) including a total of 1664 patients were included in this review. Although the funnel plot shape may suggest the presence of publication bias, a detailed or quantitative evaluation was not possible due to the small number of studies.

Funnel plot of comparison: 1 Benefits ‐ RTX (2*1000 mg) + MTX versus MTX, outcome: 1.2 ACR 50.
Discusión
Resumen de los resultados principales
La finalidad de esta revisión sistemática fue evaluar la eficacia y la toxicidad del rituximab para el tratamiento de los pacientes con artritis reumatoide (AR). Hay pruebas para sugerir que el rituximab (500 mg o 1000 mg) en combinación con metotrexato es más efectivo que el metotrexato solo para el tratamiento de la AR (Resumen de los hallazgos para la comparación principal). El rituximab más metotrexato mostró una diferencia estadísticamente significativa en comparación con los controles para la mayoría de las medidas de resultado (Resumen de los hallazgos para la comparación principal). Con respecto a las otras comparaciones también evaluadas en esta revisión, sólo un estudio comparó la monoterapia con rituximab versus monoterapia con metotrexato y las tasas de respuesta del ACR 50 fueron mayores para la monoterapia con rituximab a las 24 semanas. Excepto por el rituximab en combinación con ciclofosfamida, el número total de retiros y los retiros debido a la falta de eficacia fueron mayores en los grupos de control, lo cual apoya al efecto beneficioso del rituximab. Dos ensayos evaluaron la progresión radiológica y se observaron diferencias estadísticamente significativas entre el rituximab y el control (a favor del rituximab). En términos generales, a corto plazo, la revisión no encontró ningún efecto adverso significativo diferente de las tasas de reacciones a la infusión, los eventos vasculares incluida la hipertensión y la tos, que aumentaron con rituximab en comparación con el grupo de control. Se necesitan más estudios para evaluar la seguridad a largo plazo. A partir de los análisis de subgrupos, se observaron mejores respuestas en el ACR 50 para los pacientes que recibieron tratamiento combinado (1000 mg); en los participantes con una respuesta inadecuada a los inhibidores del FNT y los FARME tradicionales en comparación con los pacientes que no habían recibido metotrexato, los que recibieron metotrexato como tratamiento concomitante en comparación con los que recibieron ciclofosfamida o ningún tratamiento concomitante (monoterapia con rituximab) y los pacientes con FR o anti‐CCP positivo en comparación con los pacientes seronegativos. Aunque también se observaron mejores respuestas en el ACR 50 para los pacientes que recibieron rituximab más metotrexato en los pacientes con enfermedades tardías versus tempranas, los riesgos absolutos sugieren que el CR podría ser mayor en los pacientes con enfermedades tardías debido a que las respuestas del control fueron mucho menores. A partir del análisis de sensibilidad, no hubo pruebas claras para apoyar que dos dosis de 1000 mg de rituximab fueron más efectivas que dos dosis de 500 mg.
Compleción y aplicabilidad general de las pruebas
Ocho ensayos abordaron el uso del rituximab para la AR. Algunas de las características de los pacientes incluidos en estos ensayos pueden no ser típicas de los pacientes observados en la práctica clínica diaria, como el estado alto de actividad de la enfermedad. Sólo un ensayo incluyó a pacientes con enfermedades tempranas. Los participantes en la mayoría de los estudios incluidos presentaron AR moderada a grave de al menos nueve años de duración y pocas comorbilidades graves. En todos los estudios se excluyó a los pacientes con afectación sistémica significativa o clase funcional IV.
Todos los ensayos incluyeron la dosificación estándar recomendada de rituximab (dos dosis de 1000 mg) por ciclo. Cuatro ensayos también evaluaron una dosificación inferior (500 mg) en combinación con metotrexato, que también resultó efectivo en comparación con la monoterapia con metotrexato. Para establecer la eficacia a corto plazo se evaluaron los resultados apropiados basados en las recomendaciones de OMERACT. Sin embargo, los datos para establecer la eficacia y seguridad a largo plazo sólo se encuentraron en un estudio. Se necesitan más estudios para evaluar la eficacia y la seguridad a largo plazo.
Los tamaños del efecto para las respuestas del ACR que se observaron en la revisión son similares a los observados en otras revisiones de diferentes FARME biológicos. Las tasas de respuesta del ACR 50 mostraron mejorías estadísticamente significativas con abatacept, adalimumab, etanercept, golimumab y tocilizumab más tratamiento con FARME en comparación con un FARME entre los seis y los 24 meses, con tasas de respuesta similares (Lethaby 2013; Maxwell 2009; Navarro‐Sarabia 2005; Singh 2010; Singh 2010a). Un metanálisis de redes de todos los productos biológicos que incluyó sólo tres de los ensayos del rituximab en este informe no encontró ninguna diferencia estadísticamente significativa entre el rituximab y otros agentes biológicos.
Calidad de la evidencia
El nivel de las pruebas varió de bajo a alto. Mediante el uso del sistema GRADE, para la mayoría de los resultados el nivel de las pruebas se consideró moderado. La calidad de las pruebas se disminuyó debido a las limitaciones de los estudios (ver Resumen de los hallazgos para la comparación principal). Hay poco riesgo de sesgo debido a la información selectiva en estos ensayos. Para esta revisión, se asumió que las definiciones proporcionadas para los eventos adversos graves fueron lo bastante similares como para justificar su combinación. Sólo dos de los estudios describieron el método para la generación de la secuencia o la ocultación de la asignación aunque se cree que es probable que hubiera una ocultación adecuada de la asignación en los ensayos sin información detallada sobre este ítem debido a que todos los ensayos fueron patrocinados y controlados por una compañía farmacéutica y normalmente se espera que estas empresas utilicen un sistema central de asignación al azar. Tres ensayos no proporcionaron descripciones detalladas de los métodos de cegamiento usados. Debido a que el resultado establecido en todos los ensayos fue una medida subjetiva (criterios de mejoría compuestos del ACR) el método de cegamiento de los participantes y los asesores es imperativo para asegurar que no haya ningún sesgo sistemático que comprometa los resultados de los estudios. Los cálculos del efecto se derivaron de los datos proporcionados por entre uno y cinco estudios, por lo tanto no puede descartarse la posibilidad de riesgo de sesgo de publicación y los resultados deben interpretarse con cuidado.
Sesgos potenciales en el proceso de revisión
Todos los análisis se realizaron según el Manual Cochrane de Revisiones Sistemáticas de Intervenciones (Cochrane Handbook for Systematic Reviews of Interventions) (Higgins 2011). Siete ensayos no aportaron detalles suficientes para evaluar de forma adecuada el riesgo de sesgo para dos o tres resultados, y tampoco se proporcionaron algunas medidas de la varianza necesarias para el metanálisis. Para evitar la exclusión de estos ensayos, en algunos casos se calcularon los datos faltantes con valores aproximados derivados del ensayo o, cuando este procedimiento no fue posible, a partir de los resultados de los otros ensayos. Este hecho podría haber creado algún sesgo aunque el impacto general sobre la estimación de las diferencias estadísticamente significativas entre los grupos es probablemente pequeño.
Cuatro de los estudios permitieron un nuevo tratamiento con rituximab aunque sólo uno de estos estudios cambió a los pacientes inicialmente asignados al placebo al grupo de rituximab. La exclusión de este estudio del análisis no cambió la magnitud ni la dirección de los resultados principales. Se decidió usar estos datos debido a que los pacientes anteriormente no habían sido tratados con rituximab. Sin embargo, hay pruebas de que el nuevo tratamiento con rituximab puede ser efectivo. Un estudio piloto abierto evaluó a nueve pacientes con AR que respondieron de forma insuficiente a los inhibidores del FNT. Los pacientes fueron tratados anteriormente con rituximab (dos dosis de 1000 mg) al menos 24 semanas antes de la inclusión. Los pacientes fueron tratados nuevamente con rituximab (una dosis de 1000 mg) cuando la puntuación DAS28 fue de ≥ 2,6 y se realizó su seguimiento durante hasta 48 semanas con evaluaciones bimestrales de la puntuación DAS28; y las radiografías de las manos y los pies a las 48 semanas se compararon con el valor inicial mediante el uso del método de calificación de Sharp/van der Heijde. La media de la DAS28 durante las 48 semanas de seguimiento alcanzó la remisión clínica y el cambio medio en la puntuación radiográfica después de un año fue de ‐1,5 ± 2,8 sin progresión del daño estructural después del primer nuevo tratamiento (Boumas 2009).
Acuerdos y desacuerdos con otros estudios o revisiones
Los resultados concuerdan con otros estudios (Bagust 2009; Bredemeier 2013; Hernandez‐Cruz 2011; Isaacs 2013; Lee 2011; Maneiro 2013; Moots 2012; Orme 2012; Salliot 2009; Schoels 2012; Shetty 2013; Singh 2009; Volkmann 2010). Un resumen de las revisiones de los otros productos biológicos ha demostrado la eficacia clínica del rituximab en los pacientes con AR (Singh 2009). Otra revisión de los productos biológicos para el tratamiento de la AR resumió y analizó la eficacia del rituximab y otros productos biológicos con un método estadístico diferente aunque tuvo resultados similares (Venkateshan 2009). Salliot 2009 realizó un metanálisis de ECA para investigar el riesgo de infecciones graves con rituximab, anakinra y abatacept para la AR. Singh 2011 realizó un metanálisis de redes para evaluar los eventos adversos de los productos biológicos usados en los trastornos autoinmunitarios. La inclusión de otros trastornos además de la AR no modificó los hallazgos informados por otros estudios. Las tasas de eventos adversos totales, los retiros debido a los eventos adversos, las infecciones graves y los eventos adversos graves en los pacientes asignados a la combinación de rituximab de 1000 mg más metotrexato no fueron estadística y significativamente diferentes del metotrexato solo (Singh 2011). Al igual que esta revisión, no encontraron ningún aumento estadísticamente significativo del riesgo de infecciones graves con la administración de rituximab. Todas estas revisiones sistemáticas sólo han incluido tres de los ocho ensayos incluidos en esta revisión (Cohen 2006 (REFLEX); Edwards 2004 (WA16291); Emery 2006 (DANCER)), y algunos usaron diferentes enfoques estadísticos; sin embargo, no se observaron diferencias importantes en la interpretación de los resultados y las conclusiones. Además, el estudio SUNDIAL II, un estudio abierto y no comparativo que no estuvo incluido en esta revisión, examinó la administración de rituximab con otro FARME biológico (etanercept, adalimumab, infliximab, o abatacept) y halló que la tasa de eventos adversos graves en los pacientes tratados con esta combinación fue de 9,1% (16/176) después de 24 semanas (Rigby 2013). Finalmente, Hernandez‐Cruz 2011 también evaluó la eficacia del rituximab en un metanálisis en el que el método preferido para el agrupamiento de los cálculos fueron los OR. El estudio incluyó resultados para seis medidas de resultados de eficacia y cuatro de seguridad con cálculos del tratamiento que reflejan los hallazgos para los mismos resultados. Además, el estudio incluyó un subanálisis por dosis (500 mg y 1000 mg) y el uso de tratamiento concomitante (combinación versus monoterapia). Sin embargo, ninguno de estos estudios presentó un análisis detallado de seis comparaciones diferentes y cuatro análisis de subgrupos como en la presente revisión. Con respecto a los análisis de subgrupos, los datos de la Swiss Clinical Quality Management in RA (SCQM‐RA)(Finckh 2010) observaron resultados similares a este estudio, los cual sugiere que los pacientes con respuestas inadecuadas a los inhibidores del FNT pueden beneficiarse con el cambio al rituximab en comparación con el cambio a un tratamiento alternativo. En el SCQM‐RA, la reducción observada de las puntuaciones de la DAS28 fue de ‐1,3 para los pacientes que recibieron rituximab (dos dosis de 1000 mg) en comparación con los pacientes que recibieron un inhibidor del FNT (IC del 95%: ‐1,5 a ‐1,2). Este resultado puede variar basado en el tipo de inhibidor del FNT usado de acuerdo a un análisis reciente del Stockholm Tumor Necrosis Factor‐α Follow‐up Registry (STURE) (Chatzidionysiou 2013). Después del cambio a rituximab, las puntuaciones de la DAS28 a los seis meses fueron significativamente inferiores para los pacientes que tuvieron una respuesta inadecuada al etanercept en comparación con los pacientes con una respuesta inadecuada a los anticuerpos monoclonales (p = 0,01).

Flow diagram of included studies.
aStudy reported results on cycle 1 and cycle 2 (re‐treatment)
bRe‐treatment was permitted at 24 weeks for patients not responding at least 20%

Risk of bias summary: review authors' judgements about each risk of bias item for each included study.

Risk of bias graph: review authors' judgements about each risk of bias item presented as percentages across all included studies.

Twenty‐nine out of every 100 rituximab plus methotrexate recipients experience a clinical improvement of 50% versus 9 methotrexate recipients.

Funnel plot of comparison: 1 Benefits ‐ RTX (2*1000 mg) + MTX versus MTX, outcome: 1.2 ACR 50.
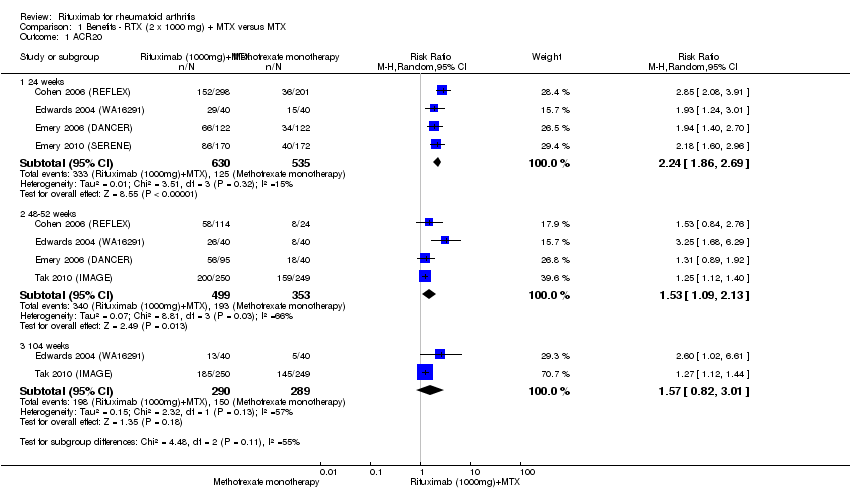
Comparison 1 Benefits ‐ RTX (2 x 1000 mg) + MTX versus MTX, Outcome 1 ACR20.
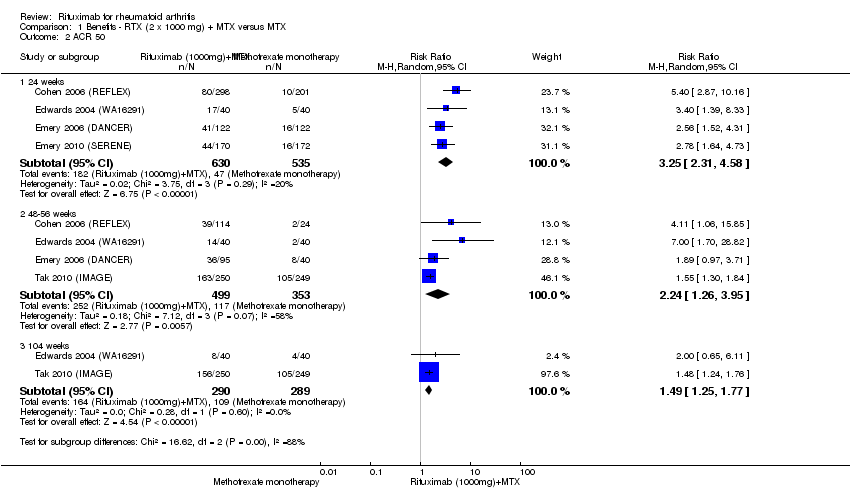
Comparison 1 Benefits ‐ RTX (2 x 1000 mg) + MTX versus MTX, Outcome 2 ACR 50.

Comparison 1 Benefits ‐ RTX (2 x 1000 mg) + MTX versus MTX, Outcome 3 ACR 70.
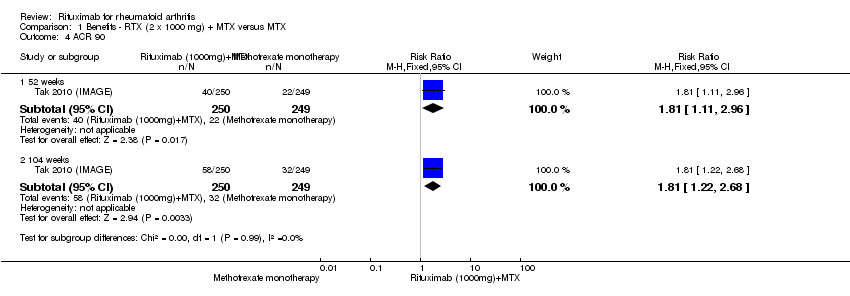
Comparison 1 Benefits ‐ RTX (2 x 1000 mg) + MTX versus MTX, Outcome 4 ACR 90.
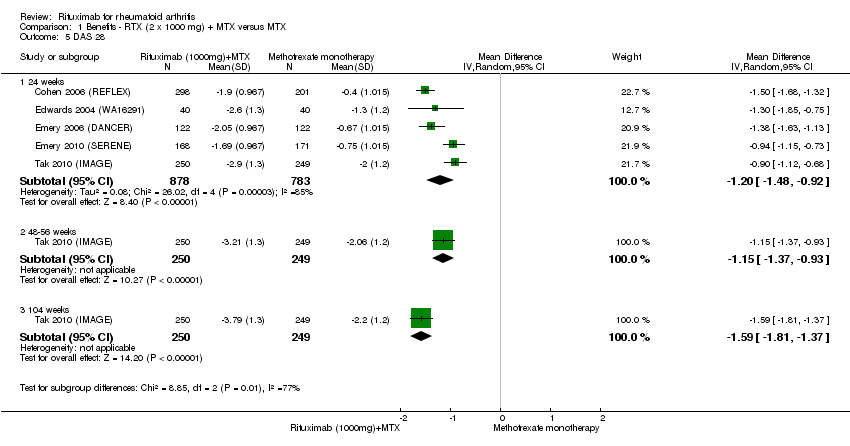
Comparison 1 Benefits ‐ RTX (2 x 1000 mg) + MTX versus MTX, Outcome 5 DAS 28.

Comparison 1 Benefits ‐ RTX (2 x 1000 mg) + MTX versus MTX, Outcome 6 LDA (DAS28 =or<3.2).
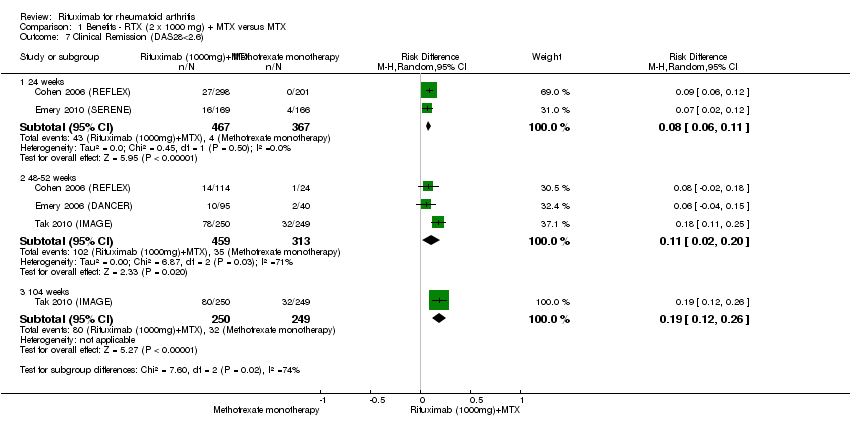
Comparison 1 Benefits ‐ RTX (2 x 1000 mg) + MTX versus MTX, Outcome 7 Clinical Remission (DAS28<2.6).
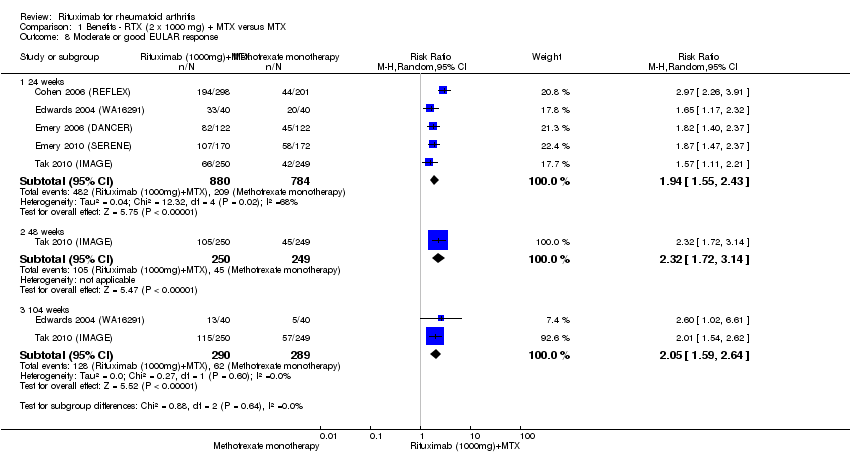
Comparison 1 Benefits ‐ RTX (2 x 1000 mg) + MTX versus MTX, Outcome 8 Moderate or good EULAR response.
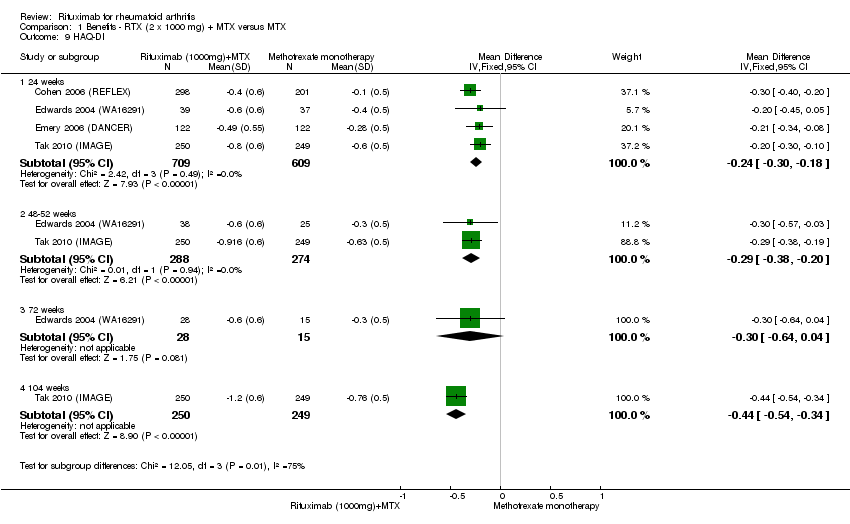
Comparison 1 Benefits ‐ RTX (2 x 1000 mg) + MTX versus MTX, Outcome 9 HAQ‐DI.
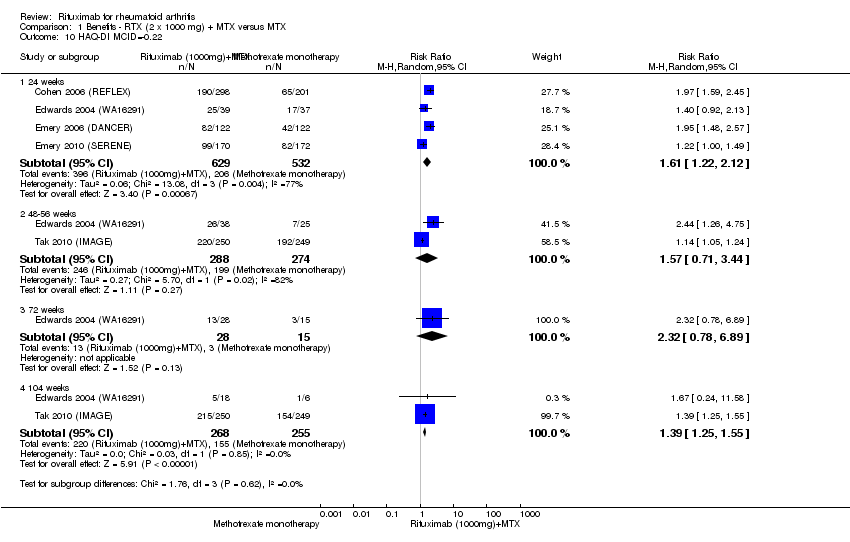
Comparison 1 Benefits ‐ RTX (2 x 1000 mg) + MTX versus MTX, Outcome 10 HAQ‐DI MCID=‐0.22.

Comparison 1 Benefits ‐ RTX (2 x 1000 mg) + MTX versus MTX, Outcome 11 SF‐36 PCS.

Comparison 1 Benefits ‐ RTX (2 x 1000 mg) + MTX versus MTX, Outcome 12 SF‐36 PCS (=or>MCID of 5 or 5.42).
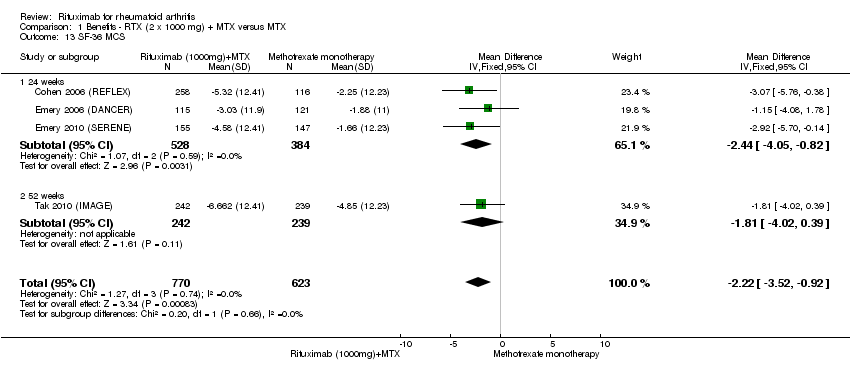
Comparison 1 Benefits ‐ RTX (2 x 1000 mg) + MTX versus MTX, Outcome 13 SF‐36 MCS.

Comparison 1 Benefits ‐ RTX (2 x 1000 mg) + MTX versus MTX, Outcome 14 SF‐36 MCS (=or>MCID of 5 or 6.33).

Comparison 1 Benefits ‐ RTX (2 x 1000 mg) + MTX versus MTX, Outcome 15 FACIT‐F.

Comparison 1 Benefits ‐ RTX (2 x 1000 mg) + MTX versus MTX, Outcome 16 FACIT‐F MCID>= 4or 3.56.

Comparison 1 Benefits ‐ RTX (2 x 1000 mg) + MTX versus MTX, Outcome 17 VAS‐pain.
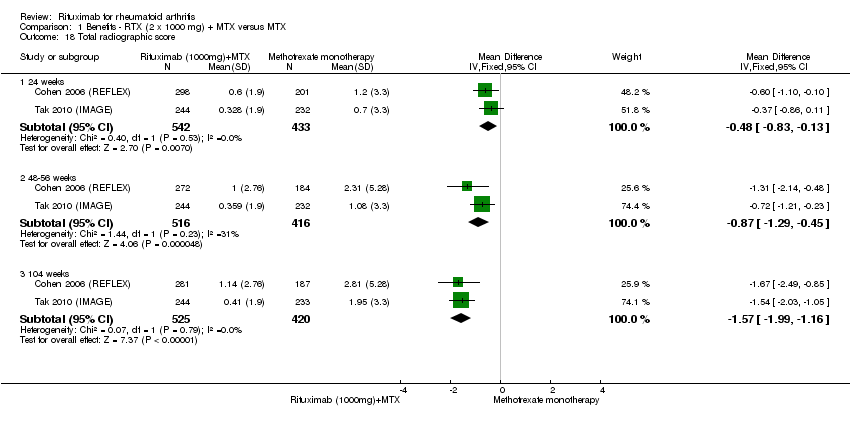
Comparison 1 Benefits ‐ RTX (2 x 1000 mg) + MTX versus MTX, Outcome 18 Total radiographic score.

Comparison 1 Benefits ‐ RTX (2 x 1000 mg) + MTX versus MTX, Outcome 19 Joint Space Narrowing.

Comparison 1 Benefits ‐ RTX (2 x 1000 mg) + MTX versus MTX, Outcome 20 Radiologic erosions.

Comparison 1 Benefits ‐ RTX (2 x 1000 mg) + MTX versus MTX, Outcome 21 No radiographic progression.

Comparison 1 Benefits ‐ RTX (2 x 1000 mg) + MTX versus MTX, Outcome 22 No worsening of erosions.
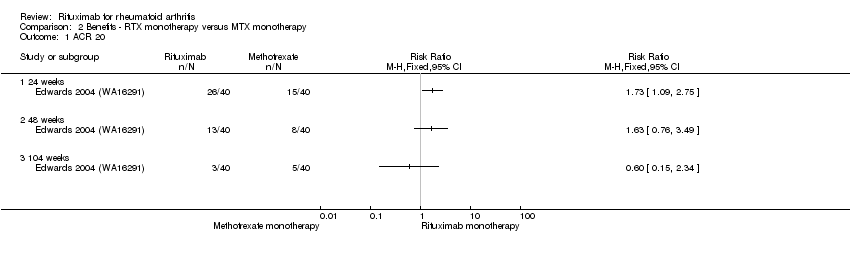
Comparison 2 Benefits ‐ RTX monotherapy versus MTX monotherapy, Outcome 1 ACR 20.

Comparison 2 Benefits ‐ RTX monotherapy versus MTX monotherapy, Outcome 2 ACR 50.
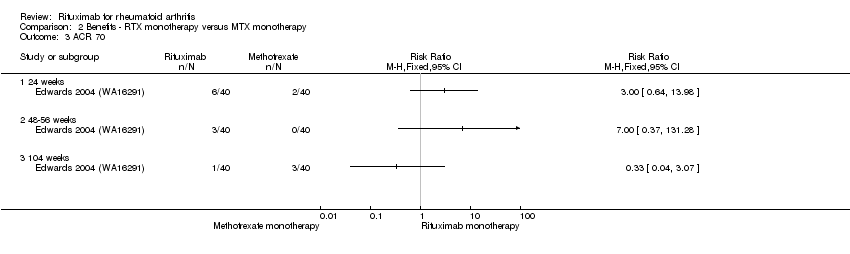
Comparison 2 Benefits ‐ RTX monotherapy versus MTX monotherapy, Outcome 3 ACR 70.
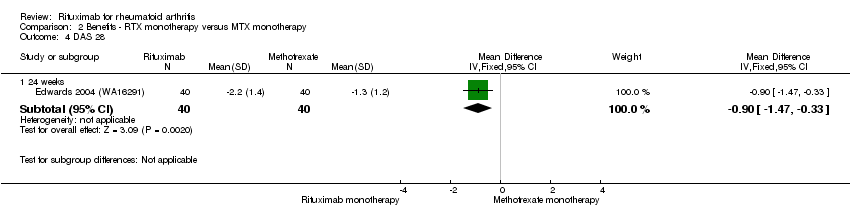
Comparison 2 Benefits ‐ RTX monotherapy versus MTX monotherapy, Outcome 4 DAS 28.

Comparison 2 Benefits ‐ RTX monotherapy versus MTX monotherapy, Outcome 5 Moderate or good EULAR response.

Comparison 2 Benefits ‐ RTX monotherapy versus MTX monotherapy, Outcome 6 HAQ‐DI.
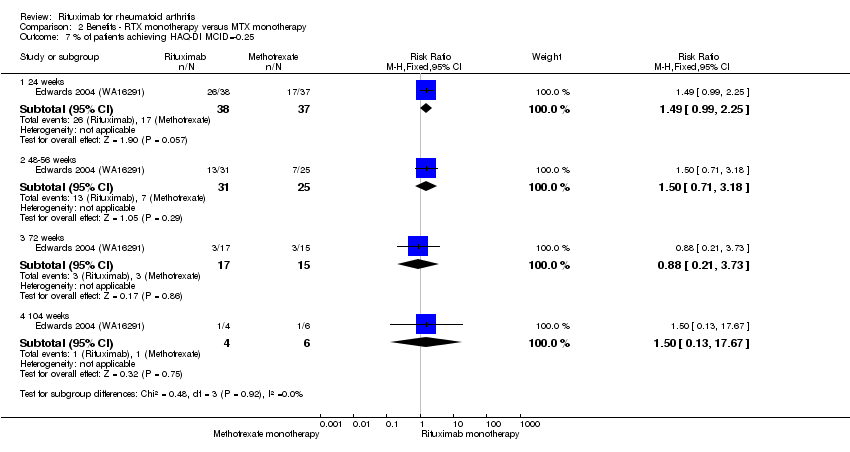
Comparison 2 Benefits ‐ RTX monotherapy versus MTX monotherapy, Outcome 7 % of patients achieving HAQ‐DI MCID=‐0.25.

Comparison 3 Benefits ‐ RTX (2 x 500 mg) + MTX versus MTX, Outcome 1 ACR 20.

Comparison 3 Benefits ‐ RTX (2 x 500 mg) + MTX versus MTX, Outcome 2 ACR 50.
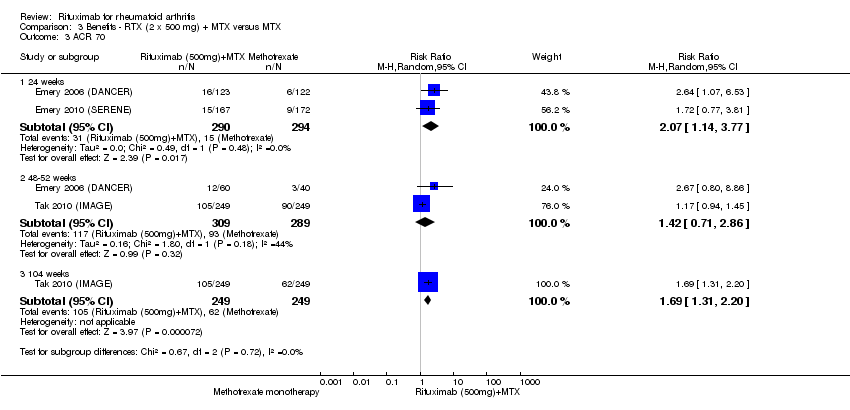
Comparison 3 Benefits ‐ RTX (2 x 500 mg) + MTX versus MTX, Outcome 3 ACR 70.

Comparison 3 Benefits ‐ RTX (2 x 500 mg) + MTX versus MTX, Outcome 4 ACR 90.
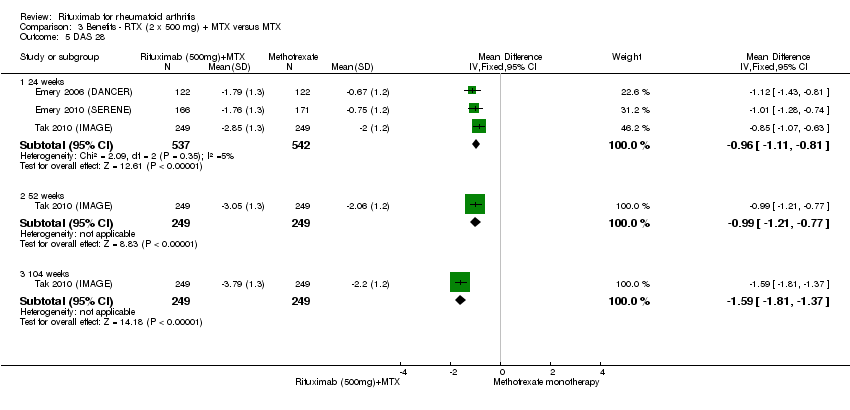
Comparison 3 Benefits ‐ RTX (2 x 500 mg) + MTX versus MTX, Outcome 5 DAS 28.
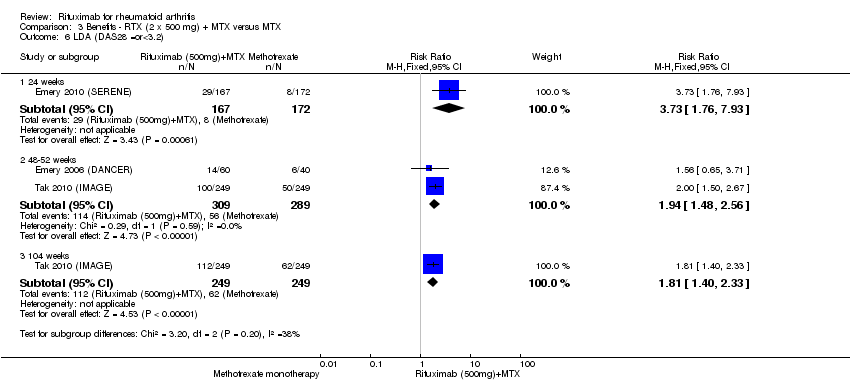
Comparison 3 Benefits ‐ RTX (2 x 500 mg) + MTX versus MTX, Outcome 6 LDA (DAS28 =or<3.2).
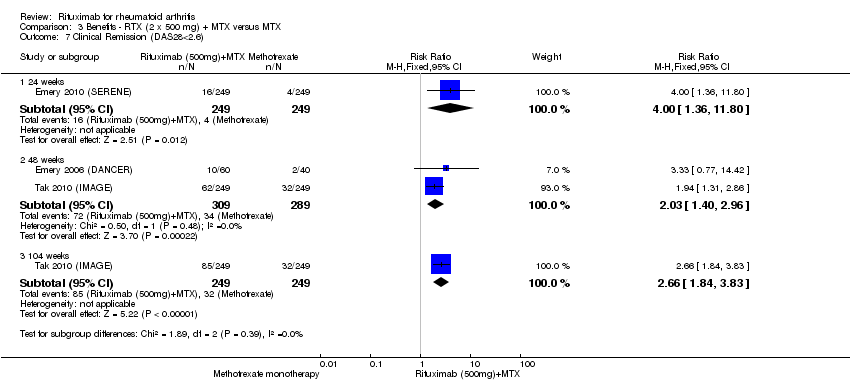
Comparison 3 Benefits ‐ RTX (2 x 500 mg) + MTX versus MTX, Outcome 7 Clinical Remission (DAS28<2.6).

Comparison 3 Benefits ‐ RTX (2 x 500 mg) + MTX versus MTX, Outcome 8 Moderate or good EULAR response.

Comparison 3 Benefits ‐ RTX (2 x 500 mg) + MTX versus MTX, Outcome 9 HAQ‐DI.

Comparison 3 Benefits ‐ RTX (2 x 500 mg) + MTX versus MTX, Outcome 10 HAQ‐DI MCID=‐0.22.
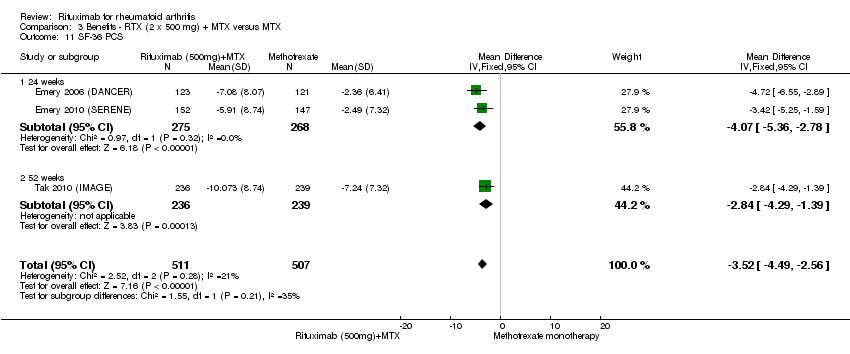
Comparison 3 Benefits ‐ RTX (2 x 500 mg) + MTX versus MTX, Outcome 11 SF‐36 PCS.
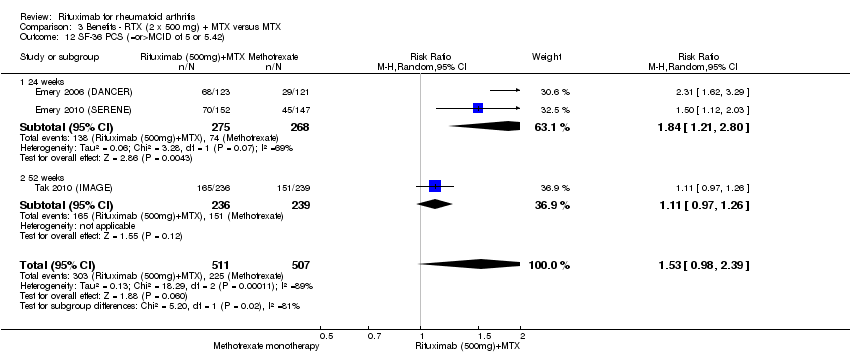
Comparison 3 Benefits ‐ RTX (2 x 500 mg) + MTX versus MTX, Outcome 12 SF‐36 PCS (=or>MCID of 5 or 5.42).

Comparison 3 Benefits ‐ RTX (2 x 500 mg) + MTX versus MTX, Outcome 13 SF‐36 MCS.
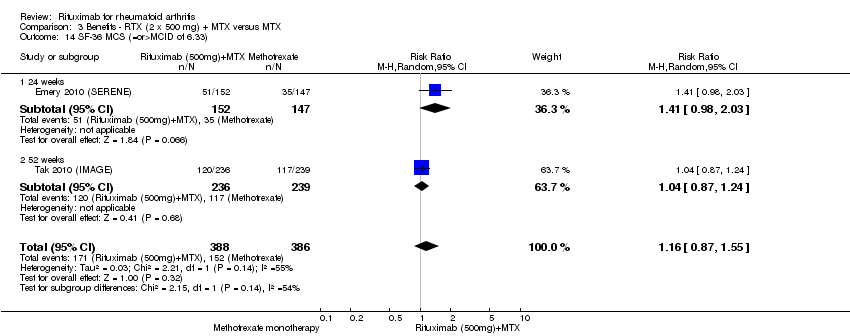
Comparison 3 Benefits ‐ RTX (2 x 500 mg) + MTX versus MTX, Outcome 14 SF‐36 MCS (=or>MCID of 6.33).
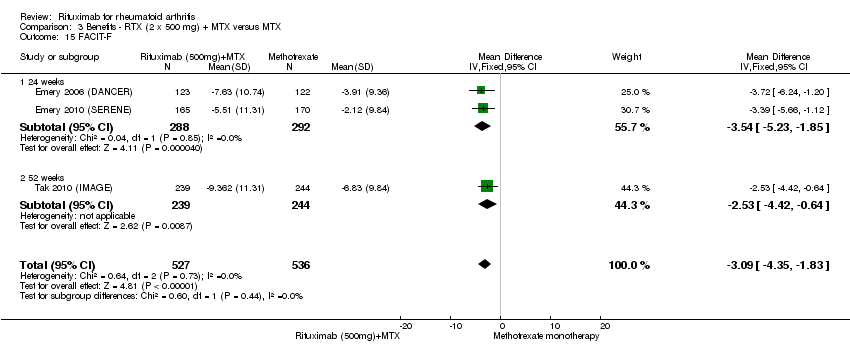
Comparison 3 Benefits ‐ RTX (2 x 500 mg) + MTX versus MTX, Outcome 15 FACIT‐F.

Comparison 3 Benefits ‐ RTX (2 x 500 mg) + MTX versus MTX, Outcome 16 FACIT‐F (= or > MCID of 3.5 or 4).

Comparison 3 Benefits ‐ RTX (2 x 500 mg) + MTX versus MTX, Outcome 17 VAS pain.
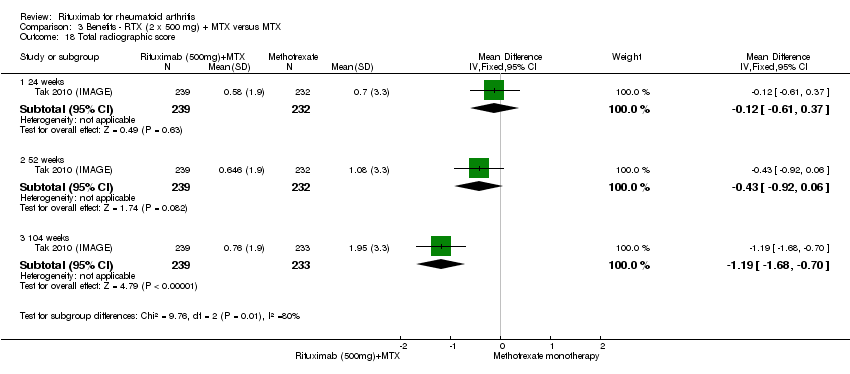
Comparison 3 Benefits ‐ RTX (2 x 500 mg) + MTX versus MTX, Outcome 18 Total radiographic score.
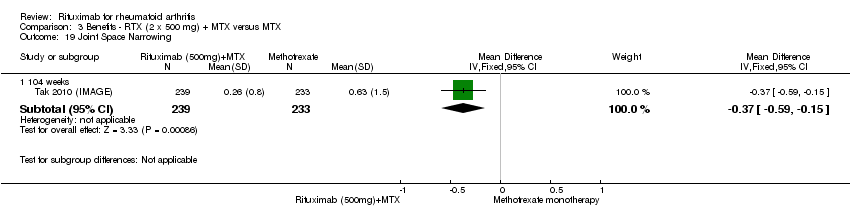
Comparison 3 Benefits ‐ RTX (2 x 500 mg) + MTX versus MTX, Outcome 19 Joint Space Narrowing.

Comparison 3 Benefits ‐ RTX (2 x 500 mg) + MTX versus MTX, Outcome 20 Radiologic erosions.

Comparison 3 Benefits ‐ RTX (2 x 500 mg) + MTX versus MTX, Outcome 21 No radiographic progression.
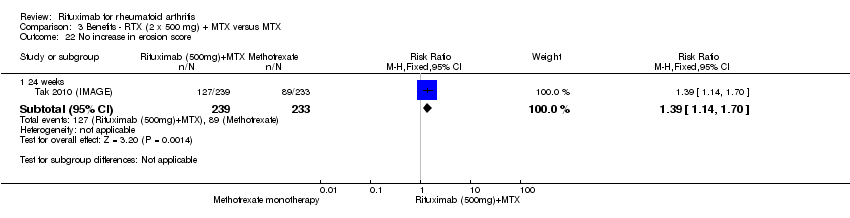
Comparison 3 Benefits ‐ RTX (2 x 500 mg) + MTX versus MTX, Outcome 22 No increase in erosion score.
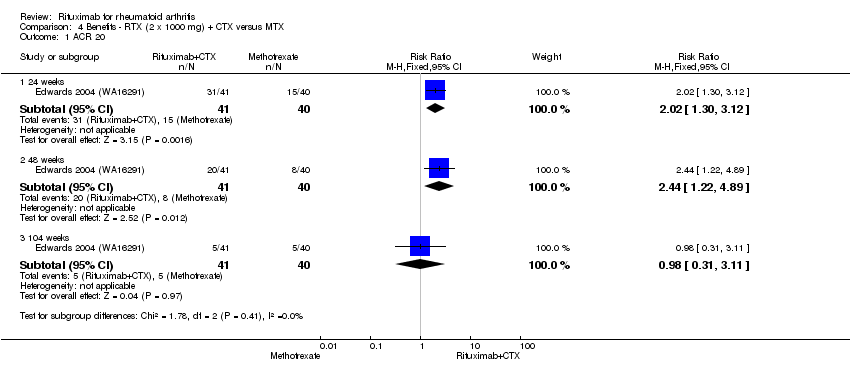
Comparison 4 Benefits ‐ RTX (2 x 1000 mg) + CTX versus MTX, Outcome 1 ACR 20.

Comparison 4 Benefits ‐ RTX (2 x 1000 mg) + CTX versus MTX, Outcome 2 ACR 50.
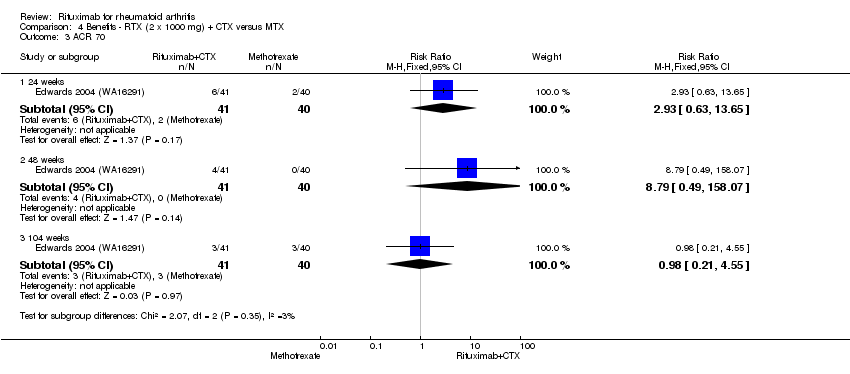
Comparison 4 Benefits ‐ RTX (2 x 1000 mg) + CTX versus MTX, Outcome 3 ACR 70.

Comparison 4 Benefits ‐ RTX (2 x 1000 mg) + CTX versus MTX, Outcome 4 DAS 28.

Comparison 4 Benefits ‐ RTX (2 x 1000 mg) + CTX versus MTX, Outcome 5 Moderate or good EULAR response.
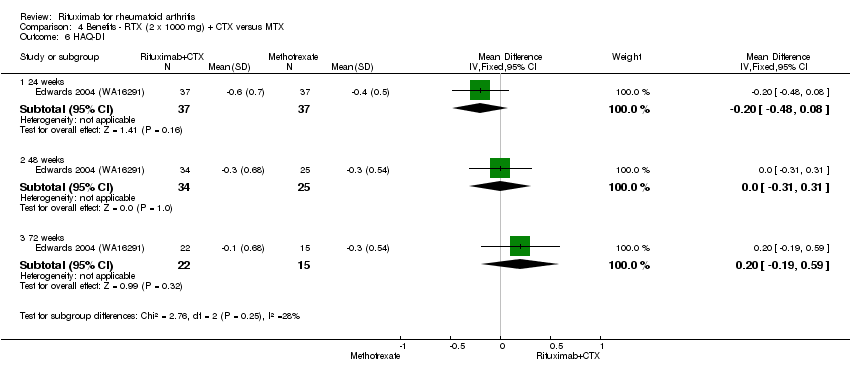
Comparison 4 Benefits ‐ RTX (2 x 1000 mg) + CTX versus MTX, Outcome 6 HAQ‐DI.

Comparison 4 Benefits ‐ RTX (2 x 1000 mg) + CTX versus MTX, Outcome 7 HAQ‐DI MCID=‐0.22.

Comparison 5 Benefits ‐ RTX (2 x 500 mg) + MTX + TNFi versus MTX + TNFi, Outcome 1 ACR 20.

Comparison 5 Benefits ‐ RTX (2 x 500 mg) + MTX + TNFi versus MTX + TNFi, Outcome 2 ACR 50.

Comparison 5 Benefits ‐ RTX (2 x 500 mg) + MTX + TNFi versus MTX + TNFi, Outcome 3 LDA (DAS28 =or<3.2).
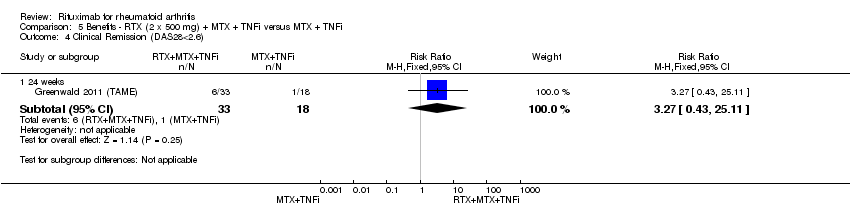
Comparison 5 Benefits ‐ RTX (2 x 500 mg) + MTX + TNFi versus MTX + TNFi, Outcome 4 Clinical Remission (DAS28<2.6).

Comparison 5 Benefits ‐ RTX (2 x 500 mg) + MTX + TNFi versus MTX + TNFi, Outcome 5 HAQ‐DI MCID=‐0.25.

Comparison 6 Withdrawals ‐ RTX (2 x 1000 mg) + MTX versus MTX, Outcome 1 Total discontinuations.

Comparison 6 Withdrawals ‐ RTX (2 x 1000 mg) + MTX versus MTX, Outcome 2 Lack of efficacy.
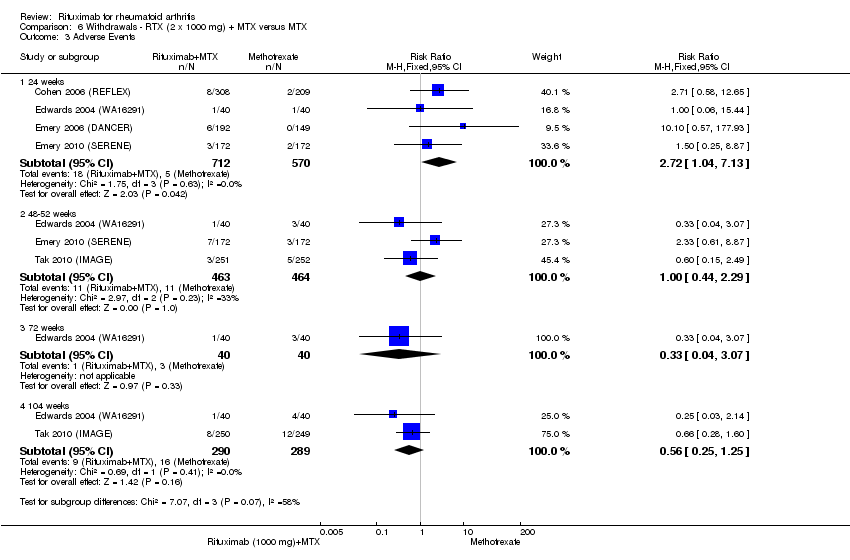
Comparison 6 Withdrawals ‐ RTX (2 x 1000 mg) + MTX versus MTX, Outcome 3 Adverse Events.

Comparison 6 Withdrawals ‐ RTX (2 x 1000 mg) + MTX versus MTX, Outcome 4 Other reasons.

Comparison 7 Withdrawals ‐ RTX monotherapy versus MTX monotherapy, Outcome 1 Total discontinuations.
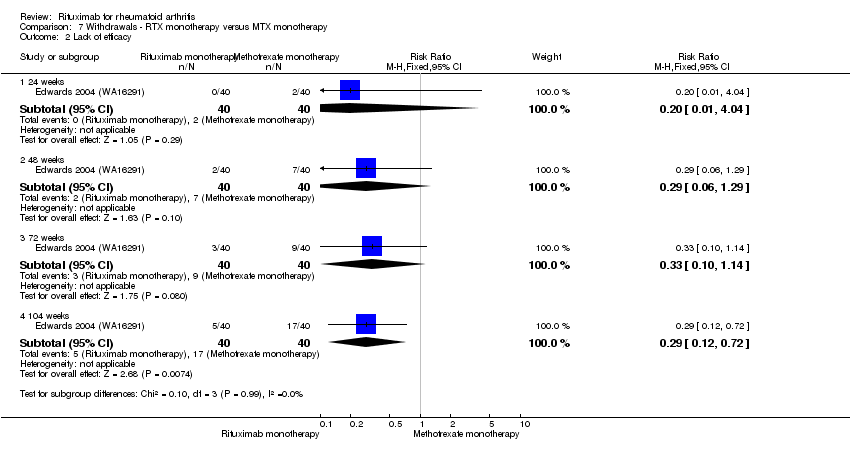
Comparison 7 Withdrawals ‐ RTX monotherapy versus MTX monotherapy, Outcome 2 Lack of efficacy.

Comparison 7 Withdrawals ‐ RTX monotherapy versus MTX monotherapy, Outcome 3 Adverse Events.

Comparison 7 Withdrawals ‐ RTX monotherapy versus MTX monotherapy, Outcome 4 Other reasons.

Comparison 8 Withdrawals ‐ RTX (2 x 500 mg) + MTX versus MTX, Outcome 1 Total discontinuations.

Comparison 8 Withdrawals ‐ RTX (2 x 500 mg) + MTX versus MTX, Outcome 2 Lack of efficacy.
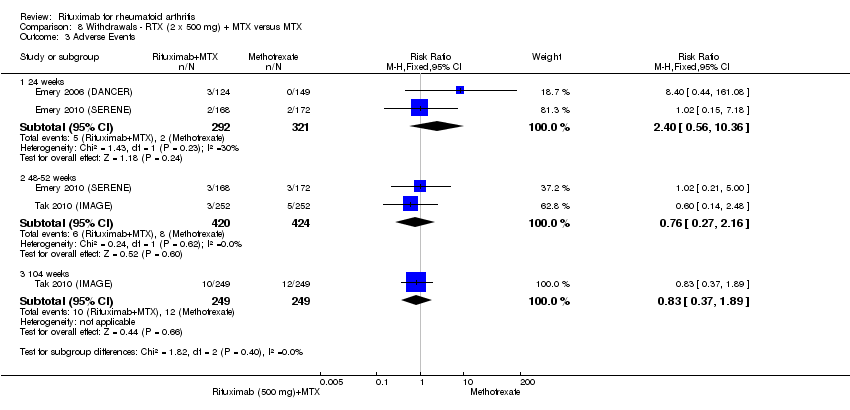
Comparison 8 Withdrawals ‐ RTX (2 x 500 mg) + MTX versus MTX, Outcome 3 Adverse Events.

Comparison 8 Withdrawals ‐ RTX (2 x 500 mg) + MTX versus MTX, Outcome 4 Other reasons.

Comparison 9 Withdrawals ‐ RTX (2 x 1000 mg) + CTX versus MTX, Outcome 1 Total discontinuations.
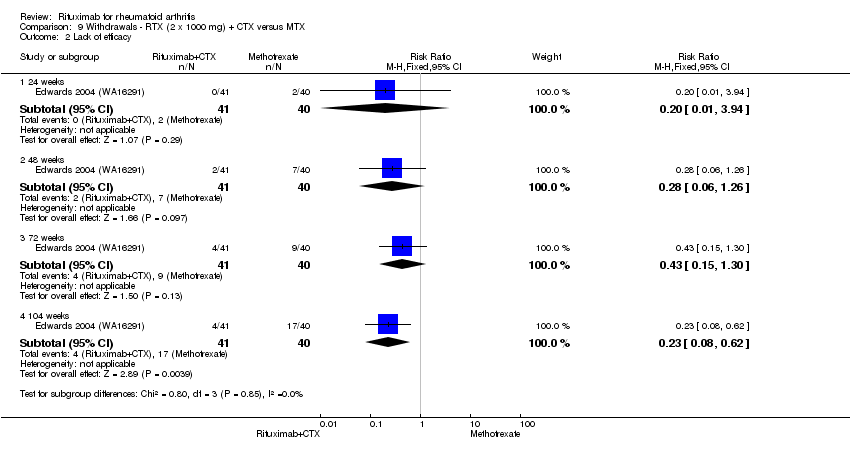
Comparison 9 Withdrawals ‐ RTX (2 x 1000 mg) + CTX versus MTX, Outcome 2 Lack of efficacy.

Comparison 9 Withdrawals ‐ RTX (2 x 1000 mg) + CTX versus MTX, Outcome 3 Adverse Events.
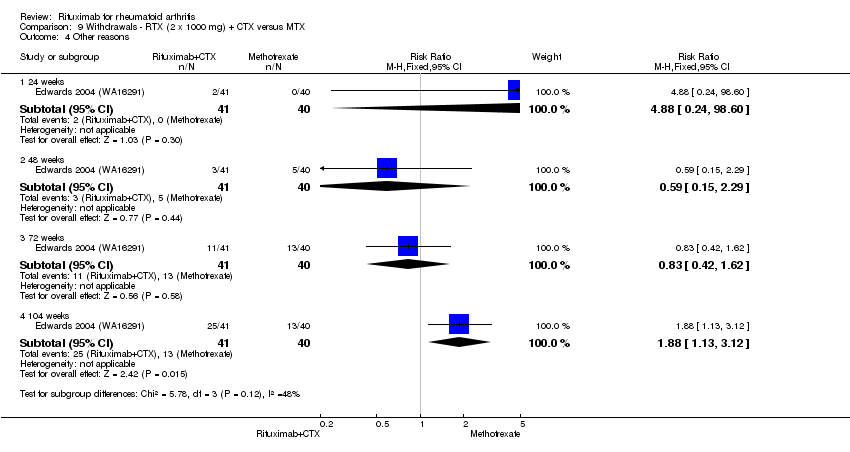
Comparison 9 Withdrawals ‐ RTX (2 x 1000 mg) + CTX versus MTX, Outcome 4 Other reasons.

Comparison 10 Withdrawals ‐ RTX + MTX + TNFi versus MTX + TNFi, Outcome 1 Total discontinuations.

Comparison 10 Withdrawals ‐ RTX + MTX + TNFi versus MTX + TNFi, Outcome 2 Adverse events.

Comparison 11 Harms ‐ RTX (2 x 1000 mg) + MTX versus MTX, Outcome 1 Any Adverse Event.

Comparison 11 Harms ‐ RTX (2 x 1000 mg) + MTX versus MTX, Outcome 2 Serious Adverse Events.

Comparison 11 Harms ‐ RTX (2 x 1000 mg) + MTX versus MTX, Outcome 3 Infections.
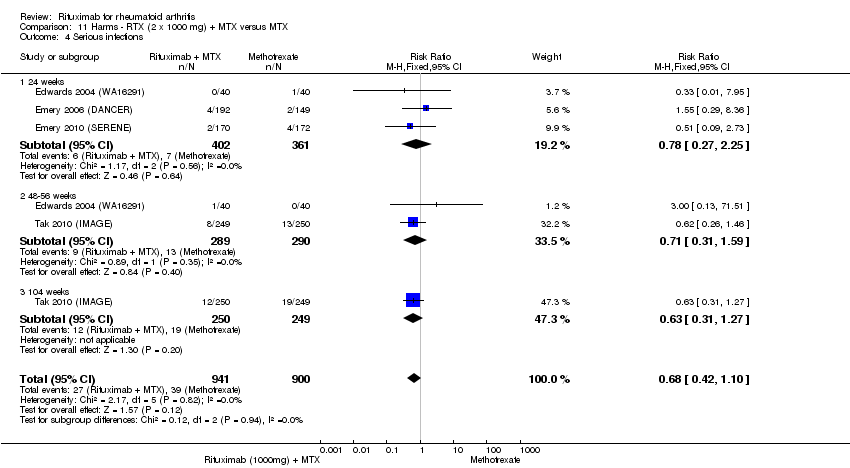
Comparison 11 Harms ‐ RTX (2 x 1000 mg) + MTX versus MTX, Outcome 4 Serious infections.

Comparison 11 Harms ‐ RTX (2 x 1000 mg) + MTX versus MTX, Outcome 5 Death.
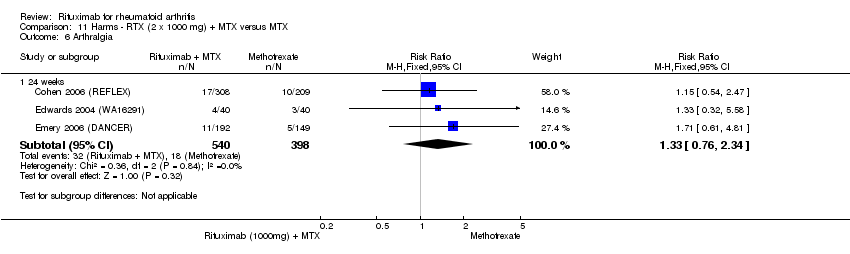
Comparison 11 Harms ‐ RTX (2 x 1000 mg) + MTX versus MTX, Outcome 6 Arthralgia.

Comparison 11 Harms ‐ RTX (2 x 1000 mg) + MTX versus MTX, Outcome 7 Cardiac event (any).

Comparison 11 Harms ‐ RTX (2 x 1000 mg) + MTX versus MTX, Outcome 8 Cardiac event (serious).

Comparison 11 Harms ‐ RTX (2 x 1000 mg) + MTX versus MTX, Outcome 9 Cough.
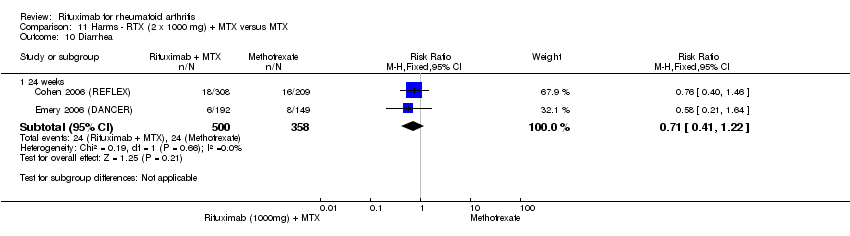
Comparison 11 Harms ‐ RTX (2 x 1000 mg) + MTX versus MTX, Outcome 10 Diarrhea.

Comparison 11 Harms ‐ RTX (2 x 1000 mg) + MTX versus MTX, Outcome 11 Exacerbation of RA.

Comparison 11 Harms ‐ RTX (2 x 1000 mg) + MTX versus MTX, Outcome 12 Fatigue.
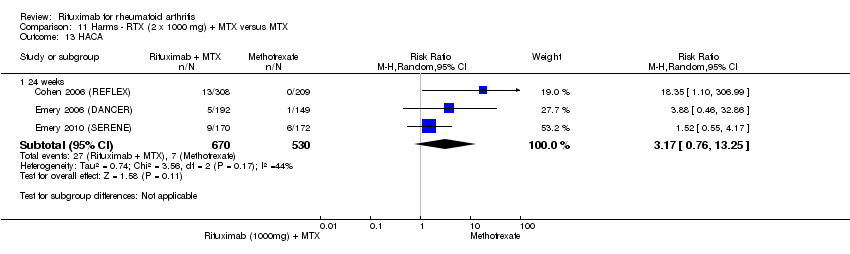
Comparison 11 Harms ‐ RTX (2 x 1000 mg) + MTX versus MTX, Outcome 13 HACA.
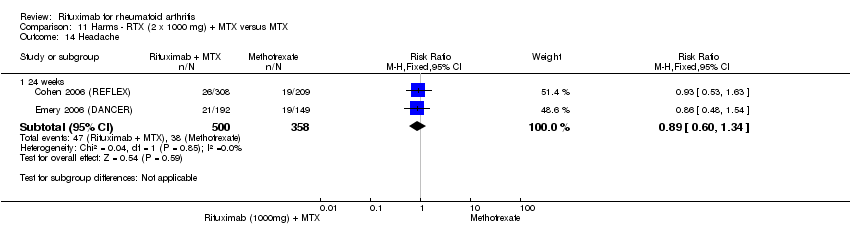
Comparison 11 Harms ‐ RTX (2 x 1000 mg) + MTX versus MTX, Outcome 14 Headache.

Comparison 11 Harms ‐ RTX (2 x 1000 mg) + MTX versus MTX, Outcome 15 Hypertension.

Comparison 11 Harms ‐ RTX (2 x 1000 mg) + MTX versus MTX, Outcome 16 Infusion‐related reactions (1st course ‐1st infusion).

Comparison 11 Harms ‐ RTX (2 x 1000 mg) + MTX versus MTX, Outcome 17 Infusion‐related reaction (1st course ‐2nd infusion).

Comparison 11 Harms ‐ RTX (2 x 1000 mg) + MTX versus MTX, Outcome 18 Infusion‐related reaction (2nd course).
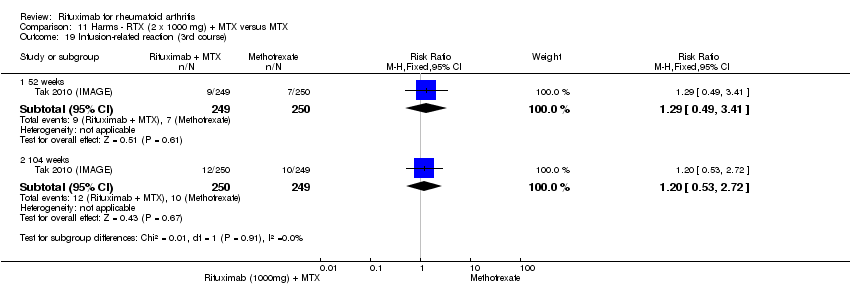
Comparison 11 Harms ‐ RTX (2 x 1000 mg) + MTX versus MTX, Outcome 19 Infusion‐related reaction (3rd course).

Comparison 11 Harms ‐ RTX (2 x 1000 mg) + MTX versus MTX, Outcome 20 Infusion‐related reaction (4th course).

Comparison 11 Harms ‐ RTX (2 x 1000 mg) + MTX versus MTX, Outcome 21 Infusion‐related reaction (5th course).

Comparison 11 Harms ‐ RTX (2 x 1000 mg) + MTX versus MTX, Outcome 22 Lower gastrointestinal events.

Comparison 11 Harms ‐ RTX (2 x 1000 mg) + MTX versus MTX, Outcome 23 Malignancy.

Comparison 11 Harms ‐ RTX (2 x 1000 mg) + MTX versus MTX, Outcome 24 Nasopharyngitis.

Comparison 11 Harms ‐ RTX (2 x 1000 mg) + MTX versus MTX, Outcome 25 Nausea.

Comparison 11 Harms ‐ RTX (2 x 1000 mg) + MTX versus MTX, Outcome 26 Pyrexia.
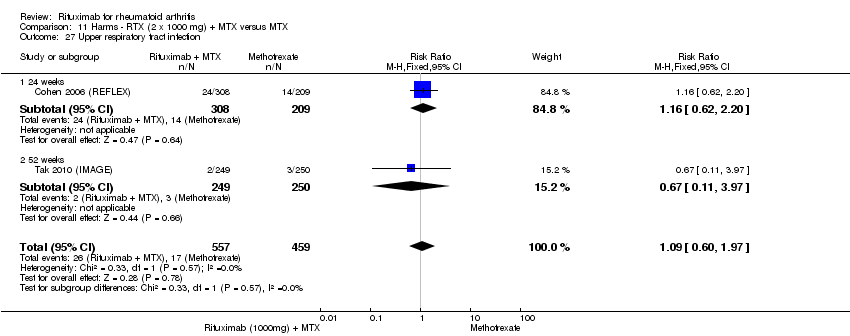
Comparison 11 Harms ‐ RTX (2 x 1000 mg) + MTX versus MTX, Outcome 27 Upper respiratory tract infection.

Comparison 11 Harms ‐ RTX (2 x 1000 mg) + MTX versus MTX, Outcome 28 Urinary tract infection.

Comparison 11 Harms ‐ RTX (2 x 1000 mg) + MTX versus MTX, Outcome 29 Vascular disorders.

Comparison 12 Harms ‐ RTX monotherapy versus MTX monotherapy, Outcome 1 Any Adverse Event.

Comparison 12 Harms ‐ RTX monotherapy versus MTX monotherapy, Outcome 2 Serious Adverse Events.

Comparison 12 Harms ‐ RTX monotherapy versus MTX monotherapy, Outcome 3 Serious Infections.

Comparison 12 Harms ‐ RTX monotherapy versus MTX monotherapy, Outcome 4 Death.
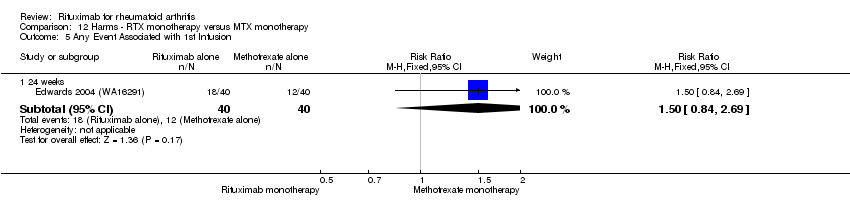
Comparison 12 Harms ‐ RTX monotherapy versus MTX monotherapy, Outcome 5 Any Event Associated with 1st Infusion.
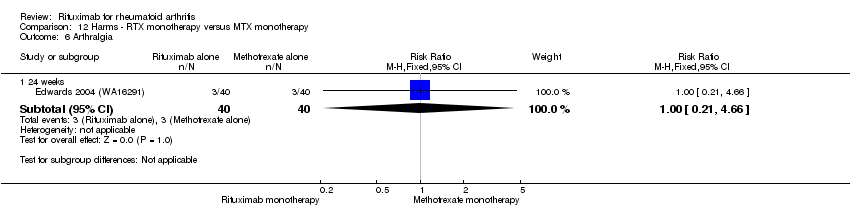
Comparison 12 Harms ‐ RTX monotherapy versus MTX monotherapy, Outcome 6 Arthralgia.
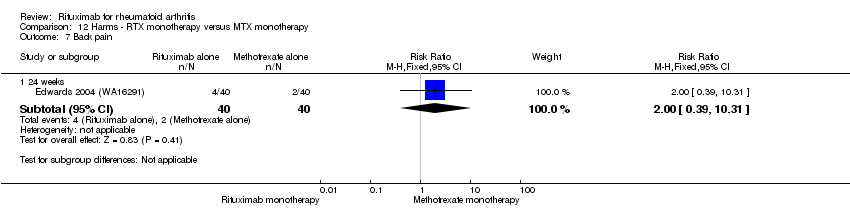
Comparison 12 Harms ‐ RTX monotherapy versus MTX monotherapy, Outcome 7 Back pain.

Comparison 12 Harms ‐ RTX monotherapy versus MTX monotherapy, Outcome 8 Cough.

Comparison 12 Harms ‐ RTX monotherapy versus MTX monotherapy, Outcome 9 Dyspnea.
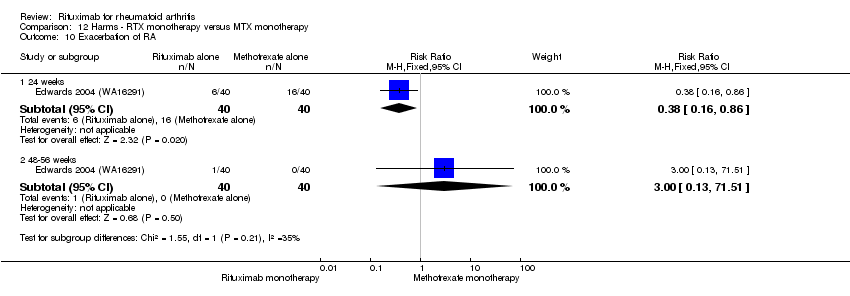
Comparison 12 Harms ‐ RTX monotherapy versus MTX monotherapy, Outcome 10 Exacerbation of RA.
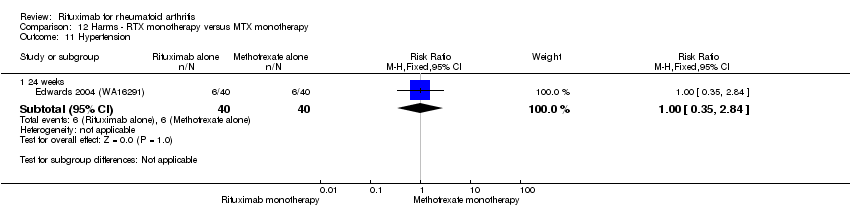
Comparison 12 Harms ‐ RTX monotherapy versus MTX monotherapy, Outcome 11 Hypertension.
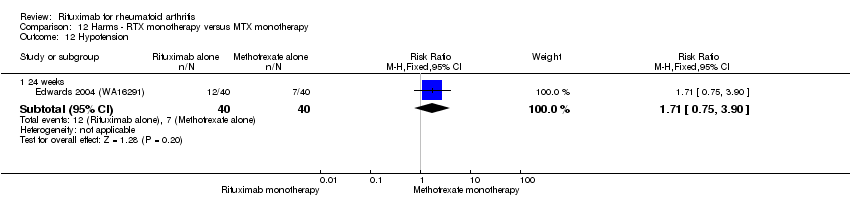
Comparison 12 Harms ‐ RTX monotherapy versus MTX monotherapy, Outcome 12 Hypotension.

Comparison 12 Harms ‐ RTX monotherapy versus MTX monotherapy, Outcome 13 Nasopharyngitis.

Comparison 12 Harms ‐ RTX monotherapy versus MTX monotherapy, Outcome 14 Nausea.
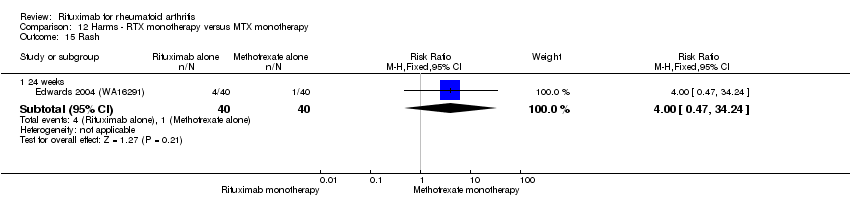
Comparison 12 Harms ‐ RTX monotherapy versus MTX monotherapy, Outcome 15 Rash.

Comparison 13 Harms ‐ RTX (2 x 500 mg) + MTX versus MTX, Outcome 1 Any Adverse Event.
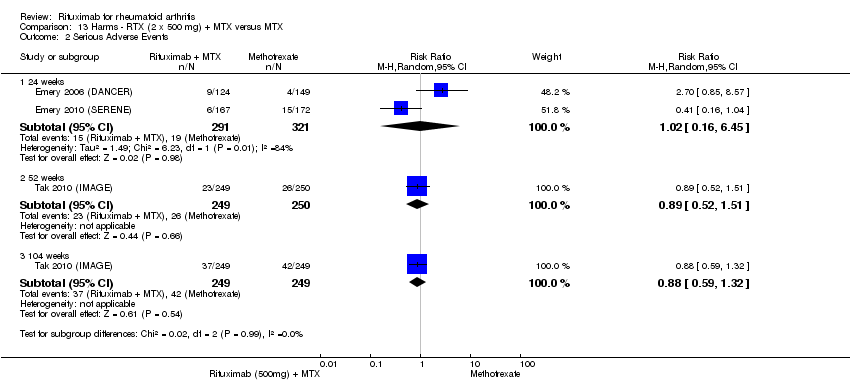
Comparison 13 Harms ‐ RTX (2 x 500 mg) + MTX versus MTX, Outcome 2 Serious Adverse Events.
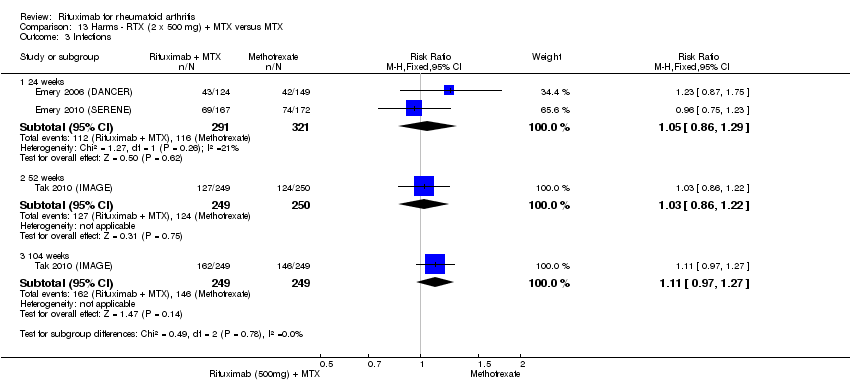
Comparison 13 Harms ‐ RTX (2 x 500 mg) + MTX versus MTX, Outcome 3 Infections.

Comparison 13 Harms ‐ RTX (2 x 500 mg) + MTX versus MTX, Outcome 4 Serious Infections.

Comparison 13 Harms ‐ RTX (2 x 500 mg) + MTX versus MTX, Outcome 5 Death.

Comparison 13 Harms ‐ RTX (2 x 500 mg) + MTX versus MTX, Outcome 6 Arthralgia.

Comparison 13 Harms ‐ RTX (2 x 500 mg) + MTX versus MTX, Outcome 7 Cardiac event (any).
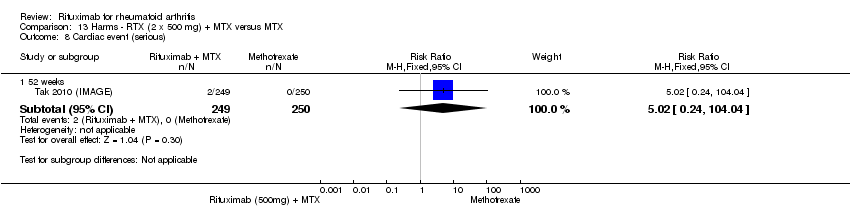
Comparison 13 Harms ‐ RTX (2 x 500 mg) + MTX versus MTX, Outcome 8 Cardiac event (serious).

Comparison 13 Harms ‐ RTX (2 x 500 mg) + MTX versus MTX, Outcome 9 Diarrhea.

Comparison 13 Harms ‐ RTX (2 x 500 mg) + MTX versus MTX, Outcome 10 Exacerbation of RA.

Comparison 13 Harms ‐ RTX (2 x 500 mg) + MTX versus MTX, Outcome 11 Fatigue.

Comparison 13 Harms ‐ RTX (2 x 500 mg) + MTX versus MTX, Outcome 12 HACA.

Comparison 13 Harms ‐ RTX (2 x 500 mg) + MTX versus MTX, Outcome 13 Headache.

Comparison 13 Harms ‐ RTX (2 x 500 mg) + MTX versus MTX, Outcome 14 Hypertension.

Comparison 13 Harms ‐ RTX (2 x 500 mg) + MTX versus MTX, Outcome 15 Infusion‐related reactions (1st course ‐ 1st infusion).
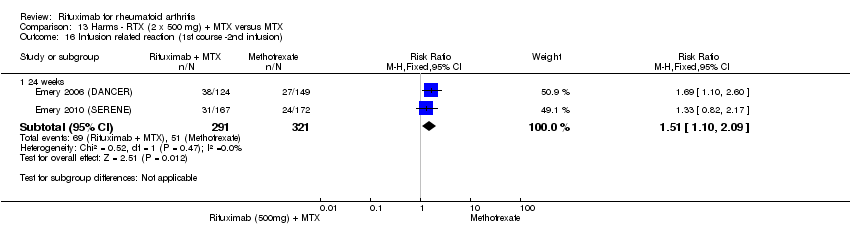
Comparison 13 Harms ‐ RTX (2 x 500 mg) + MTX versus MTX, Outcome 16 Infusion related reaction (1st course ‐2nd infusion).

Comparison 13 Harms ‐ RTX (2 x 500 mg) + MTX versus MTX, Outcome 17 Infusion related reaction (2nd course).
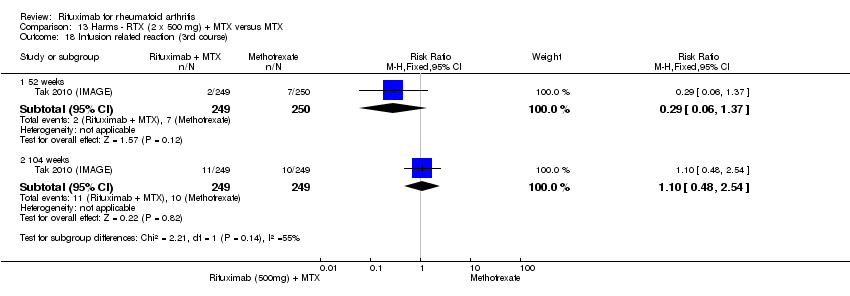
Comparison 13 Harms ‐ RTX (2 x 500 mg) + MTX versus MTX, Outcome 18 Infusion related reaction (3rd course).
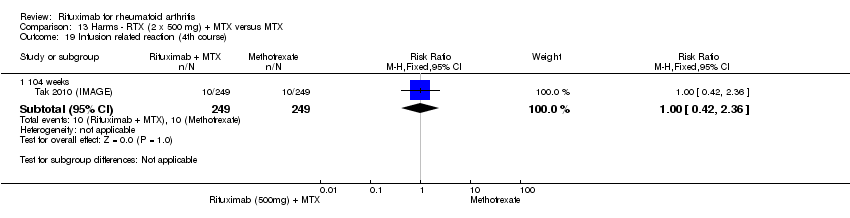
Comparison 13 Harms ‐ RTX (2 x 500 mg) + MTX versus MTX, Outcome 19 Infusion related reaction (4th course).

Comparison 13 Harms ‐ RTX (2 x 500 mg) + MTX versus MTX, Outcome 20 Infusion related reaction (5th course).

Comparison 13 Harms ‐ RTX (2 x 500 mg) + MTX versus MTX, Outcome 21 Lower gastrointestinal events.
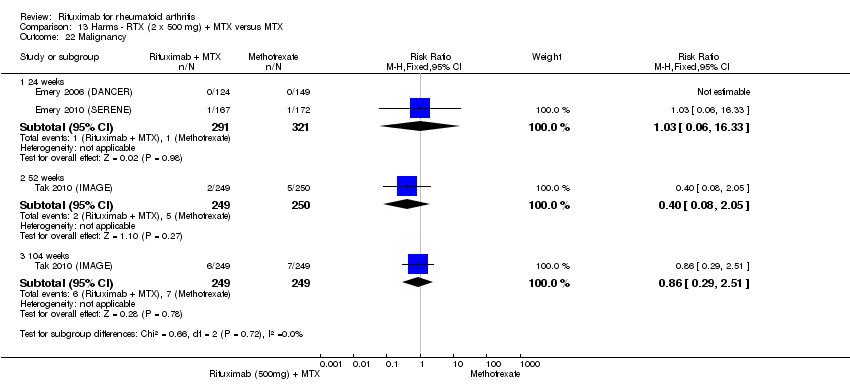
Comparison 13 Harms ‐ RTX (2 x 500 mg) + MTX versus MTX, Outcome 22 Malignancy.

Comparison 13 Harms ‐ RTX (2 x 500 mg) + MTX versus MTX, Outcome 23 Nasopharyngitis.
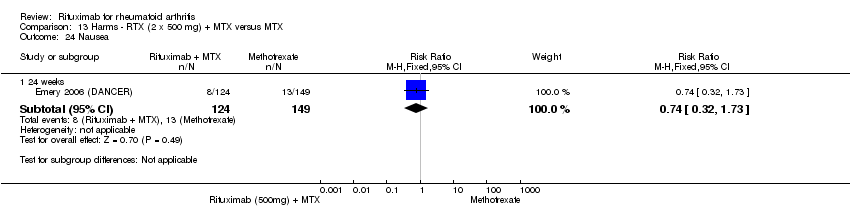
Comparison 13 Harms ‐ RTX (2 x 500 mg) + MTX versus MTX, Outcome 24 Nausea.

Comparison 13 Harms ‐ RTX (2 x 500 mg) + MTX versus MTX, Outcome 25 Upper respiratory tract infection.

Comparison 13 Harms ‐ RTX (2 x 500 mg) + MTX versus MTX, Outcome 26 Vascular disorders.
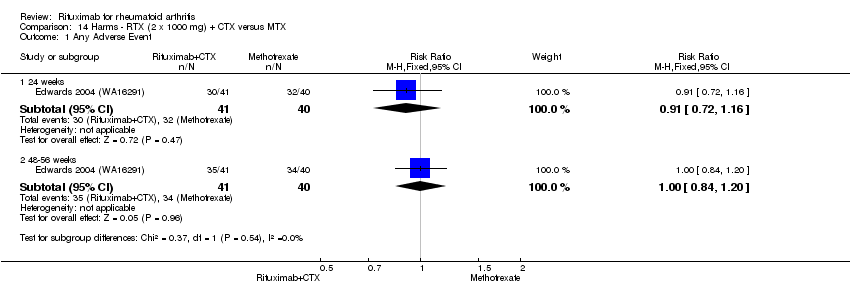
Comparison 14 Harms ‐ RTX (2 x 1000 mg) + CTX versus MTX, Outcome 1 Any Adverse Event.
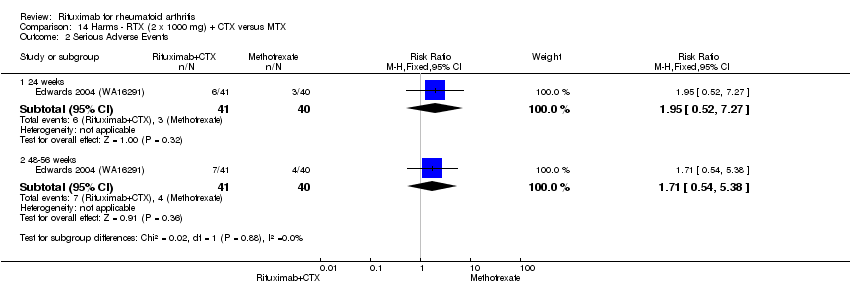
Comparison 14 Harms ‐ RTX (2 x 1000 mg) + CTX versus MTX, Outcome 2 Serious Adverse Events.
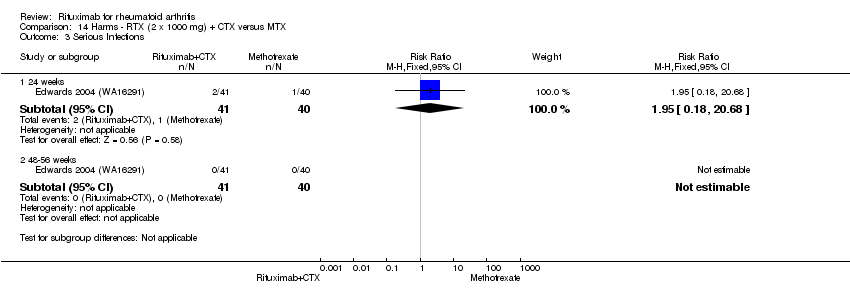
Comparison 14 Harms ‐ RTX (2 x 1000 mg) + CTX versus MTX, Outcome 3 Serious Infections.
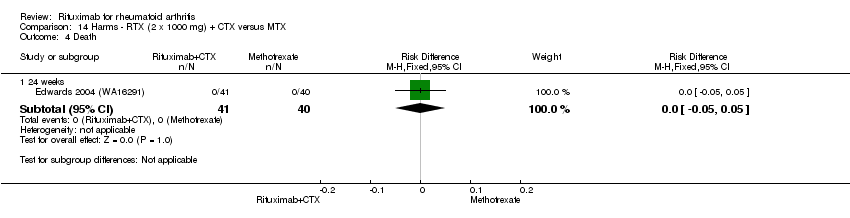
Comparison 14 Harms ‐ RTX (2 x 1000 mg) + CTX versus MTX, Outcome 4 Death.
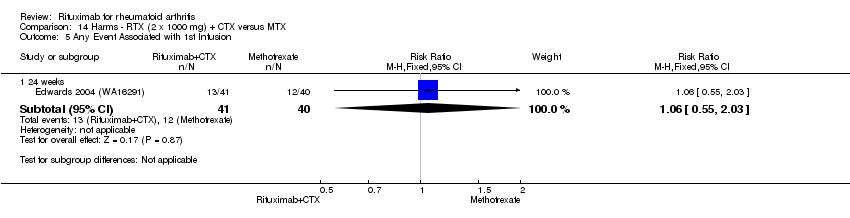
Comparison 14 Harms ‐ RTX (2 x 1000 mg) + CTX versus MTX, Outcome 5 Any Event Associated with 1st Infusion.
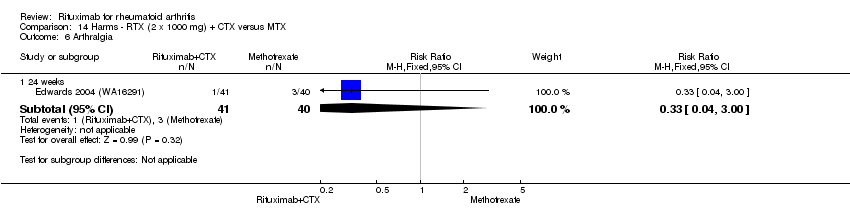
Comparison 14 Harms ‐ RTX (2 x 1000 mg) + CTX versus MTX, Outcome 6 Arthralgia.

Comparison 14 Harms ‐ RTX (2 x 1000 mg) + CTX versus MTX, Outcome 7 Back pain.

Comparison 14 Harms ‐ RTX (2 x 1000 mg) + CTX versus MTX, Outcome 8 Cough.

Comparison 14 Harms ‐ RTX (2 x 1000 mg) + CTX versus MTX, Outcome 9 Dyspnea.

Comparison 14 Harms ‐ RTX (2 x 1000 mg) + CTX versus MTX, Outcome 10 Exacerbation of RA.

Comparison 14 Harms ‐ RTX (2 x 1000 mg) + CTX versus MTX, Outcome 11 Hypertension.
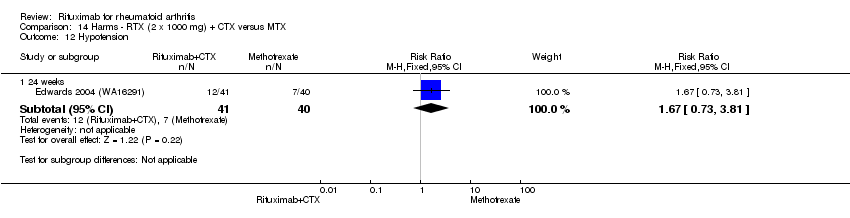
Comparison 14 Harms ‐ RTX (2 x 1000 mg) + CTX versus MTX, Outcome 12 Hypotension.
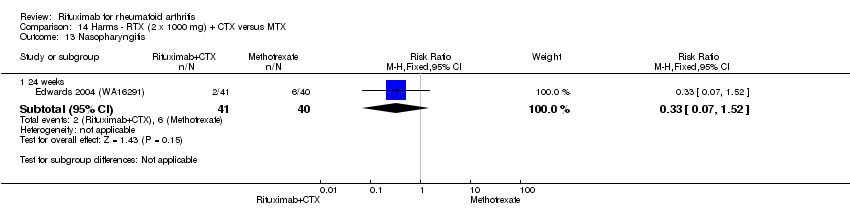
Comparison 14 Harms ‐ RTX (2 x 1000 mg) + CTX versus MTX, Outcome 13 Nasopharyngitis.

Comparison 14 Harms ‐ RTX (2 x 1000 mg) + CTX versus MTX, Outcome 14 Nausea.
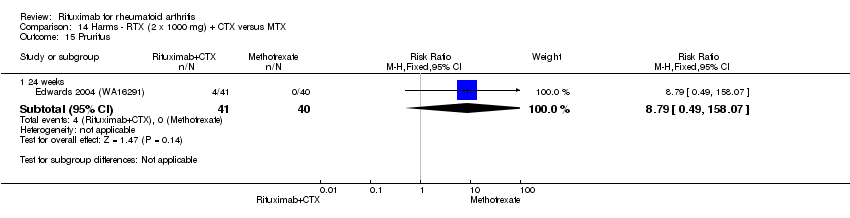
Comparison 14 Harms ‐ RTX (2 x 1000 mg) + CTX versus MTX, Outcome 15 Pruritus.

Comparison 14 Harms ‐ RTX (2 x 1000 mg) + CTX versus MTX, Outcome 16 Rash.
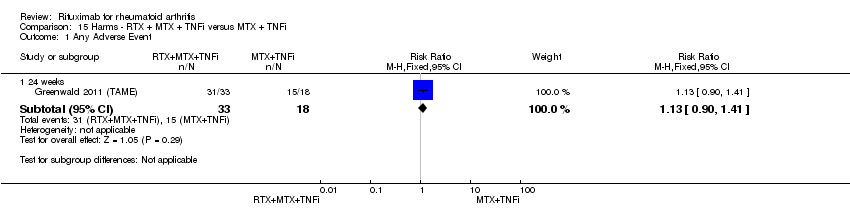
Comparison 15 Harms ‐ RTX + MTX + TNFi versus MTX + TNFi, Outcome 1 Any Adverse Event.
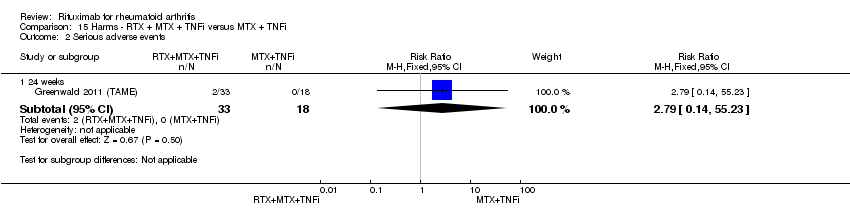
Comparison 15 Harms ‐ RTX + MTX + TNFi versus MTX + TNFi, Outcome 2 Serious adverse events.
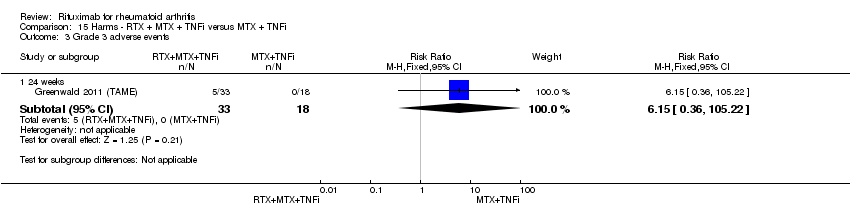
Comparison 15 Harms ‐ RTX + MTX + TNFi versus MTX + TNFi, Outcome 3 Grade 3 adverse events.

Comparison 15 Harms ‐ RTX + MTX + TNFi versus MTX + TNFi, Outcome 4 All infections.

Comparison 15 Harms ‐ RTX + MTX + TNFi versus MTX + TNFi, Outcome 5 Grade 3 infections.

Comparison 15 Harms ‐ RTX + MTX + TNFi versus MTX + TNFi, Outcome 6 Serious infections.

Comparison 15 Harms ‐ RTX + MTX + TNFi versus MTX + TNFi, Outcome 7 Any Event Associated with 1st infusion.

Comparison 15 Harms ‐ RTX + MTX + TNFi versus MTX + TNFi, Outcome 8 Any Event Associated with 2nd infusion.

Comparison 15 Harms ‐ RTX + MTX + TNFi versus MTX + TNFi, Outcome 9 Arthralgia.

Comparison 15 Harms ‐ RTX + MTX + TNFi versus MTX + TNFi, Outcome 10 Coronary artery occlusion.

Comparison 15 Harms ‐ RTX + MTX + TNFi versus MTX + TNFi, Outcome 11 Diarrhea.

Comparison 15 Harms ‐ RTX + MTX + TNFi versus MTX + TNFi, Outcome 12 Exacerbation of RA.

Comparison 15 Harms ‐ RTX + MTX + TNFi versus MTX + TNFi, Outcome 13 Fatigue.
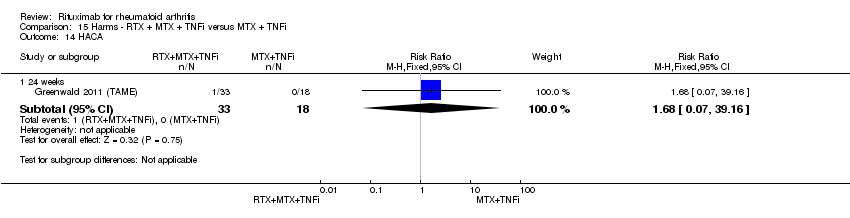
Comparison 15 Harms ‐ RTX + MTX + TNFi versus MTX + TNFi, Outcome 14 HACA.
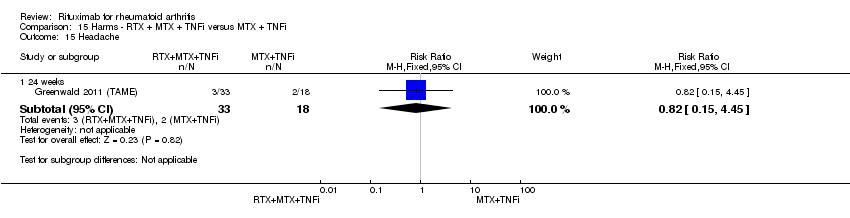
Comparison 15 Harms ‐ RTX + MTX + TNFi versus MTX + TNFi, Outcome 15 Headache.

Comparison 15 Harms ‐ RTX + MTX + TNFi versus MTX + TNFi, Outcome 16 Influenza.
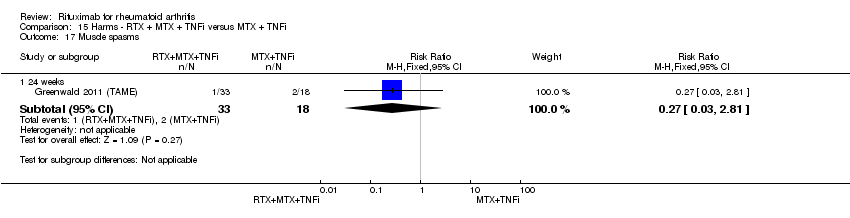
Comparison 15 Harms ‐ RTX + MTX + TNFi versus MTX + TNFi, Outcome 17 Muscle spasms.

Comparison 15 Harms ‐ RTX + MTX + TNFi versus MTX + TNFi, Outcome 18 Nasopharyngitis.

Comparison 15 Harms ‐ RTX + MTX + TNFi versus MTX + TNFi, Outcome 19 Nausea.
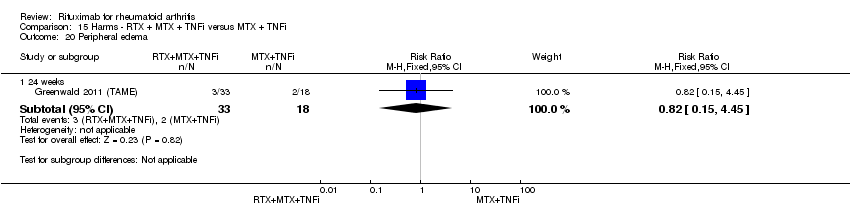
Comparison 15 Harms ‐ RTX + MTX + TNFi versus MTX + TNFi, Outcome 20 Peripheral edema.

Comparison 15 Harms ‐ RTX + MTX + TNFi versus MTX + TNFi, Outcome 21 Pneumonia.

Comparison 15 Harms ‐ RTX + MTX + TNFi versus MTX + TNFi, Outcome 22 Postoperative infection.

Comparison 15 Harms ‐ RTX + MTX + TNFi versus MTX + TNFi, Outcome 23 Pruritus.
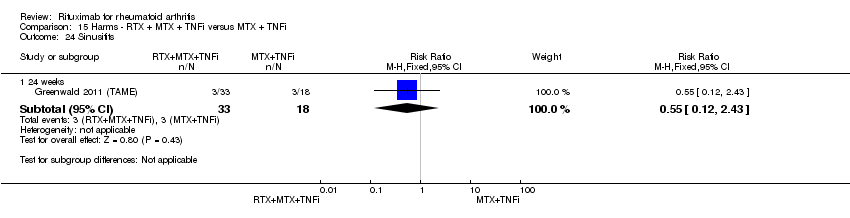
Comparison 15 Harms ‐ RTX + MTX + TNFi versus MTX + TNFi, Outcome 24 Sinusitits.

Comparison 15 Harms ‐ RTX + MTX + TNFi versus MTX + TNFi, Outcome 25 Upper respiratory tract infections.

Comparison 15 Harms ‐ RTX + MTX + TNFi versus MTX + TNFi, Outcome 26 Urinary tract infections.
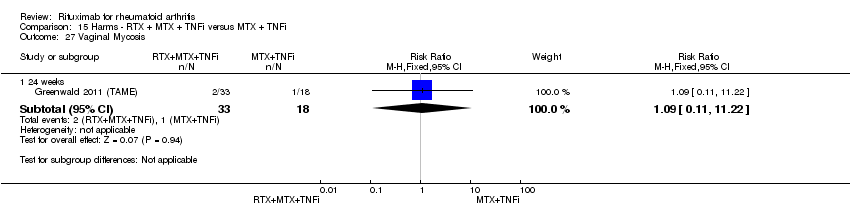
Comparison 15 Harms ‐ RTX + MTX + TNFi versus MTX + TNFi, Outcome 27 Vaginal Mycosis.

Comparison 16 Disease duration (subgroup analysis), Outcome 1 ACR 50.

Comparison 17 Previous treatment (subgroup analysis), Outcome 1 ACR 50.
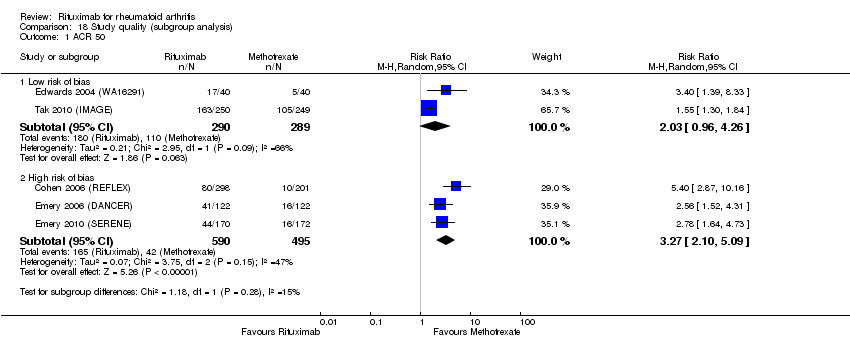
Comparison 18 Study quality (subgroup analysis), Outcome 1 ACR 50.

Comparison 19 Dosage 2 x 1000 mg versus 2 x 500 mg (sensitivity analysis), Outcome 1 ACR 20.

Comparison 19 Dosage 2 x 1000 mg versus 2 x 500 mg (sensitivity analysis), Outcome 2 ACR 50.

Comparison 19 Dosage 2 x 1000 mg versus 2 x 500 mg (sensitivity analysis), Outcome 3 ACR 70.
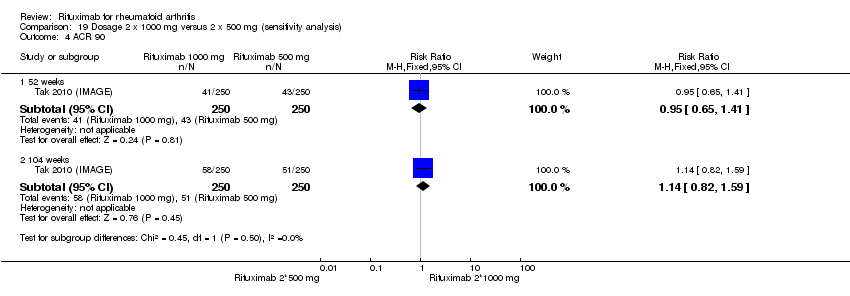
Comparison 19 Dosage 2 x 1000 mg versus 2 x 500 mg (sensitivity analysis), Outcome 4 ACR 90.
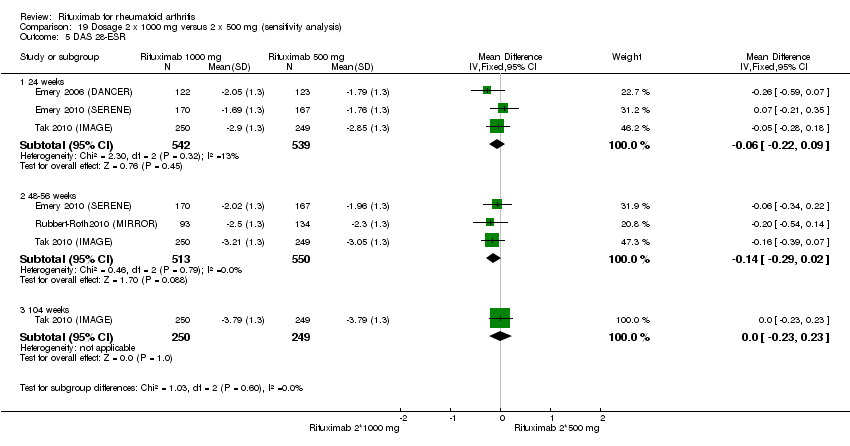
Comparison 19 Dosage 2 x 1000 mg versus 2 x 500 mg (sensitivity analysis), Outcome 5 DAS 28‐ESR.

Comparison 19 Dosage 2 x 1000 mg versus 2 x 500 mg (sensitivity analysis), Outcome 6 LDA (DAS28 =or<3.2).
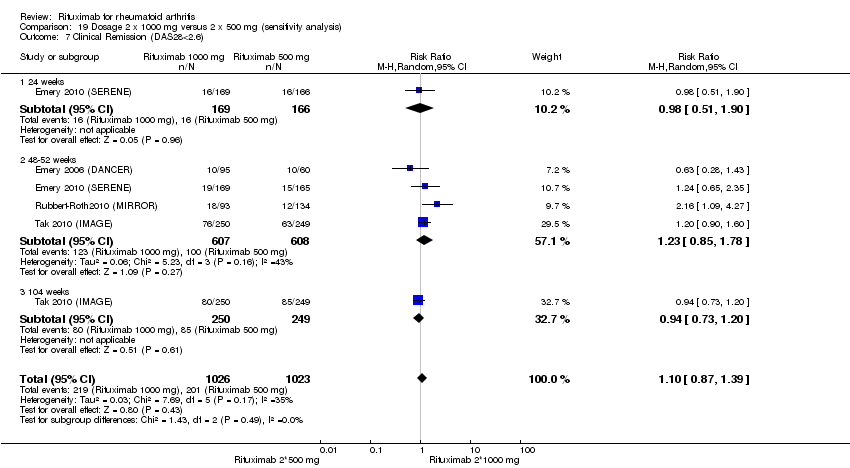
Comparison 19 Dosage 2 x 1000 mg versus 2 x 500 mg (sensitivity analysis), Outcome 7 Clinical Remission (DAS28<2.6).

Comparison 19 Dosage 2 x 1000 mg versus 2 x 500 mg (sensitivity analysis), Outcome 8 Moderate or good EULAR response.

Comparison 19 Dosage 2 x 1000 mg versus 2 x 500 mg (sensitivity analysis), Outcome 9 HAQ‐DI.

Comparison 19 Dosage 2 x 1000 mg versus 2 x 500 mg (sensitivity analysis), Outcome 10 HAQ‐DI MCID=‐0.22.

Comparison 19 Dosage 2 x 1000 mg versus 2 x 500 mg (sensitivity analysis), Outcome 11 SF‐36 PCS.

Comparison 19 Dosage 2 x 1000 mg versus 2 x 500 mg (sensitivity analysis), Outcome 12 SF‐36 PCS (=or>MCID of 5 or 5.42).

Comparison 19 Dosage 2 x 1000 mg versus 2 x 500 mg (sensitivity analysis), Outcome 13 SF‐36 MCS.

Comparison 19 Dosage 2 x 1000 mg versus 2 x 500 mg (sensitivity analysis), Outcome 14 SF‐36 MCS (=or>MCID of 6.33).
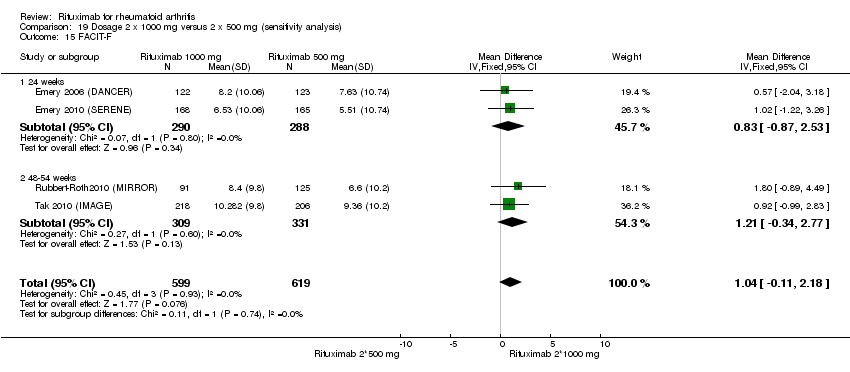
Comparison 19 Dosage 2 x 1000 mg versus 2 x 500 mg (sensitivity analysis), Outcome 15 FACIT‐F.
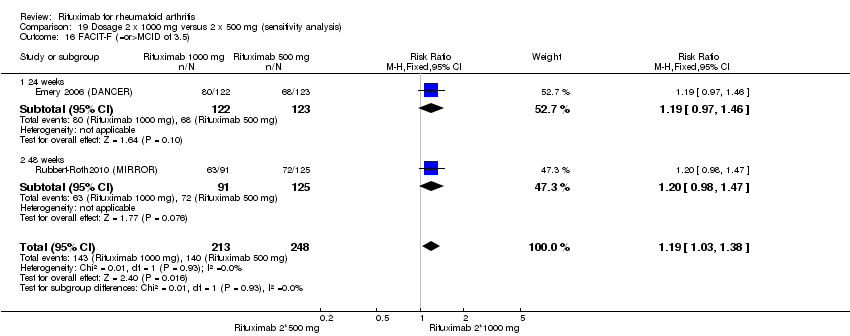
Comparison 19 Dosage 2 x 1000 mg versus 2 x 500 mg (sensitivity analysis), Outcome 16 FACIT‐F (=or>MCID of 3.5).
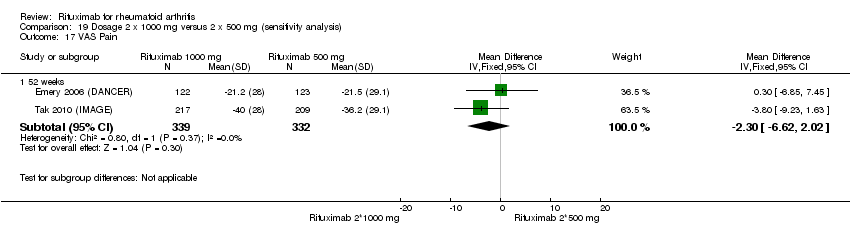
Comparison 19 Dosage 2 x 1000 mg versus 2 x 500 mg (sensitivity analysis), Outcome 17 VAS Pain.

Comparison 19 Dosage 2 x 1000 mg versus 2 x 500 mg (sensitivity analysis), Outcome 18 Total radiographic score.

Comparison 19 Dosage 2 x 1000 mg versus 2 x 500 mg (sensitivity analysis), Outcome 19 Joint space narrowing.

Comparison 19 Dosage 2 x 1000 mg versus 2 x 500 mg (sensitivity analysis), Outcome 20 Radiographic erosions.
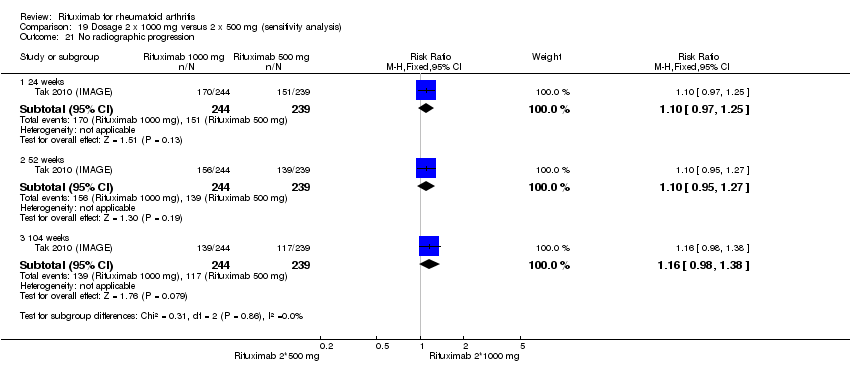
Comparison 19 Dosage 2 x 1000 mg versus 2 x 500 mg (sensitivity analysis), Outcome 21 No radiographic progression.
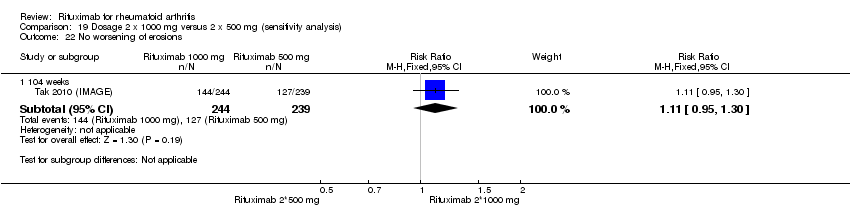
Comparison 19 Dosage 2 x 1000 mg versus 2 x 500 mg (sensitivity analysis), Outcome 22 No worsening of erosions.
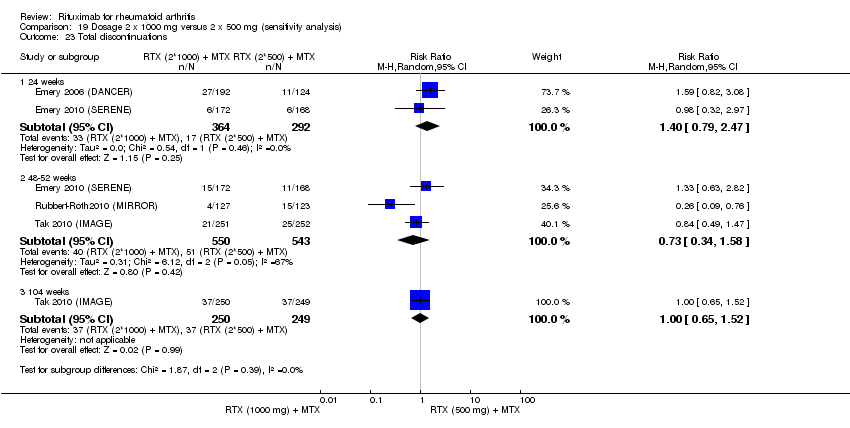
Comparison 19 Dosage 2 x 1000 mg versus 2 x 500 mg (sensitivity analysis), Outcome 23 Total discontinuations.
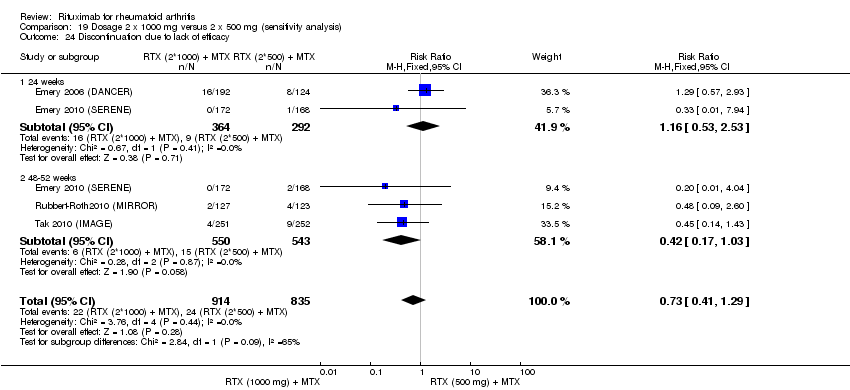
Comparison 19 Dosage 2 x 1000 mg versus 2 x 500 mg (sensitivity analysis), Outcome 24 Discontinuation due to lack of efficacy.
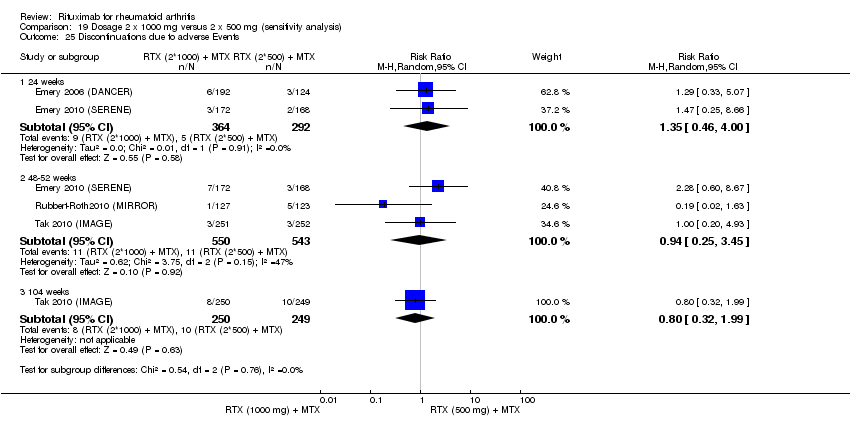
Comparison 19 Dosage 2 x 1000 mg versus 2 x 500 mg (sensitivity analysis), Outcome 25 Discontinuations due to adverse Events.

Comparison 19 Dosage 2 x 1000 mg versus 2 x 500 mg (sensitivity analysis), Outcome 26 Discontinuations due to other reasons.

Comparison 19 Dosage 2 x 1000 mg versus 2 x 500 mg (sensitivity analysis), Outcome 27 Any Adverse Event.

Comparison 19 Dosage 2 x 1000 mg versus 2 x 500 mg (sensitivity analysis), Outcome 28 Serious Adverse Events.
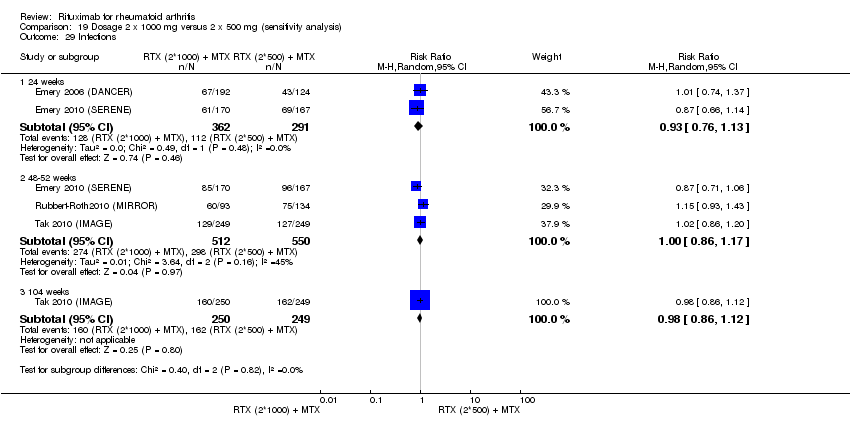
Comparison 19 Dosage 2 x 1000 mg versus 2 x 500 mg (sensitivity analysis), Outcome 29 Infections.

Comparison 19 Dosage 2 x 1000 mg versus 2 x 500 mg (sensitivity analysis), Outcome 30 Serious Infections.
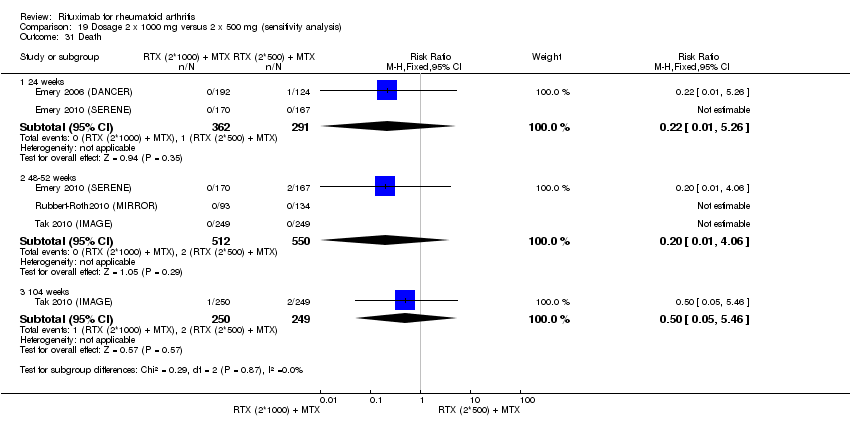
Comparison 19 Dosage 2 x 1000 mg versus 2 x 500 mg (sensitivity analysis), Outcome 31 Death.

Comparison 19 Dosage 2 x 1000 mg versus 2 x 500 mg (sensitivity analysis), Outcome 32 Arthralgia.
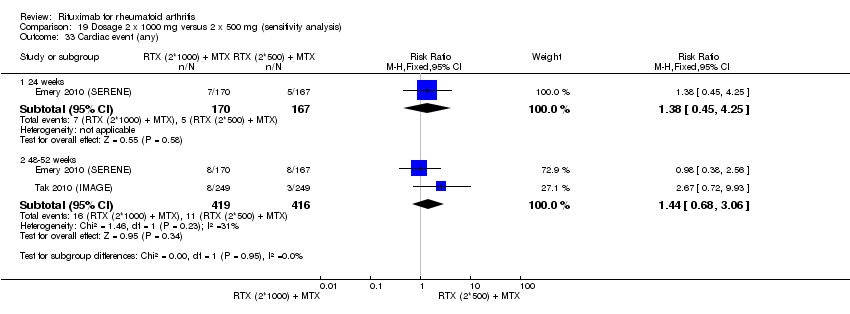
Comparison 19 Dosage 2 x 1000 mg versus 2 x 500 mg (sensitivity analysis), Outcome 33 Cardiac event (any).
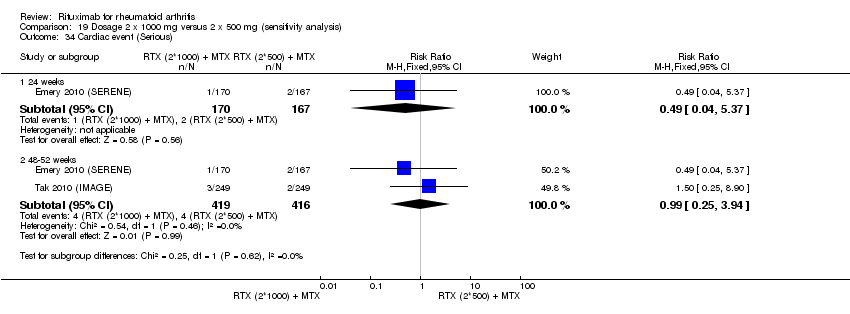
Comparison 19 Dosage 2 x 1000 mg versus 2 x 500 mg (sensitivity analysis), Outcome 34 Cardiac event (Serious).
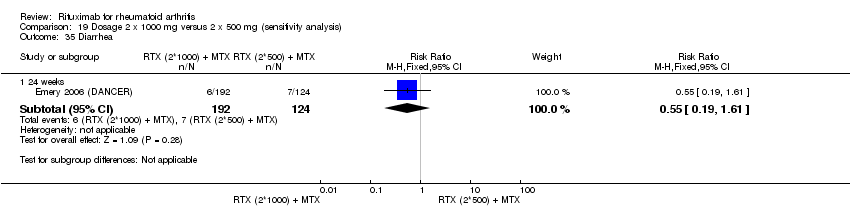
Comparison 19 Dosage 2 x 1000 mg versus 2 x 500 mg (sensitivity analysis), Outcome 35 Diarrhea.

Comparison 19 Dosage 2 x 1000 mg versus 2 x 500 mg (sensitivity analysis), Outcome 36 Exacerbation of RA.

Comparison 19 Dosage 2 x 1000 mg versus 2 x 500 mg (sensitivity analysis), Outcome 37 Fatigue.

Comparison 19 Dosage 2 x 1000 mg versus 2 x 500 mg (sensitivity analysis), Outcome 38 HACA.

Comparison 19 Dosage 2 x 1000 mg versus 2 x 500 mg (sensitivity analysis), Outcome 39 Hypertension.

Comparison 19 Dosage 2 x 1000 mg versus 2 x 500 mg (sensitivity analysis), Outcome 40 Infusion‐related reactions (1st course ‐1st infusion).

Comparison 19 Dosage 2 x 1000 mg versus 2 x 500 mg (sensitivity analysis), Outcome 41 Infusion‐related reaction (1st course ‐2nd infusion).

Comparison 19 Dosage 2 x 1000 mg versus 2 x 500 mg (sensitivity analysis), Outcome 42 Infusion‐related reaction (2nd course).

Comparison 19 Dosage 2 x 1000 mg versus 2 x 500 mg (sensitivity analysis), Outcome 43 Infusion‐related reaction (3rd course).

Comparison 19 Dosage 2 x 1000 mg versus 2 x 500 mg (sensitivity analysis), Outcome 44 Infusion‐related reaction (4th course).
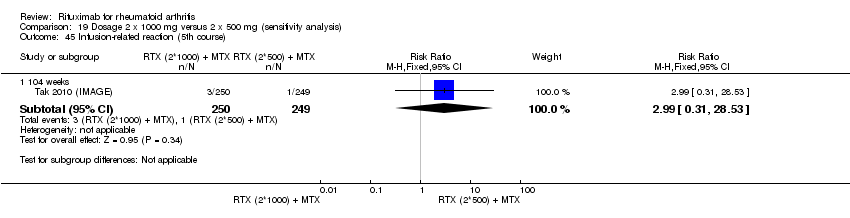
Comparison 19 Dosage 2 x 1000 mg versus 2 x 500 mg (sensitivity analysis), Outcome 45 Infusion‐related reaction (5th course).
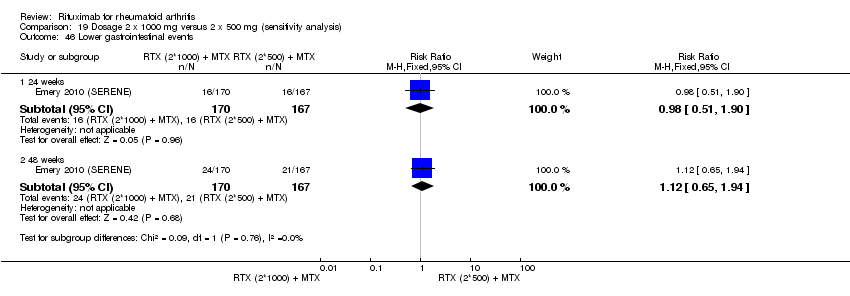
Comparison 19 Dosage 2 x 1000 mg versus 2 x 500 mg (sensitivity analysis), Outcome 46 Lower gastrointestinal events.

Comparison 19 Dosage 2 x 1000 mg versus 2 x 500 mg (sensitivity analysis), Outcome 47 Malignancy.

Comparison 19 Dosage 2 x 1000 mg versus 2 x 500 mg (sensitivity analysis), Outcome 48 Pneumonia.
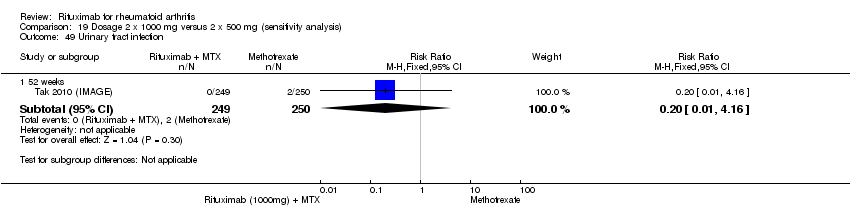
Comparison 19 Dosage 2 x 1000 mg versus 2 x 500 mg (sensitivity analysis), Outcome 49 Urinary tract infection.

Comparison 19 Dosage 2 x 1000 mg versus 2 x 500 mg (sensitivity analysis), Outcome 50 Vascular disorders.

Comparison 20 Concomitant treatment CTX versus MTX (sensitivity analysis), Outcome 1 ACR 20.

Comparison 20 Concomitant treatment CTX versus MTX (sensitivity analysis), Outcome 2 ACR 50.
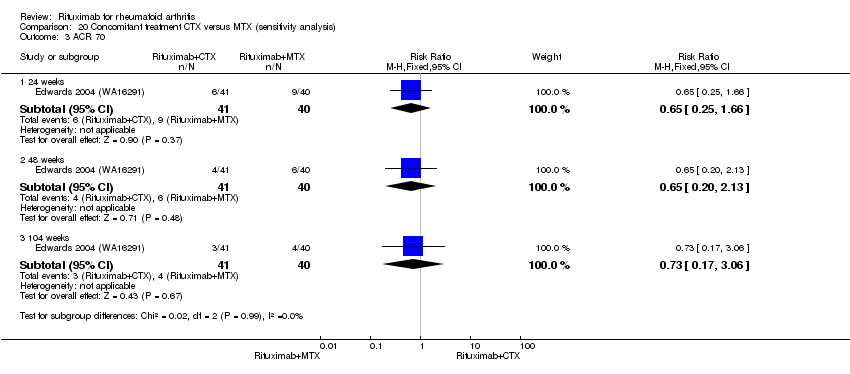
Comparison 20 Concomitant treatment CTX versus MTX (sensitivity analysis), Outcome 3 ACR 70.
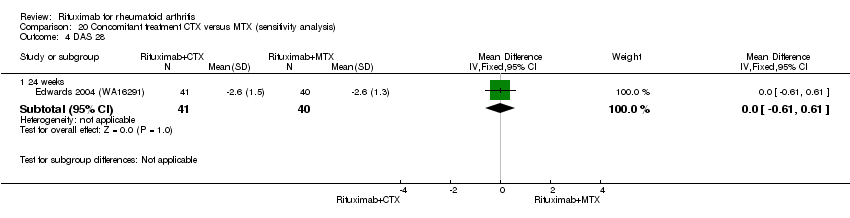
Comparison 20 Concomitant treatment CTX versus MTX (sensitivity analysis), Outcome 4 DAS 28.

Comparison 20 Concomitant treatment CTX versus MTX (sensitivity analysis), Outcome 5 Moderate or good EULAR response.
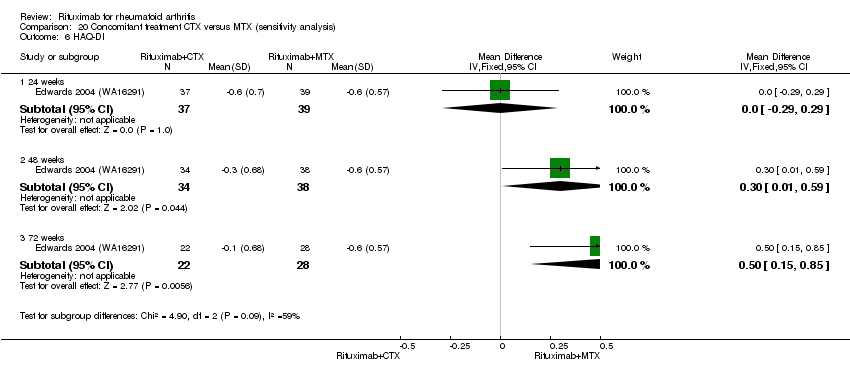
Comparison 20 Concomitant treatment CTX versus MTX (sensitivity analysis), Outcome 6 HAQ‐DI.

Comparison 20 Concomitant treatment CTX versus MTX (sensitivity analysis), Outcome 7 HAQ‐DI MCID=‐0.22.

Comparison 20 Concomitant treatment CTX versus MTX (sensitivity analysis), Outcome 8 Total discontinuations.
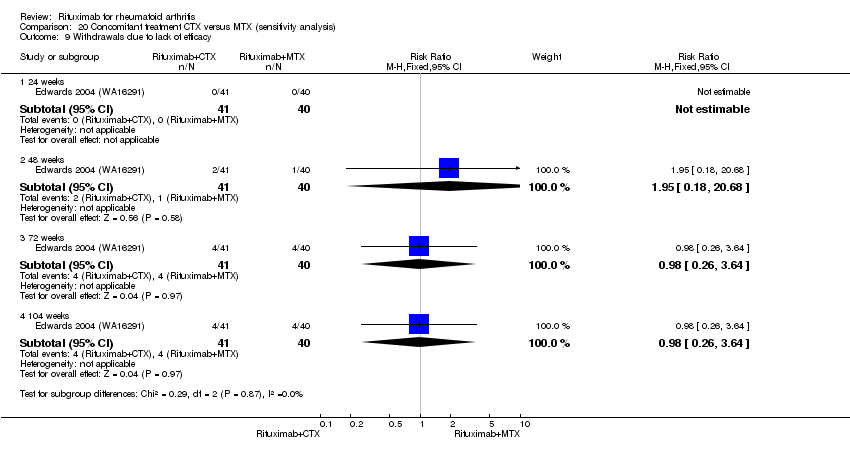
Comparison 20 Concomitant treatment CTX versus MTX (sensitivity analysis), Outcome 9 Withdrawals due to lack of efficacy.
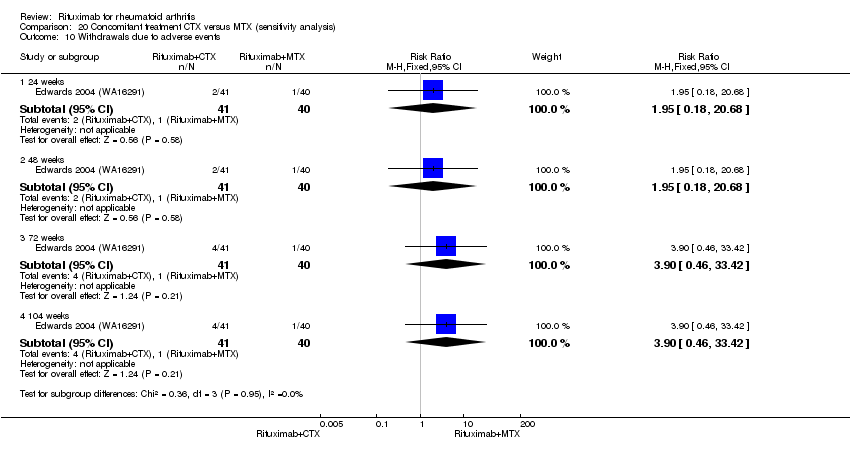
Comparison 20 Concomitant treatment CTX versus MTX (sensitivity analysis), Outcome 10 Withdrawals due to adverse events.

Comparison 20 Concomitant treatment CTX versus MTX (sensitivity analysis), Outcome 11 Withdrawals due to other reasons.
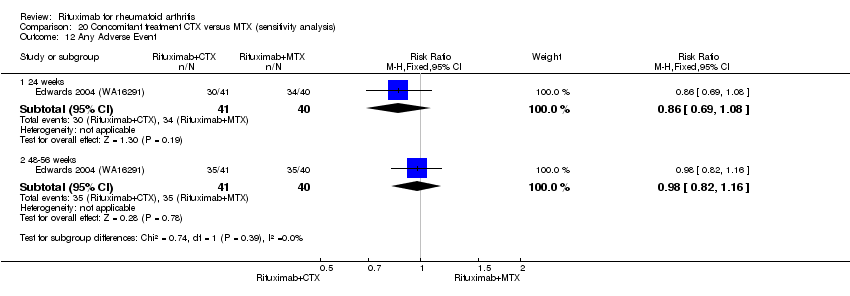
Comparison 20 Concomitant treatment CTX versus MTX (sensitivity analysis), Outcome 12 Any Adverse Event.

Comparison 20 Concomitant treatment CTX versus MTX (sensitivity analysis), Outcome 13 Serious Adverse Events.

Comparison 20 Concomitant treatment CTX versus MTX (sensitivity analysis), Outcome 14 Serious Infections.

Comparison 20 Concomitant treatment CTX versus MTX (sensitivity analysis), Outcome 15 Exacerbation of RA.
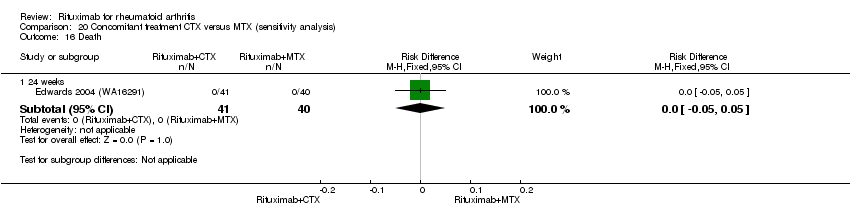
Comparison 20 Concomitant treatment CTX versus MTX (sensitivity analysis), Outcome 16 Death.

Comparison 20 Concomitant treatment CTX versus MTX (sensitivity analysis), Outcome 17 Any Event Associated with 1st Infusion.
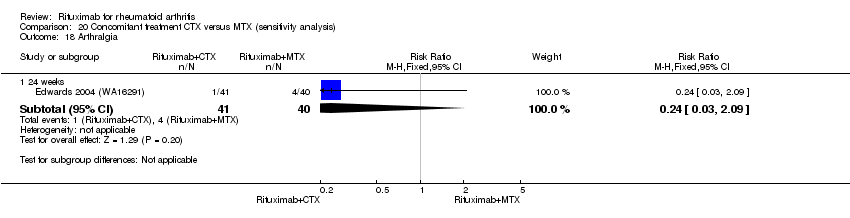
Comparison 20 Concomitant treatment CTX versus MTX (sensitivity analysis), Outcome 18 Arthralgia.

Comparison 20 Concomitant treatment CTX versus MTX (sensitivity analysis), Outcome 19 Back pain.

Comparison 20 Concomitant treatment CTX versus MTX (sensitivity analysis), Outcome 20 Cough.
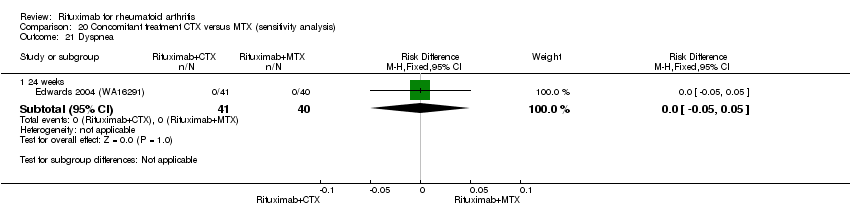
Comparison 20 Concomitant treatment CTX versus MTX (sensitivity analysis), Outcome 21 Dyspnea.

Comparison 20 Concomitant treatment CTX versus MTX (sensitivity analysis), Outcome 22 Hypertension.
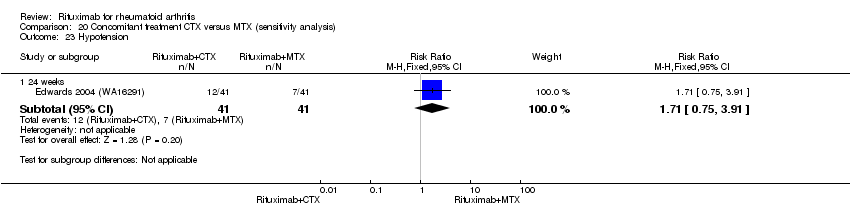
Comparison 20 Concomitant treatment CTX versus MTX (sensitivity analysis), Outcome 23 Hypotension.
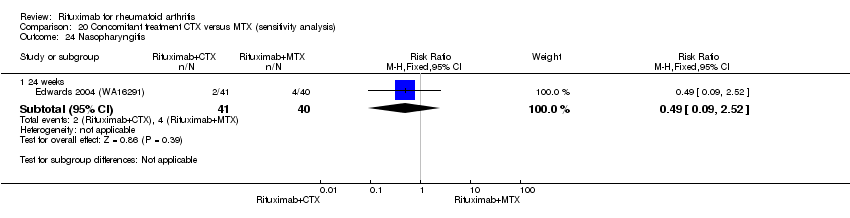
Comparison 20 Concomitant treatment CTX versus MTX (sensitivity analysis), Outcome 24 Nasopharyngitis.

Comparison 20 Concomitant treatment CTX versus MTX (sensitivity analysis), Outcome 25 Nausea.

Comparison 20 Concomitant treatment CTX versus MTX (sensitivity analysis), Outcome 26 Pruritus.

Comparison 20 Concomitant treatment CTX versus MTX (sensitivity analysis), Outcome 27 Rash.

Comparison 21 Concomitant treatment MTX versus none (sensitivity analysis), Outcome 1 ACR 20.
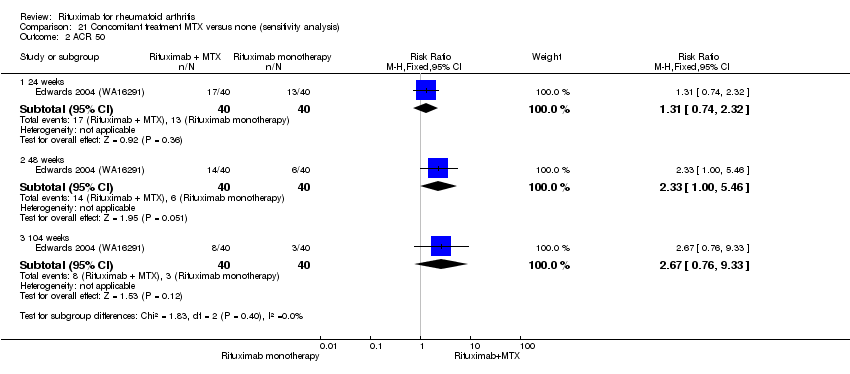
Comparison 21 Concomitant treatment MTX versus none (sensitivity analysis), Outcome 2 ACR 50.

Comparison 21 Concomitant treatment MTX versus none (sensitivity analysis), Outcome 3 ACR 70.

Comparison 21 Concomitant treatment MTX versus none (sensitivity analysis), Outcome 4 DAS 28.
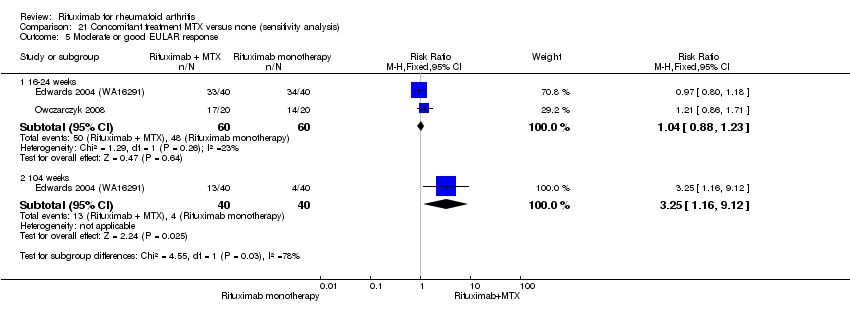
Comparison 21 Concomitant treatment MTX versus none (sensitivity analysis), Outcome 5 Moderate or good EULAR response.

Comparison 21 Concomitant treatment MTX versus none (sensitivity analysis), Outcome 6 HAQ‐DI.

Comparison 21 Concomitant treatment MTX versus none (sensitivity analysis), Outcome 7 HAQ‐DI MCID=‐0.22.

Comparison 21 Concomitant treatment MTX versus none (sensitivity analysis), Outcome 8 Total discontinuations.

Comparison 21 Concomitant treatment MTX versus none (sensitivity analysis), Outcome 9 Withdrawals due to lack of efficacy.
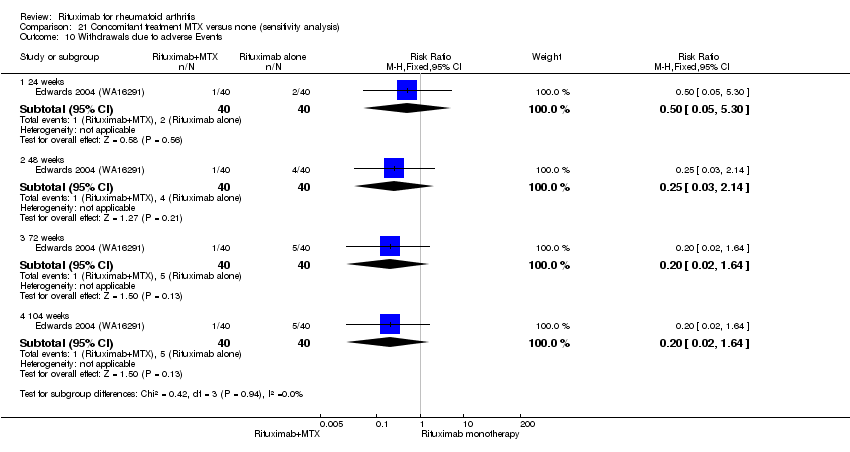
Comparison 21 Concomitant treatment MTX versus none (sensitivity analysis), Outcome 10 Withdrawals due to adverse Events.

Comparison 21 Concomitant treatment MTX versus none (sensitivity analysis), Outcome 11 Withdrawals due to other reasons.
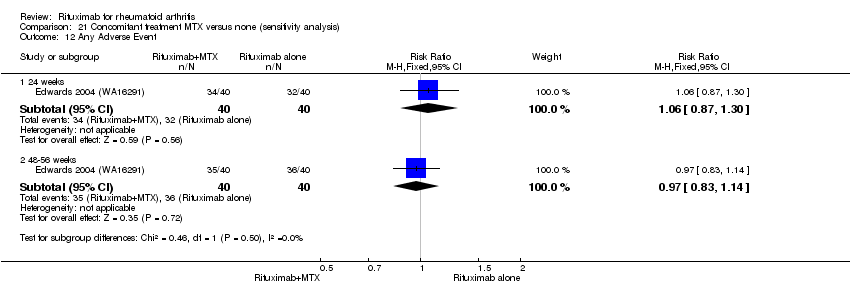
Comparison 21 Concomitant treatment MTX versus none (sensitivity analysis), Outcome 12 Any Adverse Event.
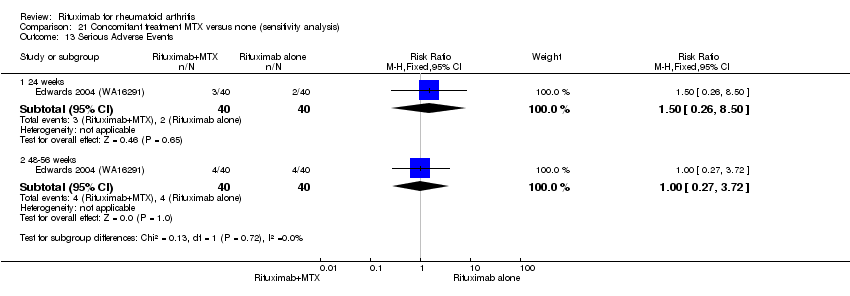
Comparison 21 Concomitant treatment MTX versus none (sensitivity analysis), Outcome 13 Serious Adverse Events.

Comparison 21 Concomitant treatment MTX versus none (sensitivity analysis), Outcome 14 Serious Infections.
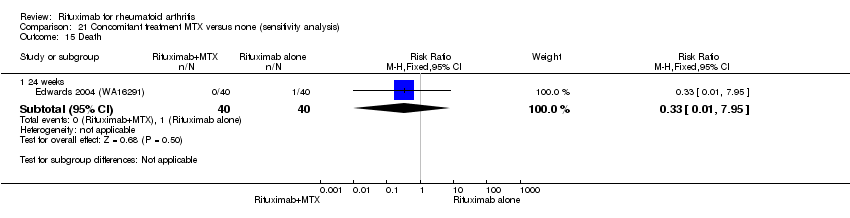
Comparison 21 Concomitant treatment MTX versus none (sensitivity analysis), Outcome 15 Death.

Comparison 21 Concomitant treatment MTX versus none (sensitivity analysis), Outcome 16 Any Event Associated with 1st Infusion.

Comparison 21 Concomitant treatment MTX versus none (sensitivity analysis), Outcome 17 Arthralgia.

Comparison 21 Concomitant treatment MTX versus none (sensitivity analysis), Outcome 18 Back pain.
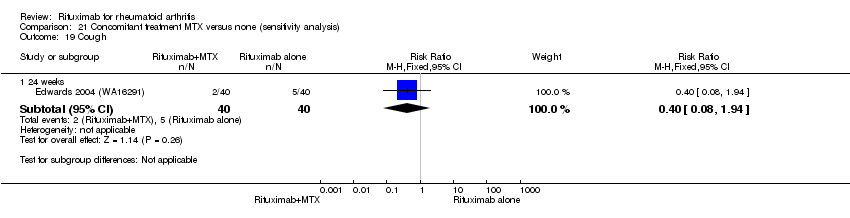
Comparison 21 Concomitant treatment MTX versus none (sensitivity analysis), Outcome 19 Cough.

Comparison 21 Concomitant treatment MTX versus none (sensitivity analysis), Outcome 20 Dyspnea.

Comparison 21 Concomitant treatment MTX versus none (sensitivity analysis), Outcome 21 Exacerbation of RA.
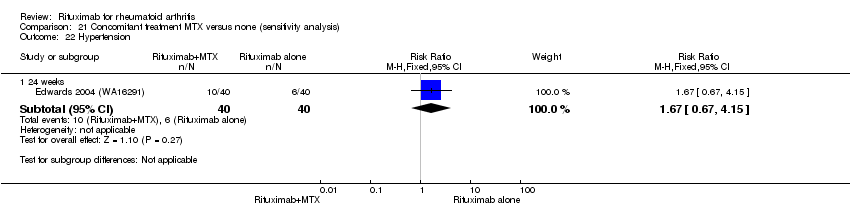
Comparison 21 Concomitant treatment MTX versus none (sensitivity analysis), Outcome 22 Hypertension.
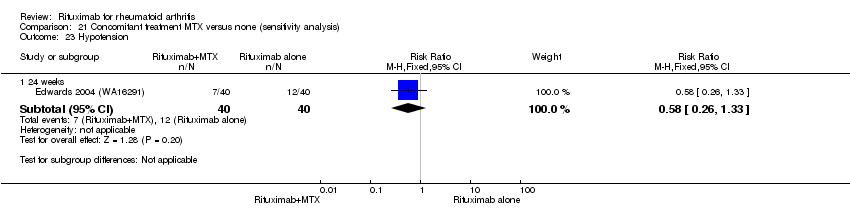
Comparison 21 Concomitant treatment MTX versus none (sensitivity analysis), Outcome 23 Hypotension.

Comparison 21 Concomitant treatment MTX versus none (sensitivity analysis), Outcome 24 Nasopharyngitis.

Comparison 21 Concomitant treatment MTX versus none (sensitivity analysis), Outcome 25 Nausea.

Comparison 21 Concomitant treatment MTX versus none (sensitivity analysis), Outcome 26 Pruritus.
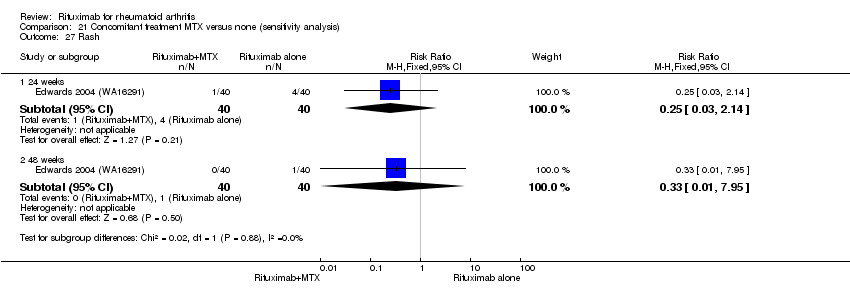
Comparison 21 Concomitant treatment MTX versus none (sensitivity analysis), Outcome 27 Rash.

Comparison 22 Concomitant treatment CTX versus none (sensitivity analysis), Outcome 1 ACR 20.

Comparison 22 Concomitant treatment CTX versus none (sensitivity analysis), Outcome 2 ACR 50.
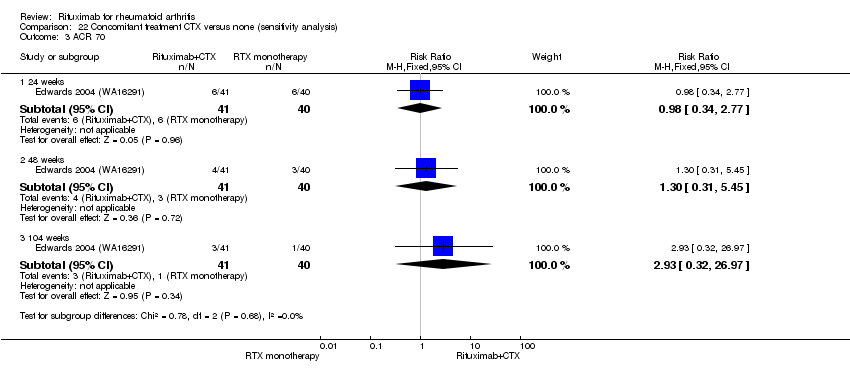
Comparison 22 Concomitant treatment CTX versus none (sensitivity analysis), Outcome 3 ACR 70.

Comparison 22 Concomitant treatment CTX versus none (sensitivity analysis), Outcome 4 DAS 28.

Comparison 22 Concomitant treatment CTX versus none (sensitivity analysis), Outcome 5 Moderate or good EULAR response.

Comparison 22 Concomitant treatment CTX versus none (sensitivity analysis), Outcome 6 HAQ‐DI.
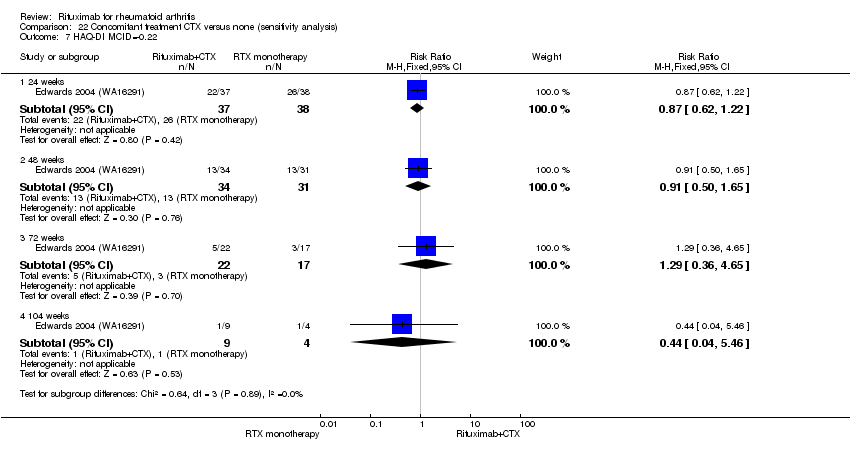
Comparison 22 Concomitant treatment CTX versus none (sensitivity analysis), Outcome 7 HAQ‐DI MCID=‐0.22.

Comparison 22 Concomitant treatment CTX versus none (sensitivity analysis), Outcome 8 Total discontinuations.
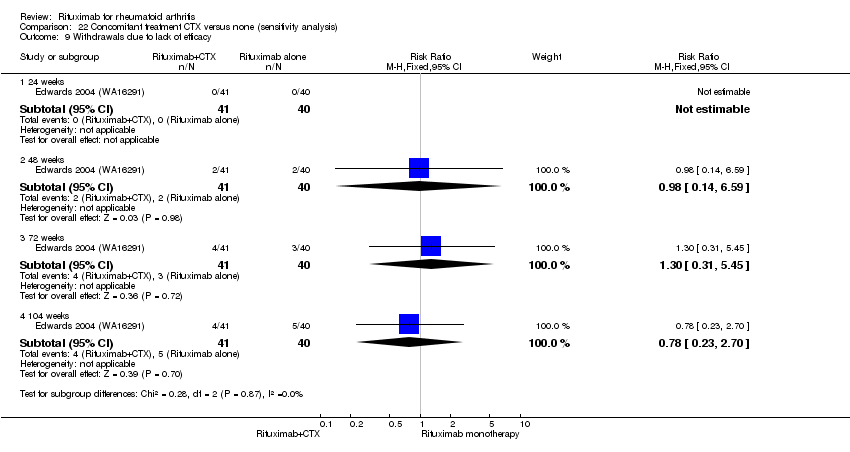
Comparison 22 Concomitant treatment CTX versus none (sensitivity analysis), Outcome 9 Withdrawals due to lack of efficacy.

Comparison 22 Concomitant treatment CTX versus none (sensitivity analysis), Outcome 10 Withdrawals due to adverse Events.

Comparison 22 Concomitant treatment CTX versus none (sensitivity analysis), Outcome 11 Withdrawals due to other reasons.
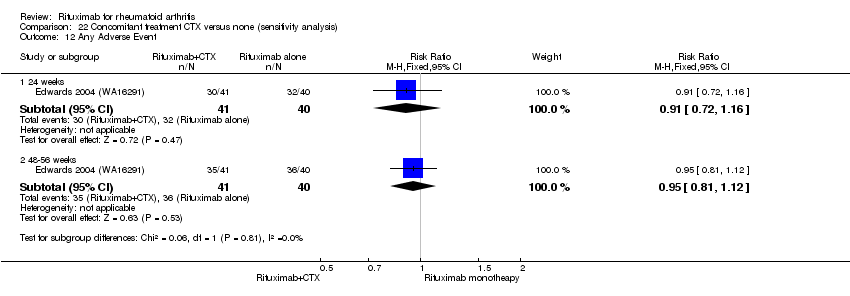
Comparison 22 Concomitant treatment CTX versus none (sensitivity analysis), Outcome 12 Any Adverse Event.
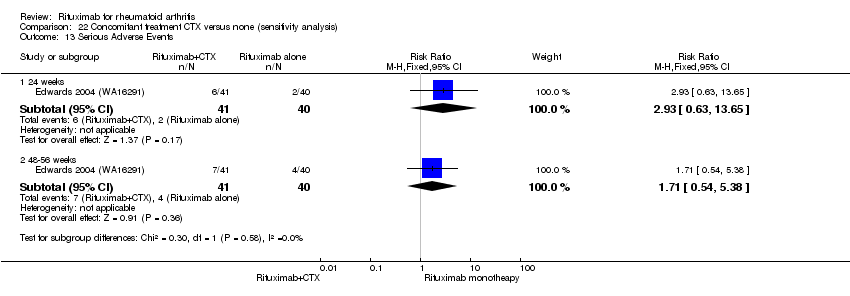
Comparison 22 Concomitant treatment CTX versus none (sensitivity analysis), Outcome 13 Serious Adverse Events.

Comparison 22 Concomitant treatment CTX versus none (sensitivity analysis), Outcome 14 Serious Infections.

Comparison 22 Concomitant treatment CTX versus none (sensitivity analysis), Outcome 15 Death.

Comparison 22 Concomitant treatment CTX versus none (sensitivity analysis), Outcome 16 Any Event Associated with 1st Infusion.
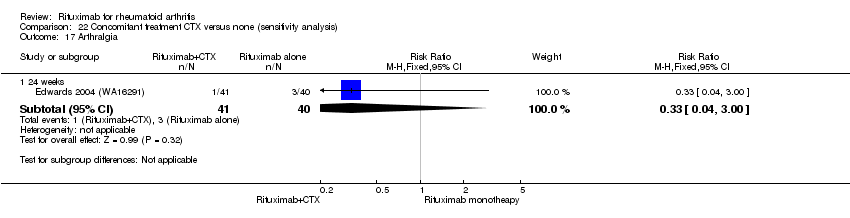
Comparison 22 Concomitant treatment CTX versus none (sensitivity analysis), Outcome 17 Arthralgia.

Comparison 22 Concomitant treatment CTX versus none (sensitivity analysis), Outcome 18 Back pain.

Comparison 22 Concomitant treatment CTX versus none (sensitivity analysis), Outcome 19 Cough.

Comparison 22 Concomitant treatment CTX versus none (sensitivity analysis), Outcome 20 Dyspnea.
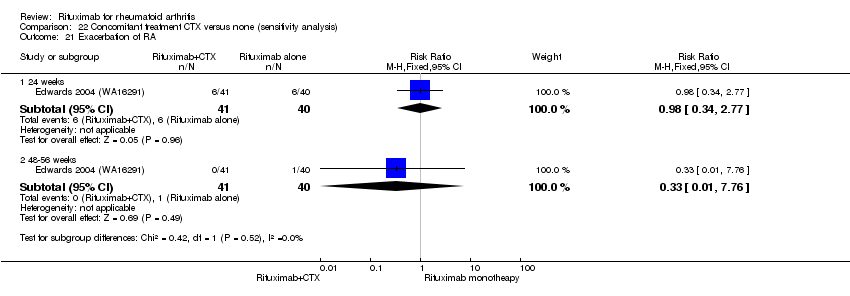
Comparison 22 Concomitant treatment CTX versus none (sensitivity analysis), Outcome 21 Exacerbation of RA.
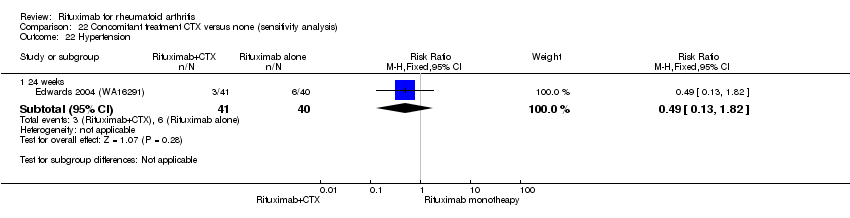
Comparison 22 Concomitant treatment CTX versus none (sensitivity analysis), Outcome 22 Hypertension.

Comparison 22 Concomitant treatment CTX versus none (sensitivity analysis), Outcome 23 Hypotension.

Comparison 22 Concomitant treatment CTX versus none (sensitivity analysis), Outcome 24 Nasopharyngitis.

Comparison 22 Concomitant treatment CTX versus none (sensitivity analysis), Outcome 25 Nausea.
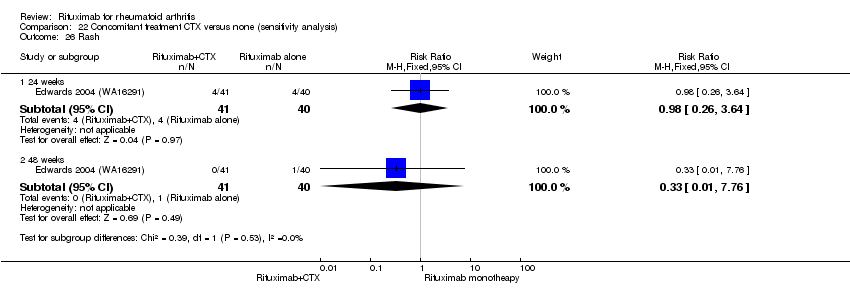
Comparison 22 Concomitant treatment CTX versus none (sensitivity analysis), Outcome 26 Rash.
| Rituximab (2 x 1000 mg) plus methotrexate compared to methotrexate monotherapy for rheumatoid arthritis | ||||||||
| Patient or population: patients with rheumatoid arthritis | ||||||||
| Outcomes | Follow‐up (weeks) | Illustrative comparative risks* (95% CI) | Relative effect | No of participants | Quality of the evidence | Comments | ||
| Assumed risk | Corresponding risk | |||||||
| Methotrexate monotherapy | Rituximab (2 x 1000 mg) plus methotrexate | |||||||
| Clinical improvement American College of Rheumatology 50% improvement criteria | 24 | 88 per 1000 | 286 per 1000 | RR 3.3 | 1165 | ⊕⊕⊕⊝ | Absolute treatment benefit 21% (95% CI 16% to 25%); Relative per cent change 225% (95% CI 131% to 358%); NNTB 6 (95% CI 9 to 4) | |
| 48 to 56 | 331 per 1000 | 742 per 1000 | RR 2.2 | 852 | ⊕⊕⊕⊝ | Absolute treatment benefit 24% (95% CI 18% to 30%); Relative per cent change 124% (95% CI 26% to 295%); NNTB 4 (95% CI 6 to 3) | ||
| 104 | 377 per 1000 | 562 per 1000 | RR 1.5 | 579 | ⊕⊕⊕⊝ | Absolute treatment benefit 17% (95% CI 8% to 27%); Relative per cent change 149% (95% CI 25% to 77%); NNTB 6 (95% CI 11 to 4) | ||
| Clinical remission (Disease Activity Score‐28 joint count < 2.6) (Scale from 2 to 10) | 24 | 11 per 1000 | 99 per 1000 | RR 9.1 | 834 | ⊕⊕⊕⊝ | Not statistically significant. Absolute treatment benefit 8% (95% CI 6% to 11%); Relative per cent change 809% (95% CI ‐24% to 1072%); NNTB N/A | |
| 48 to 52 | 112 per 1000 | 221 per 1000 | RR 2.4 | 772 | ⊕⊕⊕⊝ | Absolute treatment benefit 11% (95% CI 2% to 20%); Relative per cent change 142% (95% CI 70% to 246%); NNTB 7 (95% 13 CI to 4) | ||
| 104 | 129 per 1000 | 320 per 1000 | RR 2.5 | 499 | ⊕⊕⊕⊝ | Absolute treatment benefit 19% (95% CI 12% to 26%); Relative per cent change 149% (95% CI 72% to 261%); NNTB 6 (95% 11 CI to 3) | ||
| Physical function (HAQ‐DI MCID = ‐0.22) | 24 | 387 per 1000 | 623 per 1000 | RR 1.6 | 1161 | ⊕⊕⊕⊕ | Absolute treatment benefit 24% (95% CI 12% to 36%); Relative per cent change 61% (95% CI 22% to 112%); NNTB 5 (95% CI 13 to 3) | |
| 48 to 56 | 726 per 1000 | 1000 per 1000 | RR 1.6 | 562 | ⊕⊕⊕⊕ | Absolute treatment benefit 24% (95% CI ‐5% to 52%); Relative per cent change 57% (95% CI ‐29% to 244%); NNTB N/A | ||
| 72 | 200 per 1000 | 464 per 1000 | RR 2.3 | 43 | ⊕⊕⊕⊕ | Absolute treatment benefit 26% (95% CI ‐1% to 54%); Relative per cent change 132% (95% CI ‐22% to 589%); NNTB N/A | ||
| 104 | 608 per 1000 | 845 per 1000 | RR 1.4 | 523 | ⊕⊕⊕⊕ | Absolute treatment benefit 24% (95% CI 16% to 31%); Relative per cent change 39% (95% CI 25% to 55%); NNTB 5 (95% CI 7 to 3) | ||
| No radiographic progression in total Genant‐modified Sharp score (range 0 to 290) | 24 | 591 per 1000 | 697 per 1000 | RR 1.2 | 476 | ⊕⊕⊕⊝ | Absolute treatment benefit 11% (95% CI 2% to 19%); Relative per cent change 18% (95%CI 3% to 35%); NNTB 10 (95% CI 57 to 5) | |
| 56 | 500 per 1000 | 625 per 1000 | RR 1.3 | 940 | ⊕⊕⊕⊝ | Absolute treatment benefit 12% (95% CI 6% to 19%); Relative per cent change 25% (95%CI 11% to 40%); NNTB 8 (95% CI 19 to 5) | ||
| 104 | 379 per 1000 | 568 per 1000 | RR 1.5 | 945 | ⊕⊕⊕⊝ | Absolute treatment benefit 19% (95% CI 13% to 25%); Relative per cent change 50% (95%CI 30% to 73%); NNTB 6 (95% CI 9 to 4) | ||
| Health‐related quality of life | SF‐36 PCS MCID = ‐5 or 5.42 | 24 to 52 | 355 per 1000 | 697 per 1000 (405 to 1000) | RR 2.0 (1.1 to 3.4) | 1,526 (4 studies) | ⊕⊕⊕⊕ | Absolute treatment benefit 34% (95% CI 5% to 84%); Relative percent change 96% (95%CI 14% to 226%); NNTB 4 (95% CI 8 to 3) |
| SF‐36 MCS MCID = ‐5 or 6.33 | 24 to 52 | 345 per 1000 | 475 per 1000 (352 to 638) | RR 1.4 (1.1 to 1.9) | 1282 (3 studies) | ⊕⊕⊕⊕ | Absolute treatment benefit 13% (95% CI 7% to 18%); Relative per cent change 43% (95% CI 6% to 92%); NNTB 8 (95% CI 19 to 5) | |
| Discontinuations due to adverse events | 24 | 10 per 1000 | 21 per 1000 | RR 2.1 | 1385 | ⊕⊕⊕⊝ | Not statistically significant; Absolute risk difference 1% (95% CI 0% to 3%); Relative per cent change 107% (95% CI ‐12% to 388%); NNTH N/A | |
| 48‐52 | 24 per 1000 | 24 per 1000 | RR 1.0 | 927 | ⊕⊕⊕⊕ | Not statistically significant; Absolute risk difference 0% (95% CI ‐2% to 2%); Relative per cent change 0% (95% CI ‐56% to 129%); NNTH N/A | ||
| 72 | 75 per 1000 | 25 per 1000 | RR 0.33 | 80 | ⊕⊕⊕⊝ | Not statistically significant; Absolute risk difference ‐5% (95% CI ‐14% to 4%); Relative per cent change ‐67% (95% CI ‐96% to 207%); NNTH N/A | ||
| 104 | 55 per 1000 | 31 per 1000 | RR 0.56 | 579 | ⊕⊕⊕⊕ | Not statistically significant; Absolute risk difference ‐2% (95% CI ‐6% to 1%); Relative per cent change ‐44% (95% CI ‐45% to 25%); NNTH N/A | ||
| Serious adverse events | 24 | 75 per 1000 | 75 per 1000 | RR 1 | 1280 | ⊕⊕⊕⊝ | Not statistically significant; Absolute risk difference 0% (95% CI ‐3% to 3%); Relative per cent change 0% (95% CI ‐32% to 45%); NNTH N/A | |
| 48 to 56 | 103 per 1000 | 97 per 1000 | RR 0.94 | 579 | ⊕⊕⊕⊕ | Not statistically significant; Absolute risk difference ‐1% (95% CI ‐6% to 4%); Relative per cent change ‐6% (95% CI ‐43% to 53%); NNTH N/A | ||
| 104 | 169 per 1000 | 132 per 1000 | RR 0.78 | 499 | ⊕⊕⊕⊝ | Not statistically significant; Absolute risk difference ‐4% (95% CI ‐10% to 3%); Relative per cent change ‐22% (95% CI ‐49% to 19%); NNTH N/A | ||
| *The basis for the assumed risk (e.g. the median control group risk across studies) is provided in footnotes. The corresponding risk (and its 95% confidence interval) is based on the assumed risk in the comparison group and the relative effect of the intervention (and its 95% CI). | ||||||||
| GRADE Working Group grades of evidence | ||||||||
| 1 Only one study was graded as having low risk of bias | ||||||||
| Study | Arms | n | Age, mean + SD* | Females, % | Disease duration, mean years | Rheumatoid factor, mean IU/litre | Previous DMARDs, mean no | Prior anti‐TNFα treatment, % | MTX dose, mean mg/week |
| Cohen 2006 (REFLEX) | PBO + MTX | 209 | 52.8 ± 12.6 | 81 | 11.7 ± 7.7 | 317.4 ± 870.2 | 2.4 ± 1.8 | 90† | 16.7 ± 9.9 |
| RTX 2 (100 mg courses) + MTX | 308 | 52.2 ± 12.2 | 81 | 12.1 ± 8.3 | 324.3 ± 613.5 | 2.6 ± 1.8 | 92† | 16.4 ± 8.8 | |
| Edwards 2004 (WA16291) | PBO + MTX | 40 | 54 ± 11 | 80 | 11 ± 7 | ‐ | 2.6 ± 1.3 | ‐ | 12.5 to 15‡ |
| RTX 2 (100 mg courses) + MTX | 40 | 53 ± 10 | 75 | 12 ± 7 | ‐ | 2.5 ± 1.4 | ‐ | 12.5 to 15‡ | |
| RTX 2 (100 mg courses) | 40 | 54 ± 10 | 73 | 9 ± 6 | ‐ | 2.5 ± 1.6 | ‐ | 12.5 to 15‡ | |
| RTX 2 (100 mg courses) + CTX | 41 | 54 ± 12 | 83 | 10 ± 6 | ‐ | 2.6 ± 1.4 | ‐ | 12.5 to 15‡ | |
| Emery 2006 (DANCER) | PBO + MTX | 149 | 51.1 | 80 | 9.3 | 437 | 2.2 | 26 | 15.6 |
| RTX 2 (500 mg courses) + MTX | 124 | 51.4 | 83 | 11.1 | 421 | 2.5 | 33 | 16 | |
| RTX 2 (100 mg courses) + MTX | 192 | 51.1 | 80 | 10.8 | 437 | 2.5 | 28 | 14.9 | |
| Emery 2010 (SERENE) | PBO + MTX | 172 | 52.2 ± 12.4 | 85.5 | 7.5 ± 7.6 | 75.0% positive | 1.1 ± 1.1c | ‐ | 16.6 ± 4.3 |
| RTX 2 (500 mg courses) + MTX | 167 | 51.9 ± 12.9 | 79.6 | 7.1 ± 7.0 | 75.4% positive | 1.2 ± 1.3c | ‐ | 15.4 ± 4.0 | |
| RTX 2 (1000 mg courses) + MTX | 170 | 51.3 ± 12.6 | 81.2 | 6.6 ± 7.3 | 73.5% positive | 1.1 ± 1.1c | ‐ | 16.1 ± 4.3 | |
| Greenwald 2011 (TAME) | MTX + TNFi | 18 | 50.4 | 94 | 10.7 ± 7.5 | 178.6 ± 242.8 | ‐ | 100 | 17.5 ± 4.2 |
| RTX 2 (500 mg courses) + MTX + TNFi | 32 | 49.7 | 85 | 10.3 ± 6.7 | 341.9 ± 521.0 | ‐ | 97 | 16.1 ± 4.2 | |
| Owczarczyk 2008 | RTX | 20 | 55 ± 9 | ‐ | 12 ± 8 | 329 ± 724 | ‐ | 1.47 ± 1.17 | ‐ |
| RTX + MTX | 20 | 53 ± 12 | ‐ | 9 ± 9.6 | 479 ± 574 | ‐ | 0.45 ± 0.75 | ‐ | |
| Rubbert‐Roth 2010 (MIRROR) | RTX (500 mg courses) + MTX | 134 | 53.6 ± 12.8 | 82.1 | 9 + 7.4 | 235.5 ± 4.16 | 2.0 ± 1.5 | 27.6 | 15.2 ± 4.7 |
| RTX 2 (1000mg courses) + MTX | 93 | 51.3 ± 12.2 | 82.8 | 7.7 + 7.4 | 232.4 ± 366.1 | 1.8 ± 1.4 | 24.6 | 15.2 ± 4.7 | |
| Tak 2010 (IMAGE) | PBO + MTX | 249 | 48.1 ± 12.7 | 77 | 0.91 (1.1) | 87% positive | 70% DMARD‐naive | ‐ | ‐ |
| RTX 2 (500 mg courses) + MTX | 249 | 47.9 ± 13.4 | 82 | 0.99 (1.1) | 87% positive | 72% DMARD‐naive | ‐ | ‐ | |
| RTX 2 (1000 mg courses) + MTX | 250 | 47.9 ± 13.3 | 85 | 0.92 (1.3) | 85% positive | 69% DMARD‐naive | ‐ | ‐ | |
| *when reported †Inadequate efficacy of anti‐TNF agents (%) ‡ Median dose per week aPatients were followed 36 weeks in the group receiving rituximab plus MTX and 12 weeks in the group receiving MTX monotherapy bAn upper age limit of 65 years was used because of known attenuation of vaccine response in older patients cExcludes MTX DMARD = Disease Modifying Anti‐Rheumatic Drug; mg = milligrams; MTX = methotrexate; PBO = placebo; RTX = rituximab. | |||||||||
| Outcome or subgroup title | No. of studies | No. of participants | Statistical method | Effect size |
| 1 ACR20 Show forest plot | 5 | Risk Ratio (M‐H, Random, 95% CI) | Subtotals only | |
| 1.1 24 weeks | 4 | 1165 | Risk Ratio (M‐H, Random, 95% CI) | 2.24 [1.86, 2.69] |
| 1.2 48‐52 weeks | 4 | 852 | Risk Ratio (M‐H, Random, 95% CI) | 1.53 [1.09, 2.13] |
| 1.3 104 weeks | 2 | 579 | Risk Ratio (M‐H, Random, 95% CI) | 1.57 [0.82, 3.01] |
| 2 ACR 50 Show forest plot | 5 | Risk Ratio (M‐H, Random, 95% CI) | Subtotals only | |
| 2.1 24 weeks | 4 | 1165 | Risk Ratio (M‐H, Random, 95% CI) | 3.25 [2.31, 4.58] |
| 2.2 48‐56 weeks | 4 | 852 | Risk Ratio (M‐H, Random, 95% CI) | 2.24 [1.26, 3.95] |
| 2.3 104 weeks | 2 | 579 | Risk Ratio (M‐H, Random, 95% CI) | 1.49 [1.25, 1.77] |
| 3 ACR 70 Show forest plot | 5 | Risk Ratio (M‐H, Random, 95% CI) | Subtotals only | |
| 3.1 24 weeks | 4 | 1165 | Risk Ratio (M‐H, Random, 95% CI) | 3.91 [1.84, 8.31] |
| 3.2 48‐56 weeks | 4 | 852 | Risk Ratio (M‐H, Random, 95% CI) | 1.95 [1.53, 2.49] |
| 3.3 104 weeks | 2 | 579 | Risk Ratio (M‐H, Random, 95% CI) | 1.84 [1.44, 2.37] |
| 4 ACR 90 Show forest plot | 1 | Risk Ratio (M‐H, Fixed, 95% CI) | Subtotals only | |
| 4.1 52 weeks | 1 | 499 | Risk Ratio (M‐H, Fixed, 95% CI) | 1.81 [1.11, 2.96] |
| 4.2 104 weeks | 1 | 499 | Risk Ratio (M‐H, Fixed, 95% CI) | 1.81 [1.22, 2.68] |
| 5 DAS 28 Show forest plot | 5 | Mean Difference (IV, Random, 95% CI) | Subtotals only | |
| 5.1 24 weeks | 5 | 1661 | Mean Difference (IV, Random, 95% CI) | ‐1.20 [‐1.48, ‐0.92] |
| 5.2 48‐56 weeks | 1 | 499 | Mean Difference (IV, Random, 95% CI) | ‐1.15 [‐1.37, ‐0.93] |
| 5.3 104 weeks | 1 | 499 | Mean Difference (IV, Random, 95% CI) | ‐1.59 [‐1.81, ‐1.37] |
| 6 LDA (DAS28 =or<3.2) Show forest plot | 4 | Risk Ratio (M‐H, Random, 95% CI) | Subtotals only | |
| 6.1 24 weeks | 2 | 834 | Risk Ratio (M‐H, Random, 95% CI) | 4.23 [1.42, 12.56] |
| 6.2 48‐52 weeks | 3 | 772 | Risk Ratio (M‐H, Random, 95% CI) | 2.09 [1.60, 2.73] |
| 6.3 104 weeks | 1 | 499 | Risk Ratio (M‐H, Random, 95% CI) | 1.93 [1.50, 2.48] |
| 7 Clinical Remission (DAS28<2.6) Show forest plot | 4 | Risk Difference (M‐H, Random, 95% CI) | Subtotals only | |
| 7.1 24 weeks | 2 | 834 | Risk Difference (M‐H, Random, 95% CI) | 0.08 [0.06, 0.11] |
| 7.2 48‐52 weeks | 3 | 772 | Risk Difference (M‐H, Random, 95% CI) | 0.11 [0.02, 0.20] |
| 7.3 104 weeks | 1 | 499 | Risk Difference (M‐H, Random, 95% CI) | 0.19 [0.12, 0.26] |
| 8 Moderate or good EULAR response Show forest plot | 5 | Risk Ratio (M‐H, Random, 95% CI) | Subtotals only | |
| 8.1 24 weeks | 5 | 1664 | Risk Ratio (M‐H, Random, 95% CI) | 1.94 [1.55, 2.43] |
| 8.2 48 weeks | 1 | 499 | Risk Ratio (M‐H, Random, 95% CI) | 2.32 [1.72, 3.14] |
| 8.3 104 weeks | 2 | 579 | Risk Ratio (M‐H, Random, 95% CI) | 2.05 [1.59, 2.64] |
| 9 HAQ‐DI Show forest plot | 4 | Mean Difference (IV, Fixed, 95% CI) | Subtotals only | |
| 9.1 24 weeks | 4 | 1318 | Mean Difference (IV, Fixed, 95% CI) | ‐0.24 [‐0.30, ‐0.18] |
| 9.2 48‐52 weeks | 2 | 562 | Mean Difference (IV, Fixed, 95% CI) | ‐0.29 [‐0.38, ‐0.20] |
| 9.3 72 weeks | 1 | 43 | Mean Difference (IV, Fixed, 95% CI) | ‐0.3 [‐0.64, 0.04] |
| 9.4 104 weeks | 1 | 499 | Mean Difference (IV, Fixed, 95% CI) | ‐0.44 [‐0.54, ‐0.34] |
| 10 HAQ‐DI MCID=‐0.22 Show forest plot | 5 | Risk Ratio (M‐H, Random, 95% CI) | Subtotals only | |
| 10.1 24 weeks | 4 | 1161 | Risk Ratio (M‐H, Random, 95% CI) | 1.61 [1.22, 2.12] |
| 10.2 48‐56 weeks | 2 | 562 | Risk Ratio (M‐H, Random, 95% CI) | 1.57 [0.71, 3.44] |
| 10.3 72 weeks | 1 | 43 | Risk Ratio (M‐H, Random, 95% CI) | 2.32 [0.78, 6.89] |
| 10.4 104 weeks | 2 | 523 | Risk Ratio (M‐H, Random, 95% CI) | 1.39 [1.25, 1.55] |
| 11 SF‐36 PCS Show forest plot | 4 | 1393 | Mean Difference (IV, Fixed, 95% CI) | ‐4.11 [‐4.98, ‐3.25] |
| 11.1 24 weeks | 3 | 912 | Mean Difference (IV, Fixed, 95% CI) | ‐4.44 [‐5.52, ‐3.36] |
| 11.2 52 weeks | 1 | 481 | Mean Difference (IV, Fixed, 95% CI) | ‐3.53 [‐4.97, ‐2.09] |
| 12 SF‐36 PCS (=or>MCID of 5 or 5.42) Show forest plot | 4 | 1526 | Risk Ratio (M‐H, Random, 95% CI) | 1.96 [1.14, 3.36] |
| 12.1 24 weeks | 3 | 1045 | Risk Ratio (M‐H, Random, 95% CI) | 2.32 [1.41, 3.84] |
| 12.2 52 weeks | 1 | 481 | Risk Ratio (M‐H, Random, 95% CI) | 1.21 [1.07, 1.36] |
| 13 SF‐36 MCS Show forest plot | 4 | 1393 | Mean Difference (IV, Fixed, 95% CI) | ‐2.22 [‐3.52, ‐0.92] |
| 13.1 24 weeks | 3 | 912 | Mean Difference (IV, Fixed, 95% CI) | ‐2.44 [‐4.05, ‐0.82] |
| 13.2 52 weeks | 1 | 481 | Mean Difference (IV, Fixed, 95% CI) | ‐1.81 [‐4.02, 0.39] |
| 14 SF‐36 MCS (=or>MCID of 5 or 6.33) Show forest plot | 3 | 1282 | Odds Ratio (M‐H, Random, 95% CI) | 1.75 [1.27, 2.42] |
| 14.1 24 weeks | 2 | 801 | Odds Ratio (M‐H, Random, 95% CI) | 2.07 [1.50, 2.84] |
| 14.2 52 weeks | 1 | 481 | Odds Ratio (M‐H, Random, 95% CI) | 1.38 [0.97, 1.98] |
| 15 FACIT‐F Show forest plot | 4 | 1570 | Mean Difference (IV, Random, 95% CI) | ‐5.22 [‐7.71, ‐2.74] |
| 15.1 24 weeks | 3 | 1081 | Mean Difference (IV, Random, 95% CI) | ‐5.84 [‐8.81, ‐2.88] |
| 15.2 52 weeks | 1 | 489 | Mean Difference (IV, Random, 95% CI) | ‐3.45 [‐5.33, ‐1.57] |
| 16 FACIT‐F MCID>= 4or 3.56 Show forest plot | 3 | 1232 | Risk Ratio (M‐H, Random, 95% CI) | 1.59 [1.00, 2.53] |
| 16.1 24 weeks | 2 | 743 | Risk Ratio (M‐H, Random, 95% CI) | 1.95 [1.65, 2.30] |
| 16.2 52 weeks | 1 | 489 | Risk Ratio (M‐H, Random, 95% CI) | 1.11 [0.99, 1.24] |
| 17 VAS‐pain Show forest plot | 3 | 1238 | Mean Difference (IV, Random, 95% CI) | ‐13.89 [‐21.31, ‐6.48] |
| 17.1 24 weeks | 2 | 743 | Mean Difference (IV, Random, 95% CI) | ‐14.57 [‐27.37, ‐1.77] |
| 17.2 52 weeks | 1 | 495 | Mean Difference (IV, Random, 95% CI) | ‐12.2 [‐16.87, ‐7.53] |
| 18 Total radiographic score Show forest plot | 2 | Mean Difference (IV, Fixed, 95% CI) | Subtotals only | |
| 18.1 24 weeks | 2 | 975 | Mean Difference (IV, Fixed, 95% CI) | ‐0.48 [‐0.83, ‐0.13] |
| 18.2 48‐56 weeks | 2 | 932 | Mean Difference (IV, Fixed, 95% CI) | ‐0.87 [‐1.29, ‐0.45] |
| 18.3 104 weeks | 2 | 945 | Mean Difference (IV, Fixed, 95% CI) | ‐1.57 [‐1.99, ‐1.16] |
| 19 Joint Space Narrowing Show forest plot | 2 | Mean Difference (IV, Fixed, 95% CI) | Subtotals only | |
| 19.1 24 weeks | 2 | 975 | Mean Difference (IV, Fixed, 95% CI) | ‐0.20 [‐0.35, ‐0.04] |
| 19.2 48‐56 weeks | 1 | 456 | Mean Difference (IV, Fixed, 95% CI) | ‐0.58 [‐0.98, ‐0.18] |
| 19.3 104 weeks | 2 | 944 | Mean Difference (IV, Fixed, 95% CI) | ‐0.48 [‐0.67, ‐0.29] |
| 20 Radiologic erosions Show forest plot | 2 | Mean Difference (IV, Fixed, 95% CI) | Subtotals only | |
| 20.1 24 weeks | 2 | 975 | Mean Difference (IV, Fixed, 95% CI) | ‐0.33 [‐0.55, ‐0.11] |
| 20.2 48‐56 weeks | 2 | 932 | Mean Difference (IV, Fixed, 95% CI) | ‐0.56 [‐0.83, ‐0.30] |
| 20.3 104 weeks | 2 | 945 | Mean Difference (IV, Fixed, 95% CI) | ‐1.09 [‐1.35, ‐0.83] |
| 21 No radiographic progression Show forest plot | 2 | Risk Ratio (M‐H, Fixed, 95% CI) | Subtotals only | |
| 21.1 24 weeks | 1 | 476 | Risk Ratio (M‐H, Fixed, 95% CI) | 1.18 [1.03, 1.35] |
| 21.2 52‐56 weeks | 2 | 940 | Risk Ratio (M‐H, Fixed, 95% CI) | 1.25 [1.11, 1.40] |
| 21.3 104 weeks | 2 | 945 | Risk Ratio (M‐H, Fixed, 95% CI) | 1.50 [1.30, 1.73] |
| 22 No worsening of erosions Show forest plot | 2 | Risk Ratio (M‐H, Fixed, 95% CI) | Subtotals only | |
| 22.1 24 weeks | 1 | 445 | Risk Ratio (M‐H, Fixed, 95% CI) | 1.10 [0.95, 1.27] |
| 22.2 52‐56 weeks | 1 | 464 | Risk Ratio (M‐H, Fixed, 95% CI) | 1.29 [1.09, 1.52] |
| 22.3 104 weeks | 2 | 945 | Risk Ratio (M‐H, Fixed, 95% CI) | 1.45 [1.27, 1.67] |
| Outcome or subgroup title | No. of studies | No. of participants | Statistical method | Effect size |
| 1 ACR 20 Show forest plot | 1 | Risk Ratio (M‐H, Fixed, 95% CI) | Totals not selected | |
| 1.1 24 weeks | 1 | Risk Ratio (M‐H, Fixed, 95% CI) | 0.0 [0.0, 0.0] | |
| 1.2 48 weeks | 1 | Risk Ratio (M‐H, Fixed, 95% CI) | 0.0 [0.0, 0.0] | |
| 1.3 104 weeks | 1 | Risk Ratio (M‐H, Fixed, 95% CI) | 0.0 [0.0, 0.0] | |
| 2 ACR 50 Show forest plot | 1 | Risk Ratio (M‐H, Fixed, 95% CI) | Totals not selected | |
| 2.1 24 weeks | 1 | Risk Ratio (M‐H, Fixed, 95% CI) | 0.0 [0.0, 0.0] | |
| 2.2 48‐56 weeks | 1 | Risk Ratio (M‐H, Fixed, 95% CI) | 0.0 [0.0, 0.0] | |
| 2.3 104 weeks | 1 | Risk Ratio (M‐H, Fixed, 95% CI) | 0.0 [0.0, 0.0] | |
| 3 ACR 70 Show forest plot | 1 | Risk Ratio (M‐H, Fixed, 95% CI) | Totals not selected | |
| 3.1 24 weeks | 1 | Risk Ratio (M‐H, Fixed, 95% CI) | 0.0 [0.0, 0.0] | |
| 3.2 48‐56 weeks | 1 | Risk Ratio (M‐H, Fixed, 95% CI) | 0.0 [0.0, 0.0] | |
| 3.3 104 weeks | 1 | Risk Ratio (M‐H, Fixed, 95% CI) | 0.0 [0.0, 0.0] | |
| 4 DAS 28 Show forest plot | 1 | Mean Difference (IV, Fixed, 95% CI) | Subtotals only | |
| 4.1 24 weeks | 1 | 80 | Mean Difference (IV, Fixed, 95% CI) | ‐0.9 [‐1.47, ‐0.33] |
| 5 Moderate or good EULAR response Show forest plot | 1 | Risk Ratio (M‐H, Fixed, 95% CI) | Subtotals only | |
| 5.1 24 weeks | 1 | 80 | Risk Ratio (M‐H, Fixed, 95% CI) | 1.7 [1.21, 2.38] |
| 6 HAQ‐DI Show forest plot | 1 | Mean Difference (IV, Fixed, 95% CI) | Subtotals only | |
| 6.1 24 weeks | 1 | 75 | Mean Difference (IV, Fixed, 95% CI) | ‐0.4 [‐0.65, ‐0.15] |
| 6.2 48 weeks | 1 | 56 | Mean Difference (IV, Fixed, 95% CI) | ‐0.20 [‐0.49, 0.09] |
| 6.3 72 weeks | 1 | 32 | Mean Difference (IV, Fixed, 95% CI) | ‐0.3 [‐0.68, 0.08] |
| 7 % of patients achieving HAQ‐DI MCID=‐0.25 Show forest plot | 1 | Risk Ratio (M‐H, Fixed, 95% CI) | Subtotals only | |
| 7.1 24 weeks | 1 | 75 | Risk Ratio (M‐H, Fixed, 95% CI) | 1.49 [0.99, 2.25] |
| 7.2 48‐56 weeks | 1 | 56 | Risk Ratio (M‐H, Fixed, 95% CI) | 1.50 [0.71, 3.18] |
| 7.3 72 weeks | 1 | 32 | Risk Ratio (M‐H, Fixed, 95% CI) | 0.88 [0.21, 3.73] |
| 7.4 104 weeks | 1 | 10 | Risk Ratio (M‐H, Fixed, 95% CI) | 1.50 [0.13, 17.67] |
| Outcome or subgroup title | No. of studies | No. of participants | Statistical method | Effect size |
| 1 ACR 20 Show forest plot | 3 | Risk Difference (M‐H, Fixed, 95% CI) | Subtotals only | |
| 1.1 24 weeks | 2 | 584 | Risk Difference (M‐H, Fixed, 95% CI) | 0.30 [0.22, 0.37] |
| 1.2 48‐52 weeks | 2 | 598 | Risk Difference (M‐H, Fixed, 95% CI) | 0.14 [0.07, 0.21] |
| 1.3 104 weeks | 1 | 498 | Risk Difference (M‐H, Fixed, 95% CI) | 0.16 [0.08, 0.25] |
| 2 ACR 50 Show forest plot | 3 | Risk Ratio (M‐H, Fixed, 95% CI) | Subtotals only | |
| 2.1 24 weeks | 2 | 584 | Risk Ratio (M‐H, Fixed, 95% CI) | 2.69 [1.85, 3.90] |
| 2.2 48‐52 weeks | 2 | 598 | Risk Ratio (M‐H, Fixed, 95% CI) | 1.47 [1.23, 1.74] |
| 2.3 104 weeks | 1 | 498 | Risk Ratio (M‐H, Fixed, 95% CI) | 1.42 [1.19, 1.69] |
| 3 ACR 70 Show forest plot | 3 | Risk Ratio (M‐H, Random, 95% CI) | Subtotals only | |
| 3.1 24 weeks | 2 | 584 | Risk Ratio (M‐H, Random, 95% CI) | 2.07 [1.14, 3.77] |
| 3.2 48‐52 weeks | 2 | 598 | Risk Ratio (M‐H, Random, 95% CI) | 1.42 [0.71, 2.86] |
| 3.3 104 weeks | 1 | 498 | Risk Ratio (M‐H, Random, 95% CI) | 1.69 [1.31, 2.20] |
| 4 ACR 90 Show forest plot | 1 | Risk Ratio (M‐H, Fixed, 95% CI) | Totals not selected | |
| 4.1 52 weeks | 1 | Risk Ratio (M‐H, Fixed, 95% CI) | 0.0 [0.0, 0.0] | |
| 4.2 104 weeks | 1 | Risk Ratio (M‐H, Fixed, 95% CI) | 0.0 [0.0, 0.0] | |
| 5 DAS 28 Show forest plot | 3 | Mean Difference (IV, Fixed, 95% CI) | Subtotals only | |
| 5.1 24 weeks | 3 | 1079 | Mean Difference (IV, Fixed, 95% CI) | ‐0.96 [‐1.11, ‐0.81] |
| 5.2 52 weeks | 1 | 498 | Mean Difference (IV, Fixed, 95% CI) | ‐0.99 [‐1.21, ‐0.77] |
| 5.3 104 weeks | 1 | 498 | Mean Difference (IV, Fixed, 95% CI) | ‐1.59 [‐1.81, ‐1.37] |
| 6 LDA (DAS28 =or<3.2) Show forest plot | 3 | Risk Ratio (M‐H, Fixed, 95% CI) | Subtotals only | |
| 6.1 24 weeks | 1 | 339 | Risk Ratio (M‐H, Fixed, 95% CI) | 3.73 [1.76, 7.93] |
| 6.2 48‐52 weeks | 2 | 598 | Risk Ratio (M‐H, Fixed, 95% CI) | 1.94 [1.48, 2.56] |
| 6.3 104 weeks | 1 | 498 | Risk Ratio (M‐H, Fixed, 95% CI) | 1.81 [1.40, 2.33] |
| 7 Clinical Remission (DAS28<2.6) Show forest plot | 3 | Risk Ratio (M‐H, Fixed, 95% CI) | Subtotals only | |
| 7.1 24 weeks | 1 | 498 | Risk Ratio (M‐H, Fixed, 95% CI) | 4.0 [1.36, 11.80] |
| 7.2 48 weeks | 2 | 598 | Risk Ratio (M‐H, Fixed, 95% CI) | 2.03 [1.40, 2.96] |
| 7.3 104 weeks | 1 | 498 | Risk Ratio (M‐H, Fixed, 95% CI) | 2.66 [1.84, 3.83] |
| 8 Moderate or good EULAR response Show forest plot | 3 | Risk Ratio (M‐H, Fixed, 95% CI) | Subtotals only | |
| 8.1 24 weeks | 3 | 1082 | Risk Ratio (M‐H, Fixed, 95% CI) | 1.85 [1.58, 2.17] |
| 8.2 52 weeks | 1 | 498 | Risk Ratio (M‐H, Fixed, 95% CI) | 2.11 [1.56, 2.86] |
| 8.3 104 weeks | 1 | 498 | Risk Ratio (M‐H, Fixed, 95% CI) | 1.93 [1.48, 2.52] |
| 9 HAQ‐DI Show forest plot | 2 | Mean Difference (IV, Fixed, 95% CI) | Subtotals only | |
| 9.1 24 weeks | 2 | 742 | Mean Difference (IV, Fixed, 95% CI) | ‐0.22 [‐0.30, ‐0.14] |
| 9.2 52 weeks | 1 | 498 | Mean Difference (IV, Fixed, 95% CI) | ‐0.28 [‐0.37, ‐0.18] |
| 9.3 104 weeks | 1 | 498 | Mean Difference (IV, Fixed, 95% CI) | ‐0.34 [‐0.44, ‐0.24] |
| 10 HAQ‐DI MCID=‐0.22 Show forest plot | 3 | Risk Ratio (M‐H, Random, 95% CI) | Subtotals only | |
| 10.1 24 weeks | 2 | 582 | Risk Ratio (M‐H, Random, 95% CI) | 1.58 [1.18, 2.11] |
| 10.2 52 weeks | 1 | 498 | Risk Ratio (M‐H, Random, 95% CI) | 1.13 [1.04, 1.22] |
| 10.3 104 weeks | 1 | 498 | Risk Ratio (M‐H, Random, 95% CI) | 1.36 [1.21, 1.52] |
| 11 SF‐36 PCS Show forest plot | 3 | 1018 | Mean Difference (IV, Fixed, 95% CI) | ‐3.52 [‐4.49, ‐2.56] |
| 11.1 24 weeks | 2 | 543 | Mean Difference (IV, Fixed, 95% CI) | ‐4.07 [‐5.36, ‐2.78] |
| 11.2 52 weeks | 1 | 475 | Mean Difference (IV, Fixed, 95% CI) | ‐2.84 [‐4.29, ‐1.39] |
| 12 SF‐36 PCS (=or>MCID of 5 or 5.42) Show forest plot | 3 | 1018 | Risk Ratio (M‐H, Random, 95% CI) | 1.53 [0.98, 2.39] |
| 12.1 24 weeks | 2 | 543 | Risk Ratio (M‐H, Random, 95% CI) | 1.84 [1.21, 2.80] |
| 12.2 52 weeks | 1 | 475 | Risk Ratio (M‐H, Random, 95% CI) | 1.11 [0.97, 1.26] |
| 13 SF‐36 MCS Show forest plot | 3 | 1021 | Mean Difference (IV, Fixed, 95% CI) | ‐1.81 [‐3.25, ‐0.36] |
| 13.1 24 weeks | 2 | 546 | Mean Difference (IV, Fixed, 95% CI) | ‐2.16 [‐4.07, ‐0.25] |
| 13.2 52 weeks | 1 | 475 | Mean Difference (IV, Fixed, 95% CI) | ‐1.33 [‐3.55, 0.88] |
| 14 SF‐36 MCS (=or>MCID of 6.33) Show forest plot | 2 | 774 | Risk Ratio (M‐H, Random, 95% CI) | 1.16 [0.87, 1.55] |
| 14.1 24 weeks | 1 | 299 | Risk Ratio (M‐H, Random, 95% CI) | 1.41 [0.98, 2.03] |
| 14.2 52 weeks | 1 | 475 | Risk Ratio (M‐H, Random, 95% CI) | 1.04 [0.87, 1.24] |
| 15 FACIT‐F Show forest plot | 3 | 1063 | Mean Difference (IV, Fixed, 95% CI) | ‐3.09 [‐4.35, ‐1.83] |
| 15.1 24 weeks | 2 | 580 | Mean Difference (IV, Fixed, 95% CI) | ‐3.54 [‐5.23, ‐1.85] |
| 15.2 52 weeks | 1 | 483 | Mean Difference (IV, Fixed, 95% CI) | ‐2.53 [‐4.42, ‐0.64] |
| 16 FACIT‐F (= or > MCID of 3.5 or 4) Show forest plot | 1 | Risk Ratio (M‐H, Fixed, 95% CI) | Subtotals only | |
| 16.1 24 weeks | 1 | 245 | Risk Ratio (M‐H, Fixed, 95% CI) | 1.57 [1.18, 2.09] |
| 17 VAS pain Show forest plot | 2 | 739 | Mean Difference (IV, Fixed, 95% CI) | ‐8.30 [‐12.25, ‐4.35] |
| 17.1 24 weeks | 1 | 245 | Mean Difference (IV, Fixed, 95% CI) | ‐8.1 [‐14.96, ‐1.24] |
| 17.2 52 weeks | 1 | 494 | Mean Difference (IV, Fixed, 95% CI) | ‐8.40 [‐13.23, ‐3.57] |
| 18 Total radiographic score Show forest plot | 1 | Mean Difference (IV, Fixed, 95% CI) | Subtotals only | |
| 18.1 24 weeks | 1 | 471 | Mean Difference (IV, Fixed, 95% CI) | ‐0.12 [‐0.61, 0.37] |
| 18.2 52 weeks | 1 | 471 | Mean Difference (IV, Fixed, 95% CI) | ‐0.43 [‐0.92, 0.06] |
| 18.3 104 weeks | 1 | 472 | Mean Difference (IV, Fixed, 95% CI) | ‐1.19 [‐1.68, ‐0.70] |
| 19 Joint Space Narrowing Show forest plot | 1 | Mean Difference (IV, Fixed, 95% CI) | Subtotals only | |
| 19.1 104 weeks | 1 | 472 | Mean Difference (IV, Fixed, 95% CI) | ‐0.37 [‐0.59, ‐0.15] |
| 20 Radiologic erosions Show forest plot | 1 | Mean Difference (IV, Fixed, 95% CI) | Subtotals only | |
| 20.1 52 weeks | 1 | 471 | Mean Difference (IV, Fixed, 95% CI) | ‐0.29 [‐0.59, 0.02] |
| 20.2 104 weeks | 1 | 472 | Mean Difference (IV, Fixed, 95% CI) | ‐0.82 [‐1.13, ‐0.51] |
| 21 No radiographic progression Show forest plot | 1 | Risk Ratio (M‐H, Fixed, 95% CI) | Subtotals only | |
| 21.1 24 weeks | 1 | 472 | Risk Ratio (M‐H, Fixed, 95% CI) | 1.33 [1.07, 1.64] |
| 22 No increase in erosion score Show forest plot | 1 | Risk Ratio (M‐H, Fixed, 95% CI) | Subtotals only | |
| 22.1 24 weeks | 1 | 472 | Risk Ratio (M‐H, Fixed, 95% CI) | 1.39 [1.14, 1.70] |
| Outcome or subgroup title | No. of studies | No. of participants | Statistical method | Effect size |
| 1 ACR 20 Show forest plot | 1 | Risk Ratio (M‐H, Fixed, 95% CI) | Subtotals only | |
| 1.1 24 weeks | 1 | 81 | Risk Ratio (M‐H, Fixed, 95% CI) | 2.02 [1.30, 3.12] |
| 1.2 48 weeks | 1 | 81 | Risk Ratio (M‐H, Fixed, 95% CI) | 2.44 [1.22, 4.89] |
| 1.3 104 weeks | 1 | 81 | Risk Ratio (M‐H, Fixed, 95% CI) | 0.98 [0.31, 3.11] |
| 2 ACR 50 Show forest plot | 1 | Risk Ratio (M‐H, Fixed, 95% CI) | Subtotals only | |
| 2.1 24 weeks | 1 | 81 | Risk Ratio (M‐H, Fixed, 95% CI) | 3.32 [1.35, 8.13] |
| 2.2 48 weeks | 1 | 81 | Risk Ratio (M‐H, Fixed, 95% CI) | 4.88 [1.14, 20.89] |
| 2.3 104 weeks | 1 | 81 | Risk Ratio (M‐H, Fixed, 95% CI) | 0.98 [0.26, 3.64] |
| 3 ACR 70 Show forest plot | 1 | Risk Ratio (M‐H, Fixed, 95% CI) | Subtotals only | |
| 3.1 24 weeks | 1 | 81 | Risk Ratio (M‐H, Fixed, 95% CI) | 2.93 [0.63, 13.65] |
| 3.2 48 weeks | 1 | 81 | Risk Ratio (M‐H, Fixed, 95% CI) | 8.79 [0.49, 158.07] |
| 3.3 104 weeks | 1 | 81 | Risk Ratio (M‐H, Fixed, 95% CI) | 0.98 [0.21, 4.55] |
| 4 DAS 28 Show forest plot | 1 | Mean Difference (IV, Fixed, 95% CI) | Subtotals only | |
| 4.1 24 weeks | 1 | 81 | Mean Difference (IV, Fixed, 95% CI) | ‐1.3 [‐1.89, ‐0.71] |
| 5 Moderate or good EULAR response Show forest plot | 1 | Risk Ratio (M‐H, Fixed, 95% CI) | Subtotals only | |
| 5.1 24 weeks | 1 | 81 | Risk Ratio (M‐H, Fixed, 95% CI) | 1.71 [1.22, 2.39] |
| 6 HAQ‐DI Show forest plot | 1 | Mean Difference (IV, Fixed, 95% CI) | Subtotals only | |
| 6.1 24 weeks | 1 | 74 | Mean Difference (IV, Fixed, 95% CI) | ‐0.20 [‐0.48, 0.08] |
| 6.2 48 weeks | 1 | 59 | Mean Difference (IV, Fixed, 95% CI) | 0.0 [‐0.31, 0.31] |
| 6.3 72 weeks | 1 | 37 | Mean Difference (IV, Fixed, 95% CI) | 0.20 [‐0.19, 0.59] |
| 7 HAQ‐DI MCID=‐0.22 Show forest plot | 1 | Risk Ratio (M‐H, Fixed, 95% CI) | Subtotals only | |
| 7.1 24 weeks | 1 | 74 | Risk Ratio (M‐H, Fixed, 95% CI) | 1.29 [0.83, 2.01] |
| 7.2 48‐56 weeks | 1 | 59 | Risk Ratio (M‐H, Fixed, 95% CI) | 1.37 [0.64, 2.92] |
| 7.3 72 weeks | 1 | 37 | Risk Ratio (M‐H, Fixed, 95% CI) | 1.14 [0.32, 4.05] |
| 7.4 104 weeks | 1 | 15 | Risk Ratio (M‐H, Fixed, 95% CI) | 0.67 [0.05, 8.73] |
| Outcome or subgroup title | No. of studies | No. of participants | Statistical method | Effect size |
| 1 ACR 20 Show forest plot | 1 | Risk Ratio (M‐H, Fixed, 95% CI) | Subtotals only | |
| 1.1 24 weeks | 1 | 51 | Risk Ratio (M‐H, Fixed, 95% CI) | 1.82 [0.57, 5.77] |
| 2 ACR 50 Show forest plot | 1 | Risk Ratio (M‐H, Fixed, 95% CI) | Subtotals only | |
| 2.1 24 weeks | 1 | 45 | Risk Ratio (M‐H, Fixed, 95% CI) | 1.45 [0.18, 11.75] |
| 3 LDA (DAS28 =or<3.2) Show forest plot | 1 | Risk Ratio (M‐H, Fixed, 95% CI) | Subtotals only | |
| 3.1 24 weeks | 1 | 51 | Risk Ratio (M‐H, Fixed, 95% CI) | 2.18 [0.52, 9.20] |
| 4 Clinical Remission (DAS28<2.6) Show forest plot | 1 | Risk Ratio (M‐H, Fixed, 95% CI) | Subtotals only | |
| 4.1 24 weeks | 1 | 51 | Risk Ratio (M‐H, Fixed, 95% CI) | 3.27 [0.43, 25.11] |
| 5 HAQ‐DI MCID=‐0.25 Show forest plot | 1 | Risk Ratio (M‐H, Fixed, 95% CI) | Subtotals only | |
| 5.1 24 weeks | 1 | 51 | Risk Ratio (M‐H, Fixed, 95% CI) | 3.82 [1.59, 9.17] |
| Outcome or subgroup title | No. of studies | No. of participants | Statistical method | Effect size |
| 1 Total discontinuations Show forest plot | 5 | Risk Ratio (M‐H, Random, 95% CI) | Subtotals only | |
| 1.1 24 weeks | 4 | 1282 | Risk Ratio (M‐H, Random, 95% CI) | 0.40 [0.32, 0.50] |
| 1.2 48‐52 weeks | 4 | 1444 | Risk Ratio (M‐H, Random, 95% CI) | 0.61 [0.40, 0.91] |
| 1.3 72 weeks | 1 | 80 | Risk Ratio (M‐H, Random, 95% CI) | 0.48 [0.28, 0.82] |
| 1.4 104 weeks | 2 | 579 | Risk Ratio (M‐H, Random, 95% CI) | 0.58 [0.45, 0.75] |
| 2 Lack of efficacy Show forest plot | 5 | Risk Ratio (M‐H, Fixed, 95% CI) | Subtotals only | |
| 2.1 24 weeks | 4 | 1282 | Risk Ratio (M‐H, Fixed, 95% CI) | 0.30 [0.23, 0.39] |
| 2.2 48‐52 weeks | 3 | 927 | Risk Ratio (M‐H, Fixed, 95% CI) | 0.15 [0.06, 0.36] |
| 2.3 72 weeks | 1 | 80 | Risk Ratio (M‐H, Fixed, 95% CI) | 0.44 [0.15, 1.33] |
| 2.4 104 weeks | 1 | 80 | Risk Ratio (M‐H, Fixed, 95% CI) | 0.24 [0.09, 0.64] |
| 3 Adverse Events Show forest plot | 5 | Risk Ratio (M‐H, Fixed, 95% CI) | Subtotals only | |
| 3.1 24 weeks | 4 | 1282 | Risk Ratio (M‐H, Fixed, 95% CI) | 2.72 [1.04, 7.13] |
| 3.2 48‐52 weeks | 3 | 927 | Risk Ratio (M‐H, Fixed, 95% CI) | 1.00 [0.44, 2.29] |
| 3.3 72 weeks | 1 | 80 | Risk Ratio (M‐H, Fixed, 95% CI) | 0.33 [0.04, 3.07] |
| 3.4 104 weeks | 2 | 579 | Risk Ratio (M‐H, Fixed, 95% CI) | 0.56 [0.25, 1.25] |
| 4 Other reasons Show forest plot | 5 | Risk Ratio (M‐H, Fixed, 95% CI) | Subtotals only | |
| 4.1 24 weeks | 4 | 1282 | Risk Ratio (M‐H, Fixed, 95% CI) | 0.76 [0.32, 1.81] |
| 4.2 48‐52 weeks | 3 | 927 | Risk Ratio (M‐H, Fixed, 95% CI) | 0.84 [0.47, 1.49] |
| 4.3 72 weeks | 1 | 80 | Risk Ratio (M‐H, Fixed, 95% CI) | 0.54 [0.24, 1.21] |
| 4.4 104 weeks | 1 | 80 | Risk Ratio (M‐H, Fixed, 95% CI) | 1.31 [0.74, 2.32] |
| Outcome or subgroup title | No. of studies | No. of participants | Statistical method | Effect size |
| 1 Total discontinuations Show forest plot | 1 | Risk Ratio (M‐H, Fixed, 95% CI) | Subtotals only | |
| 1.1 24 weeks | 1 | 80 | Risk Ratio (M‐H, Fixed, 95% CI) | 0.67 [0.12, 3.78] |
| 1.2 48 weeks | 1 | 80 | Risk Ratio (M‐H, Fixed, 95% CI) | 0.6 [0.30, 1.21] |
| 1.3 72 weeks | 1 | 80 | Risk Ratio (M‐H, Fixed, 95% CI) | 0.92 [0.64, 1.32] |
| 1.4 104 weeks | 1 | 80 | Risk Ratio (M‐H, Fixed, 95% CI) | 1.06 [0.90, 1.25] |
| 2 Lack of efficacy Show forest plot | 1 | Risk Ratio (M‐H, Fixed, 95% CI) | Subtotals only | |
| 2.1 24 weeks | 1 | 80 | Risk Ratio (M‐H, Fixed, 95% CI) | 0.2 [0.01, 4.04] |
| 2.2 48 weeks | 1 | 80 | Risk Ratio (M‐H, Fixed, 95% CI) | 0.29 [0.06, 1.29] |
| 2.3 72 weeks | 1 | 80 | Risk Ratio (M‐H, Fixed, 95% CI) | 0.33 [0.10, 1.14] |
| 2.4 104 weeks | 1 | 80 | Risk Ratio (M‐H, Fixed, 95% CI) | 0.29 [0.12, 0.72] |
| 3 Adverse Events Show forest plot | 1 | Risk Ratio (M‐H, Fixed, 95% CI) | Subtotals only | |
| 3.1 24 weeks | 1 | 80 | Risk Ratio (M‐H, Fixed, 95% CI) | 2.0 [0.19, 21.18] |
| 3.2 48 weeks | 1 | 80 | Risk Ratio (M‐H, Fixed, 95% CI) | 1.33 [0.32, 5.58] |
| 3.3 72 weeks | 1 | 80 | Risk Ratio (M‐H, Fixed, 95% CI) | 1.67 [0.43, 6.51] |
| 3.4 104 weeks | 1 | 80 | Risk Ratio (M‐H, Fixed, 95% CI) | 1.25 [0.36, 4.32] |
| 4 Other reasons Show forest plot | 1 | Risk Ratio (M‐H, Fixed, 95% CI) | Subtotals only | |
| 4.1 24 weeks | 1 | 80 | Risk Ratio (M‐H, Fixed, 95% CI) | 0.0 [0.0, 0.0] |
| 4.2 48 weeks | 1 | 80 | Risk Ratio (M‐H, Fixed, 95% CI) | 0.6 [0.15, 2.34] |
| 4.3 72 weeks | 1 | 80 | Risk Ratio (M‐H, Fixed, 95% CI) | 1.15 [0.63, 2.10] |
| 4.4 104 weeks | 1 | 80 | Risk Ratio (M‐H, Fixed, 95% CI) | 2.0 [1.21, 3.30] |
| Outcome or subgroup title | No. of studies | No. of participants | Statistical method | Effect size |
| 1 Total discontinuations Show forest plot | 3 | Risk Ratio (M‐H, Fixed, 95% CI) | Subtotals only | |
| 1.1 24 weeks | 2 | 613 | Risk Ratio (M‐H, Fixed, 95% CI) | 0.30 [0.18, 0.50] |
| 1.2 48‐52 weeks | 2 | 844 | Risk Ratio (M‐H, Fixed, 95% CI) | 0.64 [0.43, 0.94] |
| 1.3 104 weeks | 1 | 498 | Risk Ratio (M‐H, Fixed, 95% CI) | 0.51 [0.36, 0.73] |
| 2 Lack of efficacy Show forest plot | 3 | Risk Ratio (M‐H, Fixed, 95% CI) | Subtotals only | |
| 2.1 24 weeks | 2 | 613 | Risk Ratio (M‐H, Fixed, 95% CI) | 0.20 [0.10, 0.39] |
| 2.2 48‐52 weeks | 2 | 844 | Risk Ratio (M‐H, Fixed, 95% CI) | 0.37 [0.19, 0.73] |
| 3 Adverse Events Show forest plot | 3 | Risk Ratio (M‐H, Fixed, 95% CI) | Subtotals only | |
| 3.1 24 weeks | 2 | 613 | Risk Ratio (M‐H, Fixed, 95% CI) | 2.40 [0.56, 10.36] |
| 3.2 48‐52 weeks | 2 | 844 | Risk Ratio (M‐H, Fixed, 95% CI) | 0.76 [0.27, 2.16] |
| 3.3 104 weeks | 1 | 498 | Risk Ratio (M‐H, Fixed, 95% CI) | 0.83 [0.37, 1.89] |
| 4 Other reasons Show forest plot | 3 | Risk Ratio (M‐H, Random, 95% CI) | Subtotals only | |
| 4.1 24 weeks | 2 | 613 | Risk Ratio (M‐H, Random, 95% CI) | 0.37 [0.05, 2.99] |
| 4.2 48‐52 weeks | 2 | 844 | Risk Ratio (M‐H, Random, 95% CI) | 1.00 [0.54, 1.87] |
| Outcome or subgroup title | No. of studies | No. of participants | Statistical method | Effect size |
| 1 Total discontinuations Show forest plot | 1 | Risk Ratio (M‐H, Fixed, 95% CI) | Subtotals only | |
| 1.1 24 weeks | 1 | 81 | Risk Ratio (M‐H, Fixed, 95% CI) | 1.30 [0.31, 5.45] |
| 1.2 48 weeks | 1 | 81 | Risk Ratio (M‐H, Fixed, 95% CI) | 0.46 [0.21, 1.00] |
| 1.3 72 weeks | 1 | 81 | Risk Ratio (M‐H, Fixed, 95% CI) | 0.74 [0.49, 1.11] |
| 1.4 104 weeks | 1 | 81 | Risk Ratio (M‐H, Fixed, 95% CI) | 0.92 [0.75, 1.13] |
| 2 Lack of efficacy Show forest plot | 1 | Risk Ratio (M‐H, Fixed, 95% CI) | Subtotals only | |
| 2.1 24 weeks | 1 | 81 | Risk Ratio (M‐H, Fixed, 95% CI) | 0.20 [0.01, 3.94] |
| 2.2 48 weeks | 1 | 81 | Risk Ratio (M‐H, Fixed, 95% CI) | 0.28 [0.06, 1.26] |
| 2.3 72 weeks | 1 | 81 | Risk Ratio (M‐H, Fixed, 95% CI) | 0.43 [0.15, 1.30] |
| 2.4 104 weeks | 1 | 81 | Risk Ratio (M‐H, Fixed, 95% CI) | 0.23 [0.08, 0.62] |
| 3 Adverse Events Show forest plot | 1 | Risk Ratio (M‐H, Fixed, 95% CI) | Subtotals only | |
| 3.1 24 weeks | 1 | 81 | Risk Ratio (M‐H, Fixed, 95% CI) | 1.95 [0.18, 20.68] |
| 3.2 48 weeks | 1 | 81 | Risk Ratio (M‐H, Fixed, 95% CI) | 0.65 [0.11, 3.69] |
| 3.3 72 weeks | 1 | 81 | Risk Ratio (M‐H, Fixed, 95% CI) | 1.30 [0.31, 5.45] |
| 3.4 104 weeks | 1 | 81 | Risk Ratio (M‐H, Fixed, 95% CI) | 0.98 [0.26, 3.64] |
| 4 Other reasons Show forest plot | 1 | Risk Ratio (M‐H, Fixed, 95% CI) | Subtotals only | |
| 4.1 24 weeks | 1 | 81 | Risk Ratio (M‐H, Fixed, 95% CI) | 4.88 [0.24, 98.60] |
| 4.2 48 weeks | 1 | 81 | Risk Ratio (M‐H, Fixed, 95% CI) | 0.59 [0.15, 2.29] |
| 4.3 72 weeks | 1 | 81 | Risk Ratio (M‐H, Fixed, 95% CI) | 0.83 [0.42, 1.62] |
| 4.4 104 weeks | 1 | 81 | Risk Ratio (M‐H, Fixed, 95% CI) | 1.88 [1.13, 3.12] |
| Outcome or subgroup title | No. of studies | No. of participants | Statistical method | Effect size |
| 1 Total discontinuations Show forest plot | 1 | Risk Ratio (M‐H, Fixed, 95% CI) | Subtotals only | |
| 1.1 24 weeks | 1 | 54 | Risk Ratio (M‐H, Fixed, 95% CI) | 2.57 [0.13, 50.83] |
| 2 Adverse events Show forest plot | 1 | Risk Ratio (M‐H, Fixed, 95% CI) | Subtotals only | |
| 2.1 24 weeks | 1 | 54 | Risk Ratio (M‐H, Fixed, 95% CI) | 2.57 [0.13, 50.83] |
| Outcome or subgroup title | No. of studies | No. of participants | Statistical method | Effect size |
| 1 Any Adverse Event Show forest plot | 5 | Risk Ratio (M‐H, Random, 95% CI) | Subtotals only | |
| 1.1 24 weeks | 4 | 1280 | Risk Ratio (M‐H, Random, 95% CI) | 1.06 [0.95, 1.18] |
| 1.2 48‐56 weeks | 2 | 579 | Risk Ratio (M‐H, Random, 95% CI) | 0.99 [0.91, 1.07] |
| 1.3 104 weeks | 1 | 499 | Risk Ratio (M‐H, Random, 95% CI) | 1.01 [0.94, 1.08] |
| 2 Serious Adverse Events Show forest plot | 5 | Risk Ratio (M‐H, Fixed, 95% CI) | Subtotals only | |
| 2.1 24 weeks | 4 | 1280 | Risk Ratio (M‐H, Fixed, 95% CI) | 1.01 [0.69, 1.49] |
| 2.2 48‐56 weeks | 2 | 579 | Risk Ratio (M‐H, Fixed, 95% CI) | 0.94 [0.57, 1.53] |
| 2.3 104 weeks | 1 | 499 | Risk Ratio (M‐H, Fixed, 95% CI) | 0.78 [0.51, 1.19] |
| 3 Infections Show forest plot | 3 | Risk Ratio (M‐H, Random, 95% CI) | Subtotals only | |
| 3.1 24 weeks | 2 | 683 | Risk Ratio (M‐H, Random, 95% CI) | 1.01 [0.68, 1.48] |
| 3.2 52 weeks | 1 | 499 | Risk Ratio (M‐H, Random, 95% CI) | 1.04 [0.88, 1.24] |
| 3.3 104 weeks | 1 | 499 | Risk Ratio (M‐H, Random, 95% CI) | 1.09 [0.95, 1.26] |
| 4 Serious infections Show forest plot | 4 | 1841 | Risk Ratio (M‐H, Fixed, 95% CI) | 0.68 [0.42, 1.10] |
| 4.1 24 weeks | 3 | 763 | Risk Ratio (M‐H, Fixed, 95% CI) | 0.78 [0.27, 2.25] |
| 4.2 48‐56 weeks | 2 | 579 | Risk Ratio (M‐H, Fixed, 95% CI) | 0.71 [0.31, 1.59] |
| 4.3 104 weeks | 1 | 499 | Risk Ratio (M‐H, Fixed, 95% CI) | 0.63 [0.31, 1.27] |
| 5 Death Show forest plot | 5 | Risk Difference (M‐H, Fixed, 95% CI) | Subtotals only | |
| 5.1 24 weeks | 4 | 1280 | Risk Difference (M‐H, Fixed, 95% CI) | ‐0.00 [‐0.01, 0.01] |
| 5.2 52 weeks | 1 | 499 | Risk Difference (M‐H, Fixed, 95% CI) | ‐0.01 [‐0.03, 0.00] |
| 5.3 104 weeks | 1 | 499 | Risk Difference (M‐H, Fixed, 95% CI) | ‐0.01 [‐0.02, 0.01] |
| 6 Arthralgia Show forest plot | 3 | Risk Ratio (M‐H, Fixed, 95% CI) | Subtotals only | |
| 6.1 24 weeks | 3 | 938 | Risk Ratio (M‐H, Fixed, 95% CI) | 1.33 [0.76, 2.34] |
| 7 Cardiac event (any) Show forest plot | 1 | Risk Ratio (M‐H, Fixed, 95% CI) | Subtotals only | |
| 7.1 52 weeks | 1 | 499 | Risk Ratio (M‐H, Fixed, 95% CI) | 2.68 [0.72, 9.98] |
| 8 Cardiac event (serious) Show forest plot | 1 | Risk Ratio (M‐H, Fixed, 95% CI) | Subtotals only | |
| 8.1 52 weeks | 1 | 499 | Risk Ratio (M‐H, Fixed, 95% CI) | 7.03 [0.36, 135.36] |
| 9 Cough Show forest plot | 2 | Risk Ratio (M‐H, Random, 95% CI) | Subtotals only | |
| 9.1 24 weeks | 2 | 597 | Risk Ratio (M‐H, Random, 95% CI) | 1.06 [0.17, 6.49] |
| 10 Diarrhea Show forest plot | 2 | Risk Ratio (M‐H, Fixed, 95% CI) | Subtotals only | |
| 10.1 24 weeks | 2 | 858 | Risk Ratio (M‐H, Fixed, 95% CI) | 0.71 [0.41, 1.22] |
| 11 Exacerbation of RA Show forest plot | 4 | Risk Ratio (M‐H, Fixed, 95% CI) | Subtotals only | |
| 11.1 24 weeks | 3 | 938 | Risk Ratio (M‐H, Fixed, 95% CI) | 0.46 [0.37, 0.58] |
| 11.2 48‐56 weeks | 2 | 579 | Risk Ratio (M‐H, Fixed, 95% CI) | 2.01 [0.18, 22.00] |
| 12 Fatigue Show forest plot | 2 | Risk Ratio (M‐H, Fixed, 95% CI) | Subtotals only | |
| 12.1 24 weeks | 2 | 858 | Risk Ratio (M‐H, Fixed, 95% CI) | 1.03 [0.59, 1.79] |
| 13 HACA Show forest plot | 3 | Risk Ratio (M‐H, Random, 95% CI) | Subtotals only | |
| 13.1 24 weeks | 3 | 1200 | Risk Ratio (M‐H, Random, 95% CI) | 3.17 [0.76, 13.25] |
| 14 Headache Show forest plot | 2 | Risk Ratio (M‐H, Fixed, 95% CI) | Subtotals only | |
| 14.1 24 weeks | 2 | 858 | Risk Ratio (M‐H, Fixed, 95% CI) | 0.89 [0.60, 1.34] |
| 15 Hypertension Show forest plot | 3 | Risk Ratio (M‐H, Fixed, 95% CI) | Subtotals only | |
| 15.1 24 weeks | 3 | 938 | Risk Ratio (M‐H, Fixed, 95% CI) | 1.59 [0.96, 2.61] |
| 16 Infusion‐related reactions (1st course ‐1st infusion) Show forest plot | 5 | Risk Ratio (M‐H, Fixed, 95% CI) | Subtotals only | |
| 16.1 24 weeks | 4 | 1280 | Risk Ratio (M‐H, Fixed, 95% CI) | 1.59 [1.29, 1.96] |
| 16.2 52 weeks | 1 | 499 | Risk Ratio (M‐H, Fixed, 95% CI) | 1.49 [0.98, 2.27] |
| 16.3 104 weeks | 1 | 499 | Risk Ratio (M‐H, Fixed, 95% CI) | 1.48 [0.97, 2.25] |
| 17 Infusion‐related reaction (1st course ‐2nd infusion) Show forest plot | 2 | Risk Ratio (M‐H, Fixed, 95% CI) | Subtotals only | |
| 17.1 24 weeks | 2 | 761 | Risk Ratio (M‐H, Fixed, 95% CI) | 0.79 [0.52, 1.22] |
| 18 Infusion‐related reaction (2nd course) Show forest plot | 1 | Risk Ratio (M‐H, Fixed, 95% CI) | Subtotals only | |
| 18.1 52 weeks | 1 | 499 | Risk Ratio (M‐H, Fixed, 95% CI) | 1.10 [0.62, 1.97] |
| 18.2 104 weeks | 1 | 499 | Risk Ratio (M‐H, Fixed, 95% CI) | 1.00 [0.56, 1.78] |
| 19 Infusion‐related reaction (3rd course) Show forest plot | 1 | Risk Ratio (M‐H, Fixed, 95% CI) | Subtotals only | |
| 19.1 52 weeks | 1 | 499 | Risk Ratio (M‐H, Fixed, 95% CI) | 1.29 [0.49, 3.41] |
| 19.2 104 weeks | 1 | 499 | Risk Ratio (M‐H, Fixed, 95% CI) | 1.20 [0.53, 2.72] |
| 20 Infusion‐related reaction (4th course) Show forest plot | 1 | Risk Ratio (M‐H, Fixed, 95% CI) | Subtotals only | |
| 20.1 104 weeks | 1 | 499 | Risk Ratio (M‐H, Fixed, 95% CI) | 0.80 [0.32, 1.99] |
| 21 Infusion‐related reaction (5th course) Show forest plot | 1 | Risk Ratio (M‐H, Fixed, 95% CI) | Subtotals only | |
| 21.1 104 weeks | 1 | 499 | Risk Ratio (M‐H, Fixed, 95% CI) | 1.49 [0.25, 8.86] |
| 22 Lower gastrointestinal events Show forest plot | 2 | Risk Ratio (M‐H, Fixed, 95% CI) | Subtotals only | |
| 22.1 24 weeks | 2 | 683 | Risk Ratio (M‐H, Fixed, 95% CI) | 0.74 [0.43, 1.26] |
| 23 Malignancy Show forest plot | 5 | Risk Ratio (M‐H, Fixed, 95% CI) | Subtotals only | |
| 23.1 24 weeks | 3 | 1175 | Risk Ratio (M‐H, Fixed, 95% CI) | 0.87 [0.16, 4.63] |
| 23.2 48‐56 weeks | 2 | 579 | Risk Ratio (M‐H, Fixed, 95% CI) | 0.20 [0.02, 1.71] |
| 23.3 104 weeks | 1 | 499 | Risk Ratio (M‐H, Fixed, 95% CI) | 0.43 [0.11, 1.63] |
| 24 Nasopharyngitis Show forest plot | 3 | Risk Ratio (M‐H, Fixed, 95% CI) | Subtotals only | |
| 24.1 24 weeks | 3 | 938 | Risk Ratio (M‐H, Fixed, 95% CI) | 1.07 [0.66, 1.74] |
| 25 Nausea Show forest plot | 3 | Risk Ratio (M‐H, Fixed, 95% CI) | Subtotals only | |
| 25.1 24 weeks | 3 | 938 | Risk Ratio (M‐H, Fixed, 95% CI) | 0.86 [0.52, 1.43] |
| 26 Pyrexia Show forest plot | 1 | Risk Ratio (M‐H, Fixed, 95% CI) | Subtotals only | |
| 26.1 24 weeks | 1 | 517 | Risk Ratio (M‐H, Fixed, 95% CI) | 1.45 [0.60, 3.50] |
| 27 Upper respiratory tract infection Show forest plot | 2 | 1016 | Risk Ratio (M‐H, Fixed, 95% CI) | 1.09 [0.60, 1.97] |
| 27.1 24 weeks | 1 | 517 | Risk Ratio (M‐H, Fixed, 95% CI) | 1.16 [0.62, 2.20] |
| 27.2 52 weeks | 1 | 499 | Risk Ratio (M‐H, Fixed, 95% CI) | 0.67 [0.11, 3.97] |
| 28 Urinary tract infection Show forest plot | 3 | 1357 | Risk Ratio (M‐H, Random, 95% CI) | 0.61 [0.29, 1.28] |
| 28.1 24 weeks | 2 | 858 | Risk Ratio (M‐H, Random, 95% CI) | 0.65 [0.27, 1.56] |
| 28.2 52 weeks | 1 | 499 | Risk Ratio (M‐H, Random, 95% CI) | 0.20 [0.01, 4.16] |
| 29 Vascular disorders Show forest plot | 4 | 1262 | Risk Ratio (M‐H, Fixed, 95% CI) | 1.54 [1.00, 2.38] |
| 29.1 24 weeks | 3 | 763 | Risk Ratio (M‐H, Fixed, 95% CI) | 1.90 [1.03, 3.51] |
| 29.2 52 weeks | 1 | 499 | Risk Ratio (M‐H, Fixed, 95% CI) | 1.24 [0.67, 2.29] |
| Outcome or subgroup title | No. of studies | No. of participants | Statistical method | Effect size |
| 1 Any Adverse Event Show forest plot | 1 | Risk Ratio (M‐H, Fixed, 95% CI) | Subtotals only | |
| 1.1 24 weeks | 1 | 80 | Risk Ratio (M‐H, Fixed, 95% CI) | 1.0 [0.80, 1.24] |
| 1.2 48 weeks | 1 | 80 | Risk Ratio (M‐H, Fixed, 95% CI) | 1.06 [0.90, 1.25] |
| 2 Serious Adverse Events Show forest plot | 1 | Risk Ratio (M‐H, Fixed, 95% CI) | Subtotals only | |
| 2.1 24 weeks | 1 | 80 | Risk Ratio (M‐H, Fixed, 95% CI) | 0.67 [0.12, 3.78] |
| 2.2 48 weeks | 1 | 80 | Risk Ratio (M‐H, Fixed, 95% CI) | 1.0 [0.27, 3.72] |
| 3 Serious Infections Show forest plot | 1 | Risk Ratio (M‐H, Fixed, 95% CI) | Subtotals only | |
| 3.1 24 weeks | 1 | 80 | Risk Ratio (M‐H, Fixed, 95% CI) | 2.0 [0.19, 21.18] |
| 3.2 48‐56 weeks | 1 | 80 | Risk Ratio (M‐H, Fixed, 95% CI) | 3.0 [0.13, 71.51] |
| 4 Death Show forest plot | 1 | Risk Ratio (M‐H, Fixed, 95% CI) | Subtotals only | |
| 4.1 24 weeks | 1 | 80 | Risk Ratio (M‐H, Fixed, 95% CI) | 3.0 [0.13, 71.51] |
| 5 Any Event Associated with 1st Infusion Show forest plot | 1 | Risk Ratio (M‐H, Fixed, 95% CI) | Subtotals only | |
| 5.1 24 weeks | 1 | 80 | Risk Ratio (M‐H, Fixed, 95% CI) | 1.5 [0.84, 2.69] |
| 6 Arthralgia Show forest plot | 1 | Risk Ratio (M‐H, Fixed, 95% CI) | Subtotals only | |
| 6.1 24 weeks | 1 | 80 | Risk Ratio (M‐H, Fixed, 95% CI) | 1.0 [0.21, 4.66] |
| 7 Back pain Show forest plot | 1 | Risk Ratio (M‐H, Fixed, 95% CI) | Subtotals only | |
| 7.1 24 weeks | 1 | 80 | Risk Ratio (M‐H, Fixed, 95% CI) | 2.0 [0.39, 10.31] |
| 8 Cough Show forest plot | 1 | Peto Odds Ratio (Peto, Fixed, 95% CI) | Subtotals only | |
| 8.1 24 weeks | 1 | 80 | Peto Odds Ratio (Peto, Fixed, 95% CI) | 8.22 [1.36, 49.69] |
| 9 Dyspnea Show forest plot | 1 | Risk Ratio (M‐H, Fixed, 95% CI) | Subtotals only | |
| 9.1 24 weeks | 1 | 80 | Risk Ratio (M‐H, Fixed, 95% CI) | 9.0 [0.50, 161.86] |
| 10 Exacerbation of RA Show forest plot | 1 | Risk Ratio (M‐H, Fixed, 95% CI) | Subtotals only | |
| 10.1 24 weeks | 1 | 80 | Risk Ratio (M‐H, Fixed, 95% CI) | 0.38 [0.16, 0.86] |
| 10.2 48‐56 weeks | 1 | 80 | Risk Ratio (M‐H, Fixed, 95% CI) | 3.0 [0.13, 71.51] |
| 11 Hypertension Show forest plot | 1 | Risk Ratio (M‐H, Fixed, 95% CI) | Subtotals only | |
| 11.1 24 weeks | 1 | 80 | Risk Ratio (M‐H, Fixed, 95% CI) | 1.0 [0.35, 2.84] |
| 12 Hypotension Show forest plot | 1 | Risk Ratio (M‐H, Fixed, 95% CI) | Subtotals only | |
| 12.1 24 weeks | 1 | 80 | Risk Ratio (M‐H, Fixed, 95% CI) | 1.71 [0.75, 3.90] |
| 13 Nasopharyngitis Show forest plot | 1 | Risk Ratio (M‐H, Fixed, 95% CI) | Subtotals only | |
| 13.1 24 weeks | 1 | 80 | Risk Ratio (M‐H, Fixed, 95% CI) | 0.67 [0.20, 2.18] |
| 14 Nausea Show forest plot | 1 | Risk Ratio (M‐H, Fixed, 95% CI) | Subtotals only | |
| 14.1 24 weeks | 1 | 80 | Risk Ratio (M‐H, Fixed, 95% CI) | 2.0 [0.19, 21.18] |
| 15 Rash Show forest plot | 1 | Risk Ratio (M‐H, Fixed, 95% CI) | Subtotals only | |
| 15.1 24 weeks | 1 | 80 | Risk Ratio (M‐H, Fixed, 95% CI) | 4.0 [0.47, 34.24] |
| Outcome or subgroup title | No. of studies | No. of participants | Statistical method | Effect size |
| 1 Any Adverse Event Show forest plot | 3 | Risk Ratio (M‐H, Fixed, 95% CI) | Subtotals only | |
| 1.1 24 weeks | 2 | 612 | Risk Ratio (M‐H, Fixed, 95% CI) | 1.08 [0.99, 1.18] |
| 1.2 52 weeks | 1 | 499 | Risk Ratio (M‐H, Fixed, 95% CI) | 0.93 [0.85, 1.02] |
| 1.3 104 weeks | 1 | 498 | Risk Ratio (M‐H, Fixed, 95% CI) | 0.96 [0.89, 1.03] |
| 2 Serious Adverse Events Show forest plot | 3 | Risk Ratio (M‐H, Random, 95% CI) | Subtotals only | |
| 2.1 24 weeks | 2 | 612 | Risk Ratio (M‐H, Random, 95% CI) | 1.02 [0.16, 6.45] |
| 2.2 52 weeks | 1 | 499 | Risk Ratio (M‐H, Random, 95% CI) | 0.89 [0.52, 1.51] |
| 2.3 104 weeks | 1 | 498 | Risk Ratio (M‐H, Random, 95% CI) | 0.88 [0.59, 1.32] |
| 3 Infections Show forest plot | 3 | Risk Ratio (M‐H, Fixed, 95% CI) | Subtotals only | |
| 3.1 24 weeks | 2 | 612 | Risk Ratio (M‐H, Fixed, 95% CI) | 1.05 [0.86, 1.29] |
| 3.2 52 weeks | 1 | 499 | Risk Ratio (M‐H, Fixed, 95% CI) | 1.03 [0.86, 1.22] |
| 3.3 104 weeks | 1 | 498 | Risk Ratio (M‐H, Fixed, 95% CI) | 1.11 [0.97, 1.27] |
| 4 Serious Infections Show forest plot | 3 | Risk Ratio (M‐H, Fixed, 95% CI) | Subtotals only | |
| 4.1 24 weeks | 2 | 612 | Risk Ratio (M‐H, Fixed, 95% CI) | 0.25 [0.04, 1.47] |
| 4.2 52 weeks | 1 | 499 | Risk Ratio (M‐H, Fixed, 95% CI) | 0.46 [0.18, 1.20] |
| 4.3 104 weeks | 1 | 498 | Risk Ratio (M‐H, Fixed, 95% CI) | 0.68 [0.35, 1.35] |
| 5 Death Show forest plot | 3 | Risk Ratio (M‐H, Fixed, 95% CI) | Subtotals only | |
| 5.1 24 weeks | 2 | 612 | Risk Ratio (M‐H, Fixed, 95% CI) | 3.33 [0.35, 31.82] |
| 5.2 52 weeks | 1 | 499 | Risk Ratio (M‐H, Fixed, 95% CI) | 0.14 [0.01, 2.76] |
| 5.3 104 weeks | 1 | 498 | Risk Ratio (M‐H, Fixed, 95% CI) | 0.67 [0.11, 3.96] |
| 6 Arthralgia Show forest plot | 1 | 273 | Risk Ratio (M‐H, Fixed, 95% CI) | 1.20 [0.36, 4.06] |
| 6.1 24 weeks | 1 | 273 | Risk Ratio (M‐H, Fixed, 95% CI) | 1.20 [0.36, 4.06] |
| 7 Cardiac event (any) Show forest plot | 1 | Risk Ratio (M‐H, Fixed, 95% CI) | Subtotals only | |
| 7.1 52 weeks | 1 | 499 | Risk Ratio (M‐H, Fixed, 95% CI) | 1.00 [0.20, 4.93] |
| 8 Cardiac event (serious) Show forest plot | 1 | Risk Ratio (M‐H, Fixed, 95% CI) | Subtotals only | |
| 8.1 52 weeks | 1 | 499 | Risk Ratio (M‐H, Fixed, 95% CI) | 5.02 [0.24, 104.04] |
| 9 Diarrhea Show forest plot | 1 | Risk Ratio (M‐H, Fixed, 95% CI) | Subtotals only | |
| 9.1 24 weeks | 1 | 273 | Risk Ratio (M‐H, Fixed, 95% CI) | 1.05 [0.39, 2.82] |
| 10 Exacerbation of RA Show forest plot | 2 | 772 | Risk Ratio (M‐H, Fixed, 95% CI) | 0.56 [0.36, 0.89] |
| 10.1 MTX vs RTX 500 mg + MTX | 1 | 273 | Risk Ratio (M‐H, Fixed, 95% CI) | 0.57 [0.36, 0.91] |
| 10.2 52 weeks | 1 | 499 | Risk Ratio (M‐H, Fixed, 95% CI) | 0.33 [0.01, 8.18] |
| 11 Fatigue Show forest plot | 1 | Risk Ratio (M‐H, Fixed, 95% CI) | Subtotals only | |
| 11.1 24 weeks | 1 | 273 | Risk Ratio (M‐H, Fixed, 95% CI) | 0.75 [0.25, 2.24] |
| 12 HACA Show forest plot | 2 | Risk Ratio (M‐H, Fixed, 95% CI) | Subtotals only | |
| 12.1 24 weeks | 2 | 612 | Risk Ratio (M‐H, Fixed, 95% CI) | 2.73 [1.17, 6.40] |
| 13 Headache Show forest plot | 1 | Risk Ratio (M‐H, Fixed, 95% CI) | Subtotals only | |
| 13.1 24 weeks | 1 | 273 | Risk Ratio (M‐H, Fixed, 95% CI) | 0.89 [0.46, 1.69] |
| 14 Hypertension Show forest plot | 1 | Risk Ratio (M‐H, Fixed, 95% CI) | Subtotals only | |
| 14.1 24 weeks | 1 | 273 | Risk Ratio (M‐H, Fixed, 95% CI) | 1.50 [0.41, 5.47] |
| 15 Infusion‐related reactions (1st course ‐ 1st infusion) Show forest plot | 3 | Risk Ratio (M‐H, Fixed, 95% CI) | Subtotals only | |
| 15.1 24 weeks | 2 | 584 | Risk Ratio (M‐H, Fixed, 95% CI) | 0.79 [0.46, 1.36] |
| 15.2 52 weeks | 1 | 499 | Risk Ratio (M‐H, Fixed, 95% CI) | 1.13 [0.72, 1.78] |
| 15.3 104 weeks | 1 | 498 | Risk Ratio (M‐H, Fixed, 95% CI) | 1.13 [0.72, 1.77] |
| 16 Infusion related reaction (1st course ‐2nd infusion) Show forest plot | 2 | Risk Ratio (M‐H, Fixed, 95% CI) | Subtotals only | |
| 16.1 24 weeks | 2 | 612 | Risk Ratio (M‐H, Fixed, 95% CI) | 1.51 [1.10, 2.09] |
| 17 Infusion related reaction (2nd course) Show forest plot | 1 | Risk Ratio (M‐H, Fixed, 95% CI) | Subtotals only | |
| 17.1 52 weeks | 1 | 499 | Risk Ratio (M‐H, Fixed, 95% CI) | 0.95 [0.52, 1.74] |
| 17.2 104 weeks | 1 | 498 | Risk Ratio (M‐H, Fixed, 95% CI) | 0.95 [0.53, 1.71] |
| 18 Infusion related reaction (3rd course) Show forest plot | 1 | Risk Ratio (M‐H, Fixed, 95% CI) | Subtotals only | |
| 18.1 52 weeks | 1 | 499 | Risk Ratio (M‐H, Fixed, 95% CI) | 0.29 [0.06, 1.37] |
| 18.2 104 weeks | 1 | 498 | Risk Ratio (M‐H, Fixed, 95% CI) | 1.1 [0.48, 2.54] |
| 19 Infusion related reaction (4th course) Show forest plot | 1 | Risk Ratio (M‐H, Fixed, 95% CI) | Subtotals only | |
| 19.1 104 weeks | 1 | 498 | Risk Ratio (M‐H, Fixed, 95% CI) | 1.0 [0.42, 2.36] |
| 20 Infusion related reaction (5th course) Show forest plot | 1 | Risk Ratio (M‐H, Fixed, 95% CI) | Subtotals only | |
| 20.1 104 weeks | 1 | 498 | Risk Ratio (M‐H, Fixed, 95% CI) | 0.5 [0.05, 5.48] |
| 21 Lower gastrointestinal events Show forest plot | 2 | Risk Ratio (M‐H, Fixed, 95% CI) | Subtotals only | |
| 21.1 24 weeks | 2 | 612 | Risk Ratio (M‐H, Fixed, 95% CI) | 0.89 [0.52, 1.50] |
| 22 Malignancy Show forest plot | 3 | Risk Ratio (M‐H, Fixed, 95% CI) | Subtotals only | |
| 22.1 24 weeks | 2 | 612 | Risk Ratio (M‐H, Fixed, 95% CI) | 1.03 [0.06, 16.33] |
| 22.2 52 weeks | 1 | 499 | Risk Ratio (M‐H, Fixed, 95% CI) | 0.40 [0.08, 2.05] |
| 22.3 104 weeks | 1 | 498 | Risk Ratio (M‐H, Fixed, 95% CI) | 0.86 [0.29, 2.51] |
| 23 Nasopharyngitis Show forest plot | 1 | Risk Ratio (M‐H, Fixed, 95% CI) | Subtotals only | |
| 23.1 24 weeks | 1 | 273 | Risk Ratio (M‐H, Fixed, 95% CI) | 1.05 [0.39, 2.82] |
| 24 Nausea Show forest plot | 1 | Risk Ratio (M‐H, Fixed, 95% CI) | Subtotals only | |
| 24.1 24 weeks | 1 | 273 | Risk Ratio (M‐H, Fixed, 95% CI) | 0.74 [0.32, 1.73] |
| 25 Upper respiratory tract infection Show forest plot | 2 | 772 | Risk Ratio (M‐H, Fixed, 95% CI) | 1.07 [0.49, 2.35] |
| 25.1 24 weeks | 1 | 273 | Risk Ratio (M‐H, Fixed, 95% CI) | 1.34 [0.56, 3.18] |
| 25.2 52 weeks | 1 | 499 | Risk Ratio (M‐H, Fixed, 95% CI) | 0.33 [0.04, 3.20] |
| 26 Vascular disorders Show forest plot | 3 | 1111 | Risk Ratio (M‐H, Fixed, 95% CI) | 1.25 [0.74, 2.09] |
| 26.1 24 weeks | 2 | 612 | Risk Ratio (M‐H, Fixed, 95% CI) | 1.52 [0.62, 3.74] |
| 26.2 52 weeks | 1 | 499 | Risk Ratio (M‐H, Fixed, 95% CI) | 1.12 [0.60, 2.11] |
| Outcome or subgroup title | No. of studies | No. of participants | Statistical method | Effect size |
| 1 Any Adverse Event Show forest plot | 1 | Risk Ratio (M‐H, Fixed, 95% CI) | Subtotals only | |
| 1.1 24 weeks | 1 | 81 | Risk Ratio (M‐H, Fixed, 95% CI) | 0.91 [0.72, 1.16] |
| 1.2 48‐56 weeks | 1 | 81 | Risk Ratio (M‐H, Fixed, 95% CI) | 1.00 [0.84, 1.20] |
| 2 Serious Adverse Events Show forest plot | 1 | Risk Ratio (M‐H, Fixed, 95% CI) | Subtotals only | |
| 2.1 24 weeks | 1 | 81 | Risk Ratio (M‐H, Fixed, 95% CI) | 1.95 [0.52, 7.27] |
| 2.2 48‐56 weeks | 1 | 81 | Risk Ratio (M‐H, Fixed, 95% CI) | 1.71 [0.54, 5.38] |
| 3 Serious Infections Show forest plot | 1 | Risk Ratio (M‐H, Fixed, 95% CI) | Subtotals only | |
| 3.1 24 weeks | 1 | 81 | Risk Ratio (M‐H, Fixed, 95% CI) | 1.95 [0.18, 20.68] |
| 3.2 48‐56 weeks | 1 | 81 | Risk Ratio (M‐H, Fixed, 95% CI) | 0.0 [0.0, 0.0] |
| 4 Death Show forest plot | 1 | Risk Difference (M‐H, Fixed, 95% CI) | Subtotals only | |
| 4.1 24 weeks | 1 | 81 | Risk Difference (M‐H, Fixed, 95% CI) | 0.0 [‐0.05, 0.05] |
| 5 Any Event Associated with 1st Infusion Show forest plot | 1 | Risk Ratio (M‐H, Fixed, 95% CI) | Subtotals only | |
| 5.1 24 weeks | 1 | 81 | Risk Ratio (M‐H, Fixed, 95% CI) | 1.06 [0.55, 2.03] |
| 6 Arthralgia Show forest plot | 1 | Risk Ratio (M‐H, Fixed, 95% CI) | Subtotals only | |
| 6.1 24 weeks | 1 | 81 | Risk Ratio (M‐H, Fixed, 95% CI) | 0.33 [0.04, 3.00] |
| 7 Back pain Show forest plot | 1 | Risk Ratio (M‐H, Fixed, 95% CI) | Subtotals only | |
| 7.1 24 weeks | 1 | 81 | Risk Ratio (M‐H, Fixed, 95% CI) | 1.46 [0.26, 8.30] |
| 8 Cough Show forest plot | 1 | Risk Ratio (M‐H, Fixed, 95% CI) | Subtotals only | |
| 8.1 24 weeks | 1 | 81 | Risk Ratio (M‐H, Fixed, 95% CI) | 2.93 [0.12, 69.83] |
| 9 Dyspnea Show forest plot | 1 | Risk Difference (M‐H, Fixed, 95% CI) | Subtotals only | |
| 9.1 24 weeks | 1 | 81 | Risk Difference (M‐H, Fixed, 95% CI) | 0.0 [‐0.05, 0.05] |
| 10 Exacerbation of RA Show forest plot | 1 | Risk Ratio (M‐H, Fixed, 95% CI) | Subtotals only | |
| 10.1 24 weeks | 1 | 81 | Risk Ratio (M‐H, Fixed, 95% CI) | 0.37 [0.16, 0.84] |
| 10.2 48‐56 weeks | 1 | 81 | Risk Ratio (M‐H, Fixed, 95% CI) | 0.0 [0.0, 0.0] |
| 11 Hypertension Show forest plot | 1 | Risk Ratio (M‐H, Fixed, 95% CI) | Subtotals only | |
| 11.1 24 weeks | 1 | 81 | Risk Ratio (M‐H, Fixed, 95% CI) | 0.49 [0.13, 1.82] |
| 12 Hypotension Show forest plot | 1 | Risk Ratio (M‐H, Fixed, 95% CI) | Subtotals only | |
| 12.1 24 weeks | 1 | 81 | Risk Ratio (M‐H, Fixed, 95% CI) | 1.67 [0.73, 3.81] |
| 13 Nasopharyngitis Show forest plot | 1 | Risk Ratio (M‐H, Fixed, 95% CI) | Subtotals only | |
| 13.1 24 weeks | 1 | 81 | Risk Ratio (M‐H, Fixed, 95% CI) | 0.33 [0.07, 1.52] |
| 14 Nausea Show forest plot | 1 | Risk Ratio (M‐H, Fixed, 95% CI) | Subtotals only | |
| 14.1 24 weeks | 1 | 81 | Risk Ratio (M‐H, Fixed, 95% CI) | 3.90 [0.46, 33.42] |
| 15 Pruritus Show forest plot | 1 | Risk Ratio (M‐H, Fixed, 95% CI) | Subtotals only | |
| 15.1 24 weeks | 1 | 81 | Risk Ratio (M‐H, Fixed, 95% CI) | 8.79 [0.49, 158.07] |
| 16 Rash Show forest plot | 1 | Risk Ratio (M‐H, Fixed, 95% CI) | Subtotals only | |
| 16.1 24 weeks | 1 | 81 | Risk Ratio (M‐H, Fixed, 95% CI) | 3.90 [0.46, 33.42] |
| 16.2 48 weeks | 1 | 80 | Risk Ratio (M‐H, Fixed, 95% CI) | 0.0 [0.0, 0.0] |
| Outcome or subgroup title | No. of studies | No. of participants | Statistical method | Effect size |
| 1 Any Adverse Event Show forest plot | 1 | Risk Ratio (M‐H, Fixed, 95% CI) | Subtotals only | |
| 1.1 24 weeks | 1 | 51 | Risk Ratio (M‐H, Fixed, 95% CI) | 1.13 [0.90, 1.41] |
| 2 Serious adverse events Show forest plot | 1 | Risk Ratio (M‐H, Fixed, 95% CI) | Subtotals only | |
| 2.1 24 weeks | 1 | 51 | Risk Ratio (M‐H, Fixed, 95% CI) | 2.79 [0.14, 55.23] |
| 3 Grade 3 adverse events Show forest plot | 1 | Risk Ratio (M‐H, Fixed, 95% CI) | Subtotals only | |
| 3.1 24 weeks | 1 | 51 | Risk Ratio (M‐H, Fixed, 95% CI) | 6.15 [0.36, 105.22] |
| 4 All infections Show forest plot | 1 | Risk Ratio (M‐H, Fixed, 95% CI) | Subtotals only | |
| 4.1 24 weeks | 1 | 51 | Risk Ratio (M‐H, Fixed, 95% CI) | 0.89 [0.55, 1.45] |
| 5 Grade 3 infections Show forest plot | 1 | Risk Ratio (M‐H, Fixed, 95% CI) | Subtotals only | |
| 5.1 24 weeks | 1 | 51 | Risk Ratio (M‐H, Fixed, 95% CI) | 3.91 [0.21, 71.77] |
| 6 Serious infections Show forest plot | 1 | Risk Ratio (M‐H, Fixed, 95% CI) | Subtotals only | |
| 6.1 24 weeks | 1 | 51 | Risk Ratio (M‐H, Fixed, 95% CI) | 1.68 [0.07, 39.16] |
| 7 Any Event Associated with 1st infusion Show forest plot | 1 | Risk Ratio (M‐H, Fixed, 95% CI) | Subtotals only | |
| 7.1 24 weeks | 1 | 51 | Risk Ratio (M‐H, Fixed, 95% CI) | 5.45 [0.76, 39.26] |
| 8 Any Event Associated with 2nd infusion Show forest plot | 1 | Risk Ratio (M‐H, Fixed, 95% CI) | Subtotals only | |
| 8.1 24 weeks | 1 | 51 | Risk Ratio (M‐H, Fixed, 95% CI) | 0.82 [0.15, 4.45] |
| 9 Arthralgia Show forest plot | 1 | Risk Ratio (M‐H, Fixed, 95% CI) | Subtotals only | |
| 9.1 24 weeks | 1 | 51 | Risk Ratio (M‐H, Fixed, 95% CI) | 0.82 [0.15, 4.45] |
| 10 Coronary artery occlusion Show forest plot | 1 | Risk Ratio (M‐H, Fixed, 95% CI) | Subtotals only | |
| 10.1 24 weeks | 1 | 51 | Risk Ratio (M‐H, Fixed, 95% CI) | 1.68 [0.07, 39.16] |
| 11 Diarrhea Show forest plot | 1 | Risk Ratio (M‐H, Fixed, 95% CI) | Subtotals only | |
| 11.1 24 weeks | 1 | 51 | Risk Ratio (M‐H, Fixed, 95% CI) | 1.64 [0.18, 14.61] |
| 12 Exacerbation of RA Show forest plot | 1 | Risk Ratio (M‐H, Fixed, 95% CI) | Subtotals only | |
| 12.1 24 weeks | 1 | 51 | Risk Ratio (M‐H, Fixed, 95% CI) | 0.73 [0.18, 2.90] |
| 13 Fatigue Show forest plot | 1 | Risk Ratio (M‐H, Fixed, 95% CI) | Subtotals only | |
| 13.1 24 weeks | 1 | 51 | Risk Ratio (M‐H, Fixed, 95% CI) | 5.03 [0.29, 88.46] |
| 14 HACA Show forest plot | 1 | Risk Ratio (M‐H, Fixed, 95% CI) | Subtotals only | |
| 14.1 24 weeks | 1 | 51 | Risk Ratio (M‐H, Fixed, 95% CI) | 1.68 [0.07, 39.16] |
| 15 Headache Show forest plot | 1 | Risk Ratio (M‐H, Fixed, 95% CI) | Subtotals only | |
| 15.1 24 weeks | 1 | 51 | Risk Ratio (M‐H, Fixed, 95% CI) | 0.82 [0.15, 4.45] |
| 16 Influenza Show forest plot | 1 | Risk Ratio (M‐H, Fixed, 95% CI) | Subtotals only | |
| 16.1 24 weeks | 1 | 51 | Risk Ratio (M‐H, Fixed, 95% CI) | 1.68 [0.07, 39.16] |
| 17 Muscle spasms Show forest plot | 1 | Risk Ratio (M‐H, Fixed, 95% CI) | Subtotals only | |
| 17.1 24 weeks | 1 | 51 | Risk Ratio (M‐H, Fixed, 95% CI) | 0.27 [0.03, 2.81] |
| 18 Nasopharyngitis Show forest plot | 1 | Risk Ratio (M‐H, Fixed, 95% CI) | Subtotals only | |
| 18.1 24 weeks | 1 | 51 | Risk Ratio (M‐H, Fixed, 95% CI) | 1.09 [0.11, 11.22] |
| 19 Nausea Show forest plot | 1 | Risk Ratio (M‐H, Fixed, 95% CI) | Subtotals only | |
| 19.1 24 weeks | 1 | 51 | Risk Ratio (M‐H, Fixed, 95% CI) | 1.36 [0.29, 6.34] |
| 20 Peripheral edema Show forest plot | 1 | Risk Ratio (M‐H, Fixed, 95% CI) | Subtotals only | |
| 20.1 24 weeks | 1 | 51 | Risk Ratio (M‐H, Fixed, 95% CI) | 0.82 [0.15, 4.45] |
| 21 Pneumonia Show forest plot | 1 | Risk Ratio (M‐H, Fixed, 95% CI) | Subtotals only | |
| 21.1 24 weeks | 1 | 51 | Risk Ratio (M‐H, Fixed, 95% CI) | 1.68 [0.07, 39.16] |
| 22 Postoperative infection Show forest plot | 1 | Risk Ratio (M‐H, Fixed, 95% CI) | Subtotals only | |
| 22.1 24 weeks | 1 | 51 | Risk Ratio (M‐H, Fixed, 95% CI) | 1.68 [0.07, 39.16] |
| 23 Pruritus Show forest plot | 1 | Risk Ratio (M‐H, Fixed, 95% CI) | Subtotals only | |
| 23.1 24 weeks | 1 | 51 | Risk Ratio (M‐H, Fixed, 95% CI) | 5.03 [0.29, 88.46] |
| 24 Sinusitits Show forest plot | 1 | Risk Ratio (M‐H, Fixed, 95% CI) | Subtotals only | |
| 24.1 24 weeks | 1 | 51 | Risk Ratio (M‐H, Fixed, 95% CI) | 0.55 [0.12, 2.43] |
| 25 Upper respiratory tract infections Show forest plot | 1 | Risk Ratio (M‐H, Fixed, 95% CI) | Subtotals only | |
| 25.1 24 weeks | 1 | 51 | Risk Ratio (M‐H, Fixed, 95% CI) | 0.65 [0.23, 1.85] |
| 26 Urinary tract infections Show forest plot | 1 | Risk Ratio (M‐H, Fixed, 95% CI) | Subtotals only | |
| 26.1 24 weeks | 1 | 51 | Risk Ratio (M‐H, Fixed, 95% CI) | 1.09 [0.11, 11.22] |
| 27 Vaginal Mycosis Show forest plot | 1 | Risk Ratio (M‐H, Fixed, 95% CI) | Subtotals only | |
| 27.1 24 weeks | 1 | 51 | Risk Ratio (M‐H, Fixed, 95% CI) | 1.09 [0.11, 11.22] |
| Outcome or subgroup title | No. of studies | No. of participants | Statistical method | Effect size |
| 1 ACR 50 Show forest plot | 5 | Risk Ratio (M‐H, Fixed, 95% CI) | Subtotals only | |
| 1.1 = or < 4 years | 1 | 499 | Risk Ratio (M‐H, Fixed, 95% CI) | 1.55 [1.30, 1.84] |
| 1.2 > 4 years | 4 | 1165 | Risk Ratio (M‐H, Fixed, 95% CI) | 3.41 [2.52, 4.63] |
| Outcome or subgroup title | No. of studies | No. of participants | Statistical method | Effect size |
| 1 ACR 50 Show forest plot | 5 | Risk Ratio (M‐H, Fixed, 95% CI) | Subtotals only | |
| 1.1 Methotrexate‐naive | 1 | 499 | Risk Ratio (M‐H, Fixed, 95% CI) | 1.55 [1.30, 1.84] |
| 1.2 DMARDs failure | 2 | 422 | Risk Ratio (M‐H, Fixed, 95% CI) | 2.93 [1.86, 4.63] |
| 1.3 DMARD and TNFi failure | 2 | 743 | Risk Ratio (M‐H, Fixed, 95% CI) | 3.77 [2.51, 5.66] |
| Outcome or subgroup title | No. of studies | No. of participants | Statistical method | Effect size |
| 1 ACR 50 Show forest plot | 5 | Risk Ratio (M‐H, Random, 95% CI) | Subtotals only | |
| 1.1 Low risk of bias | 2 | 579 | Risk Ratio (M‐H, Random, 95% CI) | 2.03 [0.96, 4.26] |
| 1.2 High risk of bias | 3 | 1085 | Risk Ratio (M‐H, Random, 95% CI) | 3.27 [2.10, 5.09] |
| Outcome or subgroup title | No. of studies | No. of participants | Statistical method | Effect size |
| 1 ACR 20 Show forest plot | 4 | Risk Ratio (M‐H, Random, 95% CI) | Subtotals only | |
| 1.1 24 weeks | 3 | 809 | Risk Ratio (M‐H, Random, 95% CI) | 1.05 [0.87, 1.26] |
| 1.2 48‐52 weeks | 4 | 1218 | Risk Ratio (M‐H, Random, 95% CI) | 1.04 [0.96, 1.11] |
| 1.3 104 weeks | 1 | 436 | Risk Ratio (M‐H, Random, 95% CI) | 0.92 [0.83, 1.02] |
| 2 ACR 50 Show forest plot | 4 | Risk Ratio (M‐H, Fixed, 95% CI) | Subtotals only | |
| 2.1 24 weeks | 2 | 582 | Risk Ratio (M‐H, Fixed, 95% CI) | 0.99 [0.77, 1.28] |
| 2.2 48‐56 weeks | 4 | 1218 | Risk Ratio (M‐H, Fixed, 95% CI) | 1.08 [0.97, 1.21] |
| 2.3 104 weeks | 1 | 499 | Risk Ratio (M‐H, Fixed, 95% CI) | 1.04 [0.91, 1.20] |
| 3 ACR 70 Show forest plot | 4 | Risk Ratio (M‐H, Fixed, 95% CI) | Subtotals only | |
| 3.1 24 weeks | 2 | 582 | Risk Ratio (M‐H, Fixed, 95% CI) | 1.32 [0.85, 2.04] |
| 3.2 48‐56 weeks | 4 | 1218 | Risk Ratio (M‐H, Fixed, 95% CI) | 1.08 [0.91, 1.28] |
| 3.3 104 weeks | 1 | 499 | Risk Ratio (M‐H, Fixed, 95% CI) | 1.10 [0.90, 1.34] |
| 4 ACR 90 Show forest plot | 1 | Risk Ratio (M‐H, Fixed, 95% CI) | Subtotals only | |
| 4.1 52 weeks | 1 | 500 | Risk Ratio (M‐H, Fixed, 95% CI) | 0.95 [0.65, 1.41] |
| 4.2 104 weeks | 1 | 500 | Risk Ratio (M‐H, Fixed, 95% CI) | 1.14 [0.82, 1.59] |
| 5 DAS 28‐ESR Show forest plot | 4 | Mean Difference (IV, Fixed, 95% CI) | Subtotals only | |
| 5.1 24 weeks | 3 | 1081 | Mean Difference (IV, Fixed, 95% CI) | ‐0.06 [‐0.22, 0.09] |
| 5.2 48‐56 weeks | 3 | 1063 | Mean Difference (IV, Fixed, 95% CI) | ‐0.14 [‐0.29, 0.02] |
| 5.3 104 weeks | 1 | 499 | Mean Difference (IV, Fixed, 95% CI) | 0.0 [‐0.23, 0.23] |
| 6 LDA (DAS28 =or<3.2) Show forest plot | 4 | Risk Ratio (M‐H, Fixed, 95% CI) | Subtotals only | |
| 6.1 24 weeks | 1 | 335 | Risk Ratio (M‐H, Fixed, 95% CI) | 0.71 [0.42, 1.20] |
| 6.2 48 weeks | 4 | 1215 | Risk Ratio (M‐H, Fixed, 95% CI) | 1.11 [0.94, 1.31] |
| 6.3 104 weeks | 1 | 499 | Risk Ratio (M‐H, Fixed, 95% CI) | 1.07 [0.88, 1.29] |
| 7 Clinical Remission (DAS28<2.6) Show forest plot | 4 | 2049 | Risk Ratio (M‐H, Random, 95% CI) | 1.10 [0.87, 1.39] |
| 7.1 24 weeks | 1 | 335 | Risk Ratio (M‐H, Random, 95% CI) | 0.98 [0.51, 1.90] |
| 7.2 48‐52 weeks | 4 | 1215 | Risk Ratio (M‐H, Random, 95% CI) | 1.23 [0.85, 1.78] |
| 7.3 104 weeks | 1 | 499 | Risk Ratio (M‐H, Random, 95% CI) | 0.94 [0.73, 1.20] |
| 8 Moderate or good EULAR response Show forest plot | 4 | Risk Ratio (M‐H, Random, 95% CI) | Subtotals only | |
| 8.1 24 weeks | 3 | 1082 | Risk Ratio (M‐H, Random, 95% CI) | 0.94 [0.85, 1.05] |
| 8.2 48‐52 weeks | 3 | 1063 | Risk Ratio (M‐H, Random, 95% CI) | 1.07 [0.90, 1.28] |
| 8.3 104 weeks | 1 | 499 | Risk Ratio (M‐H, Random, 95% CI) | 1.09 [0.90, 1.31] |
| 9 HAQ‐DI Show forest plot | 3 | 1969 | Mean Difference (IV, Random, 95% CI) | ‐0.03 [‐0.17, 0.11] |
| 9.1 24 weeks | 2 | 744 | Mean Difference (IV, Random, 95% CI) | 0.09 [‐0.13, 0.30] |
| 9.2 48‐52 weeks | 2 | 726 | Mean Difference (IV, Random, 95% CI) | ‐0.04 [‐0.13, 0.05] |
| 9.3 104 weeks | 1 | 499 | Mean Difference (IV, Random, 95% CI) | ‐0.20 [‐0.31, ‐0.09] |
| 10 HAQ‐DI MCID=‐0.22 Show forest plot | 4 | Risk Ratio (M‐H, Random, 95% CI) | Subtotals only | |
| 10.1 24 weeks | 2 | 580 | Risk Ratio (M‐H, Random, 95% CI) | 0.97 [0.80, 1.18] |
| 10.2 48‐56 weeks | 3 | 1061 | Risk Ratio (M‐H, Random, 95% CI) | 0.99 [0.94, 1.05] |
| 10.3 104 weeks | 1 | 499 | Risk Ratio (M‐H, Random, 95% CI) | 1.02 [0.95, 1.10] |
| 11 SF‐36 PCS Show forest plot | 4 | 1167 | Mean Difference (IV, Fixed, 95% CI) | 0.53 [‐0.49, 1.54] |
| 11.1 24 weeks | 2 | 545 | Mean Difference (IV, Fixed, 95% CI) | 0.02 [‐1.39, 1.44] |
| 11.2 48‐52 weeks | 2 | 622 | Mean Difference (IV, Fixed, 95% CI) | 1.05 [‐0.39, 2.49] |
| 12 SF‐36 PCS (=or>MCID of 5 or 5.42) Show forest plot | 4 | 1287 | Risk Ratio (M‐H, Fixed, 95% CI) | 1.06 [0.97, 1.16] |
| 12.1 24 weeks | 2 | 582 | Risk Ratio (M‐H, Fixed, 95% CI) | 1.00 [0.85, 1.19] |
| 12.2 48‐52 weeks | 2 | 705 | Risk Ratio (M‐H, Fixed, 95% CI) | 1.10 [0.99, 1.21] |
| 13 SF‐36 MCS Show forest plot | 4 | 1167 | Mean Difference (IV, Fixed, 95% CI) | ‐0.02 [‐1.42, 1.38] |
| 13.1 24 weeks | 2 | 545 | Mean Difference (IV, Fixed, 95% CI) | ‐0.07 [‐2.21, 2.06] |
| 13.2 48‐52 weeks | 2 | 622 | Mean Difference (IV, Fixed, 95% CI) | 0.02 [‐1.83, 1.88] |
| 14 SF‐36 MCS (=or>MCID of 6.33) Show forest plot | 2 | Risk Ratio (M‐H, Fixed, 95% CI) | Subtotals only | |
| 14.1 48‐52 weeks | 2 | 705 | Risk Ratio (M‐H, Fixed, 95% CI) | 1.06 [0.92, 1.23] |
| 15 FACIT‐F Show forest plot | 4 | 1218 | Mean Difference (IV, Fixed, 95% CI) | 1.04 [‐0.11, 2.18] |
| 15.1 24 weeks | 2 | 578 | Mean Difference (IV, Fixed, 95% CI) | 0.83 [‐0.87, 2.53] |
| 15.2 48‐54 weeks | 2 | 640 | Mean Difference (IV, Fixed, 95% CI) | 1.21 [‐0.34, 2.77] |
| 16 FACIT‐F (=or>MCID of 3.5) Show forest plot | 2 | 461 | Risk Ratio (M‐H, Fixed, 95% CI) | 1.19 [1.03, 1.38] |
| 16.1 24 weeks | 1 | 245 | Risk Ratio (M‐H, Fixed, 95% CI) | 1.19 [0.97, 1.46] |
| 16.2 48 weeks | 1 | 216 | Risk Ratio (M‐H, Fixed, 95% CI) | 1.20 [0.98, 1.47] |
| 17 VAS Pain Show forest plot | 2 | Mean Difference (IV, Fixed, 95% CI) | Subtotals only | |
| 17.1 52 weeks | 2 | 671 | Mean Difference (IV, Fixed, 95% CI) | ‐2.30 [‐6.62, 2.02] |
| 18 Total radiographic score Show forest plot | 1 | Mean Difference (IV, Fixed, 95% CI) | Subtotals only | |
| 18.1 24 weeks | 1 | 483 | Mean Difference (IV, Fixed, 95% CI) | 0.25 [‐0.09, 0.59] |
| 18.2 52 weeks | 1 | 483 | Mean Difference (IV, Fixed, 95% CI) | 0.29 [‐0.05, 0.63] |
| 18.3 104 weeks | 1 | 483 | Mean Difference (IV, Fixed, 95% CI) | 0.35 [0.01, 0.69] |
| 19 Joint space narrowing Show forest plot | 1 | Mean Difference (IV, Fixed, 95% CI) | Subtotals only | |
| 19.1 24 weeks | 1 | 480 | Mean Difference (IV, Fixed, 95% CI) | 0.07 [‐0.07, 0.21] |
| 19.2 104 weeks | 1 | 483 | Mean Difference (IV, Fixed, 95% CI) | 0.08 [‐0.06, 0.22] |
| 20 Radiographic erosions Show forest plot | 1 | Mean Difference (IV, Fixed, 95% CI) | Subtotals only | |
| 20.1 24 weeks | 1 | 480 | Mean Difference (IV, Fixed, 95% CI) | 0.18 [‐0.05, 0.41] |
| 20.2 52 weeks | 1 | 483 | Mean Difference (IV, Fixed, 95% CI) | 0.22 [‐0.01, 0.45] |
| 20.3 104 weeks | 1 | 483 | Mean Difference (IV, Fixed, 95% CI) | 0.27 [0.04, 0.50] |
| 21 No radiographic progression Show forest plot | 1 | Risk Ratio (M‐H, Fixed, 95% CI) | Subtotals only | |
| 21.1 24 weeks | 1 | 483 | Risk Ratio (M‐H, Fixed, 95% CI) | 1.10 [0.97, 1.25] |
| 21.2 52 weeks | 1 | 483 | Risk Ratio (M‐H, Fixed, 95% CI) | 1.10 [0.95, 1.27] |
| 21.3 104 weeks | 1 | 483 | Risk Ratio (M‐H, Fixed, 95% CI) | 1.16 [0.98, 1.38] |
| 22 No worsening of erosions Show forest plot | 1 | Risk Ratio (M‐H, Fixed, 95% CI) | Subtotals only | |
| 22.1 104 weeks | 1 | 483 | Risk Ratio (M‐H, Fixed, 95% CI) | 1.11 [0.95, 1.30] |
| 23 Total discontinuations Show forest plot | 4 | Risk Ratio (M‐H, Random, 95% CI) | Subtotals only | |
| 23.1 24 weeks | 2 | 656 | Risk Ratio (M‐H, Random, 95% CI) | 1.40 [0.79, 2.47] |
| 23.2 48‐52 weeks | 3 | 1093 | Risk Ratio (M‐H, Random, 95% CI) | 0.73 [0.34, 1.58] |
| 23.3 104 weeks | 1 | 499 | Risk Ratio (M‐H, Random, 95% CI) | 1.00 [0.65, 1.52] |
| 24 Discontinuation due to lack of efficacy Show forest plot | 4 | 1749 | Risk Ratio (M‐H, Fixed, 95% CI) | 0.73 [0.41, 1.29] |
| 24.1 24 weeks | 2 | 656 | Risk Ratio (M‐H, Fixed, 95% CI) | 1.16 [0.53, 2.53] |
| 24.2 48‐52 weeks | 3 | 1093 | Risk Ratio (M‐H, Fixed, 95% CI) | 0.42 [0.17, 1.03] |
| 25 Discontinuations due to adverse Events Show forest plot | 4 | Risk Ratio (M‐H, Random, 95% CI) | Subtotals only | |
| 25.1 24 weeks | 2 | 656 | Risk Ratio (M‐H, Random, 95% CI) | 1.35 [0.46, 4.00] |
| 25.2 48‐52 weeks | 3 | 1093 | Risk Ratio (M‐H, Random, 95% CI) | 0.94 [0.25, 3.45] |
| 25.3 104 weeks | 1 | 499 | Risk Ratio (M‐H, Random, 95% CI) | 0.80 [0.32, 1.99] |
| 26 Discontinuations due to other reasons Show forest plot | 4 | Risk Ratio (M‐H, Fixed, 95% CI) | Subtotals only | |
| 26.1 24 weeks | 2 | 656 | Risk Ratio (M‐H, Fixed, 95% CI) | 2.00 [0.55, 7.30] |
| 26.2 48‐52 weeks | 3 | 1693 | Risk Ratio (M‐H, Fixed, 95% CI) | 1.17 [0.68, 1.99] |
| 27 Any Adverse Event Show forest plot | 4 | Risk Ratio (M‐H, Fixed, 95% CI) | Subtotals only | |
| 27.1 24 weeks | 2 | 653 | Risk Ratio (M‐H, Fixed, 95% CI) | 1.03 [0.95, 1.11] |
| 27.2 48‐52 weeks | 3 | 1062 | Risk Ratio (M‐H, Fixed, 95% CI) | 1.01 [0.95, 1.06] |
| 27.3 104 weeks | 1 | 499 | Risk Ratio (M‐H, Fixed, 95% CI) | 1.05 [0.97, 1.13] |
| 28 Serious Adverse Events Show forest plot | 4 | Risk Ratio (M‐H, Random, 95% CI) | Subtotals only | |
| 28.1 24 weeks | 2 | 653 | Risk Ratio (M‐H, Random, 95% CI) | 1.48 [0.57, 3.82] |
| 28.2 48‐52 weeks | 3 | 1062 | Risk Ratio (M‐H, Random, 95% CI) | 1.24 [0.87, 1.77] |
| 28.3 104 weeks | 1 | 499 | Risk Ratio (M‐H, Random, 95% CI) | 0.89 [0.57, 1.37] |
| 29 Infections Show forest plot | 4 | Risk Ratio (M‐H, Random, 95% CI) | Subtotals only | |
| 29.1 24 weeks | 2 | 653 | Risk Ratio (M‐H, Random, 95% CI) | 0.93 [0.76, 1.13] |
| 29.2 48‐52 weeks | 3 | 1062 | Risk Ratio (M‐H, Random, 95% CI) | 1.00 [0.86, 1.17] |
| 29.3 104 weeks | 1 | 499 | Risk Ratio (M‐H, Random, 95% CI) | 0.98 [0.86, 1.12] |
| 30 Serious Infections Show forest plot | 4 | Risk Ratio (M‐H, Fixed, 95% CI) | Subtotals only | |
| 30.1 24 weeks | 2 | 653 | Risk Ratio (M‐H, Fixed, 95% CI) | 1.49 [0.38, 5.86] |
| 30.2 48‐56 weeks | 3 | 1062 | Risk Ratio (M‐H, Fixed, 95% CI) | 1.08 [0.50, 2.34] |
| 30.3 104 weeks | 1 | 499 | Risk Ratio (M‐H, Fixed, 95% CI) | 0.92 [0.43, 1.98] |
| 31 Death Show forest plot | 4 | Risk Ratio (M‐H, Fixed, 95% CI) | Subtotals only | |
| 31.1 24 weeks | 2 | 653 | Risk Ratio (M‐H, Fixed, 95% CI) | 0.22 [0.01, 5.26] |
| 31.2 48‐52 weeks | 3 | 1062 | Risk Ratio (M‐H, Fixed, 95% CI) | 0.20 [0.01, 4.06] |
| 31.3 104 weeks | 1 | 499 | Risk Ratio (M‐H, Fixed, 95% CI) | 0.50 [0.05, 5.46] |
| 32 Arthralgia Show forest plot | 1 | Risk Ratio (M‐H, Fixed, 95% CI) | Subtotals only | |
| 32.1 24 weeks | 1 | 316 | Risk Ratio (M‐H, Fixed, 95% CI) | 1.42 [0.51, 3.99] |
| 33 Cardiac event (any) Show forest plot | 2 | Risk Ratio (M‐H, Fixed, 95% CI) | Subtotals only | |
| 33.1 24 weeks | 1 | 337 | Risk Ratio (M‐H, Fixed, 95% CI) | 1.38 [0.45, 4.25] |
| 33.2 48‐52 weeks | 2 | 835 | Risk Ratio (M‐H, Fixed, 95% CI) | 1.44 [0.68, 3.06] |
| 34 Cardiac event (Serious) Show forest plot | 2 | Risk Ratio (M‐H, Fixed, 95% CI) | Subtotals only | |
| 34.1 24 weeks | 1 | 337 | Risk Ratio (M‐H, Fixed, 95% CI) | 0.49 [0.04, 5.37] |
| 34.2 48‐52 weeks | 2 | 835 | Risk Ratio (M‐H, Fixed, 95% CI) | 0.99 [0.25, 3.94] |
| 35 Diarrhea Show forest plot | 1 | Risk Ratio (M‐H, Fixed, 95% CI) | Subtotals only | |
| 35.1 24 weeks | 1 | 316 | Risk Ratio (M‐H, Fixed, 95% CI) | 0.55 [0.19, 1.61] |
| 36 Exacerbation of RA Show forest plot | 2 | 814 | Risk Ratio (M‐H, Fixed, 95% CI) | 0.91 [0.55, 1.51] |
| 36.1 24 weeks | 1 | 316 | Risk Ratio (M‐H, Fixed, 95% CI) | 0.83 [0.49, 1.40] |
| 36.2 52 weeks | 1 | 498 | Risk Ratio (M‐H, Fixed, 95% CI) | 5.0 [0.24, 103.62] |
| 37 Fatigue Show forest plot | 1 | Risk Ratio (M‐H, Fixed, 95% CI) | Subtotals only | |
| 37.1 24 weeks | 1 | 316 | Risk Ratio (M‐H, Fixed, 95% CI) | 1.03 [0.35, 3.09] |
| 38 HACA Show forest plot | 2 | Risk Ratio (M‐H, Fixed, 95% CI) | Subtotals only | |
| 38.1 24 weeks | 2 | 543 | Risk Ratio (M‐H, Fixed, 95% CI) | 0.53 [0.20, 1.38] |
| 39 Hypertension Show forest plot | 1 | Risk Ratio (M‐H, Fixed, 95% CI) | Subtotals only | |
| 39.1 24 weeks | 1 | 316 | Risk Ratio (M‐H, Fixed, 95% CI) | 1.55 [0.56, 4.29] |
| 40 Infusion‐related reactions (1st course ‐1st infusion) Show forest plot | 4 | Risk Ratio (M‐H, Fixed, 95% CI) | Subtotals only | |
| 40.1 24 weeks | 2 | 653 | Risk Ratio (M‐H, Fixed, 95% CI) | 1.35 [1.02, 1.78] |
| 40.2 48‐56 weeks | 3 | 1062 | Risk Ratio (M‐H, Fixed, 95% CI) | 1.02 [0.79, 1.33] |
| 40.3 104 weeks | 1 | 499 | Risk Ratio (M‐H, Fixed, 95% CI) | 1.31 [0.87, 1.96] |
| 41 Infusion‐related reaction (1st course ‐2nd infusion) Show forest plot | 2 | Risk Ratio (M‐H, Fixed, 95% CI) | Subtotals only | |
| 41.1 24 weeks | 2 | 582 | Risk Ratio (M‐H, Fixed, 95% CI) | 1.04 [0.59, 1.85] |
| 42 Infusion‐related reaction (2nd course) Show forest plot | 3 | Risk Ratio (M‐H, Fixed, 95% CI) | Subtotals only | |
| 42.1 48‐52 weeks | 3 | 1062 | Risk Ratio (M‐H, Fixed, 95% CI) | 1.16 [0.79, 1.70] |
| 42.2 104 weeks | 1 | 499 | Risk Ratio (M‐H, Fixed, 95% CI) | 1.05 [0.58, 1.88] |
| 43 Infusion‐related reaction (3rd course) Show forest plot | 1 | Risk Ratio (M‐H, Fixed, 95% CI) | Subtotals only | |
| 43.1 52 weeks | 1 | 498 | Risk Ratio (M‐H, Fixed, 95% CI) | 4.5 [0.98, 20.62] |
| 43.2 104 weeks | 1 | 499 | Risk Ratio (M‐H, Fixed, 95% CI) | 1.09 [0.49, 2.42] |
| 44 Infusion‐related reaction (4th course) Show forest plot | 1 | Risk Ratio (M‐H, Fixed, 95% CI) | Subtotals only | |
| 44.1 104 weeks | 1 | 499 | Risk Ratio (M‐H, Fixed, 95% CI) | 0.80 [0.32, 1.99] |
| 45 Infusion‐related reaction (5th course) Show forest plot | 1 | Risk Ratio (M‐H, Fixed, 95% CI) | Subtotals only | |
| 45.1 104 weeks | 1 | 499 | Risk Ratio (M‐H, Fixed, 95% CI) | 2.99 [0.31, 28.53] |
| 46 Lower gastrointestinal events Show forest plot | 1 | Risk Ratio (M‐H, Fixed, 95% CI) | Subtotals only | |
| 46.1 24 weeks | 1 | 337 | Risk Ratio (M‐H, Fixed, 95% CI) | 0.98 [0.51, 1.90] |
| 46.2 48 weeks | 1 | 337 | Risk Ratio (M‐H, Fixed, 95% CI) | 1.12 [0.65, 1.94] |
| 47 Malignancy Show forest plot | 3 | Risk Ratio (M‐H, Fixed, 95% CI) | Subtotals only | |
| 47.1 24 weeks | 1 | 337 | Risk Ratio (M‐H, Fixed, 95% CI) | 1.96 [0.18, 21.46] |
| 47.2 48‐52 weeks | 3 | 1062 | Risk Ratio (M‐H, Fixed, 95% CI) | 1.09 [0.27, 4.31] |
| 47.3 104 weeks | 1 | 499 | Risk Ratio (M‐H, Fixed, 95% CI) | 0.50 [0.13, 1.97] |
| 48 Pneumonia Show forest plot | 1 | Risk Ratio (M‐H, Fixed, 95% CI) | Subtotals only | |
| 48.1 52 weeks | 1 | 498 | Risk Ratio (M‐H, Fixed, 95% CI) | 0.33 [0.01, 8.14] |
| 49 Urinary tract infection Show forest plot | 1 | Risk Ratio (M‐H, Fixed, 95% CI) | Subtotals only | |
| 49.1 52 weeks | 1 | 499 | Risk Ratio (M‐H, Fixed, 95% CI) | 0.20 [0.01, 4.16] |
| 50 Vascular disorders Show forest plot | 2 | Risk Ratio (M‐H, Fixed, 95% CI) | Subtotals only | |
| 50.1 24 weeks | 1 | 337 | Risk Ratio (M‐H, Fixed, 95% CI) | 1.15 [0.39, 3.34] |
| 50.2 48‐52 weeks | 2 | 835 | Risk Ratio (M‐H, Fixed, 95% CI) | 0.96 [0.59, 1.57] |
| Outcome or subgroup title | No. of studies | No. of participants | Statistical method | Effect size |
| 1 ACR 20 Show forest plot | 1 | Risk Ratio (M‐H, Fixed, 95% CI) | Subtotals only | |
| 1.1 24 weeks | 1 | 81 | Risk Ratio (M‐H, Fixed, 95% CI) | 1.04 [0.81, 1.35] |
| 1.2 48 weeks | 1 | 81 | Risk Ratio (M‐H, Fixed, 95% CI) | 0.72 [0.49, 1.06] |
| 1.3 104 weeks | 1 | 81 | Risk Ratio (M‐H, Fixed, 95% CI) | 0.38 [0.15, 0.96] |
| 2 ACR 50 Show forest plot | 1 | Risk Ratio (M‐H, Fixed, 95% CI) | Subtotals only | |
| 2.1 24 weeks | 1 | 81 | Risk Ratio (M‐H, Fixed, 95% CI) | 0.98 [0.58, 1.63] |
| 2.2 48 weeks | 1 | 81 | Risk Ratio (M‐H, Fixed, 95% CI) | 0.77 [0.40, 1.48] |
| 2.3 104 weeks | 1 | 81 | Risk Ratio (M‐H, Fixed, 95% CI) | 0.49 [0.16, 1.49] |
| 3 ACR 70 Show forest plot | 1 | Risk Ratio (M‐H, Fixed, 95% CI) | Subtotals only | |
| 3.1 24 weeks | 1 | 81 | Risk Ratio (M‐H, Fixed, 95% CI) | 0.65 [0.25, 1.66] |
| 3.2 48 weeks | 1 | 81 | Risk Ratio (M‐H, Fixed, 95% CI) | 0.65 [0.20, 2.13] |
| 3.3 104 weeks | 1 | 81 | Risk Ratio (M‐H, Fixed, 95% CI) | 0.73 [0.17, 3.06] |
| 4 DAS 28 Show forest plot | 1 | Mean Difference (IV, Fixed, 95% CI) | Subtotals only | |
| 4.1 24 weeks | 1 | 81 | Mean Difference (IV, Fixed, 95% CI) | 0.0 [‐0.61, 0.61] |
| 5 Moderate or good EULAR response Show forest plot | 1 | Risk Ratio (M‐H, Fixed, 95% CI) | Subtotals only | |
| 5.1 24 weeks | 1 | 81 | Risk Ratio (M‐H, Fixed, 95% CI) | 1.03 [0.85, 1.25] |
| 6 HAQ‐DI Show forest plot | 1 | Mean Difference (IV, Fixed, 95% CI) | Subtotals only | |
| 6.1 24 weeks | 1 | 76 | Mean Difference (IV, Fixed, 95% CI) | 0.0 [‐0.29, 0.29] |
| 6.2 48 weeks | 1 | 72 | Mean Difference (IV, Fixed, 95% CI) | 0.3 [0.01, 0.59] |
| 6.3 72 weeks | 1 | 50 | Mean Difference (IV, Fixed, 95% CI) | 0.5 [0.15, 0.85] |
| 7 HAQ‐DI MCID=‐0.22 Show forest plot | 1 | Risk Ratio (M‐H, Fixed, 95% CI) | Subtotals only | |
| 7.1 24 weeks | 1 | 76 | Risk Ratio (M‐H, Fixed, 95% CI) | 0.93 [0.65, 1.32] |
| 7.2 48 weeks | 1 | 72 | Risk Ratio (M‐H, Fixed, 95% CI) | 0.56 [0.35, 0.90] |
| 7.3 72 weeks | 1 | 50 | Risk Ratio (M‐H, Fixed, 95% CI) | 0.49 [0.21, 1.17] |
| 7.4 104 weeks | 1 | 27 | Risk Ratio (M‐H, Fixed, 95% CI) | 0.4 [0.05, 2.93] |
| 8 Total discontinuations Show forest plot | 1 | Risk Ratio (M‐H, Fixed, 95% CI) | Subtotals only | |
| 8.1 24 weeks | 1 | 81 | Risk Ratio (M‐H, Fixed, 95% CI) | 3.90 [0.46, 33.42] |
| 8.2 48 weeks | 1 | 81 | Risk Ratio (M‐H, Fixed, 95% CI) | 3.41 [0.75, 15.46] |
| 8.3 72 weeks | 1 | 81 | Risk Ratio (M‐H, Fixed, 95% CI) | 1.54 [0.87, 2.75] |
| 8.4 104 weeks | 1 | 81 | Risk Ratio (M‐H, Fixed, 95% CI) | 1.42 [1.03, 1.96] |
| 9 Withdrawals due to lack of efficacy Show forest plot | 1 | Risk Ratio (M‐H, Fixed, 95% CI) | Subtotals only | |
| 9.1 24 weeks | 1 | 81 | Risk Ratio (M‐H, Fixed, 95% CI) | 0.0 [0.0, 0.0] |
| 9.2 48 weeks | 1 | 81 | Risk Ratio (M‐H, Fixed, 95% CI) | 1.95 [0.18, 20.68] |
| 9.3 72 weeks | 1 | 81 | Risk Ratio (M‐H, Fixed, 95% CI) | 0.98 [0.26, 3.64] |
| 9.4 104 weeks | 1 | 81 | Risk Ratio (M‐H, Fixed, 95% CI) | 0.98 [0.26, 3.64] |
| 10 Withdrawals due to adverse events Show forest plot | 1 | Risk Ratio (M‐H, Fixed, 95% CI) | Subtotals only | |
| 10.1 24 weeks | 1 | 81 | Risk Ratio (M‐H, Fixed, 95% CI) | 1.95 [0.18, 20.68] |
| 10.2 48 weeks | 1 | 81 | Risk Ratio (M‐H, Fixed, 95% CI) | 1.95 [0.18, 20.68] |
| 10.3 72 weeks | 1 | 81 | Risk Ratio (M‐H, Fixed, 95% CI) | 3.90 [0.46, 33.42] |
| 10.4 104 weeks | 1 | 81 | Risk Ratio (M‐H, Fixed, 95% CI) | 3.90 [0.46, 33.42] |
| 11 Withdrawals due to other reasons Show forest plot | 1 | Risk Ratio (M‐H, Fixed, 95% CI) | Subtotals only | |
| 11.1 24 weeks | 1 | 81 | Risk Ratio (M‐H, Fixed, 95% CI) | 4.88 [0.24, 98.60] |
| 11.2 48 weeks | 1 | 81 | Risk Ratio (M‐H, Fixed, 95% CI) | 6.83 [0.36, 128.20] |
| 11.3 72 weeks | 1 | 81 | Risk Ratio (M‐H, Fixed, 95% CI) | 1.53 [0.66, 3.56] |
| 11.4 104 weeks | 1 | 81 | Risk Ratio (M‐H, Fixed, 95% CI) | 1.43 [0.93, 2.22] |
| 12 Any Adverse Event Show forest plot | 1 | Risk Ratio (M‐H, Fixed, 95% CI) | Subtotals only | |
| 12.1 24 weeks | 1 | 81 | Risk Ratio (M‐H, Fixed, 95% CI) | 0.86 [0.69, 1.08] |
| 12.2 48‐56 weeks | 1 | 81 | Risk Ratio (M‐H, Fixed, 95% CI) | 0.98 [0.82, 1.16] |
| 13 Serious Adverse Events Show forest plot | 1 | Risk Ratio (M‐H, Fixed, 95% CI) | Subtotals only | |
| 13.1 24 weeks | 1 | 81 | Risk Ratio (M‐H, Fixed, 95% CI) | 1.95 [0.52, 7.27] |
| 13.2 48‐56 weeks | 1 | 81 | Risk Ratio (M‐H, Fixed, 95% CI) | 1.71 [0.54, 5.38] |
| 14 Serious Infections Show forest plot | 1 | Risk Ratio (M‐H, Fixed, 95% CI) | Subtotals only | |
| 14.1 24 weeks | 1 | 81 | Risk Ratio (M‐H, Fixed, 95% CI) | 4.88 [0.24, 98.60] |
| 14.2 48‐56 weeks | 1 | 81 | Risk Ratio (M‐H, Fixed, 95% CI) | 0.33 [0.01, 7.76] |
| 15 Exacerbation of RA Show forest plot | 1 | Risk Ratio (M‐H, Fixed, 95% CI) | Subtotals only | |
| 15.1 24 weeks | 1 | 81 | Risk Ratio (M‐H, Fixed, 95% CI) | 2.93 [0.63, 13.65] |
| 15.2 48‐56 weeks | 1 | 81 | Risk Ratio (M‐H, Fixed, 95% CI) | 0.0 [0.0, 0.0] |
| 16 Death Show forest plot | 1 | Risk Difference (M‐H, Fixed, 95% CI) | Subtotals only | |
| 16.1 24 weeks | 1 | 81 | Risk Difference (M‐H, Fixed, 95% CI) | 0.0 [‐0.05, 0.05] |
| 17 Any Event Associated with 1st Infusion Show forest plot | 1 | Risk Ratio (M‐H, Fixed, 95% CI) | Subtotals only | |
| 17.1 24 weeks | 1 | 81 | Risk Ratio (M‐H, Fixed, 95% CI) | 0.98 [0.52, 1.84] |
| 18 Arthralgia Show forest plot | 1 | Risk Ratio (M‐H, Fixed, 95% CI) | Subtotals only | |
| 18.1 24 weeks | 1 | 81 | Risk Ratio (M‐H, Fixed, 95% CI) | 0.24 [0.03, 2.09] |
| 19 Back pain Show forest plot | 1 | Risk Ratio (M‐H, Fixed, 95% CI) | Subtotals only | |
| 19.1 24 weeks | 1 | 81 | Risk Ratio (M‐H, Fixed, 95% CI) | 6.83 [0.36, 128.20] |
| 20 Cough Show forest plot | 1 | Risk Ratio (M‐H, Fixed, 95% CI) | Subtotals only | |
| 20.1 24 weeks | 1 | 81 | Risk Ratio (M‐H, Fixed, 95% CI) | 0.49 [0.05, 5.17] |
| 21 Dyspnea Show forest plot | 1 | Risk Difference (M‐H, Fixed, 95% CI) | Subtotals only | |
| 21.1 24 weeks | 1 | 81 | Risk Difference (M‐H, Fixed, 95% CI) | 0.0 [‐0.05, 0.05] |
| 22 Hypertension Show forest plot | 1 | Risk Ratio (M‐H, Fixed, 95% CI) | Subtotals only | |
| 22.1 24 weeks | 1 | 81 | Risk Ratio (M‐H, Fixed, 95% CI) | 0.29 [0.09, 0.99] |
| 23 Hypotension Show forest plot | 1 | Risk Ratio (M‐H, Fixed, 95% CI) | Subtotals only | |
| 23.1 24 weeks | 1 | 82 | Risk Ratio (M‐H, Fixed, 95% CI) | 1.71 [0.75, 3.91] |
| 24 Nasopharyngitis Show forest plot | 1 | Risk Ratio (M‐H, Fixed, 95% CI) | Subtotals only | |
| 24.1 24 weeks | 1 | 81 | Risk Ratio (M‐H, Fixed, 95% CI) | 0.49 [0.09, 2.52] |
| 25 Nausea Show forest plot | 1 | Risk Ratio (M‐H, Fixed, 95% CI) | Subtotals only | |
| 25.1 24 weeks | 1 | 81 | Risk Ratio (M‐H, Fixed, 95% CI) | 8.79 [0.49, 158.07] |
| 26 Pruritus Show forest plot | 1 | Risk Ratio (M‐H, Fixed, 95% CI) | Subtotals only | |
| 26.1 24 weeks | 1 | 81 | Risk Ratio (M‐H, Fixed, 95% CI) | 8.79 [0.49, 158.07] |
| 27 Rash Show forest plot | 1 | Risk Ratio (M‐H, Fixed, 95% CI) | Subtotals only | |
| 27.1 24 weeks | 1 | 81 | Risk Ratio (M‐H, Fixed, 95% CI) | 3.90 [0.46, 33.42] |
| 27.2 48 weeks | 1 | 81 | Risk Ratio (M‐H, Fixed, 95% CI) | 0.0 [0.0, 0.0] |
| Outcome or subgroup title | No. of studies | No. of participants | Statistical method | Effect size |
| 1 ACR 20 Show forest plot | 1 | Risk Ratio (M‐H, Fixed, 95% CI) | Subtotals only | |
| 1.1 24 weeks | 1 | 80 | Risk Ratio (M‐H, Fixed, 95% CI) | 1.12 [0.83, 1.50] |
| 1.2 48 weeks | 1 | 80 | Risk Ratio (M‐H, Fixed, 95% CI) | 2.0 [1.21, 3.30] |
| 1.3 104 weeks | 1 | 80 | Risk Ratio (M‐H, Fixed, 95% CI) | 4.33 [1.34, 14.05] |
| 2 ACR 50 Show forest plot | 1 | Risk Ratio (M‐H, Fixed, 95% CI) | Subtotals only | |
| 2.1 24 weeks | 1 | 80 | Risk Ratio (M‐H, Fixed, 95% CI) | 1.31 [0.74, 2.32] |
| 2.2 48 weeks | 1 | 80 | Risk Ratio (M‐H, Fixed, 95% CI) | 2.33 [1.00, 5.46] |
| 2.3 104 weeks | 1 | 80 | Risk Ratio (M‐H, Fixed, 95% CI) | 2.67 [0.76, 9.33] |
| 3 ACR 70 Show forest plot | 1 | Risk Ratio (M‐H, Fixed, 95% CI) | Subtotals only | |
| 3.1 24 weeks | 1 | 80 | Risk Ratio (M‐H, Fixed, 95% CI) | 1.5 [0.59, 3.82] |
| 3.2 48 weeks | 1 | 80 | Risk Ratio (M‐H, Fixed, 95% CI) | 2.0 [0.54, 7.45] |
| 3.3 104 weeks | 1 | 80 | Risk Ratio (M‐H, Fixed, 95% CI) | 4.0 [0.47, 34.24] |
| 4 DAS 28 Show forest plot | 2 | Mean Difference (IV, Fixed, 95% CI) | Subtotals only | |
| 4.1 16‐24 weeks | 2 | 120 | Mean Difference (IV, Fixed, 95% CI) | ‐1.06 [‐1.76, ‐0.36] |
| 5 Moderate or good EULAR response Show forest plot | 2 | Risk Ratio (M‐H, Fixed, 95% CI) | Subtotals only | |
| 5.1 16‐24 weeks | 2 | 120 | Risk Ratio (M‐H, Fixed, 95% CI) | 1.04 [0.88, 1.23] |
| 5.2 104 weeks | 1 | 80 | Risk Ratio (M‐H, Fixed, 95% CI) | 3.25 [1.16, 9.12] |
| 6 HAQ‐DI Show forest plot | 1 | Mean Difference (IV, Fixed, 95% CI) | Subtotals only | |
| 6.1 24 weeks | 1 | 80 | Mean Difference (IV, Fixed, 95% CI) | 0.20 [‐0.06, 0.46] |
| 6.2 48 weeks | 1 | 80 | Mean Difference (IV, Fixed, 95% CI) | ‐0.10 [‐0.36, 0.16] |
| 6.3 72 weeks | 1 | 80 | Mean Difference (IV, Fixed, 95% CI) | 0.0 [‐0.26, 0.26] |
| 7 HAQ‐DI MCID=‐0.22 Show forest plot | 1 | Risk Ratio (M‐H, Fixed, 95% CI) | Subtotals only | |
| 7.1 24 weeks | 1 | 77 | Risk Ratio (M‐H, Fixed, 95% CI) | 0.94 [0.68, 1.29] |
| 7.2 48 weeks | 1 | 69 | Risk Ratio (M‐H, Fixed, 95% CI) | 1.63 [1.02, 2.60] |
| 7.3 72 weeks | 1 | 45 | Risk Ratio (M‐H, Fixed, 95% CI) | 2.63 [0.87, 7.91] |
| 7.4 104 weeks | 1 | 22 | Risk Ratio (M‐H, Fixed, 95% CI) | 1.11 [0.17, 7.09] |
| 8 Total discontinuations Show forest plot | 1 | Risk Ratio (M‐H, Fixed, 95% CI) | Subtotals only | |
| 8.1 24 weeks | 1 | 80 | Risk Ratio (M‐H, Fixed, 95% CI) | 0.5 [0.05, 5.30] |
| 8.2 48 weeks | 1 | 80 | Risk Ratio (M‐H, Fixed, 95% CI) | 0.22 [0.05, 0.96] |
| 8.3 72 weeks | 1 | 80 | Risk Ratio (M‐H, Fixed, 95% CI) | 0.52 [0.30, 0.90] |
| 8.4 104 weeks | 1 | 80 | Risk Ratio (M‐H, Fixed, 95% CI) | 0.61 [0.45, 0.82] |
| 9 Withdrawals due to lack of efficacy Show forest plot | 1 | Risk Ratio (M‐H, Fixed, 95% CI) | Subtotals only | |
| 9.1 24 weeks | 1 | 80 | Risk Ratio (M‐H, Fixed, 95% CI) | 0.0 [0.0, 0.0] |
| 9.2 48 weeks | 1 | 80 | Risk Ratio (M‐H, Fixed, 95% CI) | 0.5 [0.05, 5.30] |
| 9.3 72 weeks | 1 | 80 | Risk Ratio (M‐H, Fixed, 95% CI) | 1.33 [0.32, 5.58] |
| 9.4 104 weeks | 1 | 80 | Risk Ratio (M‐H, Fixed, 95% CI) | 0.8 [0.23, 2.76] |
| 10 Withdrawals due to adverse Events Show forest plot | 1 | Risk Ratio (M‐H, Fixed, 95% CI) | Subtotals only | |
| 10.1 24 weeks | 1 | 80 | Risk Ratio (M‐H, Fixed, 95% CI) | 0.5 [0.05, 5.30] |
| 10.2 48 weeks | 1 | 80 | Risk Ratio (M‐H, Fixed, 95% CI) | 0.25 [0.03, 2.14] |
| 10.3 72 weeks | 1 | 80 | Risk Ratio (M‐H, Fixed, 95% CI) | 0.2 [0.02, 1.64] |
| 10.4 104 weeks | 1 | 80 | Risk Ratio (M‐H, Fixed, 95% CI) | 0.2 [0.02, 1.64] |
| 11 Withdrawals due to other reasons Show forest plot | 1 | Risk Ratio (M‐H, Fixed, 95% CI) | Subtotals only | |
| 11.1 24 weeks | 1 | 80 | Risk Ratio (M‐H, Fixed, 95% CI) | 0.0 [0.0, 0.0] |
| 11.2 48 weeks | 1 | 80 | Risk Ratio (M‐H, Fixed, 95% CI) | 0.14 [0.01, 2.68] |
| 11.3 72 weeks | 1 | 80 | Risk Ratio (M‐H, Fixed, 95% CI) | 0.47 [0.21, 1.02] |
| 11.4 104 weeks | 1 | 80 | Risk Ratio (M‐H, Fixed, 95% CI) | 0.65 [0.43, 1.00] |
| 12 Any Adverse Event Show forest plot | 1 | Risk Ratio (M‐H, Fixed, 95% CI) | Subtotals only | |
| 12.1 24 weeks | 1 | 80 | Risk Ratio (M‐H, Fixed, 95% CI) | 1.06 [0.87, 1.30] |
| 12.2 48‐56 weeks | 1 | 80 | Risk Ratio (M‐H, Fixed, 95% CI) | 0.97 [0.83, 1.14] |
| 13 Serious Adverse Events Show forest plot | 1 | Risk Ratio (M‐H, Fixed, 95% CI) | Subtotals only | |
| 13.1 24 weeks | 1 | 80 | Risk Ratio (M‐H, Fixed, 95% CI) | 1.5 [0.26, 8.50] |
| 13.2 48‐56 weeks | 1 | 80 | Risk Ratio (M‐H, Fixed, 95% CI) | 1.0 [0.27, 3.72] |
| 14 Serious Infections Show forest plot | 2 | Risk Ratio (M‐H, Fixed, 95% CI) | Subtotals only | |
| 14.1 16‐24 weeks | 2 | 120 | Risk Ratio (M‐H, Fixed, 95% CI) | 0.33 [0.05, 2.03] |
| 14.2 48‐56 weeks | 1 | 80 | Risk Ratio (M‐H, Fixed, 95% CI) | 1.0 [0.06, 15.44] |
| 15 Death Show forest plot | 1 | Risk Ratio (M‐H, Fixed, 95% CI) | Subtotals only | |
| 15.1 24 weeks | 1 | 80 | Risk Ratio (M‐H, Fixed, 95% CI) | 0.33 [0.01, 7.95] |
| 16 Any Event Associated with 1st Infusion Show forest plot | 2 | Risk Ratio (M‐H, Fixed, 95% CI) | Subtotals only | |
| 16.1 16‐24 weeks | 2 | 120 | Risk Ratio (M‐H, Fixed, 95% CI) | 0.8 [0.47, 1.36] |
| 17 Arthralgia Show forest plot | 1 | Risk Ratio (M‐H, Fixed, 95% CI) | Subtotals only | |
| 17.1 24 weeks | 1 | 80 | Risk Ratio (M‐H, Fixed, 95% CI) | 1.33 [0.32, 5.58] |
| 18 Back pain Show forest plot | 1 | Risk Ratio (M‐H, Fixed, 95% CI) | Subtotals only | |
| 18.1 24 weeks | 1 | 80 | Risk Ratio (M‐H, Fixed, 95% CI) | 0.11 [0.01, 2.00] |
| 19 Cough Show forest plot | 1 | Risk Ratio (M‐H, Fixed, 95% CI) | Subtotals only | |
| 19.1 24 weeks | 1 | 80 | Risk Ratio (M‐H, Fixed, 95% CI) | 0.4 [0.08, 1.94] |
| 20 Dyspnea Show forest plot | 1 | Risk Ratio (M‐H, Fixed, 95% CI) | Subtotals only | |
| 20.1 24 weeks | 1 | 80 | Risk Ratio (M‐H, Fixed, 95% CI) | 0.11 [0.01, 2.00] |
| 21 Exacerbation of RA Show forest plot | 1 | Risk Ratio (M‐H, Fixed, 95% CI) | Subtotals only | |
| 21.1 24 weeks | 1 | 80 | Risk Ratio (M‐H, Fixed, 95% CI) | 0.33 [0.07, 1.55] |
| 21.2 48‐56 weeks | 1 | 80 | Risk Ratio (M‐H, Fixed, 95% CI) | 0.33 [0.01, 7.95] |
| 22 Hypertension Show forest plot | 1 | Risk Ratio (M‐H, Fixed, 95% CI) | Subtotals only | |
| 22.1 24 weeks | 1 | 80 | Risk Ratio (M‐H, Fixed, 95% CI) | 1.67 [0.67, 4.15] |
| 23 Hypotension Show forest plot | 1 | Risk Ratio (M‐H, Fixed, 95% CI) | Subtotals only | |
| 23.1 24 weeks | 1 | 80 | Risk Ratio (M‐H, Fixed, 95% CI) | 0.58 [0.26, 1.33] |
| 24 Nasopharyngitis Show forest plot | 1 | Risk Ratio (M‐H, Fixed, 95% CI) | Subtotals only | |
| 24.1 24 weeks | 1 | 80 | Risk Ratio (M‐H, Fixed, 95% CI) | 1.0 [0.27, 3.72] |
| 25 Nausea Show forest plot | 1 | Risk Ratio (M‐H, Fixed, 95% CI) | Subtotals only | |
| 25.1 24 weeks | 1 | 80 | Risk Ratio (M‐H, Fixed, 95% CI) | 0.2 [0.01, 4.04] |
| 26 Pruritus Show forest plot | 1 | Risk Ratio (M‐H, Fixed, 95% CI) | Subtotals only | |
| 26.1 24 weeks | 1 | 80 | Risk Ratio (M‐H, Fixed, 95% CI) | 0.11 [0.01, 2.00] |
| 27 Rash Show forest plot | 1 | Risk Ratio (M‐H, Fixed, 95% CI) | Subtotals only | |
| 27.1 24 weeks | 1 | 80 | Risk Ratio (M‐H, Fixed, 95% CI) | 0.25 [0.03, 2.14] |
| 27.2 48 weeks | 1 | 80 | Risk Ratio (M‐H, Fixed, 95% CI) | 0.33 [0.01, 7.95] |
| Outcome or subgroup title | No. of studies | No. of participants | Statistical method | Effect size |
| 1 ACR 20 Show forest plot | 1 | Risk Ratio (M‐H, Fixed, 95% CI) | Subtotals only | |
| 1.1 24 weeks | 1 | 81 | Risk Ratio (M‐H, Fixed, 95% CI) | 1.16 [0.87, 1.55] |
| 1.2 48 weeks | 1 | 81 | Risk Ratio (M‐H, Fixed, 95% CI) | 1.50 [0.87, 2.59] |
| 1.3 104 weeks | 1 | 81 | Risk Ratio (M‐H, Fixed, 95% CI) | 1.63 [0.42, 6.36] |
| 2 ACR 50 Show forest plot | 1 | Risk Ratio (M‐H, Fixed, 95% CI) | Subtotals only | |
| 2.1 24 weeks | 1 | 81 | Risk Ratio (M‐H, Fixed, 95% CI) | 1.28 [0.72, 2.27] |
| 2.2 48 weeks | 1 | 81 | Risk Ratio (M‐H, Fixed, 95% CI) | 1.79 [0.73, 4.37] |
| 2.3 104 weeks | 1 | 81 | Risk Ratio (M‐H, Fixed, 95% CI) | 1.30 [0.31, 5.45] |
| 3 ACR 70 Show forest plot | 1 | Risk Ratio (M‐H, Fixed, 95% CI) | Subtotals only | |
| 3.1 24 weeks | 1 | 81 | Risk Ratio (M‐H, Fixed, 95% CI) | 0.98 [0.34, 2.77] |
| 3.2 48 weeks | 1 | 81 | Risk Ratio (M‐H, Fixed, 95% CI) | 1.30 [0.31, 5.45] |
| 3.3 104 weeks | 1 | 81 | Risk Ratio (M‐H, Fixed, 95% CI) | 2.93 [0.32, 26.97] |
| 4 DAS 28 Show forest plot | 1 | Mean Difference (IV, Fixed, 95% CI) | Subtotals only | |
| 4.1 24 weeks | 1 | 81 | Mean Difference (IV, Fixed, 95% CI) | ‐0.40 [‐1.03, 0.23] |
| 5 Moderate or good EULAR response Show forest plot | 1 | Risk Ratio (M‐H, Fixed, 95% CI) | Subtotals only | |
| 5.1 24 weeks | 1 | 81 | Risk Ratio (M‐H, Fixed, 95% CI) | 1.00 [0.84, 1.20] |
| 6 HAQ‐DI Show forest plot | 1 | Mean Difference (IV, Fixed, 95% CI) | Subtotals only | |
| 6.1 24 weeks | 1 | 75 | Mean Difference (IV, Fixed, 95% CI) | 0.20 [‐0.08, 0.48] |
| 6.2 48 weeks | 1 | 65 | Mean Difference (IV, Fixed, 95% CI) | 0.2 [‐0.10, 0.50] |
| 6.3 72 weeks | 1 | 39 | Mean Difference (IV, Fixed, 95% CI) | 0.5 [0.12, 0.88] |
| 7 HAQ‐DI MCID=‐0.22 Show forest plot | 1 | Risk Ratio (M‐H, Fixed, 95% CI) | Subtotals only | |
| 7.1 24 weeks | 1 | 75 | Risk Ratio (M‐H, Fixed, 95% CI) | 0.87 [0.62, 1.22] |
| 7.2 48 weeks | 1 | 65 | Risk Ratio (M‐H, Fixed, 95% CI) | 0.91 [0.50, 1.65] |
| 7.3 72 weeks | 1 | 39 | Risk Ratio (M‐H, Fixed, 95% CI) | 1.29 [0.36, 4.65] |
| 7.4 104 weeks | 1 | 13 | Risk Ratio (M‐H, Fixed, 95% CI) | 0.44 [0.04, 5.46] |
| 8 Total discontinuations Show forest plot | 1 | Risk Ratio (M‐H, Fixed, 95% CI) | Subtotals only | |
| 8.1 24 weeks | 1 | 81 | Risk Ratio (M‐H, Fixed, 95% CI) | 1.95 [0.38, 10.06] |
| 8.2 48 weeks | 1 | 81 | Risk Ratio (M‐H, Fixed, 95% CI) | 0.76 [0.31, 1.84] |
| 8.3 72 weeks | 1 | 81 | Risk Ratio (M‐H, Fixed, 95% CI) | 0.81 [0.53, 1.23] |
| 8.4 104 weeks | 1 | 81 | Risk Ratio (M‐H, Fixed, 95% CI) | 0.87 [0.72, 1.05] |
| 9 Withdrawals due to lack of efficacy Show forest plot | 1 | Risk Ratio (M‐H, Fixed, 95% CI) | Subtotals only | |
| 9.1 24 weeks | 1 | 81 | Risk Ratio (M‐H, Fixed, 95% CI) | 0.0 [0.0, 0.0] |
| 9.2 48 weeks | 1 | 81 | Risk Ratio (M‐H, Fixed, 95% CI) | 0.98 [0.14, 6.59] |
| 9.3 72 weeks | 1 | 81 | Risk Ratio (M‐H, Fixed, 95% CI) | 1.30 [0.31, 5.45] |
| 9.4 104 weeks | 1 | 81 | Risk Ratio (M‐H, Fixed, 95% CI) | 0.78 [0.23, 2.70] |
| 10 Withdrawals due to adverse Events Show forest plot | 1 | Risk Ratio (M‐H, Fixed, 95% CI) | Subtotals only | |
| 10.1 24 weeks | 1 | 81 | Risk Ratio (M‐H, Fixed, 95% CI) | 0.98 [0.14, 6.59] |
| 10.2 48 weeks | 1 | 81 | Risk Ratio (M‐H, Fixed, 95% CI) | 0.49 [0.09, 2.52] |
| 10.3 72 weeks | 1 | 81 | Risk Ratio (M‐H, Fixed, 95% CI) | 0.78 [0.23, 2.70] |
| 10.4 104 weeks | 1 | 81 | Risk Ratio (M‐H, Fixed, 95% CI) | 0.78 [0.23, 2.70] |
| 11 Withdrawals due to other reasons Show forest plot | 1 | Risk Ratio (M‐H, Fixed, 95% CI) | Subtotals only | |
| 11.1 24 weeks | 1 | 81 | Risk Ratio (M‐H, Fixed, 95% CI) | 4.88 [0.24, 98.60] |
| 11.2 48 weeks | 1 | 81 | Risk Ratio (M‐H, Fixed, 95% CI) | 0.98 [0.21, 4.55] |
| 11.3 72 weeks | 1 | 81 | Risk Ratio (M‐H, Fixed, 95% CI) | 0.72 [0.38, 1.36] |
| 11.4 104 weeks | 1 | 81 | Risk Ratio (M‐H, Fixed, 95% CI) | 0.94 [0.67, 1.31] |
| 12 Any Adverse Event Show forest plot | 1 | Risk Ratio (M‐H, Fixed, 95% CI) | Subtotals only | |
| 12.1 24 weeks | 1 | 81 | Risk Ratio (M‐H, Fixed, 95% CI) | 0.91 [0.72, 1.16] |
| 12.2 48‐56 weeks | 1 | 81 | Risk Ratio (M‐H, Fixed, 95% CI) | 0.95 [0.81, 1.12] |
| 13 Serious Adverse Events Show forest plot | 1 | Risk Ratio (M‐H, Fixed, 95% CI) | Subtotals only | |
| 13.1 24 weeks | 1 | 81 | Risk Ratio (M‐H, Fixed, 95% CI) | 2.93 [0.63, 13.65] |
| 13.2 48‐56 weeks | 1 | 81 | Risk Ratio (M‐H, Fixed, 95% CI) | 1.71 [0.54, 5.38] |
| 14 Serious Infections Show forest plot | 1 | Risk Ratio (M‐H, Fixed, 95% CI) | Subtotals only | |
| 14.1 24 weeks | 1 | 81 | Risk Ratio (M‐H, Fixed, 95% CI) | 0.98 [0.14, 6.59] |
| 14.2 48‐56 weeks | 1 | 81 | Risk Ratio (M‐H, Fixed, 95% CI) | 0.33 [0.01, 7.76] |
| 15 Death Show forest plot | 1 | Risk Ratio (M‐H, Fixed, 95% CI) | Subtotals only | |
| 15.1 24 weeks | 1 | 81 | Risk Ratio (M‐H, Fixed, 95% CI) | 0.33 [0.01, 7.76] |
| 16 Any Event Associated with 1st Infusion Show forest plot | 1 | Risk Ratio (M‐H, Fixed, 95% CI) | Subtotals only | |
| 16.1 24 weeks | 1 | 81 | Risk Ratio (M‐H, Fixed, 95% CI) | 0.70 [0.40, 1.24] |
| 17 Arthralgia Show forest plot | 1 | Risk Ratio (M‐H, Fixed, 95% CI) | Subtotals only | |
| 17.1 24 weeks | 1 | 81 | Risk Ratio (M‐H, Fixed, 95% CI) | 0.33 [0.04, 3.00] |
| 18 Back pain Show forest plot | 1 | Risk Ratio (M‐H, Fixed, 95% CI) | Subtotals only | |
| 18.1 24 weeks | 1 | 81 | Risk Ratio (M‐H, Fixed, 95% CI) | 0.73 [0.17, 3.06] |
| 19 Cough Show forest plot | 1 | Risk Ratio (M‐H, Fixed, 95% CI) | Subtotals only | |
| 19.1 24 weeks | 1 | 81 | Risk Ratio (M‐H, Fixed, 95% CI) | 0.20 [0.02, 1.60] |
| 20 Dyspnea Show forest plot | 1 | Risk Ratio (M‐H, Fixed, 95% CI) | Subtotals only | |
| 20.1 24 weeks | 1 | 81 | Risk Ratio (M‐H, Fixed, 95% CI) | 0.11 [0.01, 1.95] |
| 21 Exacerbation of RA Show forest plot | 1 | Risk Ratio (M‐H, Fixed, 95% CI) | Subtotals only | |
| 21.1 24 weeks | 1 | 81 | Risk Ratio (M‐H, Fixed, 95% CI) | 0.98 [0.34, 2.77] |
| 21.2 48‐56 weeks | 1 | 81 | Risk Ratio (M‐H, Fixed, 95% CI) | 0.33 [0.01, 7.76] |
| 22 Hypertension Show forest plot | 1 | Risk Ratio (M‐H, Fixed, 95% CI) | Subtotals only | |
| 22.1 24 weeks | 1 | 81 | Risk Ratio (M‐H, Fixed, 95% CI) | 0.49 [0.13, 1.82] |
| 23 Hypotension Show forest plot | 1 | Risk Ratio (M‐H, Fixed, 95% CI) | Subtotals only | |
| 23.1 24 weeks | 1 | 81 | Risk Ratio (M‐H, Fixed, 95% CI) | 0.98 [0.50, 1.91] |
| 24 Nasopharyngitis Show forest plot | 1 | Risk Ratio (M‐H, Fixed, 95% CI) | Subtotals only | |
| 24.1 24 weeks | 1 | 81 | Risk Ratio (M‐H, Fixed, 95% CI) | 0.49 [0.09, 2.52] |
| 25 Nausea Show forest plot | 1 | Risk Ratio (M‐H, Fixed, 95% CI) | Subtotals only | |
| 25.1 24 weeks | 1 | 80 | Risk Ratio (M‐H, Fixed, 95% CI) | 2.0 [0.39, 10.31] |
| 26 Rash Show forest plot | 1 | Risk Ratio (M‐H, Fixed, 95% CI) | Subtotals only | |
| 26.1 24 weeks | 1 | 81 | Risk Ratio (M‐H, Fixed, 95% CI) | 0.98 [0.26, 3.64] |
| 26.2 48 weeks | 1 | 81 | Risk Ratio (M‐H, Fixed, 95% CI) | 0.33 [0.01, 7.76] |