Rituximab para la artritis reumatoide
Referencias
Referencias de los estudios incluidos en esta revisión
Referencias de los estudios excluidos de esta revisión
Referencias de los estudios en curso
Referencias adicionales
Characteristics of studies
Characteristics of included studies [ordered by study ID]
| Methods | Design: Randomised, double blind, placebo‐controlled phase III trial Sample Size: 520 patients randomised Setting: 114 rheumatology centres (US, Europe, Canada, and Israel) Follow‐up: 24 weeks | |
| Participants | Inclusion criteria:
Exclusion criteria:
| |
| Interventions | Control: Methotrexate (n = 209) Group 1: Rituximab 1000 mg + methotrexate (n = 308) Concomitant treatment: Prednisone (10 mg/day or equivalent) NSAIDs Retreatment: rescue therapy between weeks 16 and 24 (placebo group received rituximab and for rituximab received standard of care) | |
| Outcomes | Primary endpoint: ACR 20 Secondary endpoints: ACR 50, 70; HAQ; FACIT‐F; EULAR response; AEs; DAS28; Immunogenicity; Genant/Sharp score; SF‐36; Individual ACR core set measures Safety: Withdrawals, infusion‐related reactions, severe AEs, infections, serious AEs, HACA antibodies | |
| Notes | Funding: Supported by Hoffmann‐La Roche, Biogen Idec and Genentech. Objectives: "i) to determine the efficacy and safety of treatment with rituximab plus methotrexate in patients with active rheumatoid arthritis who had an inadequate response to anti‐tumour necrosis factor therapies and ii) to explore the pharmacokinetics and pharmacodynamics of rituximab in this population" | |
| Risk of bias | ||
| Bias | Authors' judgement | Support for judgement |
| Random sequence generation (selection bias) | Unclear risk | Method of randomisation not described |
| Allocation concealment (selection bias) | Unclear risk | Method of concealment not reported |
| Blinding of participants and personnel (performance bias) | Low risk | Method of blinding was not described, but it is mentioned that patients, study sponsor, and investigators were unaware of the treatment assignment of each patient |
| Incomplete outcome data (attrition bias) | Unclear risk | No missing data reported/ reporting of discontinuations not clear Power calculation: Yes, 91% Patients randomised: 520 Patients analysed: 499 for efficacy outcomes and 517 for safety outcomes ITT analysis: No (modified ITT), but sensitivity analyses were conducted including all patients |
| Selective reporting (reporting bias) | Low risk | No study protocol, but article includes all the pre‐specified and expected outcomes |
| Other bias | Low risk | The study appears to be free of other sources of bias. The sponsor was a pharmaceutical company and was responsible for the data collection, and the statistical analyses |
| Methods | Design: Randomised, double‐blind, controlled study Sample Size: 161 patients randomised Setting: 26 rheumatology centres Follow‐up: 48 weeks, 104 weeks | |
| Participants | Inclusion criteria:
Exclusion criteria:
| |
| Interventions | Control: Methotrexate (n = 40) Group 1: Rituximab1000 mg (n = 40) Group 2: Rituximab 1000 mg + cyclophosphamide (n = 41) Group 3: Rituximab 1000 mg + methotrexate (n = 40) Concomitant treatment: Prednisone (10 mg/day or equivalent) Re‐treatment: a repeat course of rituximab or alternative therapy was was allowed after 24 weeks | |
| Outcomes | Primary endpoint: ACR 50 Secondary endpoints: ACR 20, 70; DAS28; EULAR responses; individual ACR core set measures, DAS28, HAQ, CD19 + B‐cells, CD3 +, CD4 +, CD8 + T‐cells, IgG, IgA, and IgM, RF levels, anti‐tetanus antibody titres Safety: Withdrawals, Infusion related reactions, Infections, Serious AEs, human anti‐chimeric antibodies against rituximab | |
| Notes | Funding: Supported by Roche Objective: "To evaluate the effect of rituximab in patients with active rheumatoid arthritis in a multicenter, randomised, double‐blind, controlled study" | |
| Risk of bias | ||
| Bias | Authors' judgement | Support for judgement |
| Random sequence generation (selection bias) | Unclear risk | Not described |
| Allocation concealment (selection bias) | Unclear risk | Not reported |
| Blinding of participants and personnel (performance bias) | Low risk | Double blinding reported. Personnel at all sites remained blinded to treatment during the follow‐up |
| Incomplete outcome data (attrition bias) | Low risk | Reasons documented for dropouts. For patients who withdrew before week 24, a last observation carried forward method of imputation was applied Power calculation: Yes, 82% Patients randomised: 161 Patients analysed: 161 ITT analysis: Yes |
| Selective reporting (reporting bias) | Low risk | No protocol for study identified but wide range of outcomes assessed |
| Other bias | Low risk | The study appears to be free of other sources of bias. The sponsor was a pharmaceutical company and was responsible for the data collection, and the statistical analyses |
| Methods | Design: Phase IIb, randomised, double‐blind, double‐dummy, placebo‐controlled, dose‐ranging multifactorial trial Sample Size: 465 patients were randomised Setting: 99 centres (Australia, Brazil, Canada, Czech Republic, Finland, Germany, Italy, Mexico, New Zealand, Poland, Spain, Sweden, UK, US) Follow‐up: 24 weeks | |
| Participants | Inclusion criteria:
Exclusion criteria:
| |
| Interventions | Control: Methotrexate (n = 149) Group 1: Rituximab + methotrexate 500 mg (n = 124) Group 2: Rituxiimab + methotrexate 1000 mg (n = 192) Concomitant treatment: Prednisone (10 mg/day or equivalent) NSAIDs Re‐treatment: Not allowed | |
| Outcomes | Primary endpoint: ACR 20 Secondary endpoints: ACR 50, 70; DAS28; EULAR responses; FACIT‐F; Individual parameters of the ACR improvement criteria; HAQ Safety: Withdrawals, incidence of adverse events (CTC); CD19; Ig levels; protective antibody titers; human anti‐chimeric antibodies against rituximab levels | |
| Notes | Funding: Supported by Genetech, Biogen Idec, and Hoffmann‐La Roche. Objective: "To examine the efficacy and safety of different rituximab doses plus methotrexate with or without glucocorticoids, in patients with active rheumatoid arthritis resistant to disease‐modifying antirheumatic drugs, including biologic agents" | |
| Risk of bias | ||
| Bias | Authors' judgement | Support for judgement |
| Random sequence generation (selection bias) | Unclear risk | Method of randomisation not described |
| Allocation concealment (selection bias) | Unclear risk | Method of concealment not reported |
| Blinding of participants and personnel (performance bias) | Unclear risk | Method of blinding was not described |
| Incomplete outcome data (attrition bias) | Low risk | No missing data reported/ clear reporting of discontinuations Power calculation: Yes, 80% Patients randomised: 465 Patients analysed: 465 for safety, 367 for efficacy ITT analysis: Only for categorical variables |
| Selective reporting (reporting bias) | Low risk | No study protocol, but article includes all the pre‐specified and expected outcomes |
| Other bias | Low risk | The study appears to be free of other sources of bias, but the sponsor was a pharmaceutical company and was responsible for the data collection, and the statistical analyses |
| Methods | Design: Randomised, placebo‐controlled, double‐blind, parallel group study Sample Size: 511 patients were randomised Setting: 102 centres (US, Canada, LatinAmerica and European countries) Follow‐up: 48 weeks | |
| Participants | Inclusion criteria:
Exclusion criteria:
| |
| Interventions | Control: Methotrexate (n = 172) Group 1: Rituximab 500 mg + methotrexate (n = 168) Group 2: Rituximab 1000 mg + methotrexate (n = 172) Concomitant treatment: Prednisone (10 mg/day or equivalent) NSAIDs Re‐treatment: rescue therapy was allowed with one non‐biological DMARD between week 16 and 23. After week 24 repeat courses of open‐label rituximab were allowed | |
| Outcomes | Primary endpoint: ACR 20 Secondary endpoints: ACR 50, 70; EULAR responses; DAS28‐ESR (mean change, low disease activity and remission); HAQ‐DI; SF36; FACIT‐F Safety: Withdrawals, Infusion related reactions, Infections, Serious AEs, HACA antibodies | |
| Notes | Funding: Sponsored by Genentech Objective: "To evaluate the safety and efficacy of rituximab 2x500 mg and 2x1000 mg in combination with methotrexate, compared to methotrexate monotherapy, in patients with active rheumatoid arthritis who had inadequate response to methotrexate and in whom no prior biological treatment for RA had been administered" | |
| Risk of bias | ||
| Bias | Authors' judgement | Support for judgement |
| Random sequence generation (selection bias) | Unclear risk | Method of randomisation not described |
| Allocation concealment (selection bias) | Unclear risk | Method of concealment not reported |
| Blinding of participants and personnel (performance bias) | Unclear risk | Method of blinding was not described |
| Incomplete outcome data (attrition bias) | Low risk | Missing data were imputed using the non‐responder method and LOCF, clear reporting of discontinuations Power calculation: Yes, 90% Patients randomised: 511 Patients analysed: 509 ITT analysis: No (modified ITT) |
| Selective reporting (reporting bias) | Low risk | Study protocol available in clinical trial.gov, article includes all the pre‐specified and expected outcomes |
| Other bias | Low risk | The study appears to be free of other sources of bias, but the sponsor was a pharmaceutical company and was responsible for the data collection, and the statistical analyses |
| Methods | Design: Randomised, double‐blinded, placebo‐controlled study Sample Size: 54 patients enrolled Setting: 17 sites (US) Follow‐up: 24 weeks | |
| Participants | Inclusion criteria:
Exclusion criteria:
| |
| Interventions | Control: Methotrexate + TNFi (n = 18) Group 1: Rituximab + methotrexate + TNFi (n = 32) Concomitant Treatment: Prednisone (10 mg/day or equivalent) DMARDs other than methotrexate Re‐treatment: Not allowed | |
| Outcomes | Primary endpoint: Proportion of patients developing at least 1 serious infection Secondary endpoints: Individual ACR core set measures, ACR 20, 50, 70; EULAR responses, DAS28‐ESR Safety: Withdrawals, serious infections, total AEs, serious AEs, grade 3 or 4 infections, duration of all infections, immunologic and laboratory assessment | |
| Notes | Funding: Biogen Idec, Genetech, and Roche Objective: "To preliminary assess the safety of rituximab (dose of 2 X 500 mg) in combination with a TNF inhibitor and methotrexate in patients with active RA" | |
| Risk of bias | ||
| Bias | Authors' judgement | Support for judgement |
| Random sequence generation (selection bias) | Unclear risk | Method of randomisation not described |
| Allocation concealment (selection bias) | Unclear risk | Method of concealment not reported |
| Blinding of participants and personnel (performance bias) | Unclear risk | Method of blinding was not described |
| Incomplete outcome data (attrition bias) | High risk | Missing data were no imputed and all analyses were based on available data Power calculation: Yes, 78% Patients randomised: 54 Patients analysed: 51 ITT analysis: No (modified ITT) |
| Selective reporting (reporting bias) | Low risk | No study protocol, but article includes all the pre‐specified and expected outcomes |
| Other bias | Low risk | The study appears to be free of other sources of bias, but the sponsor was a pharmaceutical company and was responsible for the data collection, and the statistical analyses |
| Methods | Design: Randomised, open‐label trial Sample Size: 40 participants Setting: 2 centres (Germany) Follow‐up: 24 weeks | |
| Participants | Inclusion criteria:
Exclusion criteria:
| |
| Interventions | Control: RTX alone (n = 20) Group 1: RTX + methotrexate (n = 20) Concomitant treatment: Not specified Re‐treatment: Not allowed | |
| Outcomes | Primary endpoint: DAS28 Secondary endpoints: EULAR response, mean absolute CD19 + B‐cell counts, incidence of repopulation of CD19 + B‐cells, individual Safety: acute infusion reactions; infections | |
| Notes | Funding: Source of funding was not disclosed, but no conflict of interest were reported Objective: "To determine the efficacy, safety and kinetics of B‐cell depletion following a single course of RTX as a monotherapy" | |
| Risk of bias | ||
| Bias | Authors' judgement | Support for judgement |
| Random sequence generation (selection bias) | Unclear risk | Method of randomisation not described |
| Allocation concealment (selection bias) | Unclear risk | Method of concealment not reported |
| Blinding of participants and personnel (performance bias) | Unclear risk | Open‐label study |
| Incomplete outcome data (attrition bias) | Low risk | All patients were accounted for in the analysis Power calculation: No Patients randomised: 40 Patients analysed: 40 ITT analysis: Yes |
| Selective reporting (reporting bias) | Low risk | No study protocol, but article includes all the pre‐specified outcomes |
| Other bias | Low risk | The study appears to be free of other sources of bias |
| Methods | Design: Randomised, double‐blind, phase III trial Sample Size: 378 participants were randomised Setting: 81 centres (Australia, Belgium, Brazil, Canada, China, Finland, France, Germany, Hungary, Italy, New Zealand, Slovakia, South Africa, Spain, Taiwan, the Netherlands, UK) Follow‐up: 48 weeks | |
| Participants | Inclusion criteria:
Exclusion criteria:
| |
| Interventions | Group 1: RTX 2 x 500 mg, then at 24 weeks RTX 2 x 500 mg (n = 134) Group 2: RTX 2 x 500 mg, then at 24 weeks RTX 2 x 1000 mg (n = 119) Group 3: RTX 2 x 1000 mg, then at 24 weeks RTX 2 x 1000 mg (n = 93) Concomitant treatment: Prednisone (10 mg/day or equivalent) Methotrexate (10 to 25 mg/week) NSAIDs Re‐treatment: At week 24, patients initially on rituximab 2 x 500 mg received a repeat course also of 2 x 500 mg or a dose increase of 2 x 1000 mg. Patients initially on rituximab 2 x 1000 mg received a course also of 2 x 1000 mg | |
| Outcomes | Primary endpoint: ACR 20 Secondary endpoints: ACR 50, 70, DAS28‐ESR, EULAR response, SF‐36, FACIT‐F, HAQ‐DI, MCID in HAQ‐DI, pharmacodynamics (B‐cell and T‐cell counts, Ig concentrations, levels of RF and anti‐CCP antibodies) Safety: Presence of human anti‐chimeric antibodies, adverse events and serious adverse events | |
| Notes | Funding: Sponsored by F Hoffmann‐La Roche, Biogen Idec and Genetech. Open access publication of the article was paid by F Hoffmann‐La Roche. Objective: "i) to determine if initiating treatment with RTX 2 x 500 mg followed by a repeat course with the same dose at 24 weeks was different from repeat course increasing the dose to 2 x 1000 mg; ii) to compare efficacy and safety of RTX 2 x 500 and 2 x 1000 over 48 weeks with a fixed repeat treatment" | |
| Risk of bias | ||
| Bias | Authors' judgement | Support for judgement |
| Random sequence generation (selection bias) | Low risk | "Patients were randomly allocated using an interactive voice response system" |
| Allocation concealment (selection bias) | Low risk | "The sponsor, investigators and patients were blinded to the treatment allocation up to the Week 48 analysis. Treatment assignments were unblinded to the sponsor at this time for the purpose of the data analysis" |
| Blinding of participants and personnel (performance bias) | Low risk | "Although all patients were randomly assigned to RTX‐containing regimens, allocation to dose and repeat treatment regimen was blinded" |
| Incomplete outcome data (attrition bias) | Low risk | Missing data were imputed using the non‐responder method for ACR and EULAR (all patients who withdrew were categorized as non‐responders). The last observation carried forward was used for the remaining outcomes Power calculation: Yes, 80% Patients randomised: 378 Patients analysed: 346 for safety, 346 for disease activity measures, 320 to 345 for patient‐reported outcomes ITT analysis: Yes |
| Selective reporting (reporting bias) | Low risk | No study protocol, but article includes all the pre‐specified and expected outcomes |
| Other bias | Low risk | The study appears to be free of other sources of bias. The sponsor was a pharmaceutical company and was responsible for the data collection, and the statistical analyses |
| Methods | Design: Phase III, double‐blind randomised controlled trial Sample Size: 755 methotrexate‐naive patients randomised Setting: 169 centres (US, Latin America, Asia, and Australia) Follow‐up: 104 weeks | |
| Participants | Inclusion criteria:
Exclusion criteria:
| |
| Interventions | Control: Methotrexate (n = 249) Group 1: Rituximab 2 x 500 mg + methotrexate (n = 249) Group 2: Rituximab 2 x 1000 mg + methotrexate (n = 250) Concomitant treatment: Prednisone (10 mg/day or equivalent) NSAIDs Re‐treatment: Repeat courses of rituximab/placebo were allowed from week 24 | |
| Outcomes | Primary endpoint: Change in Total Modified Sharp Score (TMSS) Secondary endpoints: ACR 20, 50, 70, 90; EULAR response; DAS28‐ESR; HAQ‐DI Safety: Withdrawals, AEs | |
| Notes | Funding: Sponsored by F Hoffmann‐La Roche Ltd, Genentech Inc and Biogen Idec. Objective: i) To determine the efficacy of rituximab in the prevention of joint damage and its safety in combination with methotrexate in patients initiating treatment with methotrexate; "ii) to investigate the early therapeutic introduction of rituximab in patients with active RA not previously treated with methotrexate" | |
| Risk of bias | ||
| Bias | Authors' judgement | Support for judgement |
| Random sequence generation (selection bias) | Low risk | "The randomisation schedule was generated by the sponsor and supplied to an Interactive Voice Response System" |
| Allocation concealment (selection bias) | Low risk | "Patients were assigned unique medication and randomisation numbers via IVRS. The sponsor, investigators and patients were blinded to treatment allocation until week 52" |
| Blinding of participants and personnel (performance bias) | Low risk | Double‐blinded and study medications were identical (RTX and PBO) |
| Incomplete outcome data (attrition bias) | Low risk | Missing data were imputed by linear extrapolation/ clear reporting of discontinuations Power calculation: Yes, > 90% Patients randomised: 755 Patients analysed: 748 ITT analysis: No (modified ITT) |
| Selective reporting (reporting bias) | Low risk | Study protocol available in clinical trial.gov, article includes all the pre‐specified and expected outcomes |
| Other bias | Low risk | The study appears to be free of other sources of bias, but the sponsor was a pharmaceutical company and was responsible for the data collection, and the statistical analyses |
ACR ‐ Americn College of Rheumatology
AE ‐ adverse event
CRP ‐ C‐reactive protein
CTC ‐ common toxicity criteria
DAS28 ‐ Disease activity score 28
ESR ‐ erythrocyte sedimentation rate
EULAR ‐ European League Against Rheumatism
FACIT‐F ‐ fatigue scale of the functional assessment of chronic illness therapy
HACA antibodies ‐ anti‐human chimeric antibodies
HAQ ‐ health assessment questionnaire
RA ‐ rheumatoid arthritis
SJC ‐ swollen joint count
TJC ‐ tender joint count
Characteristics of excluded studies [ordered by study ID]
| Study | Reason for exclusion |
| Retrospective study, 50 patients, 24 months of follow‐up | |
| The SIERRA trial evaluated the effects of rituximab on immune responses in subjects with active rheumatoid arthritis receiving background methotrexate. This was a phase II, randomised, parallel‐group, open‐label, multicenter study. 103 patients of 26 centres (US) were randomised to RTX 1000 mg + methotrexate (n = 68) or methotrexate (n = 32). Concomitant treatment was prednisone (10 mg/day or equivalent) and antihistamine and/or acetaminophen. Retreatment was not allowed. Patients were followed for 36 weeks. Primary endpoint was the proportion of subjects with a positive response to tetanus toxoid adsorbed vaccine. Secondary endpoints included the proportion of subjects with a 2‐fold increase in tetanus antibody titres, or with tetanus antibody titres ≥ 0.2 IU/mL; proportion of subjects with positive responses against an individual anti pneumococcal antibody serotype; proportion of subjects with positive responses against at least 50% of the serotypes; levels of anti‐tetanus antibody in subjects measured immediately prior to and 4 weeks after a booster vaccine; levels of anti pneumococcal antibody to 12 serotypes in subjects measured immediately prior to and 4 weeks after vaccination; levels of anti‐KLH antibody in subjects measured immediately prior to the first administration of KLH and 4 weeks after the first administration of KLH; proportion of subjects who maintain a positive response to Candida albicans; pharmacodynamics. Safety outcomes were infusion reactions and serious adverse events. The study was sponsored by Genetech. | |
| Observational study, 46 patients, 12 months of follow‐up | |
| Observational study, 74 patients (only 21 with RA), 2 to 35 months of follow‐up | |
| The RESET trial assessed safety and efficacy of rituximab in patients with RA that were taking stable doses of methotrexate and failed tumour necrosis factor (TNF) inhibitors. This was an open‐label; multicentre trial with 120 patients receiving the first course of rituximab (2 x 1000 mg) then from this group, 77 patients received re‐treatment with rituximab (2 x 1000 mg) between weeks 24 and 48 with a total of 72 patients that received rituximab re‐treatment completing the 24 week second course of treatment period, 112 patients completing the 24 week primary treatment period and 25 patients completing the 48 week primary treatment period. Analysis preformed after 24 weeks showed that 58%, 27% and 7% of patients achieved an ACR 20, 50 and 70 improvements respectively. During the primary treatment the amount of patients with a decrease in at least 0.25 in the HAQ‐DI score was 56.7% after 24 weeks of the first course of rituximab and 64.9% after 24 weeks of re‐treatment. No infections or infusion reactions were found life‐threatening during treatment courses. | |
| Open‐label study, 13 patients, 24 weeks of follow‐up | |
| An open‐label extension analysis, patients of the 3 RCTs included in this review (1039 patients), reported efficacy at 24 weeks | |
| The SUNRISE trial evaluated the efficacy and safety of rituximab given in 1 course versus 2 courses over 48 weeks in patients with RA that were on a stable dose of methotrexate 10 to 25 mg/week and failed previously treatment with tumour necrosis inhibitors. 559 patients received a first course of rituximab (2 x 1000 mg) in an open‐label fashion and then 475 patients were randomised in a double‐blind ratio at week 24, of these 318 into a second course of rituximab and 157 into placebo group. It was found at week 48 that efficacy was improved in patients re‐treated with rituximab (2 x 1000 mg) comparing to placebo group. American College of Rheumatology (ACR 20) criteria 54% versus 45%, P = 0.02; Mean change in Disease Activity Score‐28 (DAS‐28) of ‐1.9 versus ‐1.5, P = 0.006. Also the amounts of patients experiencing any side effects, or serious adverse events, infections or serious infections were similar in the 2 groups. | |
| Population pharmacokinetics of rituximab, 102 patients | |
| Observational study, 25 patients, 12 weeks of follow‐up. Immunohistochemical analysis | |
| Comparison between 1 cycle and 2 cycles | |
| This was a prospective cohort study conducted to assess the proportion of patients with rheumatoid arthritis in which treatment with rituximab resulted in the depletion or anti‐infliximab antibodies. 32 participants who had been treated with infliximab in 4 centres (the Netherlands) were included if they met the following criteria: diagnosis of RA, detectable anti‐infliximab antibodies and initiated on treatment with rituximab or adalimumab. Patients were assigned to rituximab 2 x 1000 mg (n = 17) or adalimumab 40 mg SC every other week (n = 15) and followed for 24 weeks. At 24 weeks found similar per cent reduction between groups (20% versus 36%, adalimumab versus rituximab, respectively). |
Characteristics of ongoing studies [ordered by study ID]
| Trial name or title | A Randomized, Double‐Blind, Placebo Controlled, Multi‐Centre, Exploratory, Pilot, Phase II Trial of 150mg Atacicept Given Subcutaneously in Combination With Rituximab in Subjects With Rheumatoid Arthritis |
| Methods | The primary objective of this study is to assess the safety and tolerability of combined treatment with atacicept and rituximab in subjects with active rheumatoid arthritis receiving re‐treatment with rituximab |
| Participants | > 18 years of age; rheumatoid arthritis (American College of Rheumatology criteria); disease history of at least 12 months; active disease defined by > 8 swollen joints (out of 66) > 8 tender joints (out of 68); CRP > 6 mg/LESR > 28 mm/h; previous treatment with rituximab; candidates for re‐treatment with rituximab |
| Interventions | Rituximab 1000 mg IV infusion, second 1000 mg IV infusion given 2 weeks later, followed 28 days later by atacicept/placebo 150 mg/mL SC once weekly for 25 weeks Atacicept/placebo 150 mg/mL SC once weekly for 25 weeks, given in combination with rituximab 1000 mg IV infusion on study day 10, second 1000 mg IV infusion given 2 weeks later |
| Outcomes | Primary outcome measures: Incidence and severity of adverse events (AEs) |
| Starting date | March 2008 |
| Contact information | Carol Marsella, BSc (Hons), [email protected] Amanda Clark, RGN, BN, BASc [email protected] |
| Notes | Atacicept in combination with rituximab in subjects with rheumatoid arthritis (August III) |
| Trial name or title | A Randomized, Double‐Blinded, Placebo Controlled Study to Evaluate the Tolerability and Safety of Rituximab When Given in Combination With Methotrexate and Etanercept (Enbrel) or Methotrexate and Adalimumab (Humira) in Subjects With Active Rheumatoid Arthritis |
| Methods | This study is being conducted to see how well patients with rheumatoid arthritis are able to tolerate rituximab in combination with methotrexate and etanercept or methotrexate and adalimumab |
| Participants | 18 and 65 years of age: diagnosis of active RA for at least 6 months (diagnosed according to the revised 1987 ACR criteria for the classification of RA); at least 5 tender and 5 swollen joints; treated with etanercept at 50 mg per week (25 mg twice per week or 50 mg once per week) for at least 12 weeks immediately prior enrolment; treated with methotrexate greater than or equal to 15 mg per week and less than or equal to 25 mg per week for at least 12 weeks immediately prior to enrolment; on oral folate; oral glucocorticoids must not exceed 10 mg per day of prednisone (or equivalent dose); any concomitant NSAID must be stable for at least 2 weeks prior enrolment |
| Interventions | 500 mg rituximab on Day 1 and Day 15 Placebo on Day 1 and Day 15 |
| Outcomes | Primary outcome measures: The proportion of patients with at least one serious infection through Week 24 |
| Starting date | March 2006 |
| Contact information | Richard Schwartz, MD, Biogen Idec |
| Notes | Safety and tolerability of rituxan with methotrexate and etanercept or methotrexate and adalimumab in patients with active rheumatoid arthritis |
| Trial name or title | A Randomized, Double‐blind Study to Evaluate the Effect of Various Re‐treatment Regimens of MabThera in Combination With Methotrexate on Treatment Response in Rheumatoid Arthritis Patients With an Inadequate Response to Methotrexate |
| Methods | This study will evaluate the efficacy and safety of various treatment and re‐treatment regimens of MabThera. All patients will receive concomitant methotrexate, 10 to 25 mg once weekly either orally or parenterally. The anticipated time on study treatment is 2+ years, and the target sample size is 100 to 500 individuals |
| Participants | Adult patients ≥ 18 years of age; RA for ≥ 6 months; receiving outpatient treatment; inadequate response to methotrexate, having received and tolerated it for ≥ 12 weeks, with a stable dose for ≥ 4 weeks |
| Interventions | Three treatment arms: i) 500 mg IV on days 1 and 15, and 500 mg IV on days 168 and 182; ii) 500 mg IV on days 1 and 15, and 1000 mg IV on days 168 and 182; iii) 1000 mg IV on days 1 and 15 and 1000 mg IV (or placebo in UK) on days 168 and 182 |
| Outcomes | Primary outcome measures: Percentage of patients with ACR 20 response |
| Starting date | February 2006 |
| Contact information | Hoffmann‐La Roche |
| Notes | A study of re‐treatment with MabThera (rituximab) in combination with methotrexate in patients with rheumatoid arthritis (RA) |
| Trial name or title | A Randomized, Active Controlled, Double‐blind, Study to Compare the Safety and Reduction in Disease Activity With the Combination of Rituximab (MabThera®)and Tocilizumab (RoActemra®) Versus Tocilizumab in Patients With Active Rheumatoid Arthritis With an Incomplete Response to Methotrexate |
| Methods | This 2 part study will investigate the safety, tolerability and efficacy of MabThera in combination with RoActemra in patients with active rheumatoid arthritis despite a stable dose of methotrexate. In Part 1 of the study, patients will be randomised to receive either MabThera 0.5 g IV or placebo on days 1 and 15, followed by RoActemra at one of the ascending doses between 2 mg/kg and 8 mg/kg at weeks 4, 8 and 12 (MabThera arm) or 8 mg/kg (placebo arm). In Part 2, additional patients will be randomised to one of 2 groups to receive MabThera 0.5 g on days 1 and 15 followed by the selected dose (from Part 1) of RoActemra at weeks 4, 8 and 12, or placebo on days 1 and 15 followed by RoActemra 8 mg/kg at weeks 4, 8 and 12. All patients will then be eligible to receive extension treatment withRoActemra every 4 weeks. The anticipated time on study treatment is 12 months, and the target sample size is < 100 individuals. |
| Participants | Adult patients, 18 to 65 years of age; rheumatoid arthritis, functional status I‐III; SJC ≥ 4 (28 joint count) and TJC ≥ (28 joint count) at screening and baseline; RF and/or anti‐CCP positive; may have failed up to 1 approved anti‐TNF agent (infliximab, etanercept or adalimumab); inadequate response to methotrexate, at a dose of 7.5 to 25 mg weekly for at least 12 weeks, at a stable dose for past 4 weeks |
| Interventions | Rituximab (MabThera) 0.5 g IV on days 1 and 15 (Parts 1 and 2) + tocilizumab (RoActemra) 2 mg/kg to 8 mg/kg IV in Part 1 and selected dose in Part 2, on weeks 4, 8 and 12‐‐‐Arm 1 8 mg/kg IV on weeks 4, 8 and 12 (Parts 1 and 2)‐‐‐ Arm 2 Placebo IV on days 1 and 15 (Parts 1 and 2) + tocilizumab 2 mg/kg to 8mg/kg IV in Part 1 and selected dose in Part 2, on weeks 4, 8 and 12‐‐‐Arm 1 8 mg/kg IV on weeks 4, 8 and 12 (Parts 1 and 2)‐‐‐ Arm 2 |
| Outcomes | Primary outcome measures: Proportion of patients with DAS ≤ 3.2 |
| Starting date | March 2009 |
| Contact information | Hoffmann‐La Roche |
| Notes | A Study of Combination Treatment With MabThera (Rituximab) and RoActemra (Tocilizumab) Versus RoActemra in Patients With Rheumatoid Arthritis With an Incomplete Response to Methotrexate |
| Trial name or title | A Double‐Blind, Randomized, Multicenter, Phase II Study of the Safety and Efficacy of Two Rituximab Regimens in Subjects With Moderate to Severe Active Rheumatoid Arthritis Receiving Stable Doses of Methotrexate |
| Methods | Phase II, randomized, double‐blind, multicentre study to evaluate the safety and efficacy of rituximab, administered at two different regimens for 2 years |
| Participants | Subjects with moderate to severe active RA receiving stable doses of methotrexate, 18 years to 65 years, diagnosis of RA for at least 6 months |
| Interventions | Drug: rituximab versus placebo Concomitant treatment: methotrexate + folate |
| Outcomes | Primary outcome measures: Proportion of subjects with either an infection or a Grade III or IV adverse event (NCI CTCAE, Version 3.0) |
| Starting date | April 2006 |
| Contact information | William Reiss, Pharm.D, Genentech |
| Notes | A study of the safety and efficacy of rituximab in patients with moderate to severe rheumatoid arthritis receiving methotrexate (RUMBA) |
| Trial name or title | A Randomized, Placebo Controlled, Multicenter Clinical Study Investigating Efficacy of Rituximab (Mabthera/Rituxan) in the Inhibition of Joint Structural Damage Assessed by Magnetic Resonance Imaging in Patients With Rheumatoid Arthritis and Inadequate Response to Methotrexate ‐ the RA SCORE Study |
| Methods | This 3‐arm study will assess the efficacy of MabThera in the prevention of progression of structural joint damage in patients with active rheumatoid arthritis who have an inadequate clinical response to methotrexate. Patients will be randomised to receive MabThera 1000 mg IV, MabThera 500 mg IV or placebo IV on days 1 and 15; all patients will receive concomitant methotrexate at a stable dosage of 12.5 to 25 mg/week throughout the study. Further courses of MabThera will be provided to eligible patients. Structural joint damage will be assessed by magnetic resonance imaging (MRI) at baseline, and at intervals during the study. The anticipated time on study treatment is 1 to 2 years, and the target sample size is 100 to 500 individuals |
| Participants | Primary outcome measures: Changes in MRI bone erosion score from baseline |
| Interventions | 3 study groups: i) rituximab (MabThera/Rituxan) 1000 mg IV on days 1 and 15 + methotrexate 12.5 to 25 mg/week; ii) rituximab (MabThera/Rituxan) 500 mg IV on days 1 and 15 + methotrexate 12.5 to 25 mg/week; iii) Placebo IV on days 1 and 15 + methotrexate 12.5 to 25 mg/week |
| Outcomes | Primary outcome measures: Changes in MRI bone erosion score from baseline |
| Starting date | November 2007 |
| Contact information | Hoffmann‐La Roche |
| Notes | SCORE study: A study of MabThera (rituximab) in patients with rheumatoid arthritis and inadequate response to methotrexate |
Data and analyses
| Outcome or subgroup title | No. of studies | No. of participants | Statistical method | Effect size |
| 1 ACR20 Show forest plot | 5 | Risk Ratio (M‐H, Random, 95% CI) | Subtotals only | |
| Analysis 1.1  Comparison 1 Benefits ‐ RTX (2 x 1000 mg) + MTX versus MTX, Outcome 1 ACR20. | ||||
| 1.1 24 weeks | 4 | 1165 | Risk Ratio (M‐H, Random, 95% CI) | 2.24 [1.86, 2.69] |
| 1.2 48‐52 weeks | 4 | 852 | Risk Ratio (M‐H, Random, 95% CI) | 1.53 [1.09, 2.13] |
| 1.3 104 weeks | 2 | 579 | Risk Ratio (M‐H, Random, 95% CI) | 1.57 [0.82, 3.01] |
| 2 ACR 50 Show forest plot | 5 | Risk Ratio (M‐H, Random, 95% CI) | Subtotals only | |
| Analysis 1.2  Comparison 1 Benefits ‐ RTX (2 x 1000 mg) + MTX versus MTX, Outcome 2 ACR 50. | ||||
| 2.1 24 weeks | 4 | 1165 | Risk Ratio (M‐H, Random, 95% CI) | 3.25 [2.31, 4.58] |
| 2.2 48‐56 weeks | 4 | 852 | Risk Ratio (M‐H, Random, 95% CI) | 2.24 [1.26, 3.95] |
| 2.3 104 weeks | 2 | 579 | Risk Ratio (M‐H, Random, 95% CI) | 1.49 [1.25, 1.77] |
| 3 ACR 70 Show forest plot | 5 | Risk Ratio (M‐H, Random, 95% CI) | Subtotals only | |
| Analysis 1.3  Comparison 1 Benefits ‐ RTX (2 x 1000 mg) + MTX versus MTX, Outcome 3 ACR 70. | ||||
| 3.1 24 weeks | 4 | 1165 | Risk Ratio (M‐H, Random, 95% CI) | 3.91 [1.84, 8.31] |
| 3.2 48‐56 weeks | 4 | 852 | Risk Ratio (M‐H, Random, 95% CI) | 1.95 [1.53, 2.49] |
| 3.3 104 weeks | 2 | 579 | Risk Ratio (M‐H, Random, 95% CI) | 1.84 [1.44, 2.37] |
| 4 ACR 90 Show forest plot | 1 | Risk Ratio (M‐H, Fixed, 95% CI) | Subtotals only | |
| Analysis 1.4  Comparison 1 Benefits ‐ RTX (2 x 1000 mg) + MTX versus MTX, Outcome 4 ACR 90. | ||||
| 4.1 52 weeks | 1 | 499 | Risk Ratio (M‐H, Fixed, 95% CI) | 1.81 [1.11, 2.96] |
| 4.2 104 weeks | 1 | 499 | Risk Ratio (M‐H, Fixed, 95% CI) | 1.81 [1.22, 2.68] |
| 5 DAS 28 Show forest plot | 5 | Mean Difference (IV, Random, 95% CI) | Subtotals only | |
| Analysis 1.5  Comparison 1 Benefits ‐ RTX (2 x 1000 mg) + MTX versus MTX, Outcome 5 DAS 28. | ||||
| 5.1 24 weeks | 5 | 1661 | Mean Difference (IV, Random, 95% CI) | ‐1.20 [‐1.48, ‐0.92] |
| 5.2 48‐56 weeks | 1 | 499 | Mean Difference (IV, Random, 95% CI) | ‐1.15 [‐1.37, ‐0.93] |
| 5.3 104 weeks | 1 | 499 | Mean Difference (IV, Random, 95% CI) | ‐1.59 [‐1.81, ‐1.37] |
| 6 LDA (DAS28 =or<3.2) Show forest plot | 4 | Risk Ratio (M‐H, Random, 95% CI) | Subtotals only | |
| Analysis 1.6  Comparison 1 Benefits ‐ RTX (2 x 1000 mg) + MTX versus MTX, Outcome 6 LDA (DAS28 =or<3.2). | ||||
| 6.1 24 weeks | 2 | 834 | Risk Ratio (M‐H, Random, 95% CI) | 4.23 [1.42, 12.56] |
| 6.2 48‐52 weeks | 3 | 772 | Risk Ratio (M‐H, Random, 95% CI) | 2.09 [1.60, 2.73] |
| 6.3 104 weeks | 1 | 499 | Risk Ratio (M‐H, Random, 95% CI) | 1.93 [1.50, 2.48] |
| 7 Clinical Remission (DAS28<2.6) Show forest plot | 4 | Risk Difference (M‐H, Random, 95% CI) | Subtotals only | |
| Analysis 1.7  Comparison 1 Benefits ‐ RTX (2 x 1000 mg) + MTX versus MTX, Outcome 7 Clinical Remission (DAS28<2.6). | ||||
| 7.1 24 weeks | 2 | 834 | Risk Difference (M‐H, Random, 95% CI) | 0.08 [0.06, 0.11] |
| 7.2 48‐52 weeks | 3 | 772 | Risk Difference (M‐H, Random, 95% CI) | 0.11 [0.02, 0.20] |
| 7.3 104 weeks | 1 | 499 | Risk Difference (M‐H, Random, 95% CI) | 0.19 [0.12, 0.26] |
| 8 Moderate or good EULAR response Show forest plot | 5 | Risk Ratio (M‐H, Random, 95% CI) | Subtotals only | |
| Analysis 1.8  Comparison 1 Benefits ‐ RTX (2 x 1000 mg) + MTX versus MTX, Outcome 8 Moderate or good EULAR response. | ||||
| 8.1 24 weeks | 5 | 1664 | Risk Ratio (M‐H, Random, 95% CI) | 1.94 [1.55, 2.43] |
| 8.2 48 weeks | 1 | 499 | Risk Ratio (M‐H, Random, 95% CI) | 2.32 [1.72, 3.14] |
| 8.3 104 weeks | 2 | 579 | Risk Ratio (M‐H, Random, 95% CI) | 2.05 [1.59, 2.64] |
| 9 HAQ‐DI Show forest plot | 4 | Mean Difference (IV, Fixed, 95% CI) | Subtotals only | |
| Analysis 1.9  Comparison 1 Benefits ‐ RTX (2 x 1000 mg) + MTX versus MTX, Outcome 9 HAQ‐DI. | ||||
| 9.1 24 weeks | 4 | 1318 | Mean Difference (IV, Fixed, 95% CI) | ‐0.24 [‐0.30, ‐0.18] |
| 9.2 48‐52 weeks | 2 | 562 | Mean Difference (IV, Fixed, 95% CI) | ‐0.29 [‐0.38, ‐0.20] |
| 9.3 72 weeks | 1 | 43 | Mean Difference (IV, Fixed, 95% CI) | ‐0.3 [‐0.64, 0.04] |
| 9.4 104 weeks | 1 | 499 | Mean Difference (IV, Fixed, 95% CI) | ‐0.44 [‐0.54, ‐0.34] |
| 10 HAQ‐DI MCID=‐0.22 Show forest plot | 5 | Risk Ratio (M‐H, Random, 95% CI) | Subtotals only | |
| Analysis 1.10  Comparison 1 Benefits ‐ RTX (2 x 1000 mg) + MTX versus MTX, Outcome 10 HAQ‐DI MCID=‐0.22. | ||||
| 10.1 24 weeks | 4 | 1161 | Risk Ratio (M‐H, Random, 95% CI) | 1.61 [1.22, 2.12] |
| 10.2 48‐56 weeks | 2 | 562 | Risk Ratio (M‐H, Random, 95% CI) | 1.57 [0.71, 3.44] |
| 10.3 72 weeks | 1 | 43 | Risk Ratio (M‐H, Random, 95% CI) | 2.32 [0.78, 6.89] |
| 10.4 104 weeks | 2 | 523 | Risk Ratio (M‐H, Random, 95% CI) | 1.39 [1.25, 1.55] |
| 11 SF‐36 PCS Show forest plot | 4 | 1393 | Mean Difference (IV, Fixed, 95% CI) | ‐4.11 [‐4.98, ‐3.25] |
| Analysis 1.11  Comparison 1 Benefits ‐ RTX (2 x 1000 mg) + MTX versus MTX, Outcome 11 SF‐36 PCS. | ||||
| 11.1 24 weeks | 3 | 912 | Mean Difference (IV, Fixed, 95% CI) | ‐4.44 [‐5.52, ‐3.36] |
| 11.2 52 weeks | 1 | 481 | Mean Difference (IV, Fixed, 95% CI) | ‐3.53 [‐4.97, ‐2.09] |
| 12 SF‐36 PCS (=or>MCID of 5 or 5.42) Show forest plot | 4 | 1526 | Risk Ratio (M‐H, Random, 95% CI) | 1.96 [1.14, 3.36] |
| Analysis 1.12  Comparison 1 Benefits ‐ RTX (2 x 1000 mg) + MTX versus MTX, Outcome 12 SF‐36 PCS (=or>MCID of 5 or 5.42). | ||||
| 12.1 24 weeks | 3 | 1045 | Risk Ratio (M‐H, Random, 95% CI) | 2.32 [1.41, 3.84] |
| 12.2 52 weeks | 1 | 481 | Risk Ratio (M‐H, Random, 95% CI) | 1.21 [1.07, 1.36] |
| 13 SF‐36 MCS Show forest plot | 4 | 1393 | Mean Difference (IV, Fixed, 95% CI) | ‐2.22 [‐3.52, ‐0.92] |
| Analysis 1.13  Comparison 1 Benefits ‐ RTX (2 x 1000 mg) + MTX versus MTX, Outcome 13 SF‐36 MCS. | ||||
| 13.1 24 weeks | 3 | 912 | Mean Difference (IV, Fixed, 95% CI) | ‐2.44 [‐4.05, ‐0.82] |
| 13.2 52 weeks | 1 | 481 | Mean Difference (IV, Fixed, 95% CI) | ‐1.81 [‐4.02, 0.39] |
| 14 SF‐36 MCS (=or>MCID of 5 or 6.33) Show forest plot | 3 | 1282 | Odds Ratio (M‐H, Random, 95% CI) | 1.75 [1.27, 2.42] |
| Analysis 1.14  Comparison 1 Benefits ‐ RTX (2 x 1000 mg) + MTX versus MTX, Outcome 14 SF‐36 MCS (=or>MCID of 5 or 6.33). | ||||
| 14.1 24 weeks | 2 | 801 | Odds Ratio (M‐H, Random, 95% CI) | 2.07 [1.50, 2.84] |
| 14.2 52 weeks | 1 | 481 | Odds Ratio (M‐H, Random, 95% CI) | 1.38 [0.97, 1.98] |
| 15 FACIT‐F Show forest plot | 4 | 1570 | Mean Difference (IV, Random, 95% CI) | ‐5.22 [‐7.71, ‐2.74] |
| Analysis 1.15  Comparison 1 Benefits ‐ RTX (2 x 1000 mg) + MTX versus MTX, Outcome 15 FACIT‐F. | ||||
| 15.1 24 weeks | 3 | 1081 | Mean Difference (IV, Random, 95% CI) | ‐5.84 [‐8.81, ‐2.88] |
| 15.2 52 weeks | 1 | 489 | Mean Difference (IV, Random, 95% CI) | ‐3.45 [‐5.33, ‐1.57] |
| 16 FACIT‐F MCID>= 4or 3.56 Show forest plot | 3 | 1232 | Risk Ratio (M‐H, Random, 95% CI) | 1.59 [1.00, 2.53] |
| Analysis 1.16  Comparison 1 Benefits ‐ RTX (2 x 1000 mg) + MTX versus MTX, Outcome 16 FACIT‐F MCID>= 4or 3.56. | ||||
| 16.1 24 weeks | 2 | 743 | Risk Ratio (M‐H, Random, 95% CI) | 1.95 [1.65, 2.30] |
| 16.2 52 weeks | 1 | 489 | Risk Ratio (M‐H, Random, 95% CI) | 1.11 [0.99, 1.24] |
| 17 VAS‐pain Show forest plot | 3 | 1238 | Mean Difference (IV, Random, 95% CI) | ‐13.89 [‐21.31, ‐6.48] |
| Analysis 1.17  Comparison 1 Benefits ‐ RTX (2 x 1000 mg) + MTX versus MTX, Outcome 17 VAS‐pain. | ||||
| 17.1 24 weeks | 2 | 743 | Mean Difference (IV, Random, 95% CI) | ‐14.57 [‐27.37, ‐1.77] |
| 17.2 52 weeks | 1 | 495 | Mean Difference (IV, Random, 95% CI) | ‐12.2 [‐16.87, ‐7.53] |
| 18 Total radiographic score Show forest plot | 2 | Mean Difference (IV, Fixed, 95% CI) | Subtotals only | |
| Analysis 1.18  Comparison 1 Benefits ‐ RTX (2 x 1000 mg) + MTX versus MTX, Outcome 18 Total radiographic score. | ||||
| 18.1 24 weeks | 2 | 975 | Mean Difference (IV, Fixed, 95% CI) | ‐0.48 [‐0.83, ‐0.13] |
| 18.2 48‐56 weeks | 2 | 932 | Mean Difference (IV, Fixed, 95% CI) | ‐0.87 [‐1.29, ‐0.45] |
| 18.3 104 weeks | 2 | 945 | Mean Difference (IV, Fixed, 95% CI) | ‐1.57 [‐1.99, ‐1.16] |
| 19 Joint Space Narrowing Show forest plot | 2 | Mean Difference (IV, Fixed, 95% CI) | Subtotals only | |
| Analysis 1.19  Comparison 1 Benefits ‐ RTX (2 x 1000 mg) + MTX versus MTX, Outcome 19 Joint Space Narrowing. | ||||
| 19.1 24 weeks | 2 | 975 | Mean Difference (IV, Fixed, 95% CI) | ‐0.20 [‐0.35, ‐0.04] |
| 19.2 48‐56 weeks | 1 | 456 | Mean Difference (IV, Fixed, 95% CI) | ‐0.58 [‐0.98, ‐0.18] |
| 19.3 104 weeks | 2 | 944 | Mean Difference (IV, Fixed, 95% CI) | ‐0.48 [‐0.67, ‐0.29] |
| 20 Radiologic erosions Show forest plot | 2 | Mean Difference (IV, Fixed, 95% CI) | Subtotals only | |
| Analysis 1.20  Comparison 1 Benefits ‐ RTX (2 x 1000 mg) + MTX versus MTX, Outcome 20 Radiologic erosions. | ||||
| 20.1 24 weeks | 2 | 975 | Mean Difference (IV, Fixed, 95% CI) | ‐0.33 [‐0.55, ‐0.11] |
| 20.2 48‐56 weeks | 2 | 932 | Mean Difference (IV, Fixed, 95% CI) | ‐0.56 [‐0.83, ‐0.30] |
| 20.3 104 weeks | 2 | 945 | Mean Difference (IV, Fixed, 95% CI) | ‐1.09 [‐1.35, ‐0.83] |
| 21 No radiographic progression Show forest plot | 2 | Risk Ratio (M‐H, Fixed, 95% CI) | Subtotals only | |
| Analysis 1.21  Comparison 1 Benefits ‐ RTX (2 x 1000 mg) + MTX versus MTX, Outcome 21 No radiographic progression. | ||||
| 21.1 24 weeks | 1 | 476 | Risk Ratio (M‐H, Fixed, 95% CI) | 1.18 [1.03, 1.35] |
| 21.2 52‐56 weeks | 2 | 940 | Risk Ratio (M‐H, Fixed, 95% CI) | 1.25 [1.11, 1.40] |
| 21.3 104 weeks | 2 | 945 | Risk Ratio (M‐H, Fixed, 95% CI) | 1.50 [1.30, 1.73] |
| 22 No worsening of erosions Show forest plot | 2 | Risk Ratio (M‐H, Fixed, 95% CI) | Subtotals only | |
| Analysis 1.22  Comparison 1 Benefits ‐ RTX (2 x 1000 mg) + MTX versus MTX, Outcome 22 No worsening of erosions. | ||||
| 22.1 24 weeks | 1 | 445 | Risk Ratio (M‐H, Fixed, 95% CI) | 1.10 [0.95, 1.27] |
| 22.2 52‐56 weeks | 1 | 464 | Risk Ratio (M‐H, Fixed, 95% CI) | 1.29 [1.09, 1.52] |
| 22.3 104 weeks | 2 | 945 | Risk Ratio (M‐H, Fixed, 95% CI) | 1.45 [1.27, 1.67] |
| Outcome or subgroup title | No. of studies | No. of participants | Statistical method | Effect size |
| 1 ACR 20 Show forest plot | 1 | Risk Ratio (M‐H, Fixed, 95% CI) | Totals not selected | |
| Analysis 2.1  Comparison 2 Benefits ‐ RTX monotherapy versus MTX monotherapy, Outcome 1 ACR 20. | ||||
| 1.1 24 weeks | 1 | Risk Ratio (M‐H, Fixed, 95% CI) | 0.0 [0.0, 0.0] | |
| 1.2 48 weeks | 1 | Risk Ratio (M‐H, Fixed, 95% CI) | 0.0 [0.0, 0.0] | |
| 1.3 104 weeks | 1 | Risk Ratio (M‐H, Fixed, 95% CI) | 0.0 [0.0, 0.0] | |
| 2 ACR 50 Show forest plot | 1 | Risk Ratio (M‐H, Fixed, 95% CI) | Totals not selected | |
| Analysis 2.2  Comparison 2 Benefits ‐ RTX monotherapy versus MTX monotherapy, Outcome 2 ACR 50. | ||||
| 2.1 24 weeks | 1 | Risk Ratio (M‐H, Fixed, 95% CI) | 0.0 [0.0, 0.0] | |
| 2.2 48‐56 weeks | 1 | Risk Ratio (M‐H, Fixed, 95% CI) | 0.0 [0.0, 0.0] | |
| 2.3 104 weeks | 1 | Risk Ratio (M‐H, Fixed, 95% CI) | 0.0 [0.0, 0.0] | |
| 3 ACR 70 Show forest plot | 1 | Risk Ratio (M‐H, Fixed, 95% CI) | Totals not selected | |
| Analysis 2.3  Comparison 2 Benefits ‐ RTX monotherapy versus MTX monotherapy, Outcome 3 ACR 70. | ||||
| 3.1 24 weeks | 1 | Risk Ratio (M‐H, Fixed, 95% CI) | 0.0 [0.0, 0.0] | |
| 3.2 48‐56 weeks | 1 | Risk Ratio (M‐H, Fixed, 95% CI) | 0.0 [0.0, 0.0] | |
| 3.3 104 weeks | 1 | Risk Ratio (M‐H, Fixed, 95% CI) | 0.0 [0.0, 0.0] | |
| 4 DAS 28 Show forest plot | 1 | Mean Difference (IV, Fixed, 95% CI) | Subtotals only | |
| Analysis 2.4  Comparison 2 Benefits ‐ RTX monotherapy versus MTX monotherapy, Outcome 4 DAS 28. | ||||
| 4.1 24 weeks | 1 | 80 | Mean Difference (IV, Fixed, 95% CI) | ‐0.9 [‐1.47, ‐0.33] |
| 5 Moderate or good EULAR response Show forest plot | 1 | Risk Ratio (M‐H, Fixed, 95% CI) | Subtotals only | |
| Analysis 2.5  Comparison 2 Benefits ‐ RTX monotherapy versus MTX monotherapy, Outcome 5 Moderate or good EULAR response. | ||||
| 5.1 24 weeks | 1 | 80 | Risk Ratio (M‐H, Fixed, 95% CI) | 1.7 [1.21, 2.38] |
| 6 HAQ‐DI Show forest plot | 1 | Mean Difference (IV, Fixed, 95% CI) | Subtotals only | |
| Analysis 2.6  Comparison 2 Benefits ‐ RTX monotherapy versus MTX monotherapy, Outcome 6 HAQ‐DI. | ||||
| 6.1 24 weeks | 1 | 75 | Mean Difference (IV, Fixed, 95% CI) | ‐0.4 [‐0.65, ‐0.15] |
| 6.2 48 weeks | 1 | 56 | Mean Difference (IV, Fixed, 95% CI) | ‐0.20 [‐0.49, 0.09] |
| 6.3 72 weeks | 1 | 32 | Mean Difference (IV, Fixed, 95% CI) | ‐0.3 [‐0.68, 0.08] |
| 7 % of patients achieving HAQ‐DI MCID=‐0.25 Show forest plot | 1 | Risk Ratio (M‐H, Fixed, 95% CI) | Subtotals only | |
| Analysis 2.7  Comparison 2 Benefits ‐ RTX monotherapy versus MTX monotherapy, Outcome 7 % of patients achieving HAQ‐DI MCID=‐0.25. | ||||
| 7.1 24 weeks | 1 | 75 | Risk Ratio (M‐H, Fixed, 95% CI) | 1.49 [0.99, 2.25] |
| 7.2 48‐56 weeks | 1 | 56 | Risk Ratio (M‐H, Fixed, 95% CI) | 1.50 [0.71, 3.18] |
| 7.3 72 weeks | 1 | 32 | Risk Ratio (M‐H, Fixed, 95% CI) | 0.88 [0.21, 3.73] |
| 7.4 104 weeks | 1 | 10 | Risk Ratio (M‐H, Fixed, 95% CI) | 1.50 [0.13, 17.67] |
| Outcome or subgroup title | No. of studies | No. of participants | Statistical method | Effect size |
| 1 ACR 20 Show forest plot | 3 | Risk Difference (M‐H, Fixed, 95% CI) | Subtotals only | |
| Analysis 3.1  Comparison 3 Benefits ‐ RTX (2 x 500 mg) + MTX versus MTX, Outcome 1 ACR 20. | ||||
| 1.1 24 weeks | 2 | 584 | Risk Difference (M‐H, Fixed, 95% CI) | 0.30 [0.22, 0.37] |
| 1.2 48‐52 weeks | 2 | 598 | Risk Difference (M‐H, Fixed, 95% CI) | 0.14 [0.07, 0.21] |
| 1.3 104 weeks | 1 | 498 | Risk Difference (M‐H, Fixed, 95% CI) | 0.16 [0.08, 0.25] |
| 2 ACR 50 Show forest plot | 3 | Risk Ratio (M‐H, Fixed, 95% CI) | Subtotals only | |
| Analysis 3.2  Comparison 3 Benefits ‐ RTX (2 x 500 mg) + MTX versus MTX, Outcome 2 ACR 50. | ||||
| 2.1 24 weeks | 2 | 584 | Risk Ratio (M‐H, Fixed, 95% CI) | 2.69 [1.85, 3.90] |
| 2.2 48‐52 weeks | 2 | 598 | Risk Ratio (M‐H, Fixed, 95% CI) | 1.47 [1.23, 1.74] |
| 2.3 104 weeks | 1 | 498 | Risk Ratio (M‐H, Fixed, 95% CI) | 1.42 [1.19, 1.69] |
| 3 ACR 70 Show forest plot | 3 | Risk Ratio (M‐H, Random, 95% CI) | Subtotals only | |
| Analysis 3.3  Comparison 3 Benefits ‐ RTX (2 x 500 mg) + MTX versus MTX, Outcome 3 ACR 70. | ||||
| 3.1 24 weeks | 2 | 584 | Risk Ratio (M‐H, Random, 95% CI) | 2.07 [1.14, 3.77] |
| 3.2 48‐52 weeks | 2 | 598 | Risk Ratio (M‐H, Random, 95% CI) | 1.42 [0.71, 2.86] |
| 3.3 104 weeks | 1 | 498 | Risk Ratio (M‐H, Random, 95% CI) | 1.69 [1.31, 2.20] |
| 4 ACR 90 Show forest plot | 1 | Risk Ratio (M‐H, Fixed, 95% CI) | Totals not selected | |
| Analysis 3.4  Comparison 3 Benefits ‐ RTX (2 x 500 mg) + MTX versus MTX, Outcome 4 ACR 90. | ||||
| 4.1 52 weeks | 1 | Risk Ratio (M‐H, Fixed, 95% CI) | 0.0 [0.0, 0.0] | |
| 4.2 104 weeks | 1 | Risk Ratio (M‐H, Fixed, 95% CI) | 0.0 [0.0, 0.0] | |
| 5 DAS 28 Show forest plot | 3 | Mean Difference (IV, Fixed, 95% CI) | Subtotals only | |
| Analysis 3.5  Comparison 3 Benefits ‐ RTX (2 x 500 mg) + MTX versus MTX, Outcome 5 DAS 28. | ||||
| 5.1 24 weeks | 3 | 1079 | Mean Difference (IV, Fixed, 95% CI) | ‐0.96 [‐1.11, ‐0.81] |
| 5.2 52 weeks | 1 | 498 | Mean Difference (IV, Fixed, 95% CI) | ‐0.99 [‐1.21, ‐0.77] |
| 5.3 104 weeks | 1 | 498 | Mean Difference (IV, Fixed, 95% CI) | ‐1.59 [‐1.81, ‐1.37] |
| 6 LDA (DAS28 =or<3.2) Show forest plot | 3 | Risk Ratio (M‐H, Fixed, 95% CI) | Subtotals only | |
| Analysis 3.6  Comparison 3 Benefits ‐ RTX (2 x 500 mg) + MTX versus MTX, Outcome 6 LDA (DAS28 =or<3.2). | ||||
| 6.1 24 weeks | 1 | 339 | Risk Ratio (M‐H, Fixed, 95% CI) | 3.73 [1.76, 7.93] |
| 6.2 48‐52 weeks | 2 | 598 | Risk Ratio (M‐H, Fixed, 95% CI) | 1.94 [1.48, 2.56] |
| 6.3 104 weeks | 1 | 498 | Risk Ratio (M‐H, Fixed, 95% CI) | 1.81 [1.40, 2.33] |
| 7 Clinical Remission (DAS28<2.6) Show forest plot | 3 | Risk Ratio (M‐H, Fixed, 95% CI) | Subtotals only | |
| Analysis 3.7  Comparison 3 Benefits ‐ RTX (2 x 500 mg) + MTX versus MTX, Outcome 7 Clinical Remission (DAS28<2.6). | ||||
| 7.1 24 weeks | 1 | 498 | Risk Ratio (M‐H, Fixed, 95% CI) | 4.0 [1.36, 11.80] |
| 7.2 48 weeks | 2 | 598 | Risk Ratio (M‐H, Fixed, 95% CI) | 2.03 [1.40, 2.96] |
| 7.3 104 weeks | 1 | 498 | Risk Ratio (M‐H, Fixed, 95% CI) | 2.66 [1.84, 3.83] |
| 8 Moderate or good EULAR response Show forest plot | 3 | Risk Ratio (M‐H, Fixed, 95% CI) | Subtotals only | |
| Analysis 3.8  Comparison 3 Benefits ‐ RTX (2 x 500 mg) + MTX versus MTX, Outcome 8 Moderate or good EULAR response. | ||||
| 8.1 24 weeks | 3 | 1082 | Risk Ratio (M‐H, Fixed, 95% CI) | 1.85 [1.58, 2.17] |
| 8.2 52 weeks | 1 | 498 | Risk Ratio (M‐H, Fixed, 95% CI) | 2.11 [1.56, 2.86] |
| 8.3 104 weeks | 1 | 498 | Risk Ratio (M‐H, Fixed, 95% CI) | 1.93 [1.48, 2.52] |
| 9 HAQ‐DI Show forest plot | 2 | Mean Difference (IV, Fixed, 95% CI) | Subtotals only | |
| Analysis 3.9  Comparison 3 Benefits ‐ RTX (2 x 500 mg) + MTX versus MTX, Outcome 9 HAQ‐DI. | ||||
| 9.1 24 weeks | 2 | 742 | Mean Difference (IV, Fixed, 95% CI) | ‐0.22 [‐0.30, ‐0.14] |
| 9.2 52 weeks | 1 | 498 | Mean Difference (IV, Fixed, 95% CI) | ‐0.28 [‐0.37, ‐0.18] |
| 9.3 104 weeks | 1 | 498 | Mean Difference (IV, Fixed, 95% CI) | ‐0.34 [‐0.44, ‐0.24] |
| 10 HAQ‐DI MCID=‐0.22 Show forest plot | 3 | Risk Ratio (M‐H, Random, 95% CI) | Subtotals only | |
| Analysis 3.10  Comparison 3 Benefits ‐ RTX (2 x 500 mg) + MTX versus MTX, Outcome 10 HAQ‐DI MCID=‐0.22. | ||||
| 10.1 24 weeks | 2 | 582 | Risk Ratio (M‐H, Random, 95% CI) | 1.58 [1.18, 2.11] |
| 10.2 52 weeks | 1 | 498 | Risk Ratio (M‐H, Random, 95% CI) | 1.13 [1.04, 1.22] |
| 10.3 104 weeks | 1 | 498 | Risk Ratio (M‐H, Random, 95% CI) | 1.36 [1.21, 1.52] |
| 11 SF‐36 PCS Show forest plot | 3 | 1018 | Mean Difference (IV, Fixed, 95% CI) | ‐3.52 [‐4.49, ‐2.56] |
| Analysis 3.11  Comparison 3 Benefits ‐ RTX (2 x 500 mg) + MTX versus MTX, Outcome 11 SF‐36 PCS. | ||||
| 11.1 24 weeks | 2 | 543 | Mean Difference (IV, Fixed, 95% CI) | ‐4.07 [‐5.36, ‐2.78] |
| 11.2 52 weeks | 1 | 475 | Mean Difference (IV, Fixed, 95% CI) | ‐2.84 [‐4.29, ‐1.39] |
| 12 SF‐36 PCS (=or>MCID of 5 or 5.42) Show forest plot | 3 | 1018 | Risk Ratio (M‐H, Random, 95% CI) | 1.53 [0.98, 2.39] |
| Analysis 3.12  Comparison 3 Benefits ‐ RTX (2 x 500 mg) + MTX versus MTX, Outcome 12 SF‐36 PCS (=or>MCID of 5 or 5.42). | ||||
| 12.1 24 weeks | 2 | 543 | Risk Ratio (M‐H, Random, 95% CI) | 1.84 [1.21, 2.80] |
| 12.2 52 weeks | 1 | 475 | Risk Ratio (M‐H, Random, 95% CI) | 1.11 [0.97, 1.26] |
| 13 SF‐36 MCS Show forest plot | 3 | 1021 | Mean Difference (IV, Fixed, 95% CI) | ‐1.81 [‐3.25, ‐0.36] |
| Analysis 3.13  Comparison 3 Benefits ‐ RTX (2 x 500 mg) + MTX versus MTX, Outcome 13 SF‐36 MCS. | ||||
| 13.1 24 weeks | 2 | 546 | Mean Difference (IV, Fixed, 95% CI) | ‐2.16 [‐4.07, ‐0.25] |
| 13.2 52 weeks | 1 | 475 | Mean Difference (IV, Fixed, 95% CI) | ‐1.33 [‐3.55, 0.88] |
| 14 SF‐36 MCS (=or>MCID of 6.33) Show forest plot | 2 | 774 | Risk Ratio (M‐H, Random, 95% CI) | 1.16 [0.87, 1.55] |
| Analysis 3.14  Comparison 3 Benefits ‐ RTX (2 x 500 mg) + MTX versus MTX, Outcome 14 SF‐36 MCS (=or>MCID of 6.33). | ||||
| 14.1 24 weeks | 1 | 299 | Risk Ratio (M‐H, Random, 95% CI) | 1.41 [0.98, 2.03] |
| 14.2 52 weeks | 1 | 475 | Risk Ratio (M‐H, Random, 95% CI) | 1.04 [0.87, 1.24] |
| 15 FACIT‐F Show forest plot | 3 | 1063 | Mean Difference (IV, Fixed, 95% CI) | ‐3.09 [‐4.35, ‐1.83] |
| Analysis 3.15  Comparison 3 Benefits ‐ RTX (2 x 500 mg) + MTX versus MTX, Outcome 15 FACIT‐F. | ||||
| 15.1 24 weeks | 2 | 580 | Mean Difference (IV, Fixed, 95% CI) | ‐3.54 [‐5.23, ‐1.85] |
| 15.2 52 weeks | 1 | 483 | Mean Difference (IV, Fixed, 95% CI) | ‐2.53 [‐4.42, ‐0.64] |
| 16 FACIT‐F (= or > MCID of 3.5 or 4) Show forest plot | 1 | Risk Ratio (M‐H, Fixed, 95% CI) | Subtotals only | |
| Analysis 3.16  Comparison 3 Benefits ‐ RTX (2 x 500 mg) + MTX versus MTX, Outcome 16 FACIT‐F (= or > MCID of 3.5 or 4). | ||||
| 16.1 24 weeks | 1 | 245 | Risk Ratio (M‐H, Fixed, 95% CI) | 1.57 [1.18, 2.09] |
| 17 VAS pain Show forest plot | 2 | 739 | Mean Difference (IV, Fixed, 95% CI) | ‐8.30 [‐12.25, ‐4.35] |
| Analysis 3.17  Comparison 3 Benefits ‐ RTX (2 x 500 mg) + MTX versus MTX, Outcome 17 VAS pain. | ||||
| 17.1 24 weeks | 1 | 245 | Mean Difference (IV, Fixed, 95% CI) | ‐8.1 [‐14.96, ‐1.24] |
| 17.2 52 weeks | 1 | 494 | Mean Difference (IV, Fixed, 95% CI) | ‐8.40 [‐13.23, ‐3.57] |
| 18 Total radiographic score Show forest plot | 1 | Mean Difference (IV, Fixed, 95% CI) | Subtotals only | |
| Analysis 3.18  Comparison 3 Benefits ‐ RTX (2 x 500 mg) + MTX versus MTX, Outcome 18 Total radiographic score. | ||||
| 18.1 24 weeks | 1 | 471 | Mean Difference (IV, Fixed, 95% CI) | ‐0.12 [‐0.61, 0.37] |
| 18.2 52 weeks | 1 | 471 | Mean Difference (IV, Fixed, 95% CI) | ‐0.43 [‐0.92, 0.06] |
| 18.3 104 weeks | 1 | 472 | Mean Difference (IV, Fixed, 95% CI) | ‐1.19 [‐1.68, ‐0.70] |
| 19 Joint Space Narrowing Show forest plot | 1 | Mean Difference (IV, Fixed, 95% CI) | Subtotals only | |
| Analysis 3.19  Comparison 3 Benefits ‐ RTX (2 x 500 mg) + MTX versus MTX, Outcome 19 Joint Space Narrowing. | ||||
| 19.1 104 weeks | 1 | 472 | Mean Difference (IV, Fixed, 95% CI) | ‐0.37 [‐0.59, ‐0.15] |
| 20 Radiologic erosions Show forest plot | 1 | Mean Difference (IV, Fixed, 95% CI) | Subtotals only | |
| Analysis 3.20  Comparison 3 Benefits ‐ RTX (2 x 500 mg) + MTX versus MTX, Outcome 20 Radiologic erosions. | ||||
| 20.1 52 weeks | 1 | 471 | Mean Difference (IV, Fixed, 95% CI) | ‐0.29 [‐0.59, 0.02] |
| 20.2 104 weeks | 1 | 472 | Mean Difference (IV, Fixed, 95% CI) | ‐0.82 [‐1.13, ‐0.51] |
| 21 No radiographic progression Show forest plot | 1 | Risk Ratio (M‐H, Fixed, 95% CI) | Subtotals only | |
| Analysis 3.21  Comparison 3 Benefits ‐ RTX (2 x 500 mg) + MTX versus MTX, Outcome 21 No radiographic progression. | ||||
| 21.1 24 weeks | 1 | 472 | Risk Ratio (M‐H, Fixed, 95% CI) | 1.33 [1.07, 1.64] |
| 22 No increase in erosion score Show forest plot | 1 | Risk Ratio (M‐H, Fixed, 95% CI) | Subtotals only | |
| Analysis 3.22  Comparison 3 Benefits ‐ RTX (2 x 500 mg) + MTX versus MTX, Outcome 22 No increase in erosion score. | ||||
| 22.1 24 weeks | 1 | 472 | Risk Ratio (M‐H, Fixed, 95% CI) | 1.39 [1.14, 1.70] |
| Outcome or subgroup title | No. of studies | No. of participants | Statistical method | Effect size |
| 1 ACR 20 Show forest plot | 1 | Risk Ratio (M‐H, Fixed, 95% CI) | Subtotals only | |
| Analysis 4.1  Comparison 4 Benefits ‐ RTX (2 x 1000 mg) + CTX versus MTX, Outcome 1 ACR 20. | ||||
| 1.1 24 weeks | 1 | 81 | Risk Ratio (M‐H, Fixed, 95% CI) | 2.02 [1.30, 3.12] |
| 1.2 48 weeks | 1 | 81 | Risk Ratio (M‐H, Fixed, 95% CI) | 2.44 [1.22, 4.89] |
| 1.3 104 weeks | 1 | 81 | Risk Ratio (M‐H, Fixed, 95% CI) | 0.98 [0.31, 3.11] |
| 2 ACR 50 Show forest plot | 1 | Risk Ratio (M‐H, Fixed, 95% CI) | Subtotals only | |
| Analysis 4.2  Comparison 4 Benefits ‐ RTX (2 x 1000 mg) + CTX versus MTX, Outcome 2 ACR 50. | ||||
| 2.1 24 weeks | 1 | 81 | Risk Ratio (M‐H, Fixed, 95% CI) | 3.32 [1.35, 8.13] |
| 2.2 48 weeks | 1 | 81 | Risk Ratio (M‐H, Fixed, 95% CI) | 4.88 [1.14, 20.89] |
| 2.3 104 weeks | 1 | 81 | Risk Ratio (M‐H, Fixed, 95% CI) | 0.98 [0.26, 3.64] |
| 3 ACR 70 Show forest plot | 1 | Risk Ratio (M‐H, Fixed, 95% CI) | Subtotals only | |
| Analysis 4.3  Comparison 4 Benefits ‐ RTX (2 x 1000 mg) + CTX versus MTX, Outcome 3 ACR 70. | ||||
| 3.1 24 weeks | 1 | 81 | Risk Ratio (M‐H, Fixed, 95% CI) | 2.93 [0.63, 13.65] |
| 3.2 48 weeks | 1 | 81 | Risk Ratio (M‐H, Fixed, 95% CI) | 8.79 [0.49, 158.07] |
| 3.3 104 weeks | 1 | 81 | Risk Ratio (M‐H, Fixed, 95% CI) | 0.98 [0.21, 4.55] |
| 4 DAS 28 Show forest plot | 1 | Mean Difference (IV, Fixed, 95% CI) | Subtotals only | |
| Analysis 4.4  Comparison 4 Benefits ‐ RTX (2 x 1000 mg) + CTX versus MTX, Outcome 4 DAS 28. | ||||
| 4.1 24 weeks | 1 | 81 | Mean Difference (IV, Fixed, 95% CI) | ‐1.3 [‐1.89, ‐0.71] |
| 5 Moderate or good EULAR response Show forest plot | 1 | Risk Ratio (M‐H, Fixed, 95% CI) | Subtotals only | |
| Analysis 4.5  Comparison 4 Benefits ‐ RTX (2 x 1000 mg) + CTX versus MTX, Outcome 5 Moderate or good EULAR response. | ||||
| 5.1 24 weeks | 1 | 81 | Risk Ratio (M‐H, Fixed, 95% CI) | 1.71 [1.22, 2.39] |
| 6 HAQ‐DI Show forest plot | 1 | Mean Difference (IV, Fixed, 95% CI) | Subtotals only | |
| Analysis 4.6  Comparison 4 Benefits ‐ RTX (2 x 1000 mg) + CTX versus MTX, Outcome 6 HAQ‐DI. | ||||
| 6.1 24 weeks | 1 | 74 | Mean Difference (IV, Fixed, 95% CI) | ‐0.20 [‐0.48, 0.08] |
| 6.2 48 weeks | 1 | 59 | Mean Difference (IV, Fixed, 95% CI) | 0.0 [‐0.31, 0.31] |
| 6.3 72 weeks | 1 | 37 | Mean Difference (IV, Fixed, 95% CI) | 0.20 [‐0.19, 0.59] |
| 7 HAQ‐DI MCID=‐0.22 Show forest plot | 1 | Risk Ratio (M‐H, Fixed, 95% CI) | Subtotals only | |
| Analysis 4.7  Comparison 4 Benefits ‐ RTX (2 x 1000 mg) + CTX versus MTX, Outcome 7 HAQ‐DI MCID=‐0.22. | ||||
| 7.1 24 weeks | 1 | 74 | Risk Ratio (M‐H, Fixed, 95% CI) | 1.29 [0.83, 2.01] |
| 7.2 48‐56 weeks | 1 | 59 | Risk Ratio (M‐H, Fixed, 95% CI) | 1.37 [0.64, 2.92] |
| 7.3 72 weeks | 1 | 37 | Risk Ratio (M‐H, Fixed, 95% CI) | 1.14 [0.32, 4.05] |
| 7.4 104 weeks | 1 | 15 | Risk Ratio (M‐H, Fixed, 95% CI) | 0.67 [0.05, 8.73] |
| Outcome or subgroup title | No. of studies | No. of participants | Statistical method | Effect size |
| 1 ACR 20 Show forest plot | 1 | Risk Ratio (M‐H, Fixed, 95% CI) | Subtotals only | |
| Analysis 5.1  Comparison 5 Benefits ‐ RTX (2 x 500 mg) + MTX + TNFi versus MTX + TNFi, Outcome 1 ACR 20. | ||||
| 1.1 24 weeks | 1 | 51 | Risk Ratio (M‐H, Fixed, 95% CI) | 1.82 [0.57, 5.77] |
| 2 ACR 50 Show forest plot | 1 | Risk Ratio (M‐H, Fixed, 95% CI) | Subtotals only | |
| Analysis 5.2  Comparison 5 Benefits ‐ RTX (2 x 500 mg) + MTX + TNFi versus MTX + TNFi, Outcome 2 ACR 50. | ||||
| 2.1 24 weeks | 1 | 45 | Risk Ratio (M‐H, Fixed, 95% CI) | 1.45 [0.18, 11.75] |
| 3 LDA (DAS28 =or<3.2) Show forest plot | 1 | Risk Ratio (M‐H, Fixed, 95% CI) | Subtotals only | |
| Analysis 5.3  Comparison 5 Benefits ‐ RTX (2 x 500 mg) + MTX + TNFi versus MTX + TNFi, Outcome 3 LDA (DAS28 =or<3.2). | ||||
| 3.1 24 weeks | 1 | 51 | Risk Ratio (M‐H, Fixed, 95% CI) | 2.18 [0.52, 9.20] |
| 4 Clinical Remission (DAS28<2.6) Show forest plot | 1 | Risk Ratio (M‐H, Fixed, 95% CI) | Subtotals only | |
| Analysis 5.4  Comparison 5 Benefits ‐ RTX (2 x 500 mg) + MTX + TNFi versus MTX + TNFi, Outcome 4 Clinical Remission (DAS28<2.6). | ||||
| 4.1 24 weeks | 1 | 51 | Risk Ratio (M‐H, Fixed, 95% CI) | 3.27 [0.43, 25.11] |
| 5 HAQ‐DI MCID=‐0.25 Show forest plot | 1 | Risk Ratio (M‐H, Fixed, 95% CI) | Subtotals only | |
| Analysis 5.5  Comparison 5 Benefits ‐ RTX (2 x 500 mg) + MTX + TNFi versus MTX + TNFi, Outcome 5 HAQ‐DI MCID=‐0.25. | ||||
| 5.1 24 weeks | 1 | 51 | Risk Ratio (M‐H, Fixed, 95% CI) | 3.82 [1.59, 9.17] |
| Outcome or subgroup title | No. of studies | No. of participants | Statistical method | Effect size |
| 1 Total discontinuations Show forest plot | 5 | Risk Ratio (M‐H, Random, 95% CI) | Subtotals only | |
| Analysis 6.1  Comparison 6 Withdrawals ‐ RTX (2 x 1000 mg) + MTX versus MTX, Outcome 1 Total discontinuations. | ||||
| 1.1 24 weeks | 4 | 1282 | Risk Ratio (M‐H, Random, 95% CI) | 0.40 [0.32, 0.50] |
| 1.2 48‐52 weeks | 4 | 1444 | Risk Ratio (M‐H, Random, 95% CI) | 0.61 [0.40, 0.91] |
| 1.3 72 weeks | 1 | 80 | Risk Ratio (M‐H, Random, 95% CI) | 0.48 [0.28, 0.82] |
| 1.4 104 weeks | 2 | 579 | Risk Ratio (M‐H, Random, 95% CI) | 0.58 [0.45, 0.75] |
| 2 Lack of efficacy Show forest plot | 5 | Risk Ratio (M‐H, Fixed, 95% CI) | Subtotals only | |
| Analysis 6.2  Comparison 6 Withdrawals ‐ RTX (2 x 1000 mg) + MTX versus MTX, Outcome 2 Lack of efficacy. | ||||
| 2.1 24 weeks | 4 | 1282 | Risk Ratio (M‐H, Fixed, 95% CI) | 0.30 [0.23, 0.39] |
| 2.2 48‐52 weeks | 3 | 927 | Risk Ratio (M‐H, Fixed, 95% CI) | 0.15 [0.06, 0.36] |
| 2.3 72 weeks | 1 | 80 | Risk Ratio (M‐H, Fixed, 95% CI) | 0.44 [0.15, 1.33] |
| 2.4 104 weeks | 1 | 80 | Risk Ratio (M‐H, Fixed, 95% CI) | 0.24 [0.09, 0.64] |
| 3 Adverse Events Show forest plot | 5 | Risk Ratio (M‐H, Fixed, 95% CI) | Subtotals only | |
| Analysis 6.3  Comparison 6 Withdrawals ‐ RTX (2 x 1000 mg) + MTX versus MTX, Outcome 3 Adverse Events. | ||||
| 3.1 24 weeks | 4 | 1282 | Risk Ratio (M‐H, Fixed, 95% CI) | 2.72 [1.04, 7.13] |
| 3.2 48‐52 weeks | 3 | 927 | Risk Ratio (M‐H, Fixed, 95% CI) | 1.00 [0.44, 2.29] |
| 3.3 72 weeks | 1 | 80 | Risk Ratio (M‐H, Fixed, 95% CI) | 0.33 [0.04, 3.07] |
| 3.4 104 weeks | 2 | 579 | Risk Ratio (M‐H, Fixed, 95% CI) | 0.56 [0.25, 1.25] |
| 4 Other reasons Show forest plot | 5 | Risk Ratio (M‐H, Fixed, 95% CI) | Subtotals only | |
| Analysis 6.4  Comparison 6 Withdrawals ‐ RTX (2 x 1000 mg) + MTX versus MTX, Outcome 4 Other reasons. | ||||
| 4.1 24 weeks | 4 | 1282 | Risk Ratio (M‐H, Fixed, 95% CI) | 0.76 [0.32, 1.81] |
| 4.2 48‐52 weeks | 3 | 927 | Risk Ratio (M‐H, Fixed, 95% CI) | 0.84 [0.47, 1.49] |
| 4.3 72 weeks | 1 | 80 | Risk Ratio (M‐H, Fixed, 95% CI) | 0.54 [0.24, 1.21] |
| 4.4 104 weeks | 1 | 80 | Risk Ratio (M‐H, Fixed, 95% CI) | 1.31 [0.74, 2.32] |
| Outcome or subgroup title | No. of studies | No. of participants | Statistical method | Effect size |
| 1 Total discontinuations Show forest plot | 1 | Risk Ratio (M‐H, Fixed, 95% CI) | Subtotals only | |
| Analysis 7.1  Comparison 7 Withdrawals ‐ RTX monotherapy versus MTX monotherapy, Outcome 1 Total discontinuations. | ||||
| 1.1 24 weeks | 1 | 80 | Risk Ratio (M‐H, Fixed, 95% CI) | 0.67 [0.12, 3.78] |
| 1.2 48 weeks | 1 | 80 | Risk Ratio (M‐H, Fixed, 95% CI) | 0.6 [0.30, 1.21] |
| 1.3 72 weeks | 1 | 80 | Risk Ratio (M‐H, Fixed, 95% CI) | 0.92 [0.64, 1.32] |
| 1.4 104 weeks | 1 | 80 | Risk Ratio (M‐H, Fixed, 95% CI) | 1.06 [0.90, 1.25] |
| 2 Lack of efficacy Show forest plot | 1 | Risk Ratio (M‐H, Fixed, 95% CI) | Subtotals only | |
| Analysis 7.2  Comparison 7 Withdrawals ‐ RTX monotherapy versus MTX monotherapy, Outcome 2 Lack of efficacy. | ||||
| 2.1 24 weeks | 1 | 80 | Risk Ratio (M‐H, Fixed, 95% CI) | 0.2 [0.01, 4.04] |
| 2.2 48 weeks | 1 | 80 | Risk Ratio (M‐H, Fixed, 95% CI) | 0.29 [0.06, 1.29] |
| 2.3 72 weeks | 1 | 80 | Risk Ratio (M‐H, Fixed, 95% CI) | 0.33 [0.10, 1.14] |
| 2.4 104 weeks | 1 | 80 | Risk Ratio (M‐H, Fixed, 95% CI) | 0.29 [0.12, 0.72] |
| 3 Adverse Events Show forest plot | 1 | Risk Ratio (M‐H, Fixed, 95% CI) | Subtotals only | |
| Analysis 7.3  Comparison 7 Withdrawals ‐ RTX monotherapy versus MTX monotherapy, Outcome 3 Adverse Events. | ||||
| 3.1 24 weeks | 1 | 80 | Risk Ratio (M‐H, Fixed, 95% CI) | 2.0 [0.19, 21.18] |
| 3.2 48 weeks | 1 | 80 | Risk Ratio (M‐H, Fixed, 95% CI) | 1.33 [0.32, 5.58] |
| 3.3 72 weeks | 1 | 80 | Risk Ratio (M‐H, Fixed, 95% CI) | 1.67 [0.43, 6.51] |
| 3.4 104 weeks | 1 | 80 | Risk Ratio (M‐H, Fixed, 95% CI) | 1.25 [0.36, 4.32] |
| 4 Other reasons Show forest plot | 1 | Risk Ratio (M‐H, Fixed, 95% CI) | Subtotals only | |
| Analysis 7.4  Comparison 7 Withdrawals ‐ RTX monotherapy versus MTX monotherapy, Outcome 4 Other reasons. | ||||
| 4.1 24 weeks | 1 | 80 | Risk Ratio (M‐H, Fixed, 95% CI) | 0.0 [0.0, 0.0] |
| 4.2 48 weeks | 1 | 80 | Risk Ratio (M‐H, Fixed, 95% CI) | 0.6 [0.15, 2.34] |
| 4.3 72 weeks | 1 | 80 | Risk Ratio (M‐H, Fixed, 95% CI) | 1.15 [0.63, 2.10] |
| 4.4 104 weeks | 1 | 80 | Risk Ratio (M‐H, Fixed, 95% CI) | 2.0 [1.21, 3.30] |
| Outcome or subgroup title | No. of studies | No. of participants | Statistical method | Effect size |
| 1 Total discontinuations Show forest plot | 3 | Risk Ratio (M‐H, Fixed, 95% CI) | Subtotals only | |
| Analysis 8.1  Comparison 8 Withdrawals ‐ RTX (2 x 500 mg) + MTX versus MTX, Outcome 1 Total discontinuations. | ||||
| 1.1 24 weeks | 2 | 613 | Risk Ratio (M‐H, Fixed, 95% CI) | 0.30 [0.18, 0.50] |
| 1.2 48‐52 weeks | 2 | 844 | Risk Ratio (M‐H, Fixed, 95% CI) | 0.64 [0.43, 0.94] |
| 1.3 104 weeks | 1 | 498 | Risk Ratio (M‐H, Fixed, 95% CI) | 0.51 [0.36, 0.73] |
| 2 Lack of efficacy Show forest plot | 3 | Risk Ratio (M‐H, Fixed, 95% CI) | Subtotals only | |
| Analysis 8.2  Comparison 8 Withdrawals ‐ RTX (2 x 500 mg) + MTX versus MTX, Outcome 2 Lack of efficacy. | ||||
| 2.1 24 weeks | 2 | 613 | Risk Ratio (M‐H, Fixed, 95% CI) | 0.20 [0.10, 0.39] |
| 2.2 48‐52 weeks | 2 | 844 | Risk Ratio (M‐H, Fixed, 95% CI) | 0.37 [0.19, 0.73] |
| 3 Adverse Events Show forest plot | 3 | Risk Ratio (M‐H, Fixed, 95% CI) | Subtotals only | |
| Analysis 8.3  Comparison 8 Withdrawals ‐ RTX (2 x 500 mg) + MTX versus MTX, Outcome 3 Adverse Events. | ||||
| 3.1 24 weeks | 2 | 613 | Risk Ratio (M‐H, Fixed, 95% CI) | 2.40 [0.56, 10.36] |
| 3.2 48‐52 weeks | 2 | 844 | Risk Ratio (M‐H, Fixed, 95% CI) | 0.76 [0.27, 2.16] |
| 3.3 104 weeks | 1 | 498 | Risk Ratio (M‐H, Fixed, 95% CI) | 0.83 [0.37, 1.89] |
| 4 Other reasons Show forest plot | 3 | Risk Ratio (M‐H, Random, 95% CI) | Subtotals only | |
| Analysis 8.4  Comparison 8 Withdrawals ‐ RTX (2 x 500 mg) + MTX versus MTX, Outcome 4 Other reasons. | ||||
| 4.1 24 weeks | 2 | 613 | Risk Ratio (M‐H, Random, 95% CI) | 0.37 [0.05, 2.99] |
| 4.2 48‐52 weeks | 2 | 844 | Risk Ratio (M‐H, Random, 95% CI) | 1.00 [0.54, 1.87] |
| Outcome or subgroup title | No. of studies | No. of participants | Statistical method | Effect size |
| 1 Total discontinuations Show forest plot | 1 | Risk Ratio (M‐H, Fixed, 95% CI) | Subtotals only | |
| Analysis 9.1  Comparison 9 Withdrawals ‐ RTX (2 x 1000 mg) + CTX versus MTX, Outcome 1 Total discontinuations. | ||||
| 1.1 24 weeks | 1 | 81 | Risk Ratio (M‐H, Fixed, 95% CI) | 1.30 [0.31, 5.45] |
| 1.2 48 weeks | 1 | 81 | Risk Ratio (M‐H, Fixed, 95% CI) | 0.46 [0.21, 1.00] |
| 1.3 72 weeks | 1 | 81 | Risk Ratio (M‐H, Fixed, 95% CI) | 0.74 [0.49, 1.11] |
| 1.4 104 weeks | 1 | 81 | Risk Ratio (M‐H, Fixed, 95% CI) | 0.92 [0.75, 1.13] |
| 2 Lack of efficacy Show forest plot | 1 | Risk Ratio (M‐H, Fixed, 95% CI) | Subtotals only | |
| Analysis 9.2  Comparison 9 Withdrawals ‐ RTX (2 x 1000 mg) + CTX versus MTX, Outcome 2 Lack of efficacy. | ||||
| 2.1 24 weeks | 1 | 81 | Risk Ratio (M‐H, Fixed, 95% CI) | 0.20 [0.01, 3.94] |
| 2.2 48 weeks | 1 | 81 | Risk Ratio (M‐H, Fixed, 95% CI) | 0.28 [0.06, 1.26] |
| 2.3 72 weeks | 1 | 81 | Risk Ratio (M‐H, Fixed, 95% CI) | 0.43 [0.15, 1.30] |
| 2.4 104 weeks | 1 | 81 | Risk Ratio (M‐H, Fixed, 95% CI) | 0.23 [0.08, 0.62] |
| 3 Adverse Events Show forest plot | 1 | Risk Ratio (M‐H, Fixed, 95% CI) | Subtotals only | |
| Analysis 9.3  Comparison 9 Withdrawals ‐ RTX (2 x 1000 mg) + CTX versus MTX, Outcome 3 Adverse Events. | ||||
| 3.1 24 weeks | 1 | 81 | Risk Ratio (M‐H, Fixed, 95% CI) | 1.95 [0.18, 20.68] |
| 3.2 48 weeks | 1 | 81 | Risk Ratio (M‐H, Fixed, 95% CI) | 0.65 [0.11, 3.69] |
| 3.3 72 weeks | 1 | 81 | Risk Ratio (M‐H, Fixed, 95% CI) | 1.30 [0.31, 5.45] |
| 3.4 104 weeks | 1 | 81 | Risk Ratio (M‐H, Fixed, 95% CI) | 0.98 [0.26, 3.64] |
| 4 Other reasons Show forest plot | 1 | Risk Ratio (M‐H, Fixed, 95% CI) | Subtotals only | |
| Analysis 9.4  Comparison 9 Withdrawals ‐ RTX (2 x 1000 mg) + CTX versus MTX, Outcome 4 Other reasons. | ||||
| 4.1 24 weeks | 1 | 81 | Risk Ratio (M‐H, Fixed, 95% CI) | 4.88 [0.24, 98.60] |
| 4.2 48 weeks | 1 | 81 | Risk Ratio (M‐H, Fixed, 95% CI) | 0.59 [0.15, 2.29] |
| 4.3 72 weeks | 1 | 81 | Risk Ratio (M‐H, Fixed, 95% CI) | 0.83 [0.42, 1.62] |
| 4.4 104 weeks | 1 | 81 | Risk Ratio (M‐H, Fixed, 95% CI) | 1.88 [1.13, 3.12] |
| Outcome or subgroup title | No. of studies | No. of participants | Statistical method | Effect size |
| 1 Total discontinuations Show forest plot | 1 | Risk Ratio (M‐H, Fixed, 95% CI) | Subtotals only | |
| Analysis 10.1  Comparison 10 Withdrawals ‐ RTX + MTX + TNFi versus MTX + TNFi, Outcome 1 Total discontinuations. | ||||
| 1.1 24 weeks | 1 | 54 | Risk Ratio (M‐H, Fixed, 95% CI) | 2.57 [0.13, 50.83] |
| 2 Adverse events Show forest plot | 1 | Risk Ratio (M‐H, Fixed, 95% CI) | Subtotals only | |
| Analysis 10.2  Comparison 10 Withdrawals ‐ RTX + MTX + TNFi versus MTX + TNFi, Outcome 2 Adverse events. | ||||
| 2.1 24 weeks | 1 | 54 | Risk Ratio (M‐H, Fixed, 95% CI) | 2.57 [0.13, 50.83] |
| Outcome or subgroup title | No. of studies | No. of participants | Statistical method | Effect size |
| 1 Any Adverse Event Show forest plot | 5 | Risk Ratio (M‐H, Random, 95% CI) | Subtotals only | |
| Analysis 11.1  Comparison 11 Harms ‐ RTX (2 x 1000 mg) + MTX versus MTX, Outcome 1 Any Adverse Event. | ||||
| 1.1 24 weeks | 4 | 1280 | Risk Ratio (M‐H, Random, 95% CI) | 1.06 [0.95, 1.18] |
| 1.2 48‐56 weeks | 2 | 579 | Risk Ratio (M‐H, Random, 95% CI) | 0.99 [0.91, 1.07] |
| 1.3 104 weeks | 1 | 499 | Risk Ratio (M‐H, Random, 95% CI) | 1.01 [0.94, 1.08] |
| 2 Serious Adverse Events Show forest plot | 5 | Risk Ratio (M‐H, Fixed, 95% CI) | Subtotals only | |
| Analysis 11.2  Comparison 11 Harms ‐ RTX (2 x 1000 mg) + MTX versus MTX, Outcome 2 Serious Adverse Events. | ||||
| 2.1 24 weeks | 4 | 1280 | Risk Ratio (M‐H, Fixed, 95% CI) | 1.01 [0.69, 1.49] |
| 2.2 48‐56 weeks | 2 | 579 | Risk Ratio (M‐H, Fixed, 95% CI) | 0.94 [0.57, 1.53] |
| 2.3 104 weeks | 1 | 499 | Risk Ratio (M‐H, Fixed, 95% CI) | 0.78 [0.51, 1.19] |
| 3 Infections Show forest plot | 3 | Risk Ratio (M‐H, Random, 95% CI) | Subtotals only | |
| Analysis 11.3  Comparison 11 Harms ‐ RTX (2 x 1000 mg) + MTX versus MTX, Outcome 3 Infections. | ||||
| 3.1 24 weeks | 2 | 683 | Risk Ratio (M‐H, Random, 95% CI) | 1.01 [0.68, 1.48] |
| 3.2 52 weeks | 1 | 499 | Risk Ratio (M‐H, Random, 95% CI) | 1.04 [0.88, 1.24] |
| 3.3 104 weeks | 1 | 499 | Risk Ratio (M‐H, Random, 95% CI) | 1.09 [0.95, 1.26] |
| 4 Serious infections Show forest plot | 4 | 1841 | Risk Ratio (M‐H, Fixed, 95% CI) | 0.68 [0.42, 1.10] |
| Analysis 11.4  Comparison 11 Harms ‐ RTX (2 x 1000 mg) + MTX versus MTX, Outcome 4 Serious infections. | ||||
| 4.1 24 weeks | 3 | 763 | Risk Ratio (M‐H, Fixed, 95% CI) | 0.78 [0.27, 2.25] |
| 4.2 48‐56 weeks | 2 | 579 | Risk Ratio (M‐H, Fixed, 95% CI) | 0.71 [0.31, 1.59] |
| 4.3 104 weeks | 1 | 499 | Risk Ratio (M‐H, Fixed, 95% CI) | 0.63 [0.31, 1.27] |
| 5 Death Show forest plot | 5 | Risk Difference (M‐H, Fixed, 95% CI) | Subtotals only | |
| Analysis 11.5  Comparison 11 Harms ‐ RTX (2 x 1000 mg) + MTX versus MTX, Outcome 5 Death. | ||||
| 5.1 24 weeks | 4 | 1280 | Risk Difference (M‐H, Fixed, 95% CI) | ‐0.00 [‐0.01, 0.01] |
| 5.2 52 weeks | 1 | 499 | Risk Difference (M‐H, Fixed, 95% CI) | ‐0.01 [‐0.03, 0.00] |
| 5.3 104 weeks | 1 | 499 | Risk Difference (M‐H, Fixed, 95% CI) | ‐0.01 [‐0.02, 0.01] |
| 6 Arthralgia Show forest plot | 3 | Risk Ratio (M‐H, Fixed, 95% CI) | Subtotals only | |
| Analysis 11.6  Comparison 11 Harms ‐ RTX (2 x 1000 mg) + MTX versus MTX, Outcome 6 Arthralgia. | ||||
| 6.1 24 weeks | 3 | 938 | Risk Ratio (M‐H, Fixed, 95% CI) | 1.33 [0.76, 2.34] |
| 7 Cardiac event (any) Show forest plot | 1 | Risk Ratio (M‐H, Fixed, 95% CI) | Subtotals only | |
| Analysis 11.7  Comparison 11 Harms ‐ RTX (2 x 1000 mg) + MTX versus MTX, Outcome 7 Cardiac event (any). | ||||
| 7.1 52 weeks | 1 | 499 | Risk Ratio (M‐H, Fixed, 95% CI) | 2.68 [0.72, 9.98] |
| 8 Cardiac event (serious) Show forest plot | 1 | Risk Ratio (M‐H, Fixed, 95% CI) | Subtotals only | |
| Analysis 11.8  Comparison 11 Harms ‐ RTX (2 x 1000 mg) + MTX versus MTX, Outcome 8 Cardiac event (serious). | ||||
| 8.1 52 weeks | 1 | 499 | Risk Ratio (M‐H, Fixed, 95% CI) | 7.03 [0.36, 135.36] |
| 9 Cough Show forest plot | 2 | Risk Ratio (M‐H, Random, 95% CI) | Subtotals only | |
| Analysis 11.9  Comparison 11 Harms ‐ RTX (2 x 1000 mg) + MTX versus MTX, Outcome 9 Cough. | ||||
| 9.1 24 weeks | 2 | 597 | Risk Ratio (M‐H, Random, 95% CI) | 1.06 [0.17, 6.49] |
| 10 Diarrhea Show forest plot | 2 | Risk Ratio (M‐H, Fixed, 95% CI) | Subtotals only | |
| Analysis 11.10  Comparison 11 Harms ‐ RTX (2 x 1000 mg) + MTX versus MTX, Outcome 10 Diarrhea. | ||||
| 10.1 24 weeks | 2 | 858 | Risk Ratio (M‐H, Fixed, 95% CI) | 0.71 [0.41, 1.22] |
| 11 Exacerbation of RA Show forest plot | 4 | Risk Ratio (M‐H, Fixed, 95% CI) | Subtotals only | |
| Analysis 11.11  Comparison 11 Harms ‐ RTX (2 x 1000 mg) + MTX versus MTX, Outcome 11 Exacerbation of RA. | ||||
| 11.1 24 weeks | 3 | 938 | Risk Ratio (M‐H, Fixed, 95% CI) | 0.46 [0.37, 0.58] |
| 11.2 48‐56 weeks | 2 | 579 | Risk Ratio (M‐H, Fixed, 95% CI) | 2.01 [0.18, 22.00] |
| 12 Fatigue Show forest plot | 2 | Risk Ratio (M‐H, Fixed, 95% CI) | Subtotals only | |
| Analysis 11.12  Comparison 11 Harms ‐ RTX (2 x 1000 mg) + MTX versus MTX, Outcome 12 Fatigue. | ||||
| 12.1 24 weeks | 2 | 858 | Risk Ratio (M‐H, Fixed, 95% CI) | 1.03 [0.59, 1.79] |
| 13 HACA Show forest plot | 3 | Risk Ratio (M‐H, Random, 95% CI) | Subtotals only | |
| Analysis 11.13  Comparison 11 Harms ‐ RTX (2 x 1000 mg) + MTX versus MTX, Outcome 13 HACA. | ||||
| 13.1 24 weeks | 3 | 1200 | Risk Ratio (M‐H, Random, 95% CI) | 3.17 [0.76, 13.25] |
| 14 Headache Show forest plot | 2 | Risk Ratio (M‐H, Fixed, 95% CI) | Subtotals only | |
| Analysis 11.14  Comparison 11 Harms ‐ RTX (2 x 1000 mg) + MTX versus MTX, Outcome 14 Headache. | ||||
| 14.1 24 weeks | 2 | 858 | Risk Ratio (M‐H, Fixed, 95% CI) | 0.89 [0.60, 1.34] |
| 15 Hypertension Show forest plot | 3 | Risk Ratio (M‐H, Fixed, 95% CI) | Subtotals only | |
| Analysis 11.15  Comparison 11 Harms ‐ RTX (2 x 1000 mg) + MTX versus MTX, Outcome 15 Hypertension. | ||||
| 15.1 24 weeks | 3 | 938 | Risk Ratio (M‐H, Fixed, 95% CI) | 1.59 [0.96, 2.61] |
| 16 Infusion‐related reactions (1st course ‐1st infusion) Show forest plot | 5 | Risk Ratio (M‐H, Fixed, 95% CI) | Subtotals only | |
| Analysis 11.16  Comparison 11 Harms ‐ RTX (2 x 1000 mg) + MTX versus MTX, Outcome 16 Infusion‐related reactions (1st course ‐1st infusion). | ||||
| 16.1 24 weeks | 4 | 1280 | Risk Ratio (M‐H, Fixed, 95% CI) | 1.59 [1.29, 1.96] |
| 16.2 52 weeks | 1 | 499 | Risk Ratio (M‐H, Fixed, 95% CI) | 1.49 [0.98, 2.27] |
| 16.3 104 weeks | 1 | 499 | Risk Ratio (M‐H, Fixed, 95% CI) | 1.48 [0.97, 2.25] |
| 17 Infusion‐related reaction (1st course ‐2nd infusion) Show forest plot | 2 | Risk Ratio (M‐H, Fixed, 95% CI) | Subtotals only | |
| Analysis 11.17  Comparison 11 Harms ‐ RTX (2 x 1000 mg) + MTX versus MTX, Outcome 17 Infusion‐related reaction (1st course ‐2nd infusion). | ||||
| 17.1 24 weeks | 2 | 761 | Risk Ratio (M‐H, Fixed, 95% CI) | 0.79 [0.52, 1.22] |
| 18 Infusion‐related reaction (2nd course) Show forest plot | 1 | Risk Ratio (M‐H, Fixed, 95% CI) | Subtotals only | |
| Analysis 11.18  Comparison 11 Harms ‐ RTX (2 x 1000 mg) + MTX versus MTX, Outcome 18 Infusion‐related reaction (2nd course). | ||||
| 18.1 52 weeks | 1 | 499 | Risk Ratio (M‐H, Fixed, 95% CI) | 1.10 [0.62, 1.97] |
| 18.2 104 weeks | 1 | 499 | Risk Ratio (M‐H, Fixed, 95% CI) | 1.00 [0.56, 1.78] |
| 19 Infusion‐related reaction (3rd course) Show forest plot | 1 | Risk Ratio (M‐H, Fixed, 95% CI) | Subtotals only | |
| Analysis 11.19  Comparison 11 Harms ‐ RTX (2 x 1000 mg) + MTX versus MTX, Outcome 19 Infusion‐related reaction (3rd course). | ||||
| 19.1 52 weeks | 1 | 499 | Risk Ratio (M‐H, Fixed, 95% CI) | 1.29 [0.49, 3.41] |
| 19.2 104 weeks | 1 | 499 | Risk Ratio (M‐H, Fixed, 95% CI) | 1.20 [0.53, 2.72] |
| 20 Infusion‐related reaction (4th course) Show forest plot | 1 | Risk Ratio (M‐H, Fixed, 95% CI) | Subtotals only | |
| Analysis 11.20  Comparison 11 Harms ‐ RTX (2 x 1000 mg) + MTX versus MTX, Outcome 20 Infusion‐related reaction (4th course). | ||||
| 20.1 104 weeks | 1 | 499 | Risk Ratio (M‐H, Fixed, 95% CI) | 0.80 [0.32, 1.99] |
| 21 Infusion‐related reaction (5th course) Show forest plot | 1 | Risk Ratio (M‐H, Fixed, 95% CI) | Subtotals only | |
| Analysis 11.21  Comparison 11 Harms ‐ RTX (2 x 1000 mg) + MTX versus MTX, Outcome 21 Infusion‐related reaction (5th course). | ||||
| 21.1 104 weeks | 1 | 499 | Risk Ratio (M‐H, Fixed, 95% CI) | 1.49 [0.25, 8.86] |
| 22 Lower gastrointestinal events Show forest plot | 2 | Risk Ratio (M‐H, Fixed, 95% CI) | Subtotals only | |
| Analysis 11.22  Comparison 11 Harms ‐ RTX (2 x 1000 mg) + MTX versus MTX, Outcome 22 Lower gastrointestinal events. | ||||
| 22.1 24 weeks | 2 | 683 | Risk Ratio (M‐H, Fixed, 95% CI) | 0.74 [0.43, 1.26] |
| 23 Malignancy Show forest plot | 5 | Risk Ratio (M‐H, Fixed, 95% CI) | Subtotals only | |
| Analysis 11.23  Comparison 11 Harms ‐ RTX (2 x 1000 mg) + MTX versus MTX, Outcome 23 Malignancy. | ||||
| 23.1 24 weeks | 3 | 1175 | Risk Ratio (M‐H, Fixed, 95% CI) | 0.87 [0.16, 4.63] |
| 23.2 48‐56 weeks | 2 | 579 | Risk Ratio (M‐H, Fixed, 95% CI) | 0.20 [0.02, 1.71] |
| 23.3 104 weeks | 1 | 499 | Risk Ratio (M‐H, Fixed, 95% CI) | 0.43 [0.11, 1.63] |
| 24 Nasopharyngitis Show forest plot | 3 | Risk Ratio (M‐H, Fixed, 95% CI) | Subtotals only | |
| Analysis 11.24  Comparison 11 Harms ‐ RTX (2 x 1000 mg) + MTX versus MTX, Outcome 24 Nasopharyngitis. | ||||
| 24.1 24 weeks | 3 | 938 | Risk Ratio (M‐H, Fixed, 95% CI) | 1.07 [0.66, 1.74] |
| 25 Nausea Show forest plot | 3 | Risk Ratio (M‐H, Fixed, 95% CI) | Subtotals only | |
| Analysis 11.25  Comparison 11 Harms ‐ RTX (2 x 1000 mg) + MTX versus MTX, Outcome 25 Nausea. | ||||
| 25.1 24 weeks | 3 | 938 | Risk Ratio (M‐H, Fixed, 95% CI) | 0.86 [0.52, 1.43] |
| 26 Pyrexia Show forest plot | 1 | Risk Ratio (M‐H, Fixed, 95% CI) | Subtotals only | |
| Analysis 11.26  Comparison 11 Harms ‐ RTX (2 x 1000 mg) + MTX versus MTX, Outcome 26 Pyrexia. | ||||
| 26.1 24 weeks | 1 | 517 | Risk Ratio (M‐H, Fixed, 95% CI) | 1.45 [0.60, 3.50] |
| 27 Upper respiratory tract infection Show forest plot | 2 | 1016 | Risk Ratio (M‐H, Fixed, 95% CI) | 1.09 [0.60, 1.97] |
| Analysis 11.27  Comparison 11 Harms ‐ RTX (2 x 1000 mg) + MTX versus MTX, Outcome 27 Upper respiratory tract infection. | ||||
| 27.1 24 weeks | 1 | 517 | Risk Ratio (M‐H, Fixed, 95% CI) | 1.16 [0.62, 2.20] |
| 27.2 52 weeks | 1 | 499 | Risk Ratio (M‐H, Fixed, 95% CI) | 0.67 [0.11, 3.97] |
| 28 Urinary tract infection Show forest plot | 3 | 1357 | Risk Ratio (M‐H, Random, 95% CI) | 0.61 [0.29, 1.28] |
| Analysis 11.28  Comparison 11 Harms ‐ RTX (2 x 1000 mg) + MTX versus MTX, Outcome 28 Urinary tract infection. | ||||
| 28.1 24 weeks | 2 | 858 | Risk Ratio (M‐H, Random, 95% CI) | 0.65 [0.27, 1.56] |
| 28.2 52 weeks | 1 | 499 | Risk Ratio (M‐H, Random, 95% CI) | 0.20 [0.01, 4.16] |
| 29 Vascular disorders Show forest plot | 4 | 1262 | Risk Ratio (M‐H, Fixed, 95% CI) | 1.54 [1.00, 2.38] |
| Analysis 11.29  Comparison 11 Harms ‐ RTX (2 x 1000 mg) + MTX versus MTX, Outcome 29 Vascular disorders. | ||||
| 29.1 24 weeks | 3 | 763 | Risk Ratio (M‐H, Fixed, 95% CI) | 1.90 [1.03, 3.51] |
| 29.2 52 weeks | 1 | 499 | Risk Ratio (M‐H, Fixed, 95% CI) | 1.24 [0.67, 2.29] |
| Outcome or subgroup title | No. of studies | No. of participants | Statistical method | Effect size |
| 1 Any Adverse Event Show forest plot | 1 | Risk Ratio (M‐H, Fixed, 95% CI) | Subtotals only | |
| Analysis 12.1  Comparison 12 Harms ‐ RTX monotherapy versus MTX monotherapy, Outcome 1 Any Adverse Event. | ||||
| 1.1 24 weeks | 1 | 80 | Risk Ratio (M‐H, Fixed, 95% CI) | 1.0 [0.80, 1.24] |
| 1.2 48 weeks | 1 | 80 | Risk Ratio (M‐H, Fixed, 95% CI) | 1.06 [0.90, 1.25] |
| 2 Serious Adverse Events Show forest plot | 1 | Risk Ratio (M‐H, Fixed, 95% CI) | Subtotals only | |
| Analysis 12.2  Comparison 12 Harms ‐ RTX monotherapy versus MTX monotherapy, Outcome 2 Serious Adverse Events. | ||||
| 2.1 24 weeks | 1 | 80 | Risk Ratio (M‐H, Fixed, 95% CI) | 0.67 [0.12, 3.78] |
| 2.2 48 weeks | 1 | 80 | Risk Ratio (M‐H, Fixed, 95% CI) | 1.0 [0.27, 3.72] |
| 3 Serious Infections Show forest plot | 1 | Risk Ratio (M‐H, Fixed, 95% CI) | Subtotals only | |
| Analysis 12.3  Comparison 12 Harms ‐ RTX monotherapy versus MTX monotherapy, Outcome 3 Serious Infections. | ||||
| 3.1 24 weeks | 1 | 80 | Risk Ratio (M‐H, Fixed, 95% CI) | 2.0 [0.19, 21.18] |
| 3.2 48‐56 weeks | 1 | 80 | Risk Ratio (M‐H, Fixed, 95% CI) | 3.0 [0.13, 71.51] |
| 4 Death Show forest plot | 1 | Risk Ratio (M‐H, Fixed, 95% CI) | Subtotals only | |
| Analysis 12.4  Comparison 12 Harms ‐ RTX monotherapy versus MTX monotherapy, Outcome 4 Death. | ||||
| 4.1 24 weeks | 1 | 80 | Risk Ratio (M‐H, Fixed, 95% CI) | 3.0 [0.13, 71.51] |
| 5 Any Event Associated with 1st Infusion Show forest plot | 1 | Risk Ratio (M‐H, Fixed, 95% CI) | Subtotals only | |
| Analysis 12.5  Comparison 12 Harms ‐ RTX monotherapy versus MTX monotherapy, Outcome 5 Any Event Associated with 1st Infusion. | ||||
| 5.1 24 weeks | 1 | 80 | Risk Ratio (M‐H, Fixed, 95% CI) | 1.5 [0.84, 2.69] |
| 6 Arthralgia Show forest plot | 1 | Risk Ratio (M‐H, Fixed, 95% CI) | Subtotals only | |
| Analysis 12.6  Comparison 12 Harms ‐ RTX monotherapy versus MTX monotherapy, Outcome 6 Arthralgia. | ||||
| 6.1 24 weeks | 1 | 80 | Risk Ratio (M‐H, Fixed, 95% CI) | 1.0 [0.21, 4.66] |
| 7 Back pain Show forest plot | 1 | Risk Ratio (M‐H, Fixed, 95% CI) | Subtotals only | |
| Analysis 12.7  Comparison 12 Harms ‐ RTX monotherapy versus MTX monotherapy, Outcome 7 Back pain. | ||||
| 7.1 24 weeks | 1 | 80 | Risk Ratio (M‐H, Fixed, 95% CI) | 2.0 [0.39, 10.31] |
| 8 Cough Show forest plot | 1 | Peto Odds Ratio (Peto, Fixed, 95% CI) | Subtotals only | |
| Analysis 12.8  Comparison 12 Harms ‐ RTX monotherapy versus MTX monotherapy, Outcome 8 Cough. | ||||
| 8.1 24 weeks | 1 | 80 | Peto Odds Ratio (Peto, Fixed, 95% CI) | 8.22 [1.36, 49.69] |
| 9 Dyspnea Show forest plot | 1 | Risk Ratio (M‐H, Fixed, 95% CI) | Subtotals only | |
| Analysis 12.9  Comparison 12 Harms ‐ RTX monotherapy versus MTX monotherapy, Outcome 9 Dyspnea. | ||||
| 9.1 24 weeks | 1 | 80 | Risk Ratio (M‐H, Fixed, 95% CI) | 9.0 [0.50, 161.86] |
| 10 Exacerbation of RA Show forest plot | 1 | Risk Ratio (M‐H, Fixed, 95% CI) | Subtotals only | |
| Analysis 12.10  Comparison 12 Harms ‐ RTX monotherapy versus MTX monotherapy, Outcome 10 Exacerbation of RA. | ||||
| 10.1 24 weeks | 1 | 80 | Risk Ratio (M‐H, Fixed, 95% CI) | 0.38 [0.16, 0.86] |
| 10.2 48‐56 weeks | 1 | 80 | Risk Ratio (M‐H, Fixed, 95% CI) | 3.0 [0.13, 71.51] |
| 11 Hypertension Show forest plot | 1 | Risk Ratio (M‐H, Fixed, 95% CI) | Subtotals only | |
| Analysis 12.11  Comparison 12 Harms ‐ RTX monotherapy versus MTX monotherapy, Outcome 11 Hypertension. | ||||
| 11.1 24 weeks | 1 | 80 | Risk Ratio (M‐H, Fixed, 95% CI) | 1.0 [0.35, 2.84] |
| 12 Hypotension Show forest plot | 1 | Risk Ratio (M‐H, Fixed, 95% CI) | Subtotals only | |
| Analysis 12.12  Comparison 12 Harms ‐ RTX monotherapy versus MTX monotherapy, Outcome 12 Hypotension. | ||||
| 12.1 24 weeks | 1 | 80 | Risk Ratio (M‐H, Fixed, 95% CI) | 1.71 [0.75, 3.90] |
| 13 Nasopharyngitis Show forest plot | 1 | Risk Ratio (M‐H, Fixed, 95% CI) | Subtotals only | |
| Analysis 12.13  Comparison 12 Harms ‐ RTX monotherapy versus MTX monotherapy, Outcome 13 Nasopharyngitis. | ||||
| 13.1 24 weeks | 1 | 80 | Risk Ratio (M‐H, Fixed, 95% CI) | 0.67 [0.20, 2.18] |
| 14 Nausea Show forest plot | 1 | Risk Ratio (M‐H, Fixed, 95% CI) | Subtotals only | |
| Analysis 12.14  Comparison 12 Harms ‐ RTX monotherapy versus MTX monotherapy, Outcome 14 Nausea. | ||||
| 14.1 24 weeks | 1 | 80 | Risk Ratio (M‐H, Fixed, 95% CI) | 2.0 [0.19, 21.18] |
| 15 Rash Show forest plot | 1 | Risk Ratio (M‐H, Fixed, 95% CI) | Subtotals only | |
| Analysis 12.15  Comparison 12 Harms ‐ RTX monotherapy versus MTX monotherapy, Outcome 15 Rash. | ||||
| 15.1 24 weeks | 1 | 80 | Risk Ratio (M‐H, Fixed, 95% CI) | 4.0 [0.47, 34.24] |
| Outcome or subgroup title | No. of studies | No. of participants | Statistical method | Effect size |
| 1 Any Adverse Event Show forest plot | 3 | Risk Ratio (M‐H, Fixed, 95% CI) | Subtotals only | |
| Analysis 13.1  Comparison 13 Harms ‐ RTX (2 x 500 mg) + MTX versus MTX, Outcome 1 Any Adverse Event. | ||||
| 1.1 24 weeks | 2 | 612 | Risk Ratio (M‐H, Fixed, 95% CI) | 1.08 [0.99, 1.18] |
| 1.2 52 weeks | 1 | 499 | Risk Ratio (M‐H, Fixed, 95% CI) | 0.93 [0.85, 1.02] |
| 1.3 104 weeks | 1 | 498 | Risk Ratio (M‐H, Fixed, 95% CI) | 0.96 [0.89, 1.03] |
| 2 Serious Adverse Events Show forest plot | 3 | Risk Ratio (M‐H, Random, 95% CI) | Subtotals only | |
| Analysis 13.2  Comparison 13 Harms ‐ RTX (2 x 500 mg) + MTX versus MTX, Outcome 2 Serious Adverse Events. | ||||
| 2.1 24 weeks | 2 | 612 | Risk Ratio (M‐H, Random, 95% CI) | 1.02 [0.16, 6.45] |
| 2.2 52 weeks | 1 | 499 | Risk Ratio (M‐H, Random, 95% CI) | 0.89 [0.52, 1.51] |
| 2.3 104 weeks | 1 | 498 | Risk Ratio (M‐H, Random, 95% CI) | 0.88 [0.59, 1.32] |
| 3 Infections Show forest plot | 3 | Risk Ratio (M‐H, Fixed, 95% CI) | Subtotals only | |
| Analysis 13.3  Comparison 13 Harms ‐ RTX (2 x 500 mg) + MTX versus MTX, Outcome 3 Infections. | ||||
| 3.1 24 weeks | 2 | 612 | Risk Ratio (M‐H, Fixed, 95% CI) | 1.05 [0.86, 1.29] |
| 3.2 52 weeks | 1 | 499 | Risk Ratio (M‐H, Fixed, 95% CI) | 1.03 [0.86, 1.22] |
| 3.3 104 weeks | 1 | 498 | Risk Ratio (M‐H, Fixed, 95% CI) | 1.11 [0.97, 1.27] |
| 4 Serious Infections Show forest plot | 3 | Risk Ratio (M‐H, Fixed, 95% CI) | Subtotals only | |
| Analysis 13.4  Comparison 13 Harms ‐ RTX (2 x 500 mg) + MTX versus MTX, Outcome 4 Serious Infections. | ||||
| 4.1 24 weeks | 2 | 612 | Risk Ratio (M‐H, Fixed, 95% CI) | 0.25 [0.04, 1.47] |
| 4.2 52 weeks | 1 | 499 | Risk Ratio (M‐H, Fixed, 95% CI) | 0.46 [0.18, 1.20] |
| 4.3 104 weeks | 1 | 498 | Risk Ratio (M‐H, Fixed, 95% CI) | 0.68 [0.35, 1.35] |
| 5 Death Show forest plot | 3 | Risk Ratio (M‐H, Fixed, 95% CI) | Subtotals only | |
| Analysis 13.5  Comparison 13 Harms ‐ RTX (2 x 500 mg) + MTX versus MTX, Outcome 5 Death. | ||||
| 5.1 24 weeks | 2 | 612 | Risk Ratio (M‐H, Fixed, 95% CI) | 3.33 [0.35, 31.82] |
| 5.2 52 weeks | 1 | 499 | Risk Ratio (M‐H, Fixed, 95% CI) | 0.14 [0.01, 2.76] |
| 5.3 104 weeks | 1 | 498 | Risk Ratio (M‐H, Fixed, 95% CI) | 0.67 [0.11, 3.96] |
| 6 Arthralgia Show forest plot | 1 | 273 | Risk Ratio (M‐H, Fixed, 95% CI) | 1.20 [0.36, 4.06] |
| Analysis 13.6  Comparison 13 Harms ‐ RTX (2 x 500 mg) + MTX versus MTX, Outcome 6 Arthralgia. | ||||
| 6.1 24 weeks | 1 | 273 | Risk Ratio (M‐H, Fixed, 95% CI) | 1.20 [0.36, 4.06] |
| 7 Cardiac event (any) Show forest plot | 1 | Risk Ratio (M‐H, Fixed, 95% CI) | Subtotals only | |
| Analysis 13.7  Comparison 13 Harms ‐ RTX (2 x 500 mg) + MTX versus MTX, Outcome 7 Cardiac event (any). | ||||
| 7.1 52 weeks | 1 | 499 | Risk Ratio (M‐H, Fixed, 95% CI) | 1.00 [0.20, 4.93] |
| 8 Cardiac event (serious) Show forest plot | 1 | Risk Ratio (M‐H, Fixed, 95% CI) | Subtotals only | |
| Analysis 13.8  Comparison 13 Harms ‐ RTX (2 x 500 mg) + MTX versus MTX, Outcome 8 Cardiac event (serious). | ||||
| 8.1 52 weeks | 1 | 499 | Risk Ratio (M‐H, Fixed, 95% CI) | 5.02 [0.24, 104.04] |
| 9 Diarrhea Show forest plot | 1 | Risk Ratio (M‐H, Fixed, 95% CI) | Subtotals only | |
| Analysis 13.9  Comparison 13 Harms ‐ RTX (2 x 500 mg) + MTX versus MTX, Outcome 9 Diarrhea. | ||||
| 9.1 24 weeks | 1 | 273 | Risk Ratio (M‐H, Fixed, 95% CI) | 1.05 [0.39, 2.82] |
| 10 Exacerbation of RA Show forest plot | 2 | 772 | Risk Ratio (M‐H, Fixed, 95% CI) | 0.56 [0.36, 0.89] |
| Analysis 13.10  Comparison 13 Harms ‐ RTX (2 x 500 mg) + MTX versus MTX, Outcome 10 Exacerbation of RA. | ||||
| 10.1 MTX vs RTX 500 mg + MTX | 1 | 273 | Risk Ratio (M‐H, Fixed, 95% CI) | 0.57 [0.36, 0.91] |
| 10.2 52 weeks | 1 | 499 | Risk Ratio (M‐H, Fixed, 95% CI) | 0.33 [0.01, 8.18] |
| 11 Fatigue Show forest plot | 1 | Risk Ratio (M‐H, Fixed, 95% CI) | Subtotals only | |
| Analysis 13.11  Comparison 13 Harms ‐ RTX (2 x 500 mg) + MTX versus MTX, Outcome 11 Fatigue. | ||||
| 11.1 24 weeks | 1 | 273 | Risk Ratio (M‐H, Fixed, 95% CI) | 0.75 [0.25, 2.24] |
| 12 HACA Show forest plot | 2 | Risk Ratio (M‐H, Fixed, 95% CI) | Subtotals only | |
| Analysis 13.12  Comparison 13 Harms ‐ RTX (2 x 500 mg) + MTX versus MTX, Outcome 12 HACA. | ||||
| 12.1 24 weeks | 2 | 612 | Risk Ratio (M‐H, Fixed, 95% CI) | 2.73 [1.17, 6.40] |
| 13 Headache Show forest plot | 1 | Risk Ratio (M‐H, Fixed, 95% CI) | Subtotals only | |
| Analysis 13.13  Comparison 13 Harms ‐ RTX (2 x 500 mg) + MTX versus MTX, Outcome 13 Headache. | ||||
| 13.1 24 weeks | 1 | 273 | Risk Ratio (M‐H, Fixed, 95% CI) | 0.89 [0.46, 1.69] |
| 14 Hypertension Show forest plot | 1 | Risk Ratio (M‐H, Fixed, 95% CI) | Subtotals only | |
| Analysis 13.14  Comparison 13 Harms ‐ RTX (2 x 500 mg) + MTX versus MTX, Outcome 14 Hypertension. | ||||
| 14.1 24 weeks | 1 | 273 | Risk Ratio (M‐H, Fixed, 95% CI) | 1.50 [0.41, 5.47] |
| 15 Infusion‐related reactions (1st course ‐ 1st infusion) Show forest plot | 3 | Risk Ratio (M‐H, Fixed, 95% CI) | Subtotals only | |
| Analysis 13.15  Comparison 13 Harms ‐ RTX (2 x 500 mg) + MTX versus MTX, Outcome 15 Infusion‐related reactions (1st course ‐ 1st infusion). | ||||
| 15.1 24 weeks | 2 | 584 | Risk Ratio (M‐H, Fixed, 95% CI) | 0.79 [0.46, 1.36] |
| 15.2 52 weeks | 1 | 499 | Risk Ratio (M‐H, Fixed, 95% CI) | 1.13 [0.72, 1.78] |
| 15.3 104 weeks | 1 | 498 | Risk Ratio (M‐H, Fixed, 95% CI) | 1.13 [0.72, 1.77] |
| 16 Infusion related reaction (1st course ‐2nd infusion) Show forest plot | 2 | Risk Ratio (M‐H, Fixed, 95% CI) | Subtotals only | |
| Analysis 13.16  Comparison 13 Harms ‐ RTX (2 x 500 mg) + MTX versus MTX, Outcome 16 Infusion related reaction (1st course ‐2nd infusion). | ||||
| 16.1 24 weeks | 2 | 612 | Risk Ratio (M‐H, Fixed, 95% CI) | 1.51 [1.10, 2.09] |
| 17 Infusion related reaction (2nd course) Show forest plot | 1 | Risk Ratio (M‐H, Fixed, 95% CI) | Subtotals only | |
| Analysis 13.17  Comparison 13 Harms ‐ RTX (2 x 500 mg) + MTX versus MTX, Outcome 17 Infusion related reaction (2nd course). | ||||
| 17.1 52 weeks | 1 | 499 | Risk Ratio (M‐H, Fixed, 95% CI) | 0.95 [0.52, 1.74] |
| 17.2 104 weeks | 1 | 498 | Risk Ratio (M‐H, Fixed, 95% CI) | 0.95 [0.53, 1.71] |
| 18 Infusion related reaction (3rd course) Show forest plot | 1 | Risk Ratio (M‐H, Fixed, 95% CI) | Subtotals only | |
| Analysis 13.18  Comparison 13 Harms ‐ RTX (2 x 500 mg) + MTX versus MTX, Outcome 18 Infusion related reaction (3rd course). | ||||
| 18.1 52 weeks | 1 | 499 | Risk Ratio (M‐H, Fixed, 95% CI) | 0.29 [0.06, 1.37] |
| 18.2 104 weeks | 1 | 498 | Risk Ratio (M‐H, Fixed, 95% CI) | 1.1 [0.48, 2.54] |
| 19 Infusion related reaction (4th course) Show forest plot | 1 | Risk Ratio (M‐H, Fixed, 95% CI) | Subtotals only | |
| Analysis 13.19  Comparison 13 Harms ‐ RTX (2 x 500 mg) + MTX versus MTX, Outcome 19 Infusion related reaction (4th course). | ||||
| 19.1 104 weeks | 1 | 498 | Risk Ratio (M‐H, Fixed, 95% CI) | 1.0 [0.42, 2.36] |
| 20 Infusion related reaction (5th course) Show forest plot | 1 | Risk Ratio (M‐H, Fixed, 95% CI) | Subtotals only | |
| Analysis 13.20  Comparison 13 Harms ‐ RTX (2 x 500 mg) + MTX versus MTX, Outcome 20 Infusion related reaction (5th course). | ||||
| 20.1 104 weeks | 1 | 498 | Risk Ratio (M‐H, Fixed, 95% CI) | 0.5 [0.05, 5.48] |
| 21 Lower gastrointestinal events Show forest plot | 2 | Risk Ratio (M‐H, Fixed, 95% CI) | Subtotals only | |
| Analysis 13.21  Comparison 13 Harms ‐ RTX (2 x 500 mg) + MTX versus MTX, Outcome 21 Lower gastrointestinal events. | ||||
| 21.1 24 weeks | 2 | 612 | Risk Ratio (M‐H, Fixed, 95% CI) | 0.89 [0.52, 1.50] |
| 22 Malignancy Show forest plot | 3 | Risk Ratio (M‐H, Fixed, 95% CI) | Subtotals only | |
| Analysis 13.22  Comparison 13 Harms ‐ RTX (2 x 500 mg) + MTX versus MTX, Outcome 22 Malignancy. | ||||
| 22.1 24 weeks | 2 | 612 | Risk Ratio (M‐H, Fixed, 95% CI) | 1.03 [0.06, 16.33] |
| 22.2 52 weeks | 1 | 499 | Risk Ratio (M‐H, Fixed, 95% CI) | 0.40 [0.08, 2.05] |
| 22.3 104 weeks | 1 | 498 | Risk Ratio (M‐H, Fixed, 95% CI) | 0.86 [0.29, 2.51] |
| 23 Nasopharyngitis Show forest plot | 1 | Risk Ratio (M‐H, Fixed, 95% CI) | Subtotals only | |
| Analysis 13.23  Comparison 13 Harms ‐ RTX (2 x 500 mg) + MTX versus MTX, Outcome 23 Nasopharyngitis. | ||||
| 23.1 24 weeks | 1 | 273 | Risk Ratio (M‐H, Fixed, 95% CI) | 1.05 [0.39, 2.82] |
| 24 Nausea Show forest plot | 1 | Risk Ratio (M‐H, Fixed, 95% CI) | Subtotals only | |
| Analysis 13.24  Comparison 13 Harms ‐ RTX (2 x 500 mg) + MTX versus MTX, Outcome 24 Nausea. | ||||
| 24.1 24 weeks | 1 | 273 | Risk Ratio (M‐H, Fixed, 95% CI) | 0.74 [0.32, 1.73] |
| 25 Upper respiratory tract infection Show forest plot | 2 | 772 | Risk Ratio (M‐H, Fixed, 95% CI) | 1.07 [0.49, 2.35] |
| Analysis 13.25  Comparison 13 Harms ‐ RTX (2 x 500 mg) + MTX versus MTX, Outcome 25 Upper respiratory tract infection. | ||||
| 25.1 24 weeks | 1 | 273 | Risk Ratio (M‐H, Fixed, 95% CI) | 1.34 [0.56, 3.18] |
| 25.2 52 weeks | 1 | 499 | Risk Ratio (M‐H, Fixed, 95% CI) | 0.33 [0.04, 3.20] |
| 26 Vascular disorders Show forest plot | 3 | 1111 | Risk Ratio (M‐H, Fixed, 95% CI) | 1.25 [0.74, 2.09] |
| Analysis 13.26  Comparison 13 Harms ‐ RTX (2 x 500 mg) + MTX versus MTX, Outcome 26 Vascular disorders. | ||||
| 26.1 24 weeks | 2 | 612 | Risk Ratio (M‐H, Fixed, 95% CI) | 1.52 [0.62, 3.74] |
| 26.2 52 weeks | 1 | 499 | Risk Ratio (M‐H, Fixed, 95% CI) | 1.12 [0.60, 2.11] |
| Outcome or subgroup title | No. of studies | No. of participants | Statistical method | Effect size |
| 1 Any Adverse Event Show forest plot | 1 | Risk Ratio (M‐H, Fixed, 95% CI) | Subtotals only | |
| Analysis 14.1  Comparison 14 Harms ‐ RTX (2 x 1000 mg) + CTX versus MTX, Outcome 1 Any Adverse Event. | ||||
| 1.1 24 weeks | 1 | 81 | Risk Ratio (M‐H, Fixed, 95% CI) | 0.91 [0.72, 1.16] |
| 1.2 48‐56 weeks | 1 | 81 | Risk Ratio (M‐H, Fixed, 95% CI) | 1.00 [0.84, 1.20] |
| 2 Serious Adverse Events Show forest plot | 1 | Risk Ratio (M‐H, Fixed, 95% CI) | Subtotals only | |
| Analysis 14.2  Comparison 14 Harms ‐ RTX (2 x 1000 mg) + CTX versus MTX, Outcome 2 Serious Adverse Events. | ||||
| 2.1 24 weeks | 1 | 81 | Risk Ratio (M‐H, Fixed, 95% CI) | 1.95 [0.52, 7.27] |
| 2.2 48‐56 weeks | 1 | 81 | Risk Ratio (M‐H, Fixed, 95% CI) | 1.71 [0.54, 5.38] |
| 3 Serious Infections Show forest plot | 1 | Risk Ratio (M‐H, Fixed, 95% CI) | Subtotals only | |
| Analysis 14.3  Comparison 14 Harms ‐ RTX (2 x 1000 mg) + CTX versus MTX, Outcome 3 Serious Infections. | ||||
| 3.1 24 weeks | 1 | 81 | Risk Ratio (M‐H, Fixed, 95% CI) | 1.95 [0.18, 20.68] |
| 3.2 48‐56 weeks | 1 | 81 | Risk Ratio (M‐H, Fixed, 95% CI) | 0.0 [0.0, 0.0] |
| 4 Death Show forest plot | 1 | Risk Difference (M‐H, Fixed, 95% CI) | Subtotals only | |
| Analysis 14.4  Comparison 14 Harms ‐ RTX (2 x 1000 mg) + CTX versus MTX, Outcome 4 Death. | ||||
| 4.1 24 weeks | 1 | 81 | Risk Difference (M‐H, Fixed, 95% CI) | 0.0 [‐0.05, 0.05] |
| 5 Any Event Associated with 1st Infusion Show forest plot | 1 | Risk Ratio (M‐H, Fixed, 95% CI) | Subtotals only | |
| Analysis 14.5  Comparison 14 Harms ‐ RTX (2 x 1000 mg) + CTX versus MTX, Outcome 5 Any Event Associated with 1st Infusion. | ||||
| 5.1 24 weeks | 1 | 81 | Risk Ratio (M‐H, Fixed, 95% CI) | 1.06 [0.55, 2.03] |
| 6 Arthralgia Show forest plot | 1 | Risk Ratio (M‐H, Fixed, 95% CI) | Subtotals only | |
| Analysis 14.6  Comparison 14 Harms ‐ RTX (2 x 1000 mg) + CTX versus MTX, Outcome 6 Arthralgia. | ||||
| 6.1 24 weeks | 1 | 81 | Risk Ratio (M‐H, Fixed, 95% CI) | 0.33 [0.04, 3.00] |
| 7 Back pain Show forest plot | 1 | Risk Ratio (M‐H, Fixed, 95% CI) | Subtotals only | |
| Analysis 14.7  Comparison 14 Harms ‐ RTX (2 x 1000 mg) + CTX versus MTX, Outcome 7 Back pain. | ||||
| 7.1 24 weeks | 1 | 81 | Risk Ratio (M‐H, Fixed, 95% CI) | 1.46 [0.26, 8.30] |
| 8 Cough Show forest plot | 1 | Risk Ratio (M‐H, Fixed, 95% CI) | Subtotals only | |
| Analysis 14.8  Comparison 14 Harms ‐ RTX (2 x 1000 mg) + CTX versus MTX, Outcome 8 Cough. | ||||
| 8.1 24 weeks | 1 | 81 | Risk Ratio (M‐H, Fixed, 95% CI) | 2.93 [0.12, 69.83] |
| 9 Dyspnea Show forest plot | 1 | Risk Difference (M‐H, Fixed, 95% CI) | Subtotals only | |
| Analysis 14.9  Comparison 14 Harms ‐ RTX (2 x 1000 mg) + CTX versus MTX, Outcome 9 Dyspnea. | ||||
| 9.1 24 weeks | 1 | 81 | Risk Difference (M‐H, Fixed, 95% CI) | 0.0 [‐0.05, 0.05] |
| 10 Exacerbation of RA Show forest plot | 1 | Risk Ratio (M‐H, Fixed, 95% CI) | Subtotals only | |
| Analysis 14.10  Comparison 14 Harms ‐ RTX (2 x 1000 mg) + CTX versus MTX, Outcome 10 Exacerbation of RA. | ||||
| 10.1 24 weeks | 1 | 81 | Risk Ratio (M‐H, Fixed, 95% CI) | 0.37 [0.16, 0.84] |
| 10.2 48‐56 weeks | 1 | 81 | Risk Ratio (M‐H, Fixed, 95% CI) | 0.0 [0.0, 0.0] |
| 11 Hypertension Show forest plot | 1 | Risk Ratio (M‐H, Fixed, 95% CI) | Subtotals only | |
| Analysis 14.11  Comparison 14 Harms ‐ RTX (2 x 1000 mg) + CTX versus MTX, Outcome 11 Hypertension. | ||||
| 11.1 24 weeks | 1 | 81 | Risk Ratio (M‐H, Fixed, 95% CI) | 0.49 [0.13, 1.82] |
| 12 Hypotension Show forest plot | 1 | Risk Ratio (M‐H, Fixed, 95% CI) | Subtotals only | |
| Analysis 14.12  Comparison 14 Harms ‐ RTX (2 x 1000 mg) + CTX versus MTX, Outcome 12 Hypotension. | ||||
| 12.1 24 weeks | 1 | 81 | Risk Ratio (M‐H, Fixed, 95% CI) | 1.67 [0.73, 3.81] |
| 13 Nasopharyngitis Show forest plot | 1 | Risk Ratio (M‐H, Fixed, 95% CI) | Subtotals only | |
| Analysis 14.13  Comparison 14 Harms ‐ RTX (2 x 1000 mg) + CTX versus MTX, Outcome 13 Nasopharyngitis. | ||||
| 13.1 24 weeks | 1 | 81 | Risk Ratio (M‐H, Fixed, 95% CI) | 0.33 [0.07, 1.52] |
| 14 Nausea Show forest plot | 1 | Risk Ratio (M‐H, Fixed, 95% CI) | Subtotals only | |
| Analysis 14.14  Comparison 14 Harms ‐ RTX (2 x 1000 mg) + CTX versus MTX, Outcome 14 Nausea. | ||||
| 14.1 24 weeks | 1 | 81 | Risk Ratio (M‐H, Fixed, 95% CI) | 3.90 [0.46, 33.42] |
| 15 Pruritus Show forest plot | 1 | Risk Ratio (M‐H, Fixed, 95% CI) | Subtotals only | |
| Analysis 14.15  Comparison 14 Harms ‐ RTX (2 x 1000 mg) + CTX versus MTX, Outcome 15 Pruritus. | ||||
| 15.1 24 weeks | 1 | 81 | Risk Ratio (M‐H, Fixed, 95% CI) | 8.79 [0.49, 158.07] |
| 16 Rash Show forest plot | 1 | Risk Ratio (M‐H, Fixed, 95% CI) | Subtotals only | |
| Analysis 14.16  Comparison 14 Harms ‐ RTX (2 x 1000 mg) + CTX versus MTX, Outcome 16 Rash. | ||||
| 16.1 24 weeks | 1 | 81 | Risk Ratio (M‐H, Fixed, 95% CI) | 3.90 [0.46, 33.42] |
| 16.2 48 weeks | 1 | 80 | Risk Ratio (M‐H, Fixed, 95% CI) | 0.0 [0.0, 0.0] |
| Outcome or subgroup title | No. of studies | No. of participants | Statistical method | Effect size |
| 1 Any Adverse Event Show forest plot | 1 | Risk Ratio (M‐H, Fixed, 95% CI) | Subtotals only | |
| Analysis 15.1  Comparison 15 Harms ‐ RTX + MTX + TNFi versus MTX + TNFi, Outcome 1 Any Adverse Event. | ||||
| 1.1 24 weeks | 1 | 51 | Risk Ratio (M‐H, Fixed, 95% CI) | 1.13 [0.90, 1.41] |
| 2 Serious adverse events Show forest plot | 1 | Risk Ratio (M‐H, Fixed, 95% CI) | Subtotals only | |
| Analysis 15.2  Comparison 15 Harms ‐ RTX + MTX + TNFi versus MTX + TNFi, Outcome 2 Serious adverse events. | ||||
| 2.1 24 weeks | 1 | 51 | Risk Ratio (M‐H, Fixed, 95% CI) | 2.79 [0.14, 55.23] |
| 3 Grade 3 adverse events Show forest plot | 1 | Risk Ratio (M‐H, Fixed, 95% CI) | Subtotals only | |
| Analysis 15.3  Comparison 15 Harms ‐ RTX + MTX + TNFi versus MTX + TNFi, Outcome 3 Grade 3 adverse events. | ||||
| 3.1 24 weeks | 1 | 51 | Risk Ratio (M‐H, Fixed, 95% CI) | 6.15 [0.36, 105.22] |
| 4 All infections Show forest plot | 1 | Risk Ratio (M‐H, Fixed, 95% CI) | Subtotals only | |
| Analysis 15.4  Comparison 15 Harms ‐ RTX + MTX + TNFi versus MTX + TNFi, Outcome 4 All infections. | ||||
| 4.1 24 weeks | 1 | 51 | Risk Ratio (M‐H, Fixed, 95% CI) | 0.89 [0.55, 1.45] |
| 5 Grade 3 infections Show forest plot | 1 | Risk Ratio (M‐H, Fixed, 95% CI) | Subtotals only | |
| Analysis 15.5  Comparison 15 Harms ‐ RTX + MTX + TNFi versus MTX + TNFi, Outcome 5 Grade 3 infections. | ||||
| 5.1 24 weeks | 1 | 51 | Risk Ratio (M‐H, Fixed, 95% CI) | 3.91 [0.21, 71.77] |
| 6 Serious infections Show forest plot | 1 | Risk Ratio (M‐H, Fixed, 95% CI) | Subtotals only | |
| Analysis 15.6  Comparison 15 Harms ‐ RTX + MTX + TNFi versus MTX + TNFi, Outcome 6 Serious infections. | ||||
| 6.1 24 weeks | 1 | 51 | Risk Ratio (M‐H, Fixed, 95% CI) | 1.68 [0.07, 39.16] |
| 7 Any Event Associated with 1st infusion Show forest plot | 1 | Risk Ratio (M‐H, Fixed, 95% CI) | Subtotals only | |
| Analysis 15.7  Comparison 15 Harms ‐ RTX + MTX + TNFi versus MTX + TNFi, Outcome 7 Any Event Associated with 1st infusion. | ||||
| 7.1 24 weeks | 1 | 51 | Risk Ratio (M‐H, Fixed, 95% CI) | 5.45 [0.76, 39.26] |
| 8 Any Event Associated with 2nd infusion Show forest plot | 1 | Risk Ratio (M‐H, Fixed, 95% CI) | Subtotals only | |
| Analysis 15.8  Comparison 15 Harms ‐ RTX + MTX + TNFi versus MTX + TNFi, Outcome 8 Any Event Associated with 2nd infusion. | ||||
| 8.1 24 weeks | 1 | 51 | Risk Ratio (M‐H, Fixed, 95% CI) | 0.82 [0.15, 4.45] |
| 9 Arthralgia Show forest plot | 1 | Risk Ratio (M‐H, Fixed, 95% CI) | Subtotals only | |
| Analysis 15.9  Comparison 15 Harms ‐ RTX + MTX + TNFi versus MTX + TNFi, Outcome 9 Arthralgia. | ||||
| 9.1 24 weeks | 1 | 51 | Risk Ratio (M‐H, Fixed, 95% CI) | 0.82 [0.15, 4.45] |
| 10 Coronary artery occlusion Show forest plot | 1 | Risk Ratio (M‐H, Fixed, 95% CI) | Subtotals only | |
| Analysis 15.10  Comparison 15 Harms ‐ RTX + MTX + TNFi versus MTX + TNFi, Outcome 10 Coronary artery occlusion. | ||||
| 10.1 24 weeks | 1 | 51 | Risk Ratio (M‐H, Fixed, 95% CI) | 1.68 [0.07, 39.16] |
| 11 Diarrhea Show forest plot | 1 | Risk Ratio (M‐H, Fixed, 95% CI) | Subtotals only | |
| Analysis 15.11  Comparison 15 Harms ‐ RTX + MTX + TNFi versus MTX + TNFi, Outcome 11 Diarrhea. | ||||
| 11.1 24 weeks | 1 | 51 | Risk Ratio (M‐H, Fixed, 95% CI) | 1.64 [0.18, 14.61] |
| 12 Exacerbation of RA Show forest plot | 1 | Risk Ratio (M‐H, Fixed, 95% CI) | Subtotals only | |
| Analysis 15.12  Comparison 15 Harms ‐ RTX + MTX + TNFi versus MTX + TNFi, Outcome 12 Exacerbation of RA. | ||||
| 12.1 24 weeks | 1 | 51 | Risk Ratio (M‐H, Fixed, 95% CI) | 0.73 [0.18, 2.90] |
| 13 Fatigue Show forest plot | 1 | Risk Ratio (M‐H, Fixed, 95% CI) | Subtotals only | |
| Analysis 15.13  Comparison 15 Harms ‐ RTX + MTX + TNFi versus MTX + TNFi, Outcome 13 Fatigue. | ||||
| 13.1 24 weeks | 1 | 51 | Risk Ratio (M‐H, Fixed, 95% CI) | 5.03 [0.29, 88.46] |
| 14 HACA Show forest plot | 1 | Risk Ratio (M‐H, Fixed, 95% CI) | Subtotals only | |
| Analysis 15.14  Comparison 15 Harms ‐ RTX + MTX + TNFi versus MTX + TNFi, Outcome 14 HACA. | ||||
| 14.1 24 weeks | 1 | 51 | Risk Ratio (M‐H, Fixed, 95% CI) | 1.68 [0.07, 39.16] |
| 15 Headache Show forest plot | 1 | Risk Ratio (M‐H, Fixed, 95% CI) | Subtotals only | |
| Analysis 15.15  Comparison 15 Harms ‐ RTX + MTX + TNFi versus MTX + TNFi, Outcome 15 Headache. | ||||
| 15.1 24 weeks | 1 | 51 | Risk Ratio (M‐H, Fixed, 95% CI) | 0.82 [0.15, 4.45] |
| 16 Influenza Show forest plot | 1 | Risk Ratio (M‐H, Fixed, 95% CI) | Subtotals only | |
| Analysis 15.16  Comparison 15 Harms ‐ RTX + MTX + TNFi versus MTX + TNFi, Outcome 16 Influenza. | ||||
| 16.1 24 weeks | 1 | 51 | Risk Ratio (M‐H, Fixed, 95% CI) | 1.68 [0.07, 39.16] |
| 17 Muscle spasms Show forest plot | 1 | Risk Ratio (M‐H, Fixed, 95% CI) | Subtotals only | |
| Analysis 15.17  Comparison 15 Harms ‐ RTX + MTX + TNFi versus MTX + TNFi, Outcome 17 Muscle spasms. | ||||
| 17.1 24 weeks | 1 | 51 | Risk Ratio (M‐H, Fixed, 95% CI) | 0.27 [0.03, 2.81] |
| 18 Nasopharyngitis Show forest plot | 1 | Risk Ratio (M‐H, Fixed, 95% CI) | Subtotals only | |
| Analysis 15.18  Comparison 15 Harms ‐ RTX + MTX + TNFi versus MTX + TNFi, Outcome 18 Nasopharyngitis. | ||||
| 18.1 24 weeks | 1 | 51 | Risk Ratio (M‐H, Fixed, 95% CI) | 1.09 [0.11, 11.22] |
| 19 Nausea Show forest plot | 1 | Risk Ratio (M‐H, Fixed, 95% CI) | Subtotals only | |
| Analysis 15.19  Comparison 15 Harms ‐ RTX + MTX + TNFi versus MTX + TNFi, Outcome 19 Nausea. | ||||
| 19.1 24 weeks | 1 | 51 | Risk Ratio (M‐H, Fixed, 95% CI) | 1.36 [0.29, 6.34] |
| 20 Peripheral edema Show forest plot | 1 | Risk Ratio (M‐H, Fixed, 95% CI) | Subtotals only | |
| Analysis 15.20  Comparison 15 Harms ‐ RTX + MTX + TNFi versus MTX + TNFi, Outcome 20 Peripheral edema. | ||||
| 20.1 24 weeks | 1 | 51 | Risk Ratio (M‐H, Fixed, 95% CI) | 0.82 [0.15, 4.45] |
| 21 Pneumonia Show forest plot | 1 | Risk Ratio (M‐H, Fixed, 95% CI) | Subtotals only | |
| Analysis 15.21  Comparison 15 Harms ‐ RTX + MTX + TNFi versus MTX + TNFi, Outcome 21 Pneumonia. | ||||
| 21.1 24 weeks | 1 | 51 | Risk Ratio (M‐H, Fixed, 95% CI) | 1.68 [0.07, 39.16] |
| 22 Postoperative infection Show forest plot | 1 | Risk Ratio (M‐H, Fixed, 95% CI) | Subtotals only | |
| Analysis 15.22  Comparison 15 Harms ‐ RTX + MTX + TNFi versus MTX + TNFi, Outcome 22 Postoperative infection. | ||||
| 22.1 24 weeks | 1 | 51 | Risk Ratio (M‐H, Fixed, 95% CI) | 1.68 [0.07, 39.16] |
| 23 Pruritus Show forest plot | 1 | Risk Ratio (M‐H, Fixed, 95% CI) | Subtotals only | |
| Analysis 15.23  Comparison 15 Harms ‐ RTX + MTX + TNFi versus MTX + TNFi, Outcome 23 Pruritus. | ||||
| 23.1 24 weeks | 1 | 51 | Risk Ratio (M‐H, Fixed, 95% CI) | 5.03 [0.29, 88.46] |
| 24 Sinusitits Show forest plot | 1 | Risk Ratio (M‐H, Fixed, 95% CI) | Subtotals only | |
| Analysis 15.24  Comparison 15 Harms ‐ RTX + MTX + TNFi versus MTX + TNFi, Outcome 24 Sinusitits. | ||||
| 24.1 24 weeks | 1 | 51 | Risk Ratio (M‐H, Fixed, 95% CI) | 0.55 [0.12, 2.43] |
| 25 Upper respiratory tract infections Show forest plot | 1 | Risk Ratio (M‐H, Fixed, 95% CI) | Subtotals only | |
| Analysis 15.25  Comparison 15 Harms ‐ RTX + MTX + TNFi versus MTX + TNFi, Outcome 25 Upper respiratory tract infections. | ||||
| 25.1 24 weeks | 1 | 51 | Risk Ratio (M‐H, Fixed, 95% CI) | 0.65 [0.23, 1.85] |
| 26 Urinary tract infections Show forest plot | 1 | Risk Ratio (M‐H, Fixed, 95% CI) | Subtotals only | |
| Analysis 15.26  Comparison 15 Harms ‐ RTX + MTX + TNFi versus MTX + TNFi, Outcome 26 Urinary tract infections. | ||||
| 26.1 24 weeks | 1 | 51 | Risk Ratio (M‐H, Fixed, 95% CI) | 1.09 [0.11, 11.22] |
| 27 Vaginal Mycosis Show forest plot | 1 | Risk Ratio (M‐H, Fixed, 95% CI) | Subtotals only | |
| Analysis 15.27  Comparison 15 Harms ‐ RTX + MTX + TNFi versus MTX + TNFi, Outcome 27 Vaginal Mycosis. | ||||
| 27.1 24 weeks | 1 | 51 | Risk Ratio (M‐H, Fixed, 95% CI) | 1.09 [0.11, 11.22] |
| Outcome or subgroup title | No. of studies | No. of participants | Statistical method | Effect size |
| 1 ACR 50 Show forest plot | 5 | Risk Ratio (M‐H, Fixed, 95% CI) | Subtotals only | |
| Analysis 16.1  Comparison 16 Disease duration (subgroup analysis), Outcome 1 ACR 50. | ||||
| 1.1 = or < 4 years | 1 | 499 | Risk Ratio (M‐H, Fixed, 95% CI) | 1.55 [1.30, 1.84] |
| 1.2 > 4 years | 4 | 1165 | Risk Ratio (M‐H, Fixed, 95% CI) | 3.41 [2.52, 4.63] |
| Outcome or subgroup title | No. of studies | No. of participants | Statistical method | Effect size |
| 1 ACR 50 Show forest plot | 5 | Risk Ratio (M‐H, Fixed, 95% CI) | Subtotals only | |
| Analysis 17.1  Comparison 17 Previous treatment (subgroup analysis), Outcome 1 ACR 50. | ||||
| 1.1 Methotrexate‐naive | 1 | 499 | Risk Ratio (M‐H, Fixed, 95% CI) | 1.55 [1.30, 1.84] |
| 1.2 DMARDs failure | 2 | 422 | Risk Ratio (M‐H, Fixed, 95% CI) | 2.93 [1.86, 4.63] |
| 1.3 DMARD and TNFi failure | 2 | 743 | Risk Ratio (M‐H, Fixed, 95% CI) | 3.77 [2.51, 5.66] |
| Outcome or subgroup title | No. of studies | No. of participants | Statistical method | Effect size |
| 1 ACR 50 Show forest plot | 5 | Risk Ratio (M‐H, Random, 95% CI) | Subtotals only | |
| Analysis 18.1  Comparison 18 Study quality (subgroup analysis), Outcome 1 ACR 50. | ||||
| 1.1 Low risk of bias | 2 | 579 | Risk Ratio (M‐H, Random, 95% CI) | 2.03 [0.96, 4.26] |
| 1.2 High risk of bias | 3 | 1085 | Risk Ratio (M‐H, Random, 95% CI) | 3.27 [2.10, 5.09] |
| Outcome or subgroup title | No. of studies | No. of participants | Statistical method | Effect size |
| 1 ACR 20 Show forest plot | 4 | Risk Ratio (M‐H, Random, 95% CI) | Subtotals only | |
| Analysis 19.1  Comparison 19 Dosage 2 x 1000 mg versus 2 x 500 mg (sensitivity analysis), Outcome 1 ACR 20. | ||||
| 1.1 24 weeks | 3 | 809 | Risk Ratio (M‐H, Random, 95% CI) | 1.05 [0.87, 1.26] |
| 1.2 48‐52 weeks | 4 | 1218 | Risk Ratio (M‐H, Random, 95% CI) | 1.04 [0.96, 1.11] |
| 1.3 104 weeks | 1 | 436 | Risk Ratio (M‐H, Random, 95% CI) | 0.92 [0.83, 1.02] |
| 2 ACR 50 Show forest plot | 4 | Risk Ratio (M‐H, Fixed, 95% CI) | Subtotals only | |
| Analysis 19.2  Comparison 19 Dosage 2 x 1000 mg versus 2 x 500 mg (sensitivity analysis), Outcome 2 ACR 50. | ||||
| 2.1 24 weeks | 2 | 582 | Risk Ratio (M‐H, Fixed, 95% CI) | 0.99 [0.77, 1.28] |
| 2.2 48‐56 weeks | 4 | 1218 | Risk Ratio (M‐H, Fixed, 95% CI) | 1.08 [0.97, 1.21] |
| 2.3 104 weeks | 1 | 499 | Risk Ratio (M‐H, Fixed, 95% CI) | 1.04 [0.91, 1.20] |
| 3 ACR 70 Show forest plot | 4 | Risk Ratio (M‐H, Fixed, 95% CI) | Subtotals only | |
| Analysis 19.3  Comparison 19 Dosage 2 x 1000 mg versus 2 x 500 mg (sensitivity analysis), Outcome 3 ACR 70. | ||||
| 3.1 24 weeks | 2 | 582 | Risk Ratio (M‐H, Fixed, 95% CI) | 1.32 [0.85, 2.04] |
| 3.2 48‐56 weeks | 4 | 1218 | Risk Ratio (M‐H, Fixed, 95% CI) | 1.08 [0.91, 1.28] |
| 3.3 104 weeks | 1 | 499 | Risk Ratio (M‐H, Fixed, 95% CI) | 1.10 [0.90, 1.34] |
| 4 ACR 90 Show forest plot | 1 | Risk Ratio (M‐H, Fixed, 95% CI) | Subtotals only | |
| Analysis 19.4  Comparison 19 Dosage 2 x 1000 mg versus 2 x 500 mg (sensitivity analysis), Outcome 4 ACR 90. | ||||
| 4.1 52 weeks | 1 | 500 | Risk Ratio (M‐H, Fixed, 95% CI) | 0.95 [0.65, 1.41] |
| 4.2 104 weeks | 1 | 500 | Risk Ratio (M‐H, Fixed, 95% CI) | 1.14 [0.82, 1.59] |
| 5 DAS 28‐ESR Show forest plot | 4 | Mean Difference (IV, Fixed, 95% CI) | Subtotals only | |
| Analysis 19.5  Comparison 19 Dosage 2 x 1000 mg versus 2 x 500 mg (sensitivity analysis), Outcome 5 DAS 28‐ESR. | ||||
| 5.1 24 weeks | 3 | 1081 | Mean Difference (IV, Fixed, 95% CI) | ‐0.06 [‐0.22, 0.09] |
| 5.2 48‐56 weeks | 3 | 1063 | Mean Difference (IV, Fixed, 95% CI) | ‐0.14 [‐0.29, 0.02] |
| 5.3 104 weeks | 1 | 499 | Mean Difference (IV, Fixed, 95% CI) | 0.0 [‐0.23, 0.23] |
| 6 LDA (DAS28 =or<3.2) Show forest plot | 4 | Risk Ratio (M‐H, Fixed, 95% CI) | Subtotals only | |
| Analysis 19.6  Comparison 19 Dosage 2 x 1000 mg versus 2 x 500 mg (sensitivity analysis), Outcome 6 LDA (DAS28 =or<3.2). | ||||
| 6.1 24 weeks | 1 | 335 | Risk Ratio (M‐H, Fixed, 95% CI) | 0.71 [0.42, 1.20] |
| 6.2 48 weeks | 4 | 1215 | Risk Ratio (M‐H, Fixed, 95% CI) | 1.11 [0.94, 1.31] |
| 6.3 104 weeks | 1 | 499 | Risk Ratio (M‐H, Fixed, 95% CI) | 1.07 [0.88, 1.29] |
| 7 Clinical Remission (DAS28<2.6) Show forest plot | 4 | 2049 | Risk Ratio (M‐H, Random, 95% CI) | 1.10 [0.87, 1.39] |
| Analysis 19.7  Comparison 19 Dosage 2 x 1000 mg versus 2 x 500 mg (sensitivity analysis), Outcome 7 Clinical Remission (DAS28<2.6). | ||||
| 7.1 24 weeks | 1 | 335 | Risk Ratio (M‐H, Random, 95% CI) | 0.98 [0.51, 1.90] |
| 7.2 48‐52 weeks | 4 | 1215 | Risk Ratio (M‐H, Random, 95% CI) | 1.23 [0.85, 1.78] |
| 7.3 104 weeks | 1 | 499 | Risk Ratio (M‐H, Random, 95% CI) | 0.94 [0.73, 1.20] |
| 8 Moderate or good EULAR response Show forest plot | 4 | Risk Ratio (M‐H, Random, 95% CI) | Subtotals only | |
| Analysis 19.8  Comparison 19 Dosage 2 x 1000 mg versus 2 x 500 mg (sensitivity analysis), Outcome 8 Moderate or good EULAR response. | ||||
| 8.1 24 weeks | 3 | 1082 | Risk Ratio (M‐H, Random, 95% CI) | 0.94 [0.85, 1.05] |
| 8.2 48‐52 weeks | 3 | 1063 | Risk Ratio (M‐H, Random, 95% CI) | 1.07 [0.90, 1.28] |
| 8.3 104 weeks | 1 | 499 | Risk Ratio (M‐H, Random, 95% CI) | 1.09 [0.90, 1.31] |
| 9 HAQ‐DI Show forest plot | 3 | 1969 | Mean Difference (IV, Random, 95% CI) | ‐0.03 [‐0.17, 0.11] |
| Analysis 19.9  Comparison 19 Dosage 2 x 1000 mg versus 2 x 500 mg (sensitivity analysis), Outcome 9 HAQ‐DI. | ||||
| 9.1 24 weeks | 2 | 744 | Mean Difference (IV, Random, 95% CI) | 0.09 [‐0.13, 0.30] |
| 9.2 48‐52 weeks | 2 | 726 | Mean Difference (IV, Random, 95% CI) | ‐0.04 [‐0.13, 0.05] |
| 9.3 104 weeks | 1 | 499 | Mean Difference (IV, Random, 95% CI) | ‐0.20 [‐0.31, ‐0.09] |
| 10 HAQ‐DI MCID=‐0.22 Show forest plot | 4 | Risk Ratio (M‐H, Random, 95% CI) | Subtotals only | |
| Analysis 19.10  Comparison 19 Dosage 2 x 1000 mg versus 2 x 500 mg (sensitivity analysis), Outcome 10 HAQ‐DI MCID=‐0.22. | ||||
| 10.1 24 weeks | 2 | 580 | Risk Ratio (M‐H, Random, 95% CI) | 0.97 [0.80, 1.18] |
| 10.2 48‐56 weeks | 3 | 1061 | Risk Ratio (M‐H, Random, 95% CI) | 0.99 [0.94, 1.05] |
| 10.3 104 weeks | 1 | 499 | Risk Ratio (M‐H, Random, 95% CI) | 1.02 [0.95, 1.10] |
| 11 SF‐36 PCS Show forest plot | 4 | 1167 | Mean Difference (IV, Fixed, 95% CI) | 0.53 [‐0.49, 1.54] |
| Analysis 19.11  Comparison 19 Dosage 2 x 1000 mg versus 2 x 500 mg (sensitivity analysis), Outcome 11 SF‐36 PCS. | ||||
| 11.1 24 weeks | 2 | 545 | Mean Difference (IV, Fixed, 95% CI) | 0.02 [‐1.39, 1.44] |
| 11.2 48‐52 weeks | 2 | 622 | Mean Difference (IV, Fixed, 95% CI) | 1.05 [‐0.39, 2.49] |
| 12 SF‐36 PCS (=or>MCID of 5 or 5.42) Show forest plot | 4 | 1287 | Risk Ratio (M‐H, Fixed, 95% CI) | 1.06 [0.97, 1.16] |
| Analysis 19.12  Comparison 19 Dosage 2 x 1000 mg versus 2 x 500 mg (sensitivity analysis), Outcome 12 SF‐36 PCS (=or>MCID of 5 or 5.42). | ||||
| 12.1 24 weeks | 2 | 582 | Risk Ratio (M‐H, Fixed, 95% CI) | 1.00 [0.85, 1.19] |
| 12.2 48‐52 weeks | 2 | 705 | Risk Ratio (M‐H, Fixed, 95% CI) | 1.10 [0.99, 1.21] |
| 13 SF‐36 MCS Show forest plot | 4 | 1167 | Mean Difference (IV, Fixed, 95% CI) | ‐0.02 [‐1.42, 1.38] |
| Analysis 19.13  Comparison 19 Dosage 2 x 1000 mg versus 2 x 500 mg (sensitivity analysis), Outcome 13 SF‐36 MCS. | ||||
| 13.1 24 weeks | 2 | 545 | Mean Difference (IV, Fixed, 95% CI) | ‐0.07 [‐2.21, 2.06] |
| 13.2 48‐52 weeks | 2 | 622 | Mean Difference (IV, Fixed, 95% CI) | 0.02 [‐1.83, 1.88] |
| 14 SF‐36 MCS (=or>MCID of 6.33) Show forest plot | 2 | Risk Ratio (M‐H, Fixed, 95% CI) | Subtotals only | |
| Analysis 19.14  Comparison 19 Dosage 2 x 1000 mg versus 2 x 500 mg (sensitivity analysis), Outcome 14 SF‐36 MCS (=or>MCID of 6.33). | ||||
| 14.1 48‐52 weeks | 2 | 705 | Risk Ratio (M‐H, Fixed, 95% CI) | 1.06 [0.92, 1.23] |
| 15 FACIT‐F Show forest plot | 4 | 1218 | Mean Difference (IV, Fixed, 95% CI) | 1.04 [‐0.11, 2.18] |
| Analysis 19.15  Comparison 19 Dosage 2 x 1000 mg versus 2 x 500 mg (sensitivity analysis), Outcome 15 FACIT‐F. | ||||
| 15.1 24 weeks | 2 | 578 | Mean Difference (IV, Fixed, 95% CI) | 0.83 [‐0.87, 2.53] |
| 15.2 48‐54 weeks | 2 | 640 | Mean Difference (IV, Fixed, 95% CI) | 1.21 [‐0.34, 2.77] |
| 16 FACIT‐F (=or>MCID of 3.5) Show forest plot | 2 | 461 | Risk Ratio (M‐H, Fixed, 95% CI) | 1.19 [1.03, 1.38] |
| Analysis 19.16  Comparison 19 Dosage 2 x 1000 mg versus 2 x 500 mg (sensitivity analysis), Outcome 16 FACIT‐F (=or>MCID of 3.5). | ||||
| 16.1 24 weeks | 1 | 245 | Risk Ratio (M‐H, Fixed, 95% CI) | 1.19 [0.97, 1.46] |
| 16.2 48 weeks | 1 | 216 | Risk Ratio (M‐H, Fixed, 95% CI) | 1.20 [0.98, 1.47] |
| 17 VAS Pain Show forest plot | 2 | Mean Difference (IV, Fixed, 95% CI) | Subtotals only | |
| Analysis 19.17  Comparison 19 Dosage 2 x 1000 mg versus 2 x 500 mg (sensitivity analysis), Outcome 17 VAS Pain. | ||||
| 17.1 52 weeks | 2 | 671 | Mean Difference (IV, Fixed, 95% CI) | ‐2.30 [‐6.62, 2.02] |
| 18 Total radiographic score Show forest plot | 1 | Mean Difference (IV, Fixed, 95% CI) | Subtotals only | |
| Analysis 19.18  Comparison 19 Dosage 2 x 1000 mg versus 2 x 500 mg (sensitivity analysis), Outcome 18 Total radiographic score. | ||||
| 18.1 24 weeks | 1 | 483 | Mean Difference (IV, Fixed, 95% CI) | 0.25 [‐0.09, 0.59] |
| 18.2 52 weeks | 1 | 483 | Mean Difference (IV, Fixed, 95% CI) | 0.29 [‐0.05, 0.63] |
| 18.3 104 weeks | 1 | 483 | Mean Difference (IV, Fixed, 95% CI) | 0.35 [0.01, 0.69] |
| 19 Joint space narrowing Show forest plot | 1 | Mean Difference (IV, Fixed, 95% CI) | Subtotals only | |
| Analysis 19.19  Comparison 19 Dosage 2 x 1000 mg versus 2 x 500 mg (sensitivity analysis), Outcome 19 Joint space narrowing. | ||||
| 19.1 24 weeks | 1 | 480 | Mean Difference (IV, Fixed, 95% CI) | 0.07 [‐0.07, 0.21] |
| 19.2 104 weeks | 1 | 483 | Mean Difference (IV, Fixed, 95% CI) | 0.08 [‐0.06, 0.22] |
| 20 Radiographic erosions Show forest plot | 1 | Mean Difference (IV, Fixed, 95% CI) | Subtotals only | |
| Analysis 19.20  Comparison 19 Dosage 2 x 1000 mg versus 2 x 500 mg (sensitivity analysis), Outcome 20 Radiographic erosions. | ||||
| 20.1 24 weeks | 1 | 480 | Mean Difference (IV, Fixed, 95% CI) | 0.18 [‐0.05, 0.41] |
| 20.2 52 weeks | 1 | 483 | Mean Difference (IV, Fixed, 95% CI) | 0.22 [‐0.01, 0.45] |
| 20.3 104 weeks | 1 | 483 | Mean Difference (IV, Fixed, 95% CI) | 0.27 [0.04, 0.50] |
| 21 No radiographic progression Show forest plot | 1 | Risk Ratio (M‐H, Fixed, 95% CI) | Subtotals only | |
| Analysis 19.21  Comparison 19 Dosage 2 x 1000 mg versus 2 x 500 mg (sensitivity analysis), Outcome 21 No radiographic progression. | ||||
| 21.1 24 weeks | 1 | 483 | Risk Ratio (M‐H, Fixed, 95% CI) | 1.10 [0.97, 1.25] |
| 21.2 52 weeks | 1 | 483 | Risk Ratio (M‐H, Fixed, 95% CI) | 1.10 [0.95, 1.27] |
| 21.3 104 weeks | 1 | 483 | Risk Ratio (M‐H, Fixed, 95% CI) | 1.16 [0.98, 1.38] |
| 22 No worsening of erosions Show forest plot | 1 | Risk Ratio (M‐H, Fixed, 95% CI) | Subtotals only | |
| Analysis 19.22  Comparison 19 Dosage 2 x 1000 mg versus 2 x 500 mg (sensitivity analysis), Outcome 22 No worsening of erosions. | ||||
| 22.1 104 weeks | 1 | 483 | Risk Ratio (M‐H, Fixed, 95% CI) | 1.11 [0.95, 1.30] |
| 23 Total discontinuations Show forest plot | 4 | Risk Ratio (M‐H, Random, 95% CI) | Subtotals only | |
| Analysis 19.23  Comparison 19 Dosage 2 x 1000 mg versus 2 x 500 mg (sensitivity analysis), Outcome 23 Total discontinuations. | ||||
| 23.1 24 weeks | 2 | 656 | Risk Ratio (M‐H, Random, 95% CI) | 1.40 [0.79, 2.47] |
| 23.2 48‐52 weeks | 3 | 1093 | Risk Ratio (M‐H, Random, 95% CI) | 0.73 [0.34, 1.58] |
| 23.3 104 weeks | 1 | 499 | Risk Ratio (M‐H, Random, 95% CI) | 1.00 [0.65, 1.52] |
| 24 Discontinuation due to lack of efficacy Show forest plot | 4 | 1749 | Risk Ratio (M‐H, Fixed, 95% CI) | 0.73 [0.41, 1.29] |
| Analysis 19.24  Comparison 19 Dosage 2 x 1000 mg versus 2 x 500 mg (sensitivity analysis), Outcome 24 Discontinuation due to lack of efficacy. | ||||
| 24.1 24 weeks | 2 | 656 | Risk Ratio (M‐H, Fixed, 95% CI) | 1.16 [0.53, 2.53] |
| 24.2 48‐52 weeks | 3 | 1093 | Risk Ratio (M‐H, Fixed, 95% CI) | 0.42 [0.17, 1.03] |
| 25 Discontinuations due to adverse Events Show forest plot | 4 | Risk Ratio (M‐H, Random, 95% CI) | Subtotals only | |
| Analysis 19.25  Comparison 19 Dosage 2 x 1000 mg versus 2 x 500 mg (sensitivity analysis), Outcome 25 Discontinuations due to adverse Events. | ||||
| 25.1 24 weeks | 2 | 656 | Risk Ratio (M‐H, Random, 95% CI) | 1.35 [0.46, 4.00] |
| 25.2 48‐52 weeks | 3 | 1093 | Risk Ratio (M‐H, Random, 95% CI) | 0.94 [0.25, 3.45] |
| 25.3 104 weeks | 1 | 499 | Risk Ratio (M‐H, Random, 95% CI) | 0.80 [0.32, 1.99] |
| 26 Discontinuations due to other reasons Show forest plot | 4 | Risk Ratio (M‐H, Fixed, 95% CI) | Subtotals only | |
| Analysis 19.26  Comparison 19 Dosage 2 x 1000 mg versus 2 x 500 mg (sensitivity analysis), Outcome 26 Discontinuations due to other reasons. | ||||
| 26.1 24 weeks | 2 | 656 | Risk Ratio (M‐H, Fixed, 95% CI) | 2.00 [0.55, 7.30] |
| 26.2 48‐52 weeks | 3 | 1693 | Risk Ratio (M‐H, Fixed, 95% CI) | 1.17 [0.68, 1.99] |
| 27 Any Adverse Event Show forest plot | 4 | Risk Ratio (M‐H, Fixed, 95% CI) | Subtotals only | |
| Analysis 19.27  Comparison 19 Dosage 2 x 1000 mg versus 2 x 500 mg (sensitivity analysis), Outcome 27 Any Adverse Event. | ||||
| 27.1 24 weeks | 2 | 653 | Risk Ratio (M‐H, Fixed, 95% CI) | 1.03 [0.95, 1.11] |
| 27.2 48‐52 weeks | 3 | 1062 | Risk Ratio (M‐H, Fixed, 95% CI) | 1.01 [0.95, 1.06] |
| 27.3 104 weeks | 1 | 499 | Risk Ratio (M‐H, Fixed, 95% CI) | 1.05 [0.97, 1.13] |
| 28 Serious Adverse Events Show forest plot | 4 | Risk Ratio (M‐H, Random, 95% CI) | Subtotals only | |
| Analysis 19.28  Comparison 19 Dosage 2 x 1000 mg versus 2 x 500 mg (sensitivity analysis), Outcome 28 Serious Adverse Events. | ||||
| 28.1 24 weeks | 2 | 653 | Risk Ratio (M‐H, Random, 95% CI) | 1.48 [0.57, 3.82] |
| 28.2 48‐52 weeks | 3 | 1062 | Risk Ratio (M‐H, Random, 95% CI) | 1.24 [0.87, 1.77] |
| 28.3 104 weeks | 1 | 499 | Risk Ratio (M‐H, Random, 95% CI) | 0.89 [0.57, 1.37] |
| 29 Infections Show forest plot | 4 | Risk Ratio (M‐H, Random, 95% CI) | Subtotals only | |
| Analysis 19.29  Comparison 19 Dosage 2 x 1000 mg versus 2 x 500 mg (sensitivity analysis), Outcome 29 Infections. | ||||
| 29.1 24 weeks | 2 | 653 | Risk Ratio (M‐H, Random, 95% CI) | 0.93 [0.76, 1.13] |
| 29.2 48‐52 weeks | 3 | 1062 | Risk Ratio (M‐H, Random, 95% CI) | 1.00 [0.86, 1.17] |
| 29.3 104 weeks | 1 | 499 | Risk Ratio (M‐H, Random, 95% CI) | 0.98 [0.86, 1.12] |
| 30 Serious Infections Show forest plot | 4 | Risk Ratio (M‐H, Fixed, 95% CI) | Subtotals only | |
| Analysis 19.30  Comparison 19 Dosage 2 x 1000 mg versus 2 x 500 mg (sensitivity analysis), Outcome 30 Serious Infections. | ||||
| 30.1 24 weeks | 2 | 653 | Risk Ratio (M‐H, Fixed, 95% CI) | 1.49 [0.38, 5.86] |
| 30.2 48‐56 weeks | 3 | 1062 | Risk Ratio (M‐H, Fixed, 95% CI) | 1.08 [0.50, 2.34] |
| 30.3 104 weeks | 1 | 499 | Risk Ratio (M‐H, Fixed, 95% CI) | 0.92 [0.43, 1.98] |
| 31 Death Show forest plot | 4 | Risk Ratio (M‐H, Fixed, 95% CI) | Subtotals only | |
| Analysis 19.31  Comparison 19 Dosage 2 x 1000 mg versus 2 x 500 mg (sensitivity analysis), Outcome 31 Death. | ||||
| 31.1 24 weeks | 2 | 653 | Risk Ratio (M‐H, Fixed, 95% CI) | 0.22 [0.01, 5.26] |
| 31.2 48‐52 weeks | 3 | 1062 | Risk Ratio (M‐H, Fixed, 95% CI) | 0.20 [0.01, 4.06] |
| 31.3 104 weeks | 1 | 499 | Risk Ratio (M‐H, Fixed, 95% CI) | 0.50 [0.05, 5.46] |
| 32 Arthralgia Show forest plot | 1 | Risk Ratio (M‐H, Fixed, 95% CI) | Subtotals only | |
| Analysis 19.32  Comparison 19 Dosage 2 x 1000 mg versus 2 x 500 mg (sensitivity analysis), Outcome 32 Arthralgia. | ||||
| 32.1 24 weeks | 1 | 316 | Risk Ratio (M‐H, Fixed, 95% CI) | 1.42 [0.51, 3.99] |
| 33 Cardiac event (any) Show forest plot | 2 | Risk Ratio (M‐H, Fixed, 95% CI) | Subtotals only | |
| Analysis 19.33  Comparison 19 Dosage 2 x 1000 mg versus 2 x 500 mg (sensitivity analysis), Outcome 33 Cardiac event (any). | ||||
| 33.1 24 weeks | 1 | 337 | Risk Ratio (M‐H, Fixed, 95% CI) | 1.38 [0.45, 4.25] |
| 33.2 48‐52 weeks | 2 | 835 | Risk Ratio (M‐H, Fixed, 95% CI) | 1.44 [0.68, 3.06] |
| 34 Cardiac event (Serious) Show forest plot | 2 | Risk Ratio (M‐H, Fixed, 95% CI) | Subtotals only | |
| Analysis 19.34  Comparison 19 Dosage 2 x 1000 mg versus 2 x 500 mg (sensitivity analysis), Outcome 34 Cardiac event (Serious). | ||||
| 34.1 24 weeks | 1 | 337 | Risk Ratio (M‐H, Fixed, 95% CI) | 0.49 [0.04, 5.37] |
| 34.2 48‐52 weeks | 2 | 835 | Risk Ratio (M‐H, Fixed, 95% CI) | 0.99 [0.25, 3.94] |
| 35 Diarrhea Show forest plot | 1 | Risk Ratio (M‐H, Fixed, 95% CI) | Subtotals only | |
| Analysis 19.35  Comparison 19 Dosage 2 x 1000 mg versus 2 x 500 mg (sensitivity analysis), Outcome 35 Diarrhea. | ||||
| 35.1 24 weeks | 1 | 316 | Risk Ratio (M‐H, Fixed, 95% CI) | 0.55 [0.19, 1.61] |
| 36 Exacerbation of RA Show forest plot | 2 | 814 | Risk Ratio (M‐H, Fixed, 95% CI) | 0.91 [0.55, 1.51] |
| Analysis 19.36  Comparison 19 Dosage 2 x 1000 mg versus 2 x 500 mg (sensitivity analysis), Outcome 36 Exacerbation of RA. | ||||
| 36.1 24 weeks | 1 | 316 | Risk Ratio (M‐H, Fixed, 95% CI) | 0.83 [0.49, 1.40] |
| 36.2 52 weeks | 1 | 498 | Risk Ratio (M‐H, Fixed, 95% CI) | 5.0 [0.24, 103.62] |
| 37 Fatigue Show forest plot | 1 | Risk Ratio (M‐H, Fixed, 95% CI) | Subtotals only | |
| Analysis 19.37  Comparison 19 Dosage 2 x 1000 mg versus 2 x 500 mg (sensitivity analysis), Outcome 37 Fatigue. | ||||
| 37.1 24 weeks | 1 | 316 | Risk Ratio (M‐H, Fixed, 95% CI) | 1.03 [0.35, 3.09] |
| 38 HACA Show forest plot | 2 | Risk Ratio (M‐H, Fixed, 95% CI) | Subtotals only | |
| Analysis 19.38  Comparison 19 Dosage 2 x 1000 mg versus 2 x 500 mg (sensitivity analysis), Outcome 38 HACA. | ||||
| 38.1 24 weeks | 2 | 543 | Risk Ratio (M‐H, Fixed, 95% CI) | 0.53 [0.20, 1.38] |
| 39 Hypertension Show forest plot | 1 | Risk Ratio (M‐H, Fixed, 95% CI) | Subtotals only | |
| Analysis 19.39  Comparison 19 Dosage 2 x 1000 mg versus 2 x 500 mg (sensitivity analysis), Outcome 39 Hypertension. | ||||
| 39.1 24 weeks | 1 | 316 | Risk Ratio (M‐H, Fixed, 95% CI) | 1.55 [0.56, 4.29] |
| 40 Infusion‐related reactions (1st course ‐1st infusion) Show forest plot | 4 | Risk Ratio (M‐H, Fixed, 95% CI) | Subtotals only | |
| Analysis 19.40  Comparison 19 Dosage 2 x 1000 mg versus 2 x 500 mg (sensitivity analysis), Outcome 40 Infusion‐related reactions (1st course ‐1st infusion). | ||||
| 40.1 24 weeks | 2 | 653 | Risk Ratio (M‐H, Fixed, 95% CI) | 1.35 [1.02, 1.78] |
| 40.2 48‐56 weeks | 3 | 1062 | Risk Ratio (M‐H, Fixed, 95% CI) | 1.02 [0.79, 1.33] |
| 40.3 104 weeks | 1 | 499 | Risk Ratio (M‐H, Fixed, 95% CI) | 1.31 [0.87, 1.96] |
| 41 Infusion‐related reaction (1st course ‐2nd infusion) Show forest plot | 2 | Risk Ratio (M‐H, Fixed, 95% CI) | Subtotals only | |
| Analysis 19.41  Comparison 19 Dosage 2 x 1000 mg versus 2 x 500 mg (sensitivity analysis), Outcome 41 Infusion‐related reaction (1st course ‐2nd infusion). | ||||
| 41.1 24 weeks | 2 | 582 | Risk Ratio (M‐H, Fixed, 95% CI) | 1.04 [0.59, 1.85] |
| 42 Infusion‐related reaction (2nd course) Show forest plot | 3 | Risk Ratio (M‐H, Fixed, 95% CI) | Subtotals only | |
| Analysis 19.42  Comparison 19 Dosage 2 x 1000 mg versus 2 x 500 mg (sensitivity analysis), Outcome 42 Infusion‐related reaction (2nd course). | ||||
| 42.1 48‐52 weeks | 3 | 1062 | Risk Ratio (M‐H, Fixed, 95% CI) | 1.16 [0.79, 1.70] |
| 42.2 104 weeks | 1 | 499 | Risk Ratio (M‐H, Fixed, 95% CI) | 1.05 [0.58, 1.88] |
| 43 Infusion‐related reaction (3rd course) Show forest plot | 1 | Risk Ratio (M‐H, Fixed, 95% CI) | Subtotals only | |
| Analysis 19.43  Comparison 19 Dosage 2 x 1000 mg versus 2 x 500 mg (sensitivity analysis), Outcome 43 Infusion‐related reaction (3rd course). | ||||
| 43.1 52 weeks | 1 | 498 | Risk Ratio (M‐H, Fixed, 95% CI) | 4.5 [0.98, 20.62] |
| 43.2 104 weeks | 1 | 499 | Risk Ratio (M‐H, Fixed, 95% CI) | 1.09 [0.49, 2.42] |
| 44 Infusion‐related reaction (4th course) Show forest plot | 1 | Risk Ratio (M‐H, Fixed, 95% CI) | Subtotals only | |
| Analysis 19.44  Comparison 19 Dosage 2 x 1000 mg versus 2 x 500 mg (sensitivity analysis), Outcome 44 Infusion‐related reaction (4th course). | ||||
| 44.1 104 weeks | 1 | 499 | Risk Ratio (M‐H, Fixed, 95% CI) | 0.80 [0.32, 1.99] |
| 45 Infusion‐related reaction (5th course) Show forest plot | 1 | Risk Ratio (M‐H, Fixed, 95% CI) | Subtotals only | |
| Analysis 19.45  Comparison 19 Dosage 2 x 1000 mg versus 2 x 500 mg (sensitivity analysis), Outcome 45 Infusion‐related reaction (5th course). | ||||
| 45.1 104 weeks | 1 | 499 | Risk Ratio (M‐H, Fixed, 95% CI) | 2.99 [0.31, 28.53] |
| 46 Lower gastrointestinal events Show forest plot | 1 | Risk Ratio (M‐H, Fixed, 95% CI) | Subtotals only | |
| Analysis 19.46  Comparison 19 Dosage 2 x 1000 mg versus 2 x 500 mg (sensitivity analysis), Outcome 46 Lower gastrointestinal events. | ||||
| 46.1 24 weeks | 1 | 337 | Risk Ratio (M‐H, Fixed, 95% CI) | 0.98 [0.51, 1.90] |
| 46.2 48 weeks | 1 | 337 | Risk Ratio (M‐H, Fixed, 95% CI) | 1.12 [0.65, 1.94] |
| 47 Malignancy Show forest plot | 3 | Risk Ratio (M‐H, Fixed, 95% CI) | Subtotals only | |
| Analysis 19.47  Comparison 19 Dosage 2 x 1000 mg versus 2 x 500 mg (sensitivity analysis), Outcome 47 Malignancy. | ||||
| 47.1 24 weeks | 1 | 337 | Risk Ratio (M‐H, Fixed, 95% CI) | 1.96 [0.18, 21.46] |
| 47.2 48‐52 weeks | 3 | 1062 | Risk Ratio (M‐H, Fixed, 95% CI) | 1.09 [0.27, 4.31] |
| 47.3 104 weeks | 1 | 499 | Risk Ratio (M‐H, Fixed, 95% CI) | 0.50 [0.13, 1.97] |
| 48 Pneumonia Show forest plot | 1 | Risk Ratio (M‐H, Fixed, 95% CI) | Subtotals only | |
| Analysis 19.48  Comparison 19 Dosage 2 x 1000 mg versus 2 x 500 mg (sensitivity analysis), Outcome 48 Pneumonia. | ||||
| 48.1 52 weeks | 1 | 498 | Risk Ratio (M‐H, Fixed, 95% CI) | 0.33 [0.01, 8.14] |
| 49 Urinary tract infection Show forest plot | 1 | Risk Ratio (M‐H, Fixed, 95% CI) | Subtotals only | |
| Analysis 19.49  Comparison 19 Dosage 2 x 1000 mg versus 2 x 500 mg (sensitivity analysis), Outcome 49 Urinary tract infection. | ||||
| 49.1 52 weeks | 1 | 499 | Risk Ratio (M‐H, Fixed, 95% CI) | 0.20 [0.01, 4.16] |
| 50 Vascular disorders Show forest plot | 2 | Risk Ratio (M‐H, Fixed, 95% CI) | Subtotals only | |
| Analysis 19.50  Comparison 19 Dosage 2 x 1000 mg versus 2 x 500 mg (sensitivity analysis), Outcome 50 Vascular disorders. | ||||
| 50.1 24 weeks | 1 | 337 | Risk Ratio (M‐H, Fixed, 95% CI) | 1.15 [0.39, 3.34] |
| 50.2 48‐52 weeks | 2 | 835 | Risk Ratio (M‐H, Fixed, 95% CI) | 0.96 [0.59, 1.57] |
| Outcome or subgroup title | No. of studies | No. of participants | Statistical method | Effect size |
| 1 ACR 20 Show forest plot | 1 | Risk Ratio (M‐H, Fixed, 95% CI) | Subtotals only | |
| Analysis 20.1  Comparison 20 Concomitant treatment CTX versus MTX (sensitivity analysis), Outcome 1 ACR 20. | ||||
| 1.1 24 weeks | 1 | 81 | Risk Ratio (M‐H, Fixed, 95% CI) | 1.04 [0.81, 1.35] |
| 1.2 48 weeks | 1 | 81 | Risk Ratio (M‐H, Fixed, 95% CI) | 0.72 [0.49, 1.06] |
| 1.3 104 weeks | 1 | 81 | Risk Ratio (M‐H, Fixed, 95% CI) | 0.38 [0.15, 0.96] |
| 2 ACR 50 Show forest plot | 1 | Risk Ratio (M‐H, Fixed, 95% CI) | Subtotals only | |
| Analysis 20.2  Comparison 20 Concomitant treatment CTX versus MTX (sensitivity analysis), Outcome 2 ACR 50. | ||||
| 2.1 24 weeks | 1 | 81 | Risk Ratio (M‐H, Fixed, 95% CI) | 0.98 [0.58, 1.63] |
| 2.2 48 weeks | 1 | 81 | Risk Ratio (M‐H, Fixed, 95% CI) | 0.77 [0.40, 1.48] |
| 2.3 104 weeks | 1 | 81 | Risk Ratio (M‐H, Fixed, 95% CI) | 0.49 [0.16, 1.49] |
| 3 ACR 70 Show forest plot | 1 | Risk Ratio (M‐H, Fixed, 95% CI) | Subtotals only | |
| Analysis 20.3  Comparison 20 Concomitant treatment CTX versus MTX (sensitivity analysis), Outcome 3 ACR 70. | ||||
| 3.1 24 weeks | 1 | 81 | Risk Ratio (M‐H, Fixed, 95% CI) | 0.65 [0.25, 1.66] |
| 3.2 48 weeks | 1 | 81 | Risk Ratio (M‐H, Fixed, 95% CI) | 0.65 [0.20, 2.13] |
| 3.3 104 weeks | 1 | 81 | Risk Ratio (M‐H, Fixed, 95% CI) | 0.73 [0.17, 3.06] |
| 4 DAS 28 Show forest plot | 1 | Mean Difference (IV, Fixed, 95% CI) | Subtotals only | |
| Analysis 20.4  Comparison 20 Concomitant treatment CTX versus MTX (sensitivity analysis), Outcome 4 DAS 28. | ||||
| 4.1 24 weeks | 1 | 81 | Mean Difference (IV, Fixed, 95% CI) | 0.0 [‐0.61, 0.61] |
| 5 Moderate or good EULAR response Show forest plot | 1 | Risk Ratio (M‐H, Fixed, 95% CI) | Subtotals only | |
| Analysis 20.5  Comparison 20 Concomitant treatment CTX versus MTX (sensitivity analysis), Outcome 5 Moderate or good EULAR response. | ||||
| 5.1 24 weeks | 1 | 81 | Risk Ratio (M‐H, Fixed, 95% CI) | 1.03 [0.85, 1.25] |
| 6 HAQ‐DI Show forest plot | 1 | Mean Difference (IV, Fixed, 95% CI) | Subtotals only | |
| Analysis 20.6  Comparison 20 Concomitant treatment CTX versus MTX (sensitivity analysis), Outcome 6 HAQ‐DI. | ||||
| 6.1 24 weeks | 1 | 76 | Mean Difference (IV, Fixed, 95% CI) | 0.0 [‐0.29, 0.29] |
| 6.2 48 weeks | 1 | 72 | Mean Difference (IV, Fixed, 95% CI) | 0.3 [0.01, 0.59] |
| 6.3 72 weeks | 1 | 50 | Mean Difference (IV, Fixed, 95% CI) | 0.5 [0.15, 0.85] |
| 7 HAQ‐DI MCID=‐0.22 Show forest plot | 1 | Risk Ratio (M‐H, Fixed, 95% CI) | Subtotals only | |
| Analysis 20.7  Comparison 20 Concomitant treatment CTX versus MTX (sensitivity analysis), Outcome 7 HAQ‐DI MCID=‐0.22. | ||||
| 7.1 24 weeks | 1 | 76 | Risk Ratio (M‐H, Fixed, 95% CI) | 0.93 [0.65, 1.32] |
| 7.2 48 weeks | 1 | 72 | Risk Ratio (M‐H, Fixed, 95% CI) | 0.56 [0.35, 0.90] |
| 7.3 72 weeks | 1 | 50 | Risk Ratio (M‐H, Fixed, 95% CI) | 0.49 [0.21, 1.17] |
| 7.4 104 weeks | 1 | 27 | Risk Ratio (M‐H, Fixed, 95% CI) | 0.4 [0.05, 2.93] |
| 8 Total discontinuations Show forest plot | 1 | Risk Ratio (M‐H, Fixed, 95% CI) | Subtotals only | |
| Analysis 20.8  Comparison 20 Concomitant treatment CTX versus MTX (sensitivity analysis), Outcome 8 Total discontinuations. | ||||
| 8.1 24 weeks | 1 | 81 | Risk Ratio (M‐H, Fixed, 95% CI) | 3.90 [0.46, 33.42] |
| 8.2 48 weeks | 1 | 81 | Risk Ratio (M‐H, Fixed, 95% CI) | 3.41 [0.75, 15.46] |
| 8.3 72 weeks | 1 | 81 | Risk Ratio (M‐H, Fixed, 95% CI) | 1.54 [0.87, 2.75] |
| 8.4 104 weeks | 1 | 81 | Risk Ratio (M‐H, Fixed, 95% CI) | 1.42 [1.03, 1.96] |
| 9 Withdrawals due to lack of efficacy Show forest plot | 1 | Risk Ratio (M‐H, Fixed, 95% CI) | Subtotals only | |
| Analysis 20.9  Comparison 20 Concomitant treatment CTX versus MTX (sensitivity analysis), Outcome 9 Withdrawals due to lack of efficacy. | ||||
| 9.1 24 weeks | 1 | 81 | Risk Ratio (M‐H, Fixed, 95% CI) | 0.0 [0.0, 0.0] |
| 9.2 48 weeks | 1 | 81 | Risk Ratio (M‐H, Fixed, 95% CI) | 1.95 [0.18, 20.68] |
| 9.3 72 weeks | 1 | 81 | Risk Ratio (M‐H, Fixed, 95% CI) | 0.98 [0.26, 3.64] |
| 9.4 104 weeks | 1 | 81 | Risk Ratio (M‐H, Fixed, 95% CI) | 0.98 [0.26, 3.64] |
| 10 Withdrawals due to adverse events Show forest plot | 1 | Risk Ratio (M‐H, Fixed, 95% CI) | Subtotals only | |
| Analysis 20.10  Comparison 20 Concomitant treatment CTX versus MTX (sensitivity analysis), Outcome 10 Withdrawals due to adverse events. | ||||
| 10.1 24 weeks | 1 | 81 | Risk Ratio (M‐H, Fixed, 95% CI) | 1.95 [0.18, 20.68] |
| 10.2 48 weeks | 1 | 81 | Risk Ratio (M‐H, Fixed, 95% CI) | 1.95 [0.18, 20.68] |
| 10.3 72 weeks | 1 | 81 | Risk Ratio (M‐H, Fixed, 95% CI) | 3.90 [0.46, 33.42] |
| 10.4 104 weeks | 1 | 81 | Risk Ratio (M‐H, Fixed, 95% CI) | 3.90 [0.46, 33.42] |
| 11 Withdrawals due to other reasons Show forest plot | 1 | Risk Ratio (M‐H, Fixed, 95% CI) | Subtotals only | |
| Analysis 20.11  Comparison 20 Concomitant treatment CTX versus MTX (sensitivity analysis), Outcome 11 Withdrawals due to other reasons. | ||||
| 11.1 24 weeks | 1 | 81 | Risk Ratio (M‐H, Fixed, 95% CI) | 4.88 [0.24, 98.60] |
| 11.2 48 weeks | 1 | 81 | Risk Ratio (M‐H, Fixed, 95% CI) | 6.83 [0.36, 128.20] |
| 11.3 72 weeks | 1 | 81 | Risk Ratio (M‐H, Fixed, 95% CI) | 1.53 [0.66, 3.56] |
| 11.4 104 weeks | 1 | 81 | Risk Ratio (M‐H, Fixed, 95% CI) | 1.43 [0.93, 2.22] |
| 12 Any Adverse Event Show forest plot | 1 | Risk Ratio (M‐H, Fixed, 95% CI) | Subtotals only | |
| Analysis 20.12  Comparison 20 Concomitant treatment CTX versus MTX (sensitivity analysis), Outcome 12 Any Adverse Event. | ||||
| 12.1 24 weeks | 1 | 81 | Risk Ratio (M‐H, Fixed, 95% CI) | 0.86 [0.69, 1.08] |
| 12.2 48‐56 weeks | 1 | 81 | Risk Ratio (M‐H, Fixed, 95% CI) | 0.98 [0.82, 1.16] |
| 13 Serious Adverse Events Show forest plot | 1 | Risk Ratio (M‐H, Fixed, 95% CI) | Subtotals only | |
| Analysis 20.13  Comparison 20 Concomitant treatment CTX versus MTX (sensitivity analysis), Outcome 13 Serious Adverse Events. | ||||
| 13.1 24 weeks | 1 | 81 | Risk Ratio (M‐H, Fixed, 95% CI) | 1.95 [0.52, 7.27] |
| 13.2 48‐56 weeks | 1 | 81 | Risk Ratio (M‐H, Fixed, 95% CI) | 1.71 [0.54, 5.38] |
| 14 Serious Infections Show forest plot | 1 | Risk Ratio (M‐H, Fixed, 95% CI) | Subtotals only | |
| Analysis 20.14  Comparison 20 Concomitant treatment CTX versus MTX (sensitivity analysis), Outcome 14 Serious Infections. | ||||
| 14.1 24 weeks | 1 | 81 | Risk Ratio (M‐H, Fixed, 95% CI) | 4.88 [0.24, 98.60] |
| 14.2 48‐56 weeks | 1 | 81 | Risk Ratio (M‐H, Fixed, 95% CI) | 0.33 [0.01, 7.76] |
| 15 Exacerbation of RA Show forest plot | 1 | Risk Ratio (M‐H, Fixed, 95% CI) | Subtotals only | |
| Analysis 20.15  Comparison 20 Concomitant treatment CTX versus MTX (sensitivity analysis), Outcome 15 Exacerbation of RA. | ||||
| 15.1 24 weeks | 1 | 81 | Risk Ratio (M‐H, Fixed, 95% CI) | 2.93 [0.63, 13.65] |
| 15.2 48‐56 weeks | 1 | 81 | Risk Ratio (M‐H, Fixed, 95% CI) | 0.0 [0.0, 0.0] |
| 16 Death Show forest plot | 1 | Risk Difference (M‐H, Fixed, 95% CI) | Subtotals only | |
| Analysis 20.16  Comparison 20 Concomitant treatment CTX versus MTX (sensitivity analysis), Outcome 16 Death. | ||||
| 16.1 24 weeks | 1 | 81 | Risk Difference (M‐H, Fixed, 95% CI) | 0.0 [‐0.05, 0.05] |
| 17 Any Event Associated with 1st Infusion Show forest plot | 1 | Risk Ratio (M‐H, Fixed, 95% CI) | Subtotals only | |
| Analysis 20.17  Comparison 20 Concomitant treatment CTX versus MTX (sensitivity analysis), Outcome 17 Any Event Associated with 1st Infusion. | ||||
| 17.1 24 weeks | 1 | 81 | Risk Ratio (M‐H, Fixed, 95% CI) | 0.98 [0.52, 1.84] |
| 18 Arthralgia Show forest plot | 1 | Risk Ratio (M‐H, Fixed, 95% CI) | Subtotals only | |
| Analysis 20.18  Comparison 20 Concomitant treatment CTX versus MTX (sensitivity analysis), Outcome 18 Arthralgia. | ||||
| 18.1 24 weeks | 1 | 81 | Risk Ratio (M‐H, Fixed, 95% CI) | 0.24 [0.03, 2.09] |
| 19 Back pain Show forest plot | 1 | Risk Ratio (M‐H, Fixed, 95% CI) | Subtotals only | |
| Analysis 20.19  Comparison 20 Concomitant treatment CTX versus MTX (sensitivity analysis), Outcome 19 Back pain. | ||||
| 19.1 24 weeks | 1 | 81 | Risk Ratio (M‐H, Fixed, 95% CI) | 6.83 [0.36, 128.20] |
| 20 Cough Show forest plot | 1 | Risk Ratio (M‐H, Fixed, 95% CI) | Subtotals only | |
| Analysis 20.20  Comparison 20 Concomitant treatment CTX versus MTX (sensitivity analysis), Outcome 20 Cough. | ||||
| 20.1 24 weeks | 1 | 81 | Risk Ratio (M‐H, Fixed, 95% CI) | 0.49 [0.05, 5.17] |
| 21 Dyspnea Show forest plot | 1 | Risk Difference (M‐H, Fixed, 95% CI) | Subtotals only | |
| Analysis 20.21  Comparison 20 Concomitant treatment CTX versus MTX (sensitivity analysis), Outcome 21 Dyspnea. | ||||
| 21.1 24 weeks | 1 | 81 | Risk Difference (M‐H, Fixed, 95% CI) | 0.0 [‐0.05, 0.05] |
| 22 Hypertension Show forest plot | 1 | Risk Ratio (M‐H, Fixed, 95% CI) | Subtotals only | |
| Analysis 20.22  Comparison 20 Concomitant treatment CTX versus MTX (sensitivity analysis), Outcome 22 Hypertension. | ||||
| 22.1 24 weeks | 1 | 81 | Risk Ratio (M‐H, Fixed, 95% CI) | 0.29 [0.09, 0.99] |
| 23 Hypotension Show forest plot | 1 | Risk Ratio (M‐H, Fixed, 95% CI) | Subtotals only | |
| Analysis 20.23  Comparison 20 Concomitant treatment CTX versus MTX (sensitivity analysis), Outcome 23 Hypotension. | ||||
| 23.1 24 weeks | 1 | 82 | Risk Ratio (M‐H, Fixed, 95% CI) | 1.71 [0.75, 3.91] |
| 24 Nasopharyngitis Show forest plot | 1 | Risk Ratio (M‐H, Fixed, 95% CI) | Subtotals only | |
| Analysis 20.24  Comparison 20 Concomitant treatment CTX versus MTX (sensitivity analysis), Outcome 24 Nasopharyngitis. | ||||
| 24.1 24 weeks | 1 | 81 | Risk Ratio (M‐H, Fixed, 95% CI) | 0.49 [0.09, 2.52] |
| 25 Nausea Show forest plot | 1 | Risk Ratio (M‐H, Fixed, 95% CI) | Subtotals only | |
| Analysis 20.25  Comparison 20 Concomitant treatment CTX versus MTX (sensitivity analysis), Outcome 25 Nausea. | ||||
| 25.1 24 weeks | 1 | 81 | Risk Ratio (M‐H, Fixed, 95% CI) | 8.79 [0.49, 158.07] |
| 26 Pruritus Show forest plot | 1 | Risk Ratio (M‐H, Fixed, 95% CI) | Subtotals only | |
| Analysis 20.26  Comparison 20 Concomitant treatment CTX versus MTX (sensitivity analysis), Outcome 26 Pruritus. | ||||
| 26.1 24 weeks | 1 | 81 | Risk Ratio (M‐H, Fixed, 95% CI) | 8.79 [0.49, 158.07] |
| 27 Rash Show forest plot | 1 | Risk Ratio (M‐H, Fixed, 95% CI) | Subtotals only | |
| Analysis 20.27  Comparison 20 Concomitant treatment CTX versus MTX (sensitivity analysis), Outcome 27 Rash. | ||||
| 27.1 24 weeks | 1 | 81 | Risk Ratio (M‐H, Fixed, 95% CI) | 3.90 [0.46, 33.42] |
| 27.2 48 weeks | 1 | 81 | Risk Ratio (M‐H, Fixed, 95% CI) | 0.0 [0.0, 0.0] |
| Outcome or subgroup title | No. of studies | No. of participants | Statistical method | Effect size |
| 1 ACR 20 Show forest plot | 1 | Risk Ratio (M‐H, Fixed, 95% CI) | Subtotals only | |
| Analysis 21.1  Comparison 21 Concomitant treatment MTX versus none (sensitivity analysis), Outcome 1 ACR 20. | ||||
| 1.1 24 weeks | 1 | 80 | Risk Ratio (M‐H, Fixed, 95% CI) | 1.12 [0.83, 1.50] |
| 1.2 48 weeks | 1 | 80 | Risk Ratio (M‐H, Fixed, 95% CI) | 2.0 [1.21, 3.30] |
| 1.3 104 weeks | 1 | 80 | Risk Ratio (M‐H, Fixed, 95% CI) | 4.33 [1.34, 14.05] |
| 2 ACR 50 Show forest plot | 1 | Risk Ratio (M‐H, Fixed, 95% CI) | Subtotals only | |
| Analysis 21.2  Comparison 21 Concomitant treatment MTX versus none (sensitivity analysis), Outcome 2 ACR 50. | ||||
| 2.1 24 weeks | 1 | 80 | Risk Ratio (M‐H, Fixed, 95% CI) | 1.31 [0.74, 2.32] |
| 2.2 48 weeks | 1 | 80 | Risk Ratio (M‐H, Fixed, 95% CI) | 2.33 [1.00, 5.46] |
| 2.3 104 weeks | 1 | 80 | Risk Ratio (M‐H, Fixed, 95% CI) | 2.67 [0.76, 9.33] |
| 3 ACR 70 Show forest plot | 1 | Risk Ratio (M‐H, Fixed, 95% CI) | Subtotals only | |
| Analysis 21.3  Comparison 21 Concomitant treatment MTX versus none (sensitivity analysis), Outcome 3 ACR 70. | ||||
| 3.1 24 weeks | 1 | 80 | Risk Ratio (M‐H, Fixed, 95% CI) | 1.5 [0.59, 3.82] |
| 3.2 48 weeks | 1 | 80 | Risk Ratio (M‐H, Fixed, 95% CI) | 2.0 [0.54, 7.45] |
| 3.3 104 weeks | 1 | 80 | Risk Ratio (M‐H, Fixed, 95% CI) | 4.0 [0.47, 34.24] |
| 4 DAS 28 Show forest plot | 2 | Mean Difference (IV, Fixed, 95% CI) | Subtotals only | |
| Analysis 21.4  Comparison 21 Concomitant treatment MTX versus none (sensitivity analysis), Outcome 4 DAS 28. | ||||
| 4.1 16‐24 weeks | 2 | 120 | Mean Difference (IV, Fixed, 95% CI) | ‐1.06 [‐1.76, ‐0.36] |
| 5 Moderate or good EULAR response Show forest plot | 2 | Risk Ratio (M‐H, Fixed, 95% CI) | Subtotals only | |
| Analysis 21.5  Comparison 21 Concomitant treatment MTX versus none (sensitivity analysis), Outcome 5 Moderate or good EULAR response. | ||||
| 5.1 16‐24 weeks | 2 | 120 | Risk Ratio (M‐H, Fixed, 95% CI) | 1.04 [0.88, 1.23] |
| 5.2 104 weeks | 1 | 80 | Risk Ratio (M‐H, Fixed, 95% CI) | 3.25 [1.16, 9.12] |
| 6 HAQ‐DI Show forest plot | 1 | Mean Difference (IV, Fixed, 95% CI) | Subtotals only | |
| Analysis 21.6  Comparison 21 Concomitant treatment MTX versus none (sensitivity analysis), Outcome 6 HAQ‐DI. | ||||
| 6.1 24 weeks | 1 | 80 | Mean Difference (IV, Fixed, 95% CI) | 0.20 [‐0.06, 0.46] |
| 6.2 48 weeks | 1 | 80 | Mean Difference (IV, Fixed, 95% CI) | ‐0.10 [‐0.36, 0.16] |
| 6.3 72 weeks | 1 | 80 | Mean Difference (IV, Fixed, 95% CI) | 0.0 [‐0.26, 0.26] |
| 7 HAQ‐DI MCID=‐0.22 Show forest plot | 1 | Risk Ratio (M‐H, Fixed, 95% CI) | Subtotals only | |
| Analysis 21.7  Comparison 21 Concomitant treatment MTX versus none (sensitivity analysis), Outcome 7 HAQ‐DI MCID=‐0.22. | ||||
| 7.1 24 weeks | 1 | 77 | Risk Ratio (M‐H, Fixed, 95% CI) | 0.94 [0.68, 1.29] |
| 7.2 48 weeks | 1 | 69 | Risk Ratio (M‐H, Fixed, 95% CI) | 1.63 [1.02, 2.60] |
| 7.3 72 weeks | 1 | 45 | Risk Ratio (M‐H, Fixed, 95% CI) | 2.63 [0.87, 7.91] |
| 7.4 104 weeks | 1 | 22 | Risk Ratio (M‐H, Fixed, 95% CI) | 1.11 [0.17, 7.09] |
| 8 Total discontinuations Show forest plot | 1 | Risk Ratio (M‐H, Fixed, 95% CI) | Subtotals only | |
| Analysis 21.8  Comparison 21 Concomitant treatment MTX versus none (sensitivity analysis), Outcome 8 Total discontinuations. | ||||
| 8.1 24 weeks | 1 | 80 | Risk Ratio (M‐H, Fixed, 95% CI) | 0.5 [0.05, 5.30] |
| 8.2 48 weeks | 1 | 80 | Risk Ratio (M‐H, Fixed, 95% CI) | 0.22 [0.05, 0.96] |
| 8.3 72 weeks | 1 | 80 | Risk Ratio (M‐H, Fixed, 95% CI) | 0.52 [0.30, 0.90] |
| 8.4 104 weeks | 1 | 80 | Risk Ratio (M‐H, Fixed, 95% CI) | 0.61 [0.45, 0.82] |
| 9 Withdrawals due to lack of efficacy Show forest plot | 1 | Risk Ratio (M‐H, Fixed, 95% CI) | Subtotals only | |
| Analysis 21.9  Comparison 21 Concomitant treatment MTX versus none (sensitivity analysis), Outcome 9 Withdrawals due to lack of efficacy. | ||||
| 9.1 24 weeks | 1 | 80 | Risk Ratio (M‐H, Fixed, 95% CI) | 0.0 [0.0, 0.0] |
| 9.2 48 weeks | 1 | 80 | Risk Ratio (M‐H, Fixed, 95% CI) | 0.5 [0.05, 5.30] |
| 9.3 72 weeks | 1 | 80 | Risk Ratio (M‐H, Fixed, 95% CI) | 1.33 [0.32, 5.58] |
| 9.4 104 weeks | 1 | 80 | Risk Ratio (M‐H, Fixed, 95% CI) | 0.8 [0.23, 2.76] |
| 10 Withdrawals due to adverse Events Show forest plot | 1 | Risk Ratio (M‐H, Fixed, 95% CI) | Subtotals only | |
| Analysis 21.10  Comparison 21 Concomitant treatment MTX versus none (sensitivity analysis), Outcome 10 Withdrawals due to adverse Events. | ||||
| 10.1 24 weeks | 1 | 80 | Risk Ratio (M‐H, Fixed, 95% CI) | 0.5 [0.05, 5.30] |
| 10.2 48 weeks | 1 | 80 | Risk Ratio (M‐H, Fixed, 95% CI) | 0.25 [0.03, 2.14] |
| 10.3 72 weeks | 1 | 80 | Risk Ratio (M‐H, Fixed, 95% CI) | 0.2 [0.02, 1.64] |
| 10.4 104 weeks | 1 | 80 | Risk Ratio (M‐H, Fixed, 95% CI) | 0.2 [0.02, 1.64] |
| 11 Withdrawals due to other reasons Show forest plot | 1 | Risk Ratio (M‐H, Fixed, 95% CI) | Subtotals only | |
| Analysis 21.11  Comparison 21 Concomitant treatment MTX versus none (sensitivity analysis), Outcome 11 Withdrawals due to other reasons. | ||||
| 11.1 24 weeks | 1 | 80 | Risk Ratio (M‐H, Fixed, 95% CI) | 0.0 [0.0, 0.0] |
| 11.2 48 weeks | 1 | 80 | Risk Ratio (M‐H, Fixed, 95% CI) | 0.14 [0.01, 2.68] |
| 11.3 72 weeks | 1 | 80 | Risk Ratio (M‐H, Fixed, 95% CI) | 0.47 [0.21, 1.02] |
| 11.4 104 weeks | 1 | 80 | Risk Ratio (M‐H, Fixed, 95% CI) | 0.65 [0.43, 1.00] |
| 12 Any Adverse Event Show forest plot | 1 | Risk Ratio (M‐H, Fixed, 95% CI) | Subtotals only | |
| Analysis 21.12  Comparison 21 Concomitant treatment MTX versus none (sensitivity analysis), Outcome 12 Any Adverse Event. | ||||
| 12.1 24 weeks | 1 | 80 | Risk Ratio (M‐H, Fixed, 95% CI) | 1.06 [0.87, 1.30] |
| 12.2 48‐56 weeks | 1 | 80 | Risk Ratio (M‐H, Fixed, 95% CI) | 0.97 [0.83, 1.14] |
| 13 Serious Adverse Events Show forest plot | 1 | Risk Ratio (M‐H, Fixed, 95% CI) | Subtotals only | |
| Analysis 21.13  Comparison 21 Concomitant treatment MTX versus none (sensitivity analysis), Outcome 13 Serious Adverse Events. | ||||
| 13.1 24 weeks | 1 | 80 | Risk Ratio (M‐H, Fixed, 95% CI) | 1.5 [0.26, 8.50] |
| 13.2 48‐56 weeks | 1 | 80 | Risk Ratio (M‐H, Fixed, 95% CI) | 1.0 [0.27, 3.72] |
| 14 Serious Infections Show forest plot | 2 | Risk Ratio (M‐H, Fixed, 95% CI) | Subtotals only | |
| Analysis 21.14  Comparison 21 Concomitant treatment MTX versus none (sensitivity analysis), Outcome 14 Serious Infections. | ||||
| 14.1 16‐24 weeks | 2 | 120 | Risk Ratio (M‐H, Fixed, 95% CI) | 0.33 [0.05, 2.03] |
| 14.2 48‐56 weeks | 1 | 80 | Risk Ratio (M‐H, Fixed, 95% CI) | 1.0 [0.06, 15.44] |
| 15 Death Show forest plot | 1 | Risk Ratio (M‐H, Fixed, 95% CI) | Subtotals only | |
| Analysis 21.15  Comparison 21 Concomitant treatment MTX versus none (sensitivity analysis), Outcome 15 Death. | ||||
| 15.1 24 weeks | 1 | 80 | Risk Ratio (M‐H, Fixed, 95% CI) | 0.33 [0.01, 7.95] |
| 16 Any Event Associated with 1st Infusion Show forest plot | 2 | Risk Ratio (M‐H, Fixed, 95% CI) | Subtotals only | |
| Analysis 21.16  Comparison 21 Concomitant treatment MTX versus none (sensitivity analysis), Outcome 16 Any Event Associated with 1st Infusion. | ||||
| 16.1 16‐24 weeks | 2 | 120 | Risk Ratio (M‐H, Fixed, 95% CI) | 0.8 [0.47, 1.36] |
| 17 Arthralgia Show forest plot | 1 | Risk Ratio (M‐H, Fixed, 95% CI) | Subtotals only | |
| Analysis 21.17  Comparison 21 Concomitant treatment MTX versus none (sensitivity analysis), Outcome 17 Arthralgia. | ||||
| 17.1 24 weeks | 1 | 80 | Risk Ratio (M‐H, Fixed, 95% CI) | 1.33 [0.32, 5.58] |
| 18 Back pain Show forest plot | 1 | Risk Ratio (M‐H, Fixed, 95% CI) | Subtotals only | |
| Analysis 21.18  Comparison 21 Concomitant treatment MTX versus none (sensitivity analysis), Outcome 18 Back pain. | ||||
| 18.1 24 weeks | 1 | 80 | Risk Ratio (M‐H, Fixed, 95% CI) | 0.11 [0.01, 2.00] |
| 19 Cough Show forest plot | 1 | Risk Ratio (M‐H, Fixed, 95% CI) | Subtotals only | |
| Analysis 21.19  Comparison 21 Concomitant treatment MTX versus none (sensitivity analysis), Outcome 19 Cough. | ||||
| 19.1 24 weeks | 1 | 80 | Risk Ratio (M‐H, Fixed, 95% CI) | 0.4 [0.08, 1.94] |
| 20 Dyspnea Show forest plot | 1 | Risk Ratio (M‐H, Fixed, 95% CI) | Subtotals only | |
| Analysis 21.20  Comparison 21 Concomitant treatment MTX versus none (sensitivity analysis), Outcome 20 Dyspnea. | ||||
| 20.1 24 weeks | 1 | 80 | Risk Ratio (M‐H, Fixed, 95% CI) | 0.11 [0.01, 2.00] |
| 21 Exacerbation of RA Show forest plot | 1 | Risk Ratio (M‐H, Fixed, 95% CI) | Subtotals only | |
| Analysis 21.21  Comparison 21 Concomitant treatment MTX versus none (sensitivity analysis), Outcome 21 Exacerbation of RA. | ||||
| 21.1 24 weeks | 1 | 80 | Risk Ratio (M‐H, Fixed, 95% CI) | 0.33 [0.07, 1.55] |
| 21.2 48‐56 weeks | 1 | 80 | Risk Ratio (M‐H, Fixed, 95% CI) | 0.33 [0.01, 7.95] |
| 22 Hypertension Show forest plot | 1 | Risk Ratio (M‐H, Fixed, 95% CI) | Subtotals only | |
| Analysis 21.22  Comparison 21 Concomitant treatment MTX versus none (sensitivity analysis), Outcome 22 Hypertension. | ||||
| 22.1 24 weeks | 1 | 80 | Risk Ratio (M‐H, Fixed, 95% CI) | 1.67 [0.67, 4.15] |
| 23 Hypotension Show forest plot | 1 | Risk Ratio (M‐H, Fixed, 95% CI) | Subtotals only | |
| Analysis 21.23  Comparison 21 Concomitant treatment MTX versus none (sensitivity analysis), Outcome 23 Hypotension. | ||||
| 23.1 24 weeks | 1 | 80 | Risk Ratio (M‐H, Fixed, 95% CI) | 0.58 [0.26, 1.33] |
| 24 Nasopharyngitis Show forest plot | 1 | Risk Ratio (M‐H, Fixed, 95% CI) | Subtotals only | |
| Analysis 21.24  Comparison 21 Concomitant treatment MTX versus none (sensitivity analysis), Outcome 24 Nasopharyngitis. | ||||
| 24.1 24 weeks | 1 | 80 | Risk Ratio (M‐H, Fixed, 95% CI) | 1.0 [0.27, 3.72] |
| 25 Nausea Show forest plot | 1 | Risk Ratio (M‐H, Fixed, 95% CI) | Subtotals only | |
| Analysis 21.25  Comparison 21 Concomitant treatment MTX versus none (sensitivity analysis), Outcome 25 Nausea. | ||||
| 25.1 24 weeks | 1 | 80 | Risk Ratio (M‐H, Fixed, 95% CI) | 0.2 [0.01, 4.04] |
| 26 Pruritus Show forest plot | 1 | Risk Ratio (M‐H, Fixed, 95% CI) | Subtotals only | |
| Analysis 21.26  Comparison 21 Concomitant treatment MTX versus none (sensitivity analysis), Outcome 26 Pruritus. | ||||
| 26.1 24 weeks | 1 | 80 | Risk Ratio (M‐H, Fixed, 95% CI) | 0.11 [0.01, 2.00] |
| 27 Rash Show forest plot | 1 | Risk Ratio (M‐H, Fixed, 95% CI) | Subtotals only | |
| Analysis 21.27  Comparison 21 Concomitant treatment MTX versus none (sensitivity analysis), Outcome 27 Rash. | ||||
| 27.1 24 weeks | 1 | 80 | Risk Ratio (M‐H, Fixed, 95% CI) | 0.25 [0.03, 2.14] |
| 27.2 48 weeks | 1 | 80 | Risk Ratio (M‐H, Fixed, 95% CI) | 0.33 [0.01, 7.95] |
| Outcome or subgroup title | No. of studies | No. of participants | Statistical method | Effect size |
| 1 ACR 20 Show forest plot | 1 | Risk Ratio (M‐H, Fixed, 95% CI) | Subtotals only | |
| Analysis 22.1  Comparison 22 Concomitant treatment CTX versus none (sensitivity analysis), Outcome 1 ACR 20. | ||||
| 1.1 24 weeks | 1 | 81 | Risk Ratio (M‐H, Fixed, 95% CI) | 1.16 [0.87, 1.55] |
| 1.2 48 weeks | 1 | 81 | Risk Ratio (M‐H, Fixed, 95% CI) | 1.50 [0.87, 2.59] |
| 1.3 104 weeks | 1 | 81 | Risk Ratio (M‐H, Fixed, 95% CI) | 1.63 [0.42, 6.36] |
| 2 ACR 50 Show forest plot | 1 | Risk Ratio (M‐H, Fixed, 95% CI) | Subtotals only | |
| Analysis 22.2  Comparison 22 Concomitant treatment CTX versus none (sensitivity analysis), Outcome 2 ACR 50. | ||||
| 2.1 24 weeks | 1 | 81 | Risk Ratio (M‐H, Fixed, 95% CI) | 1.28 [0.72, 2.27] |
| 2.2 48 weeks | 1 | 81 | Risk Ratio (M‐H, Fixed, 95% CI) | 1.79 [0.73, 4.37] |
| 2.3 104 weeks | 1 | 81 | Risk Ratio (M‐H, Fixed, 95% CI) | 1.30 [0.31, 5.45] |
| 3 ACR 70 Show forest plot | 1 | Risk Ratio (M‐H, Fixed, 95% CI) | Subtotals only | |
| Analysis 22.3  Comparison 22 Concomitant treatment CTX versus none (sensitivity analysis), Outcome 3 ACR 70. | ||||
| 3.1 24 weeks | 1 | 81 | Risk Ratio (M‐H, Fixed, 95% CI) | 0.98 [0.34, 2.77] |
| 3.2 48 weeks | 1 | 81 | Risk Ratio (M‐H, Fixed, 95% CI) | 1.30 [0.31, 5.45] |
| 3.3 104 weeks | 1 | 81 | Risk Ratio (M‐H, Fixed, 95% CI) | 2.93 [0.32, 26.97] |
| 4 DAS 28 Show forest plot | 1 | Mean Difference (IV, Fixed, 95% CI) | Subtotals only | |
| Analysis 22.4  Comparison 22 Concomitant treatment CTX versus none (sensitivity analysis), Outcome 4 DAS 28. | ||||
| 4.1 24 weeks | 1 | 81 | Mean Difference (IV, Fixed, 95% CI) | ‐0.40 [‐1.03, 0.23] |
| 5 Moderate or good EULAR response Show forest plot | 1 | Risk Ratio (M‐H, Fixed, 95% CI) | Subtotals only | |
| Analysis 22.5  Comparison 22 Concomitant treatment CTX versus none (sensitivity analysis), Outcome 5 Moderate or good EULAR response. | ||||
| 5.1 24 weeks | 1 | 81 | Risk Ratio (M‐H, Fixed, 95% CI) | 1.00 [0.84, 1.20] |
| 6 HAQ‐DI Show forest plot | 1 | Mean Difference (IV, Fixed, 95% CI) | Subtotals only | |
| Analysis 22.6  Comparison 22 Concomitant treatment CTX versus none (sensitivity analysis), Outcome 6 HAQ‐DI. | ||||
| 6.1 24 weeks | 1 | 75 | Mean Difference (IV, Fixed, 95% CI) | 0.20 [‐0.08, 0.48] |
| 6.2 48 weeks | 1 | 65 | Mean Difference (IV, Fixed, 95% CI) | 0.2 [‐0.10, 0.50] |
| 6.3 72 weeks | 1 | 39 | Mean Difference (IV, Fixed, 95% CI) | 0.5 [0.12, 0.88] |
| 7 HAQ‐DI MCID=‐0.22 Show forest plot | 1 | Risk Ratio (M‐H, Fixed, 95% CI) | Subtotals only | |
| Analysis 22.7  Comparison 22 Concomitant treatment CTX versus none (sensitivity analysis), Outcome 7 HAQ‐DI MCID=‐0.22. | ||||
| 7.1 24 weeks | 1 | 75 | Risk Ratio (M‐H, Fixed, 95% CI) | 0.87 [0.62, 1.22] |
| 7.2 48 weeks | 1 | 65 | Risk Ratio (M‐H, Fixed, 95% CI) | 0.91 [0.50, 1.65] |
| 7.3 72 weeks | 1 | 39 | Risk Ratio (M‐H, Fixed, 95% CI) | 1.29 [0.36, 4.65] |
| 7.4 104 weeks | 1 | 13 | Risk Ratio (M‐H, Fixed, 95% CI) | 0.44 [0.04, 5.46] |
| 8 Total discontinuations Show forest plot | 1 | Risk Ratio (M‐H, Fixed, 95% CI) | Subtotals only | |
| Analysis 22.8  Comparison 22 Concomitant treatment CTX versus none (sensitivity analysis), Outcome 8 Total discontinuations. | ||||
| 8.1 24 weeks | 1 | 81 | Risk Ratio (M‐H, Fixed, 95% CI) | 1.95 [0.38, 10.06] |
| 8.2 48 weeks | 1 | 81 | Risk Ratio (M‐H, Fixed, 95% CI) | 0.76 [0.31, 1.84] |
| 8.3 72 weeks | 1 | 81 | Risk Ratio (M‐H, Fixed, 95% CI) | 0.81 [0.53, 1.23] |
| 8.4 104 weeks | 1 | 81 | Risk Ratio (M‐H, Fixed, 95% CI) | 0.87 [0.72, 1.05] |
| 9 Withdrawals due to lack of efficacy Show forest plot | 1 | Risk Ratio (M‐H, Fixed, 95% CI) | Subtotals only | |
| Analysis 22.9  Comparison 22 Concomitant treatment CTX versus none (sensitivity analysis), Outcome 9 Withdrawals due to lack of efficacy. | ||||
| 9.1 24 weeks | 1 | 81 | Risk Ratio (M‐H, Fixed, 95% CI) | 0.0 [0.0, 0.0] |
| 9.2 48 weeks | 1 | 81 | Risk Ratio (M‐H, Fixed, 95% CI) | 0.98 [0.14, 6.59] |
| 9.3 72 weeks | 1 | 81 | Risk Ratio (M‐H, Fixed, 95% CI) | 1.30 [0.31, 5.45] |
| 9.4 104 weeks | 1 | 81 | Risk Ratio (M‐H, Fixed, 95% CI) | 0.78 [0.23, 2.70] |
| 10 Withdrawals due to adverse Events Show forest plot | 1 | Risk Ratio (M‐H, Fixed, 95% CI) | Subtotals only | |
| Analysis 22.10  Comparison 22 Concomitant treatment CTX versus none (sensitivity analysis), Outcome 10 Withdrawals due to adverse Events. | ||||
| 10.1 24 weeks | 1 | 81 | Risk Ratio (M‐H, Fixed, 95% CI) | 0.98 [0.14, 6.59] |
| 10.2 48 weeks | 1 | 81 | Risk Ratio (M‐H, Fixed, 95% CI) | 0.49 [0.09, 2.52] |
| 10.3 72 weeks | 1 | 81 | Risk Ratio (M‐H, Fixed, 95% CI) | 0.78 [0.23, 2.70] |
| 10.4 104 weeks | 1 | 81 | Risk Ratio (M‐H, Fixed, 95% CI) | 0.78 [0.23, 2.70] |
| 11 Withdrawals due to other reasons Show forest plot | 1 | Risk Ratio (M‐H, Fixed, 95% CI) | Subtotals only | |
| Analysis 22.11  Comparison 22 Concomitant treatment CTX versus none (sensitivity analysis), Outcome 11 Withdrawals due to other reasons. | ||||
| 11.1 24 weeks | 1 | 81 | Risk Ratio (M‐H, Fixed, 95% CI) | 4.88 [0.24, 98.60] |
| 11.2 48 weeks | 1 | 81 | Risk Ratio (M‐H, Fixed, 95% CI) | 0.98 [0.21, 4.55] |
| 11.3 72 weeks | 1 | 81 | Risk Ratio (M‐H, Fixed, 95% CI) | 0.72 [0.38, 1.36] |
| 11.4 104 weeks | 1 | 81 | Risk Ratio (M‐H, Fixed, 95% CI) | 0.94 [0.67, 1.31] |
| 12 Any Adverse Event Show forest plot | 1 | Risk Ratio (M‐H, Fixed, 95% CI) | Subtotals only | |
| Analysis 22.12  Comparison 22 Concomitant treatment CTX versus none (sensitivity analysis), Outcome 12 Any Adverse Event. | ||||
| 12.1 24 weeks | 1 | 81 | Risk Ratio (M‐H, Fixed, 95% CI) | 0.91 [0.72, 1.16] |
| 12.2 48‐56 weeks | 1 | 81 | Risk Ratio (M‐H, Fixed, 95% CI) | 0.95 [0.81, 1.12] |
| 13 Serious Adverse Events Show forest plot | 1 | Risk Ratio (M‐H, Fixed, 95% CI) | Subtotals only | |
| Analysis 22.13  Comparison 22 Concomitant treatment CTX versus none (sensitivity analysis), Outcome 13 Serious Adverse Events. | ||||
| 13.1 24 weeks | 1 | 81 | Risk Ratio (M‐H, Fixed, 95% CI) | 2.93 [0.63, 13.65] |
| 13.2 48‐56 weeks | 1 | 81 | Risk Ratio (M‐H, Fixed, 95% CI) | 1.71 [0.54, 5.38] |
| 14 Serious Infections Show forest plot | 1 | Risk Ratio (M‐H, Fixed, 95% CI) | Subtotals only | |
| Analysis 22.14  Comparison 22 Concomitant treatment CTX versus none (sensitivity analysis), Outcome 14 Serious Infections. | ||||
| 14.1 24 weeks | 1 | 81 | Risk Ratio (M‐H, Fixed, 95% CI) | 0.98 [0.14, 6.59] |
| 14.2 48‐56 weeks | 1 | 81 | Risk Ratio (M‐H, Fixed, 95% CI) | 0.33 [0.01, 7.76] |
| 15 Death Show forest plot | 1 | Risk Ratio (M‐H, Fixed, 95% CI) | Subtotals only | |
| Analysis 22.15  Comparison 22 Concomitant treatment CTX versus none (sensitivity analysis), Outcome 15 Death. | ||||
| 15.1 24 weeks | 1 | 81 | Risk Ratio (M‐H, Fixed, 95% CI) | 0.33 [0.01, 7.76] |
| 16 Any Event Associated with 1st Infusion Show forest plot | 1 | Risk Ratio (M‐H, Fixed, 95% CI) | Subtotals only | |
| Analysis 22.16  Comparison 22 Concomitant treatment CTX versus none (sensitivity analysis), Outcome 16 Any Event Associated with 1st Infusion. | ||||
| 16.1 24 weeks | 1 | 81 | Risk Ratio (M‐H, Fixed, 95% CI) | 0.70 [0.40, 1.24] |
| 17 Arthralgia Show forest plot | 1 | Risk Ratio (M‐H, Fixed, 95% CI) | Subtotals only | |
| Analysis 22.17  Comparison 22 Concomitant treatment CTX versus none (sensitivity analysis), Outcome 17 Arthralgia. | ||||
| 17.1 24 weeks | 1 | 81 | Risk Ratio (M‐H, Fixed, 95% CI) | 0.33 [0.04, 3.00] |
| 18 Back pain Show forest plot | 1 | Risk Ratio (M‐H, Fixed, 95% CI) | Subtotals only | |
| Analysis 22.18  Comparison 22 Concomitant treatment CTX versus none (sensitivity analysis), Outcome 18 Back pain. | ||||
| 18.1 24 weeks | 1 | 81 | Risk Ratio (M‐H, Fixed, 95% CI) | 0.73 [0.17, 3.06] |
| 19 Cough Show forest plot | 1 | Risk Ratio (M‐H, Fixed, 95% CI) | Subtotals only | |
| Analysis 22.19  Comparison 22 Concomitant treatment CTX versus none (sensitivity analysis), Outcome 19 Cough. | ||||
| 19.1 24 weeks | 1 | 81 | Risk Ratio (M‐H, Fixed, 95% CI) | 0.20 [0.02, 1.60] |
| 20 Dyspnea Show forest plot | 1 | Risk Ratio (M‐H, Fixed, 95% CI) | Subtotals only | |
| Analysis 22.20  Comparison 22 Concomitant treatment CTX versus none (sensitivity analysis), Outcome 20 Dyspnea. | ||||
| 20.1 24 weeks | 1 | 81 | Risk Ratio (M‐H, Fixed, 95% CI) | 0.11 [0.01, 1.95] |
| 21 Exacerbation of RA Show forest plot | 1 | Risk Ratio (M‐H, Fixed, 95% CI) | Subtotals only | |
| Analysis 22.21  Comparison 22 Concomitant treatment CTX versus none (sensitivity analysis), Outcome 21 Exacerbation of RA. | ||||
| 21.1 24 weeks | 1 | 81 | Risk Ratio (M‐H, Fixed, 95% CI) | 0.98 [0.34, 2.77] |
| 21.2 48‐56 weeks | 1 | 81 | Risk Ratio (M‐H, Fixed, 95% CI) | 0.33 [0.01, 7.76] |
| 22 Hypertension Show forest plot | 1 | Risk Ratio (M‐H, Fixed, 95% CI) | Subtotals only | |
| Analysis 22.22  Comparison 22 Concomitant treatment CTX versus none (sensitivity analysis), Outcome 22 Hypertension. | ||||
| 22.1 24 weeks | 1 | 81 | Risk Ratio (M‐H, Fixed, 95% CI) | 0.49 [0.13, 1.82] |
| 23 Hypotension Show forest plot | 1 | Risk Ratio (M‐H, Fixed, 95% CI) | Subtotals only | |
| Analysis 22.23  Comparison 22 Concomitant treatment CTX versus none (sensitivity analysis), Outcome 23 Hypotension. | ||||
| 23.1 24 weeks | 1 | 81 | Risk Ratio (M‐H, Fixed, 95% CI) | 0.98 [0.50, 1.91] |
| 24 Nasopharyngitis Show forest plot | 1 | Risk Ratio (M‐H, Fixed, 95% CI) | Subtotals only | |
| Analysis 22.24  Comparison 22 Concomitant treatment CTX versus none (sensitivity analysis), Outcome 24 Nasopharyngitis. | ||||
| 24.1 24 weeks | 1 | 81 | Risk Ratio (M‐H, Fixed, 95% CI) | 0.49 [0.09, 2.52] |
| 25 Nausea Show forest plot | 1 | Risk Ratio (M‐H, Fixed, 95% CI) | Subtotals only | |
| Analysis 22.25  Comparison 22 Concomitant treatment CTX versus none (sensitivity analysis), Outcome 25 Nausea. | ||||
| 25.1 24 weeks | 1 | 80 | Risk Ratio (M‐H, Fixed, 95% CI) | 2.0 [0.39, 10.31] |
| 26 Rash Show forest plot | 1 | Risk Ratio (M‐H, Fixed, 95% CI) | Subtotals only | |
| Analysis 22.26  Comparison 22 Concomitant treatment CTX versus none (sensitivity analysis), Outcome 26 Rash. | ||||
| 26.1 24 weeks | 1 | 81 | Risk Ratio (M‐H, Fixed, 95% CI) | 0.98 [0.26, 3.64] |
| 26.2 48 weeks | 1 | 81 | Risk Ratio (M‐H, Fixed, 95% CI) | 0.33 [0.01, 7.76] |

Flow diagram of included studies.
aStudy reported results on cycle 1 and cycle 2 (re‐treatment)
bRe‐treatment was permitted at 24 weeks for patients not responding at least 20%

Risk of bias summary: review authors' judgements about each risk of bias item for each included study.

Risk of bias graph: review authors' judgements about each risk of bias item presented as percentages across all included studies.

Twenty‐nine out of every 100 rituximab plus methotrexate recipients experience a clinical improvement of 50% versus 9 methotrexate recipients.

Funnel plot of comparison: 1 Benefits ‐ RTX (2*1000 mg) + MTX versus MTX, outcome: 1.2 ACR 50.
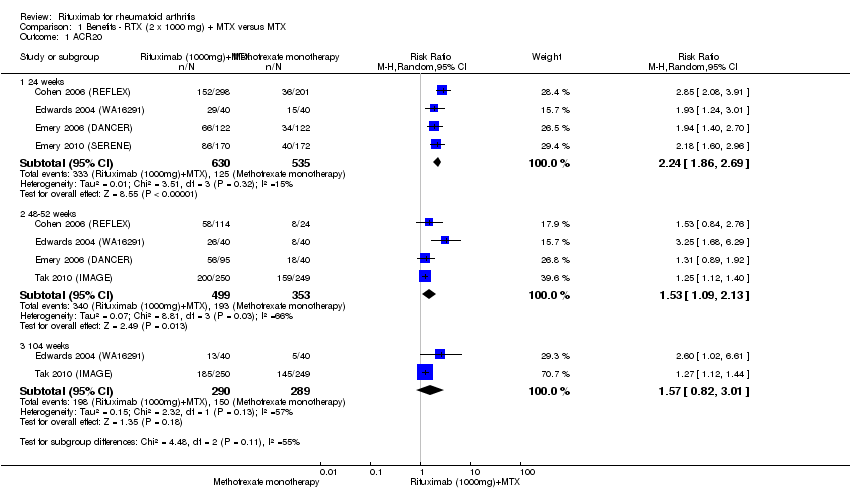
Comparison 1 Benefits ‐ RTX (2 x 1000 mg) + MTX versus MTX, Outcome 1 ACR20.
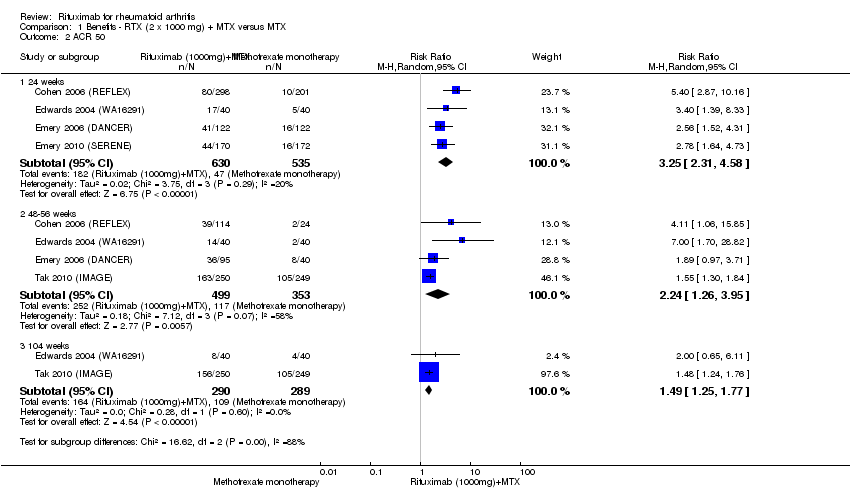
Comparison 1 Benefits ‐ RTX (2 x 1000 mg) + MTX versus MTX, Outcome 2 ACR 50.

Comparison 1 Benefits ‐ RTX (2 x 1000 mg) + MTX versus MTX, Outcome 3 ACR 70.
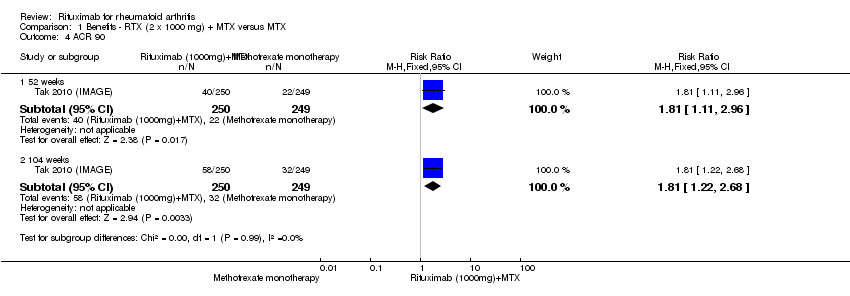
Comparison 1 Benefits ‐ RTX (2 x 1000 mg) + MTX versus MTX, Outcome 4 ACR 90.
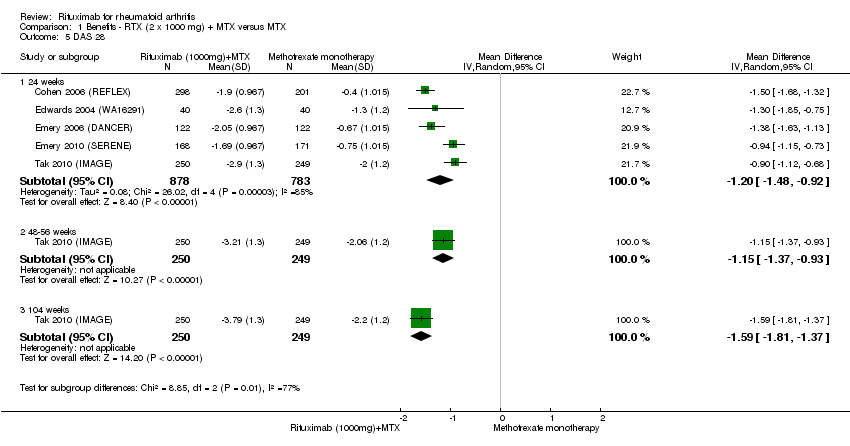
Comparison 1 Benefits ‐ RTX (2 x 1000 mg) + MTX versus MTX, Outcome 5 DAS 28.

Comparison 1 Benefits ‐ RTX (2 x 1000 mg) + MTX versus MTX, Outcome 6 LDA (DAS28 =or<3.2).
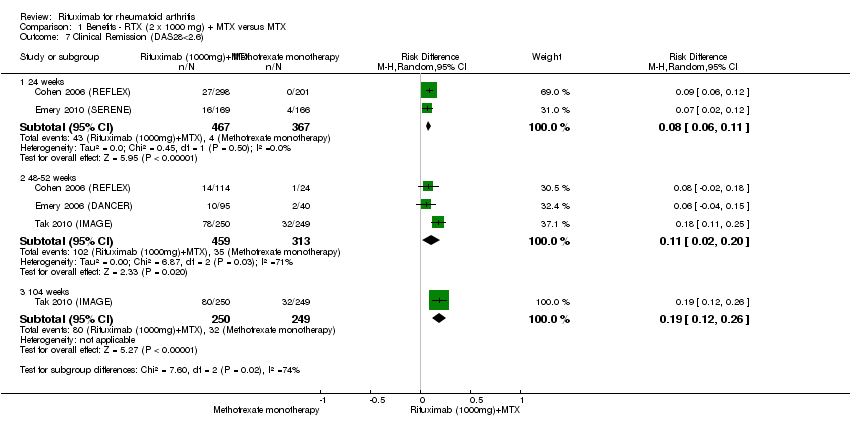
Comparison 1 Benefits ‐ RTX (2 x 1000 mg) + MTX versus MTX, Outcome 7 Clinical Remission (DAS28<2.6).
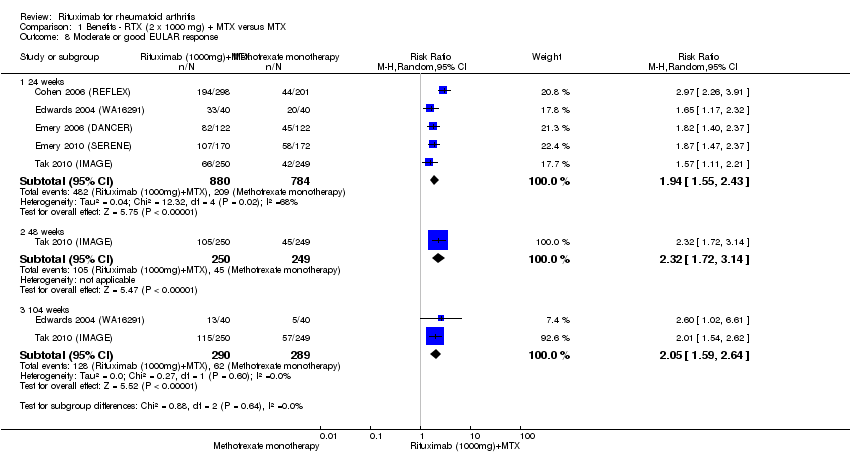
Comparison 1 Benefits ‐ RTX (2 x 1000 mg) + MTX versus MTX, Outcome 8 Moderate or good EULAR response.
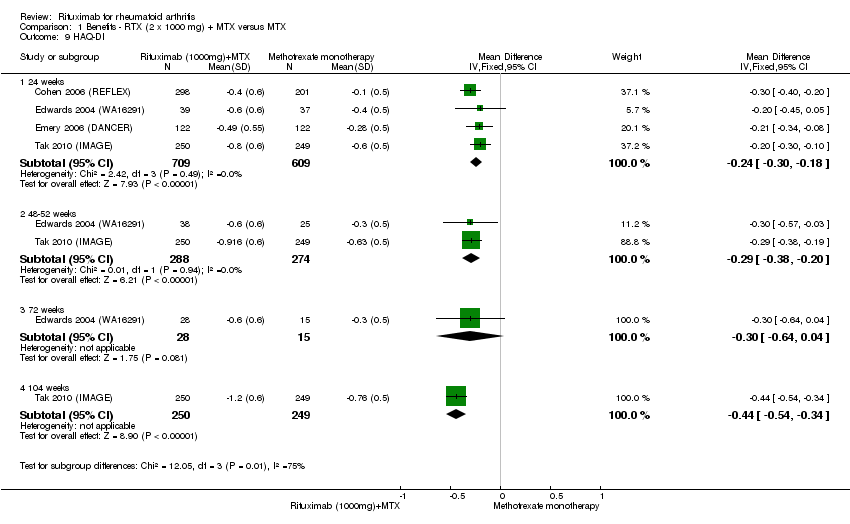
Comparison 1 Benefits ‐ RTX (2 x 1000 mg) + MTX versus MTX, Outcome 9 HAQ‐DI.
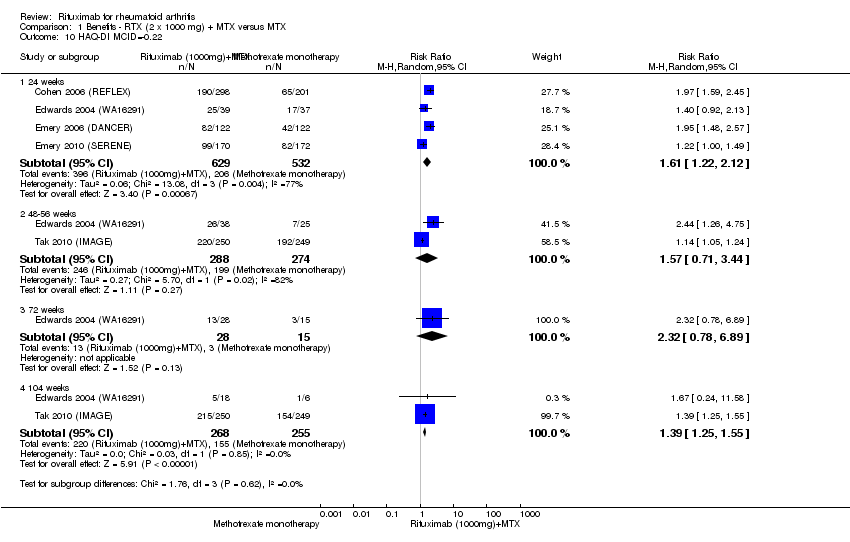
Comparison 1 Benefits ‐ RTX (2 x 1000 mg) + MTX versus MTX, Outcome 10 HAQ‐DI MCID=‐0.22.

Comparison 1 Benefits ‐ RTX (2 x 1000 mg) + MTX versus MTX, Outcome 11 SF‐36 PCS.

Comparison 1 Benefits ‐ RTX (2 x 1000 mg) + MTX versus MTX, Outcome 12 SF‐36 PCS (=or>MCID of 5 or 5.42).
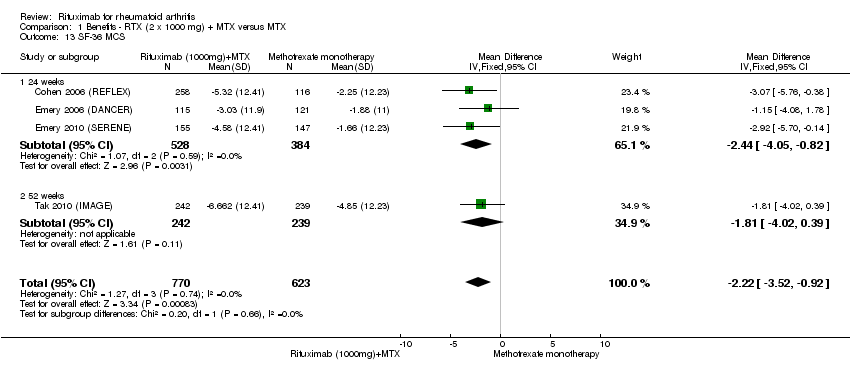
Comparison 1 Benefits ‐ RTX (2 x 1000 mg) + MTX versus MTX, Outcome 13 SF‐36 MCS.

Comparison 1 Benefits ‐ RTX (2 x 1000 mg) + MTX versus MTX, Outcome 14 SF‐36 MCS (=or>MCID of 5 or 6.33).

Comparison 1 Benefits ‐ RTX (2 x 1000 mg) + MTX versus MTX, Outcome 15 FACIT‐F.

Comparison 1 Benefits ‐ RTX (2 x 1000 mg) + MTX versus MTX, Outcome 16 FACIT‐F MCID>= 4or 3.56.

Comparison 1 Benefits ‐ RTX (2 x 1000 mg) + MTX versus MTX, Outcome 17 VAS‐pain.
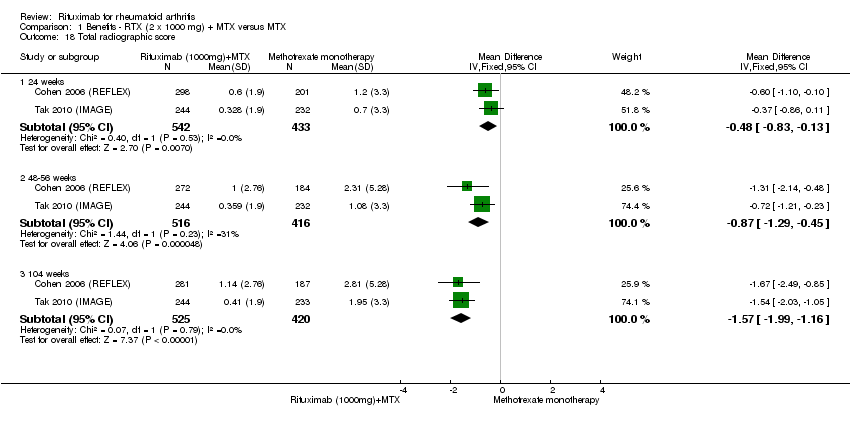
Comparison 1 Benefits ‐ RTX (2 x 1000 mg) + MTX versus MTX, Outcome 18 Total radiographic score.

Comparison 1 Benefits ‐ RTX (2 x 1000 mg) + MTX versus MTX, Outcome 19 Joint Space Narrowing.

Comparison 1 Benefits ‐ RTX (2 x 1000 mg) + MTX versus MTX, Outcome 20 Radiologic erosions.

Comparison 1 Benefits ‐ RTX (2 x 1000 mg) + MTX versus MTX, Outcome 21 No radiographic progression.

Comparison 1 Benefits ‐ RTX (2 x 1000 mg) + MTX versus MTX, Outcome 22 No worsening of erosions.
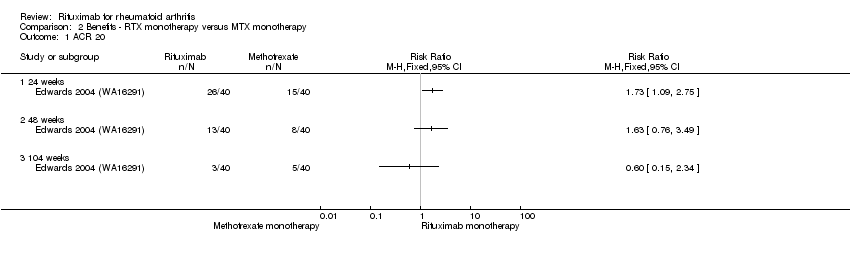
Comparison 2 Benefits ‐ RTX monotherapy versus MTX monotherapy, Outcome 1 ACR 20.

Comparison 2 Benefits ‐ RTX monotherapy versus MTX monotherapy, Outcome 2 ACR 50.
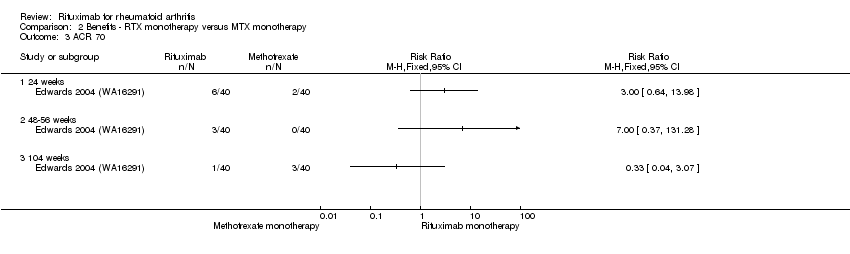
Comparison 2 Benefits ‐ RTX monotherapy versus MTX monotherapy, Outcome 3 ACR 70.
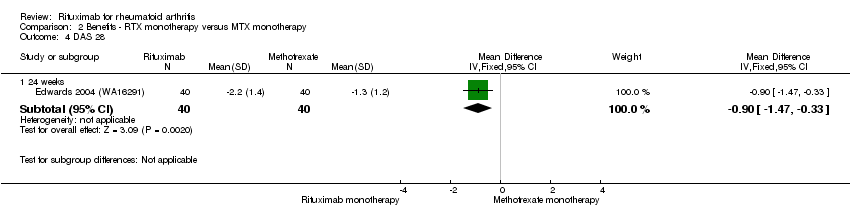
Comparison 2 Benefits ‐ RTX monotherapy versus MTX monotherapy, Outcome 4 DAS 28.

Comparison 2 Benefits ‐ RTX monotherapy versus MTX monotherapy, Outcome 5 Moderate or good EULAR response.

Comparison 2 Benefits ‐ RTX monotherapy versus MTX monotherapy, Outcome 6 HAQ‐DI.
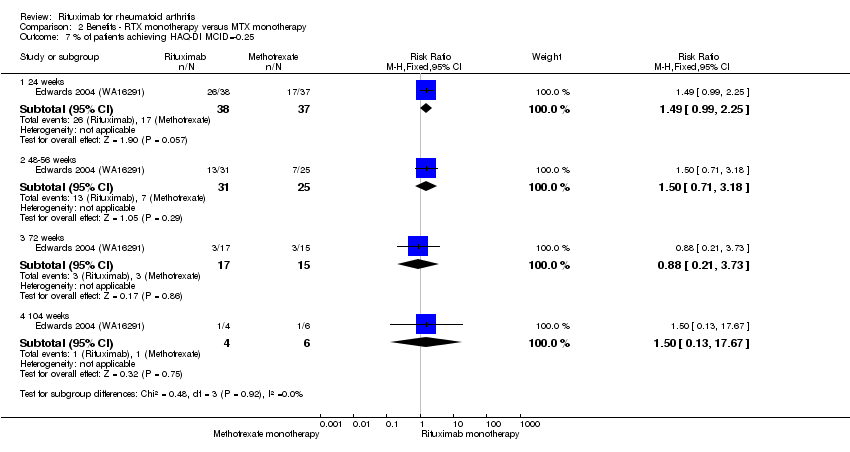
Comparison 2 Benefits ‐ RTX monotherapy versus MTX monotherapy, Outcome 7 % of patients achieving HAQ‐DI MCID=‐0.25.

Comparison 3 Benefits ‐ RTX (2 x 500 mg) + MTX versus MTX, Outcome 1 ACR 20.

Comparison 3 Benefits ‐ RTX (2 x 500 mg) + MTX versus MTX, Outcome 2 ACR 50.
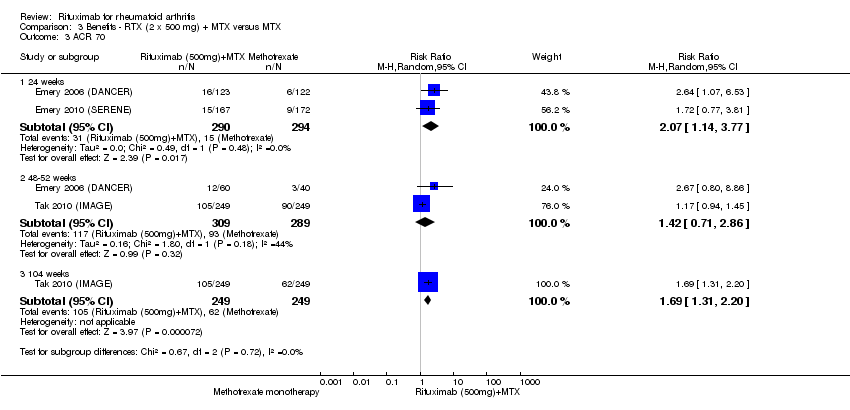
Comparison 3 Benefits ‐ RTX (2 x 500 mg) + MTX versus MTX, Outcome 3 ACR 70.

Comparison 3 Benefits ‐ RTX (2 x 500 mg) + MTX versus MTX, Outcome 4 ACR 90.
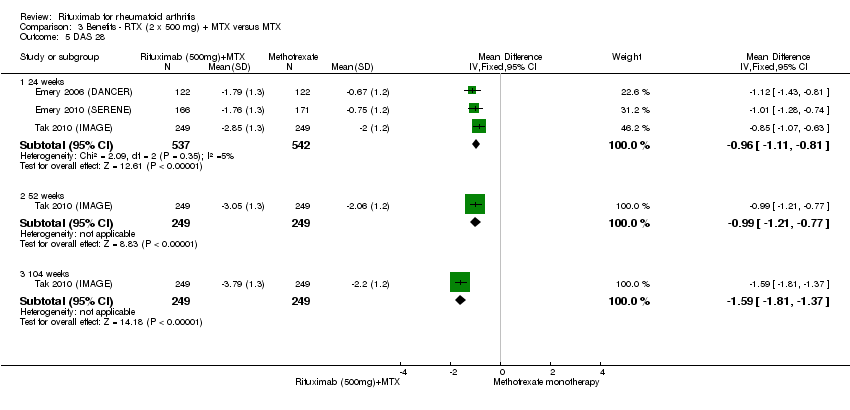
Comparison 3 Benefits ‐ RTX (2 x 500 mg) + MTX versus MTX, Outcome 5 DAS 28.
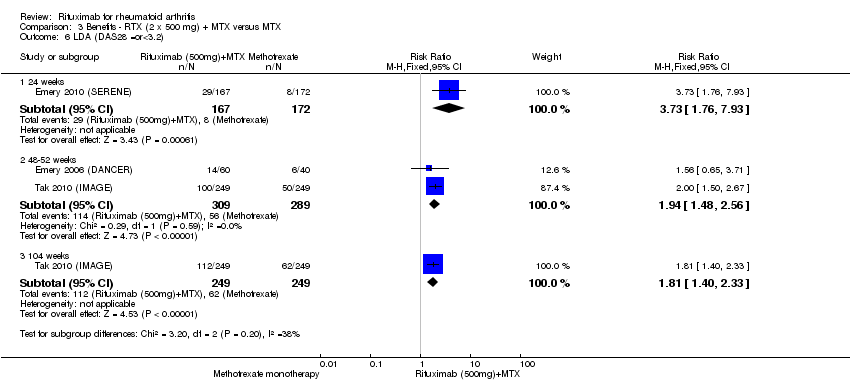
Comparison 3 Benefits ‐ RTX (2 x 500 mg) + MTX versus MTX, Outcome 6 LDA (DAS28 =or<3.2).
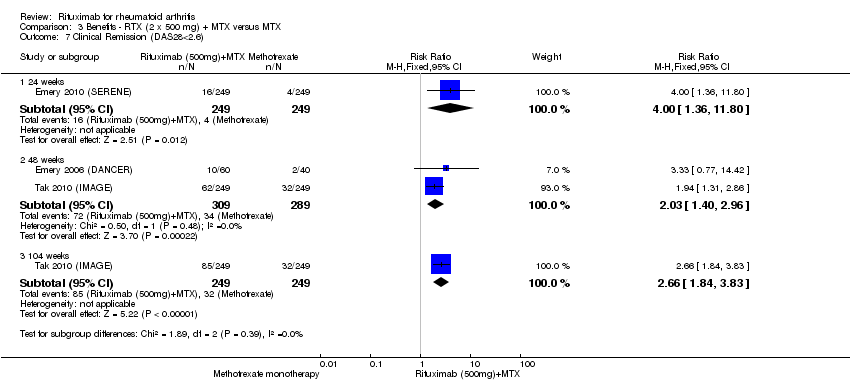
Comparison 3 Benefits ‐ RTX (2 x 500 mg) + MTX versus MTX, Outcome 7 Clinical Remission (DAS28<2.6).

Comparison 3 Benefits ‐ RTX (2 x 500 mg) + MTX versus MTX, Outcome 8 Moderate or good EULAR response.

Comparison 3 Benefits ‐ RTX (2 x 500 mg) + MTX versus MTX, Outcome 9 HAQ‐DI.

Comparison 3 Benefits ‐ RTX (2 x 500 mg) + MTX versus MTX, Outcome 10 HAQ‐DI MCID=‐0.22.
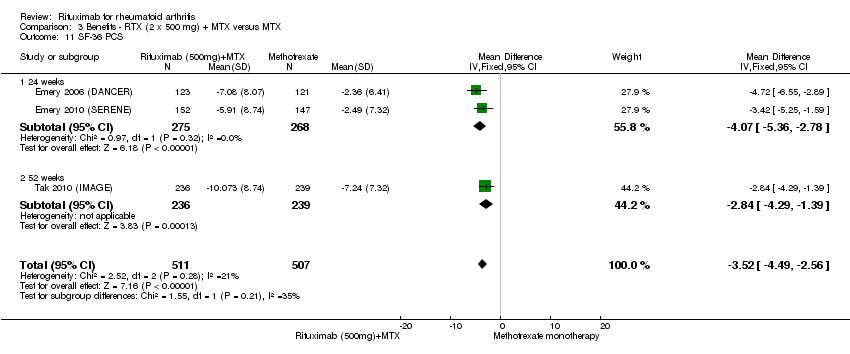
Comparison 3 Benefits ‐ RTX (2 x 500 mg) + MTX versus MTX, Outcome 11 SF‐36 PCS.
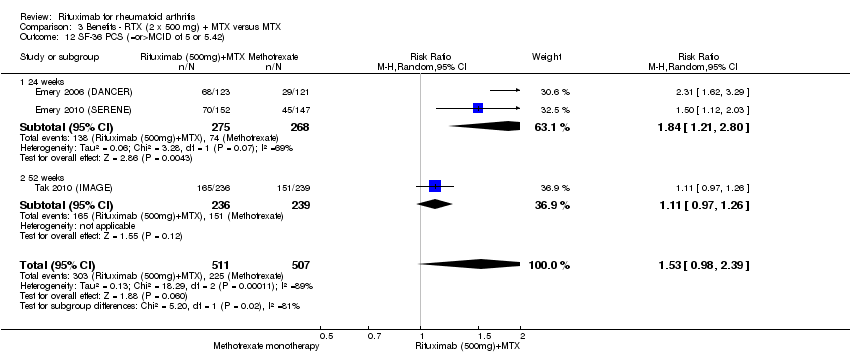
Comparison 3 Benefits ‐ RTX (2 x 500 mg) + MTX versus MTX, Outcome 12 SF‐36 PCS (=or>MCID of 5 or 5.42).

Comparison 3 Benefits ‐ RTX (2 x 500 mg) + MTX versus MTX, Outcome 13 SF‐36 MCS.
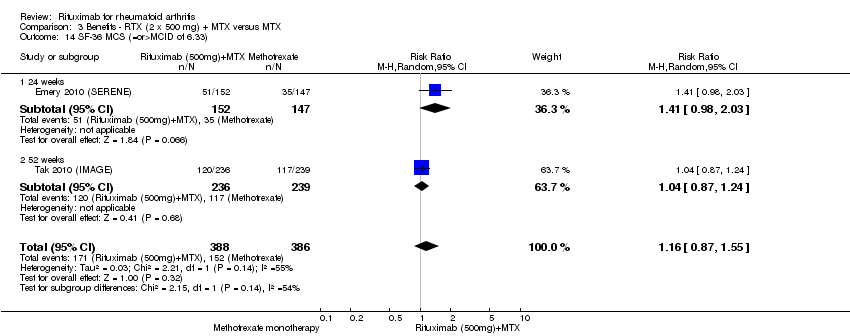
Comparison 3 Benefits ‐ RTX (2 x 500 mg) + MTX versus MTX, Outcome 14 SF‐36 MCS (=or>MCID of 6.33).
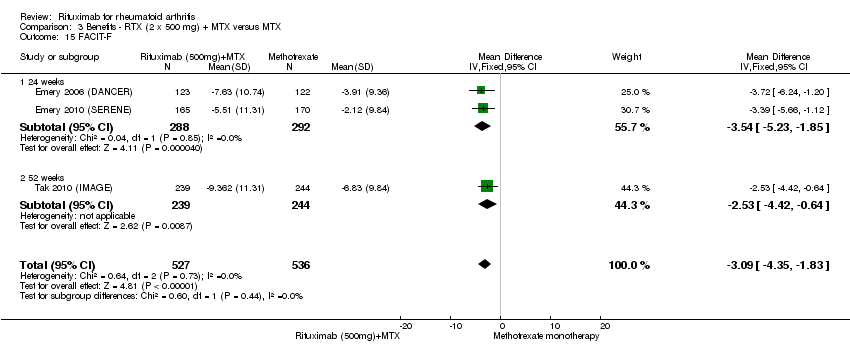
Comparison 3 Benefits ‐ RTX (2 x 500 mg) + MTX versus MTX, Outcome 15 FACIT‐F.

Comparison 3 Benefits ‐ RTX (2 x 500 mg) + MTX versus MTX, Outcome 16 FACIT‐F (= or > MCID of 3.5 or 4).

Comparison 3 Benefits ‐ RTX (2 x 500 mg) + MTX versus MTX, Outcome 17 VAS pain.
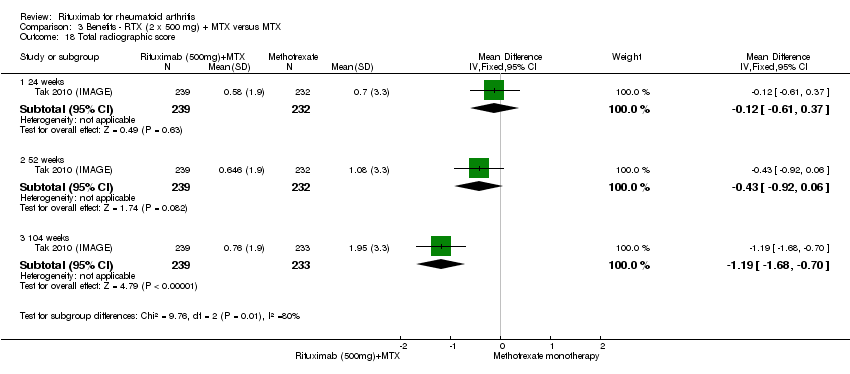
Comparison 3 Benefits ‐ RTX (2 x 500 mg) + MTX versus MTX, Outcome 18 Total radiographic score.
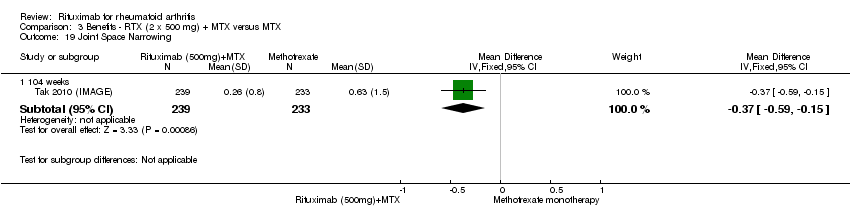
Comparison 3 Benefits ‐ RTX (2 x 500 mg) + MTX versus MTX, Outcome 19 Joint Space Narrowing.

Comparison 3 Benefits ‐ RTX (2 x 500 mg) + MTX versus MTX, Outcome 20 Radiologic erosions.

Comparison 3 Benefits ‐ RTX (2 x 500 mg) + MTX versus MTX, Outcome 21 No radiographic progression.
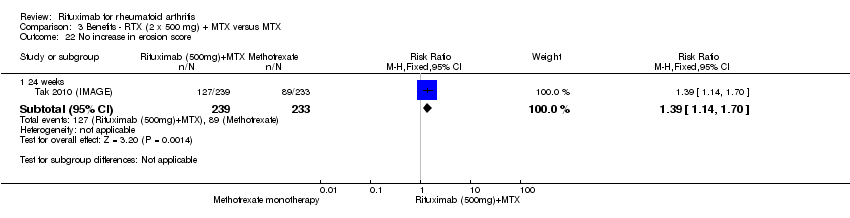
Comparison 3 Benefits ‐ RTX (2 x 500 mg) + MTX versus MTX, Outcome 22 No increase in erosion score.
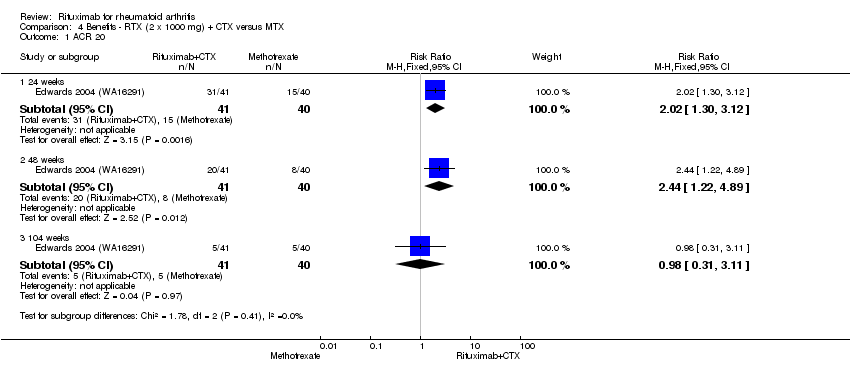
Comparison 4 Benefits ‐ RTX (2 x 1000 mg) + CTX versus MTX, Outcome 1 ACR 20.

Comparison 4 Benefits ‐ RTX (2 x 1000 mg) + CTX versus MTX, Outcome 2 ACR 50.
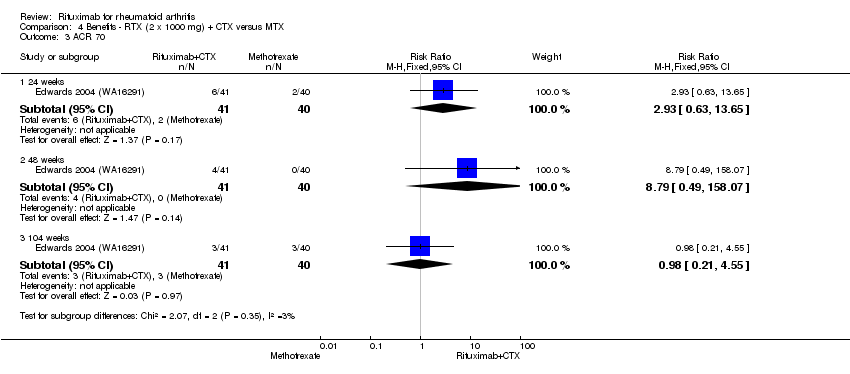
Comparison 4 Benefits ‐ RTX (2 x 1000 mg) + CTX versus MTX, Outcome 3 ACR 70.

Comparison 4 Benefits ‐ RTX (2 x 1000 mg) + CTX versus MTX, Outcome 4 DAS 28.

Comparison 4 Benefits ‐ RTX (2 x 1000 mg) + CTX versus MTX, Outcome 5 Moderate or good EULAR response.
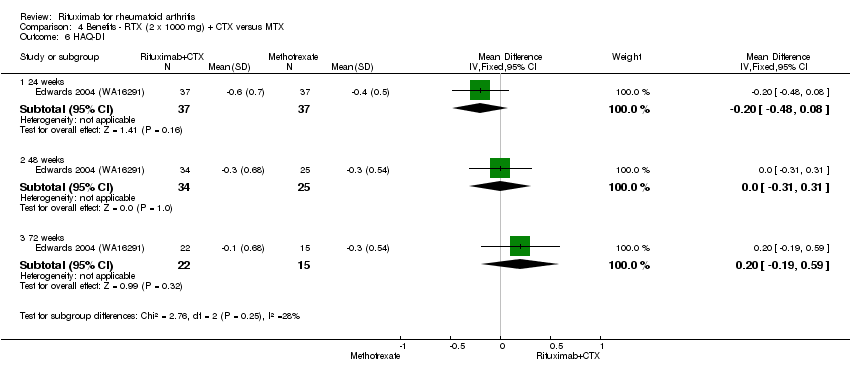
Comparison 4 Benefits ‐ RTX (2 x 1000 mg) + CTX versus MTX, Outcome 6 HAQ‐DI.

Comparison 4 Benefits ‐ RTX (2 x 1000 mg) + CTX versus MTX, Outcome 7 HAQ‐DI MCID=‐0.22.

Comparison 5 Benefits ‐ RTX (2 x 500 mg) + MTX + TNFi versus MTX + TNFi, Outcome 1 ACR 20.

Comparison 5 Benefits ‐ RTX (2 x 500 mg) + MTX + TNFi versus MTX + TNFi, Outcome 2 ACR 50.

Comparison 5 Benefits ‐ RTX (2 x 500 mg) + MTX + TNFi versus MTX + TNFi, Outcome 3 LDA (DAS28 =or<3.2).
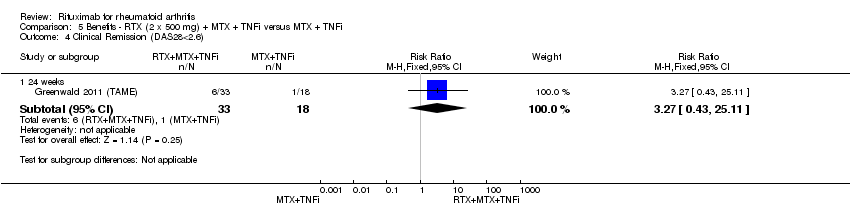
Comparison 5 Benefits ‐ RTX (2 x 500 mg) + MTX + TNFi versus MTX + TNFi, Outcome 4 Clinical Remission (DAS28<2.6).

Comparison 5 Benefits ‐ RTX (2 x 500 mg) + MTX + TNFi versus MTX + TNFi, Outcome 5 HAQ‐DI MCID=‐0.25.

Comparison 6 Withdrawals ‐ RTX (2 x 1000 mg) + MTX versus MTX, Outcome 1 Total discontinuations.

Comparison 6 Withdrawals ‐ RTX (2 x 1000 mg) + MTX versus MTX, Outcome 2 Lack of efficacy.
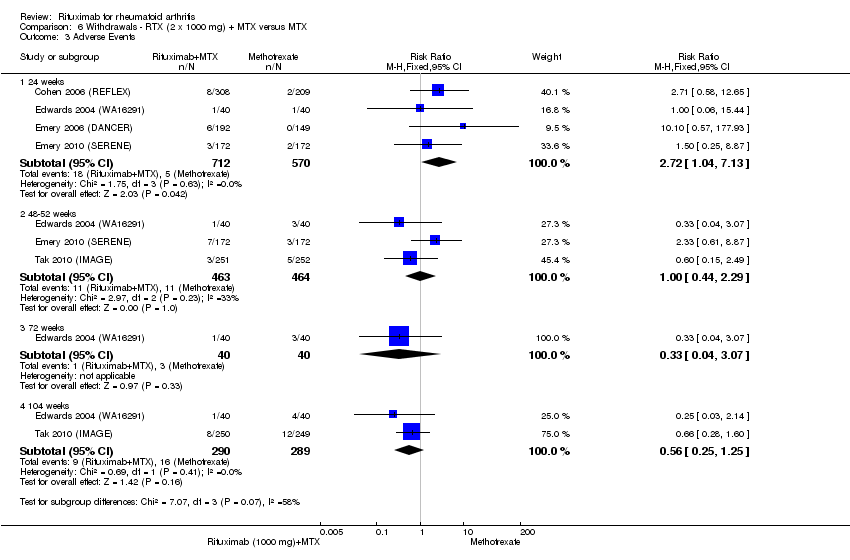
Comparison 6 Withdrawals ‐ RTX (2 x 1000 mg) + MTX versus MTX, Outcome 3 Adverse Events.

Comparison 6 Withdrawals ‐ RTX (2 x 1000 mg) + MTX versus MTX, Outcome 4 Other reasons.

Comparison 7 Withdrawals ‐ RTX monotherapy versus MTX monotherapy, Outcome 1 Total discontinuations.
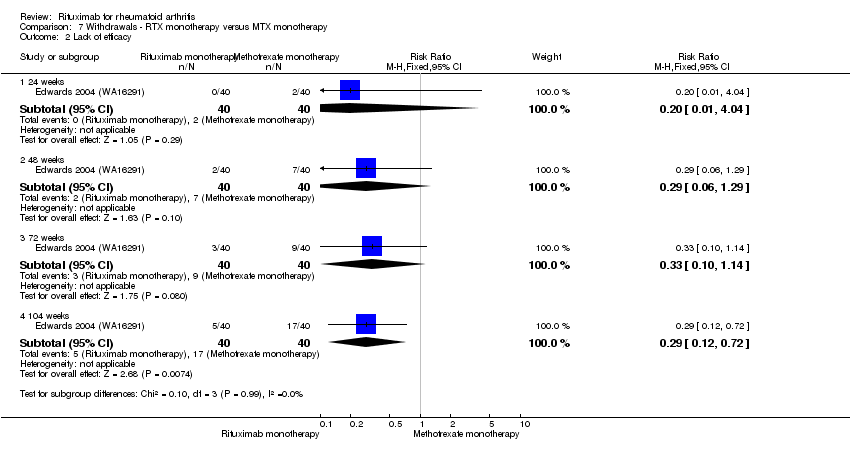
Comparison 7 Withdrawals ‐ RTX monotherapy versus MTX monotherapy, Outcome 2 Lack of efficacy.

Comparison 7 Withdrawals ‐ RTX monotherapy versus MTX monotherapy, Outcome 3 Adverse Events.

Comparison 7 Withdrawals ‐ RTX monotherapy versus MTX monotherapy, Outcome 4 Other reasons.

Comparison 8 Withdrawals ‐ RTX (2 x 500 mg) + MTX versus MTX, Outcome 1 Total discontinuations.

Comparison 8 Withdrawals ‐ RTX (2 x 500 mg) + MTX versus MTX, Outcome 2 Lack of efficacy.
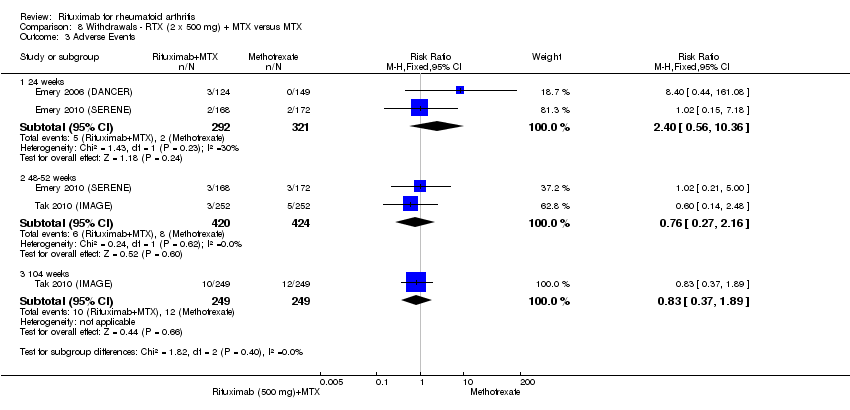
Comparison 8 Withdrawals ‐ RTX (2 x 500 mg) + MTX versus MTX, Outcome 3 Adverse Events.

Comparison 8 Withdrawals ‐ RTX (2 x 500 mg) + MTX versus MTX, Outcome 4 Other reasons.

Comparison 9 Withdrawals ‐ RTX (2 x 1000 mg) + CTX versus MTX, Outcome 1 Total discontinuations.
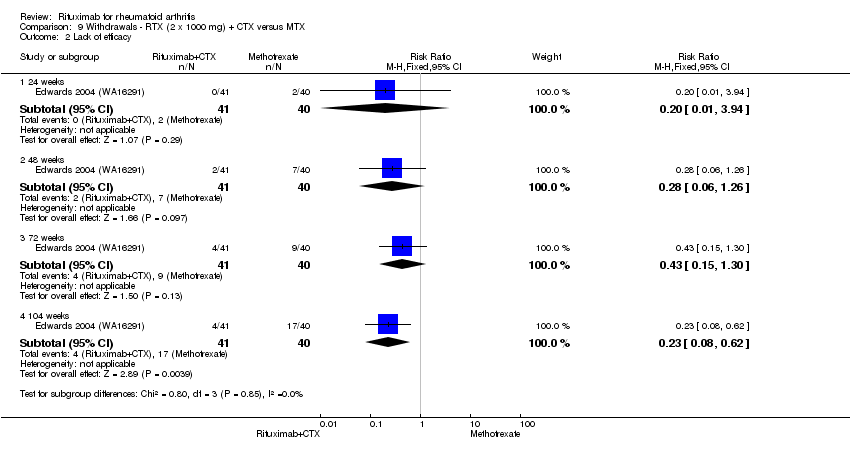
Comparison 9 Withdrawals ‐ RTX (2 x 1000 mg) + CTX versus MTX, Outcome 2 Lack of efficacy.

Comparison 9 Withdrawals ‐ RTX (2 x 1000 mg) + CTX versus MTX, Outcome 3 Adverse Events.
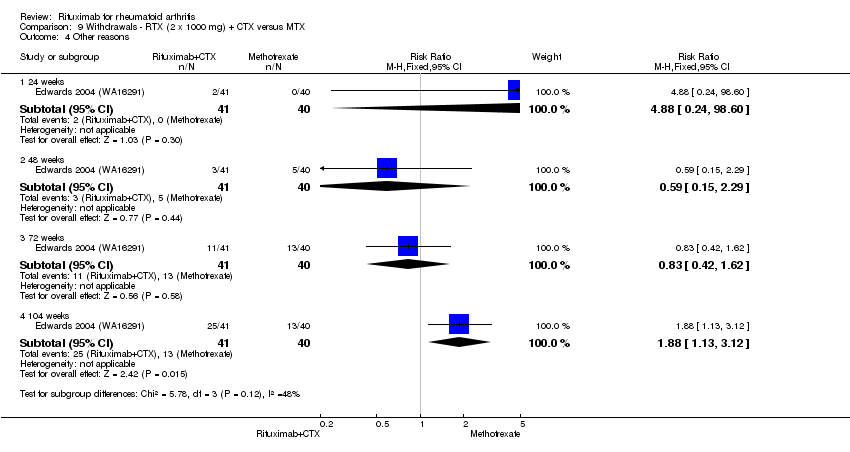
Comparison 9 Withdrawals ‐ RTX (2 x 1000 mg) + CTX versus MTX, Outcome 4 Other reasons.

Comparison 10 Withdrawals ‐ RTX + MTX + TNFi versus MTX + TNFi, Outcome 1 Total discontinuations.

Comparison 10 Withdrawals ‐ RTX + MTX + TNFi versus MTX + TNFi, Outcome 2 Adverse events.

Comparison 11 Harms ‐ RTX (2 x 1000 mg) + MTX versus MTX, Outcome 1 Any Adverse Event.

Comparison 11 Harms ‐ RTX (2 x 1000 mg) + MTX versus MTX, Outcome 2 Serious Adverse Events.

Comparison 11 Harms ‐ RTX (2 x 1000 mg) + MTX versus MTX, Outcome 3 Infections.
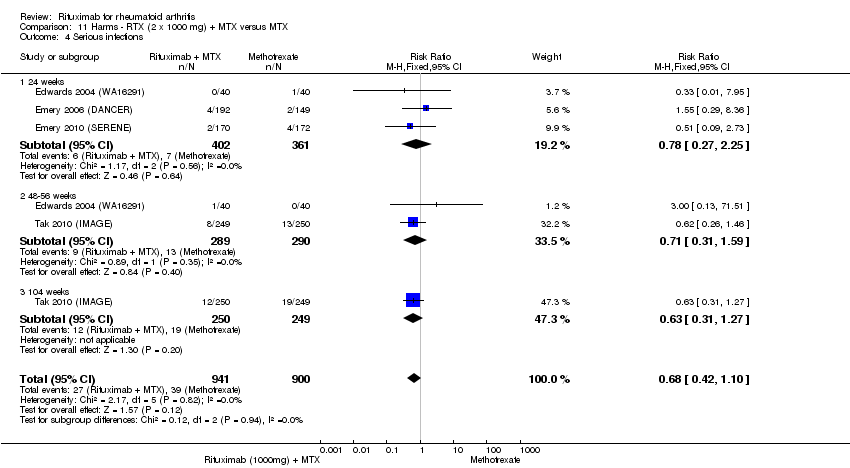
Comparison 11 Harms ‐ RTX (2 x 1000 mg) + MTX versus MTX, Outcome 4 Serious infections.

Comparison 11 Harms ‐ RTX (2 x 1000 mg) + MTX versus MTX, Outcome 5 Death.
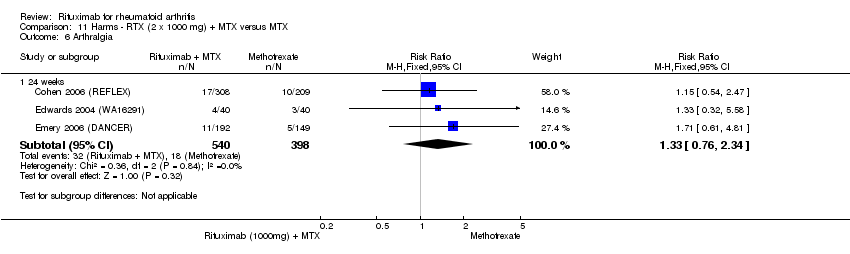
Comparison 11 Harms ‐ RTX (2 x 1000 mg) + MTX versus MTX, Outcome 6 Arthralgia.

Comparison 11 Harms ‐ RTX (2 x 1000 mg) + MTX versus MTX, Outcome 7 Cardiac event (any).

Comparison 11 Harms ‐ RTX (2 x 1000 mg) + MTX versus MTX, Outcome 8 Cardiac event (serious).

Comparison 11 Harms ‐ RTX (2 x 1000 mg) + MTX versus MTX, Outcome 9 Cough.
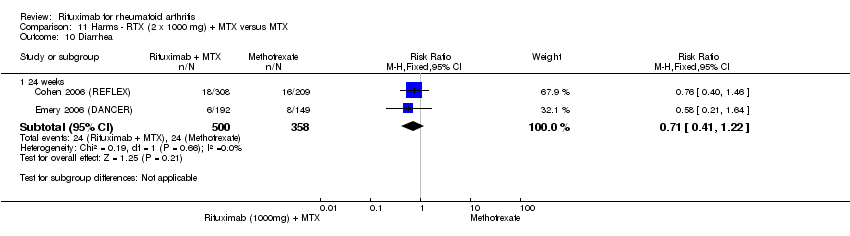
Comparison 11 Harms ‐ RTX (2 x 1000 mg) + MTX versus MTX, Outcome 10 Diarrhea.

Comparison 11 Harms ‐ RTX (2 x 1000 mg) + MTX versus MTX, Outcome 11 Exacerbation of RA.

Comparison 11 Harms ‐ RTX (2 x 1000 mg) + MTX versus MTX, Outcome 12 Fatigue.
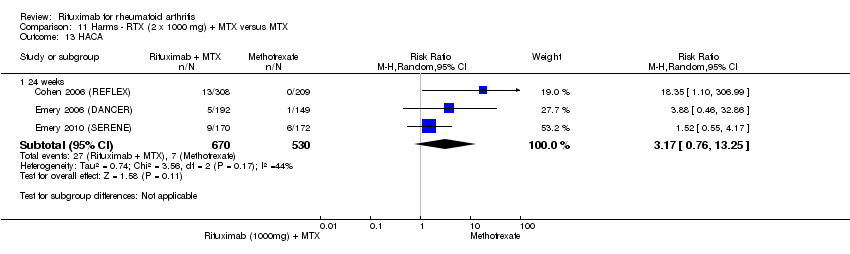
Comparison 11 Harms ‐ RTX (2 x 1000 mg) + MTX versus MTX, Outcome 13 HACA.
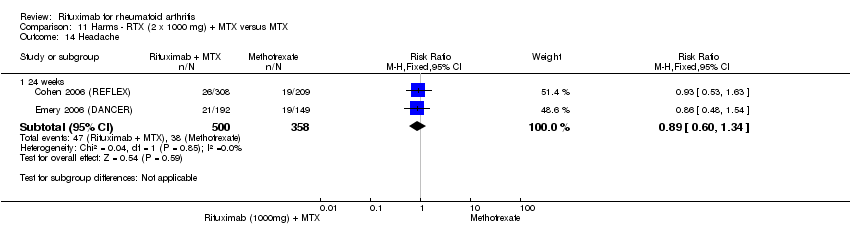
Comparison 11 Harms ‐ RTX (2 x 1000 mg) + MTX versus MTX, Outcome 14 Headache.

Comparison 11 Harms ‐ RTX (2 x 1000 mg) + MTX versus MTX, Outcome 15 Hypertension.

Comparison 11 Harms ‐ RTX (2 x 1000 mg) + MTX versus MTX, Outcome 16 Infusion‐related reactions (1st course ‐1st infusion).

Comparison 11 Harms ‐ RTX (2 x 1000 mg) + MTX versus MTX, Outcome 17 Infusion‐related reaction (1st course ‐2nd infusion).

Comparison 11 Harms ‐ RTX (2 x 1000 mg) + MTX versus MTX, Outcome 18 Infusion‐related reaction (2nd course).
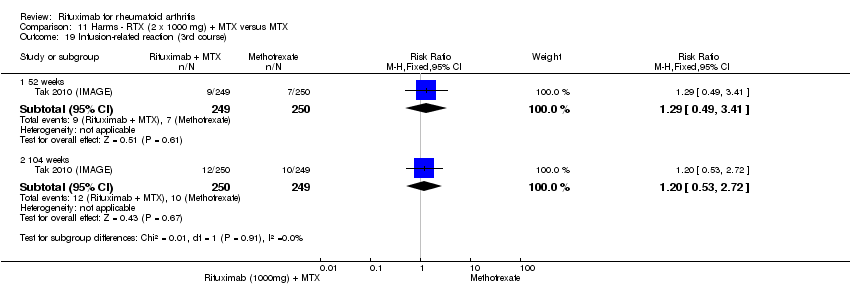
Comparison 11 Harms ‐ RTX (2 x 1000 mg) + MTX versus MTX, Outcome 19 Infusion‐related reaction (3rd course).

Comparison 11 Harms ‐ RTX (2 x 1000 mg) + MTX versus MTX, Outcome 20 Infusion‐related reaction (4th course).

Comparison 11 Harms ‐ RTX (2 x 1000 mg) + MTX versus MTX, Outcome 21 Infusion‐related reaction (5th course).

Comparison 11 Harms ‐ RTX (2 x 1000 mg) + MTX versus MTX, Outcome 22 Lower gastrointestinal events.

Comparison 11 Harms ‐ RTX (2 x 1000 mg) + MTX versus MTX, Outcome 23 Malignancy.

Comparison 11 Harms ‐ RTX (2 x 1000 mg) + MTX versus MTX, Outcome 24 Nasopharyngitis.

Comparison 11 Harms ‐ RTX (2 x 1000 mg) + MTX versus MTX, Outcome 25 Nausea.

Comparison 11 Harms ‐ RTX (2 x 1000 mg) + MTX versus MTX, Outcome 26 Pyrexia.
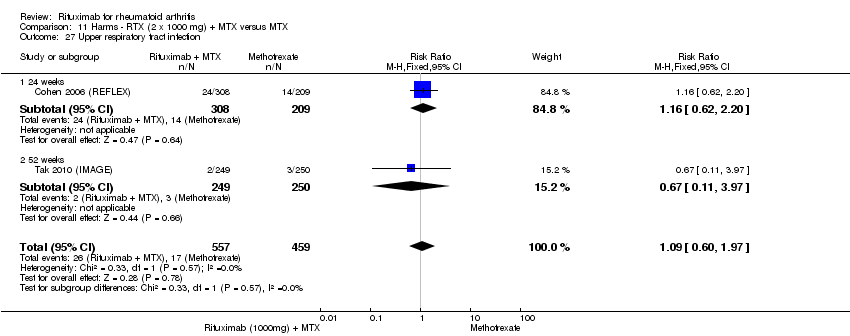
Comparison 11 Harms ‐ RTX (2 x 1000 mg) + MTX versus MTX, Outcome 27 Upper respiratory tract infection.

Comparison 11 Harms ‐ RTX (2 x 1000 mg) + MTX versus MTX, Outcome 28 Urinary tract infection.

Comparison 11 Harms ‐ RTX (2 x 1000 mg) + MTX versus MTX, Outcome 29 Vascular disorders.

Comparison 12 Harms ‐ RTX monotherapy versus MTX monotherapy, Outcome 1 Any Adverse Event.

Comparison 12 Harms ‐ RTX monotherapy versus MTX monotherapy, Outcome 2 Serious Adverse Events.

Comparison 12 Harms ‐ RTX monotherapy versus MTX monotherapy, Outcome 3 Serious Infections.

Comparison 12 Harms ‐ RTX monotherapy versus MTX monotherapy, Outcome 4 Death.
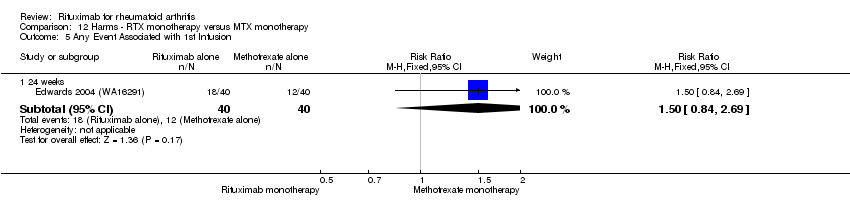
Comparison 12 Harms ‐ RTX monotherapy versus MTX monotherapy, Outcome 5 Any Event Associated with 1st Infusion.
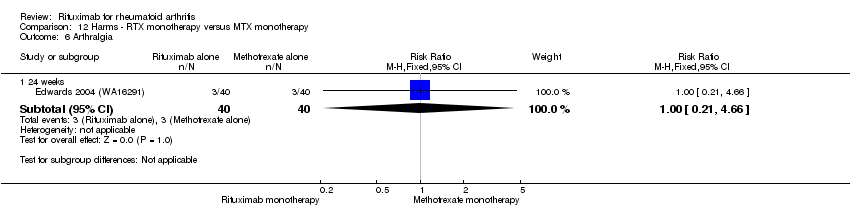
Comparison 12 Harms ‐ RTX monotherapy versus MTX monotherapy, Outcome 6 Arthralgia.
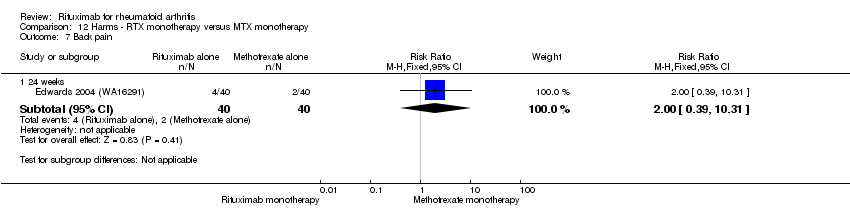
Comparison 12 Harms ‐ RTX monotherapy versus MTX monotherapy, Outcome 7 Back pain.

Comparison 12 Harms ‐ RTX monotherapy versus MTX monotherapy, Outcome 8 Cough.

Comparison 12 Harms ‐ RTX monotherapy versus MTX monotherapy, Outcome 9 Dyspnea.
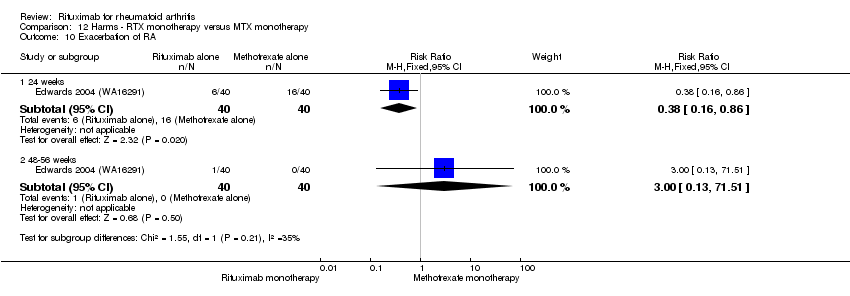
Comparison 12 Harms ‐ RTX monotherapy versus MTX monotherapy, Outcome 10 Exacerbation of RA.
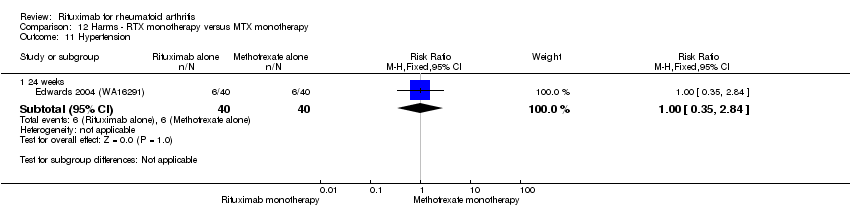
Comparison 12 Harms ‐ RTX monotherapy versus MTX monotherapy, Outcome 11 Hypertension.
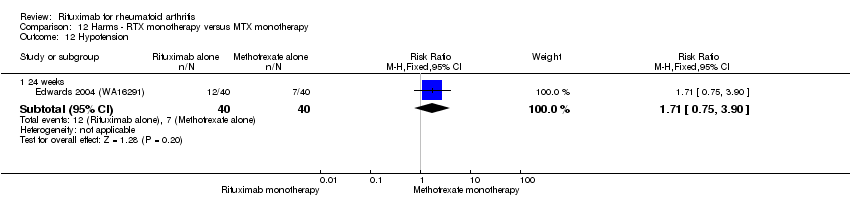
Comparison 12 Harms ‐ RTX monotherapy versus MTX monotherapy, Outcome 12 Hypotension.

Comparison 12 Harms ‐ RTX monotherapy versus MTX monotherapy, Outcome 13 Nasopharyngitis.

Comparison 12 Harms ‐ RTX monotherapy versus MTX monotherapy, Outcome 14 Nausea.
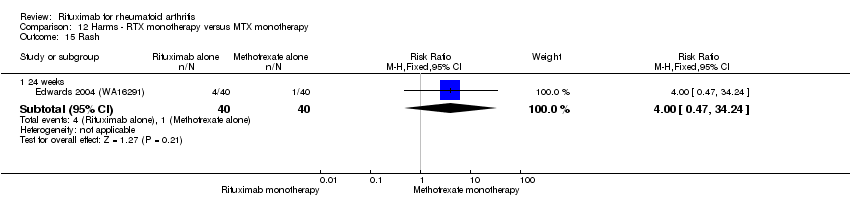
Comparison 12 Harms ‐ RTX monotherapy versus MTX monotherapy, Outcome 15 Rash.

Comparison 13 Harms ‐ RTX (2 x 500 mg) + MTX versus MTX, Outcome 1 Any Adverse Event.
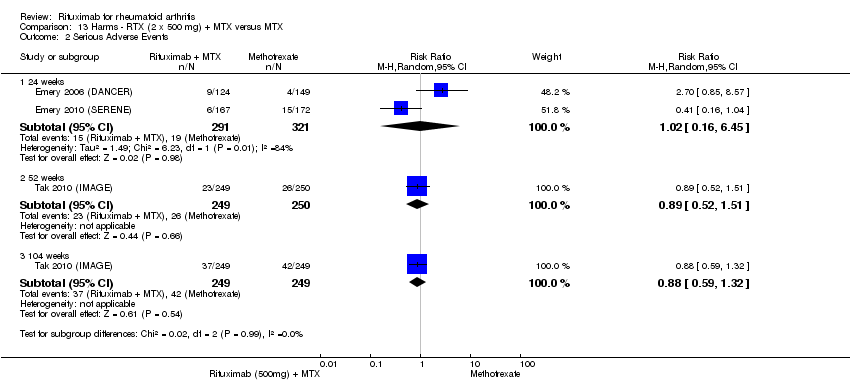
Comparison 13 Harms ‐ RTX (2 x 500 mg) + MTX versus MTX, Outcome 2 Serious Adverse Events.
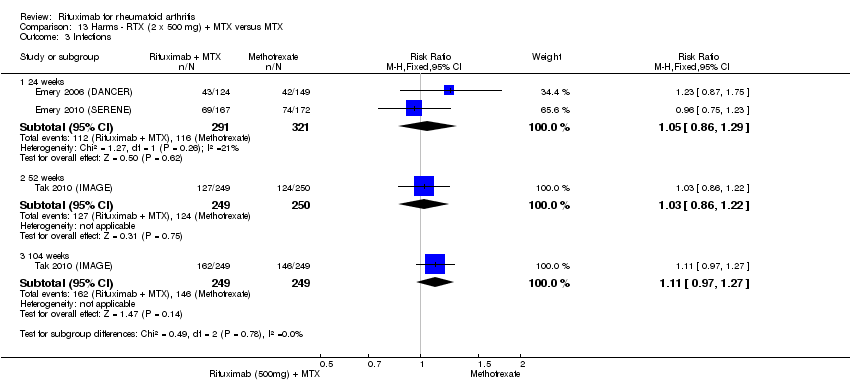
Comparison 13 Harms ‐ RTX (2 x 500 mg) + MTX versus MTX, Outcome 3 Infections.

Comparison 13 Harms ‐ RTX (2 x 500 mg) + MTX versus MTX, Outcome 4 Serious Infections.

Comparison 13 Harms ‐ RTX (2 x 500 mg) + MTX versus MTX, Outcome 5 Death.

Comparison 13 Harms ‐ RTX (2 x 500 mg) + MTX versus MTX, Outcome 6 Arthralgia.

Comparison 13 Harms ‐ RTX (2 x 500 mg) + MTX versus MTX, Outcome 7 Cardiac event (any).
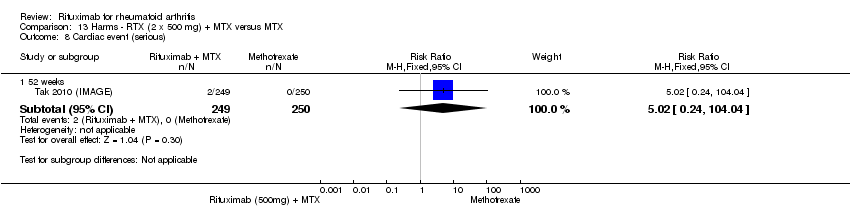
Comparison 13 Harms ‐ RTX (2 x 500 mg) + MTX versus MTX, Outcome 8 Cardiac event (serious).

Comparison 13 Harms ‐ RTX (2 x 500 mg) + MTX versus MTX, Outcome 9 Diarrhea.

Comparison 13 Harms ‐ RTX (2 x 500 mg) + MTX versus MTX, Outcome 10 Exacerbation of RA.

Comparison 13 Harms ‐ RTX (2 x 500 mg) + MTX versus MTX, Outcome 11 Fatigue.

Comparison 13 Harms ‐ RTX (2 x 500 mg) + MTX versus MTX, Outcome 12 HACA.

Comparison 13 Harms ‐ RTX (2 x 500 mg) + MTX versus MTX, Outcome 13 Headache.

Comparison 13 Harms ‐ RTX (2 x 500 mg) + MTX versus MTX, Outcome 14 Hypertension.

Comparison 13 Harms ‐ RTX (2 x 500 mg) + MTX versus MTX, Outcome 15 Infusion‐related reactions (1st course ‐ 1st infusion).
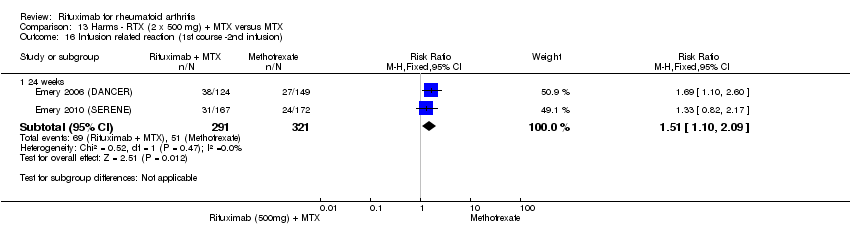
Comparison 13 Harms ‐ RTX (2 x 500 mg) + MTX versus MTX, Outcome 16 Infusion related reaction (1st course ‐2nd infusion).

Comparison 13 Harms ‐ RTX (2 x 500 mg) + MTX versus MTX, Outcome 17 Infusion related reaction (2nd course).
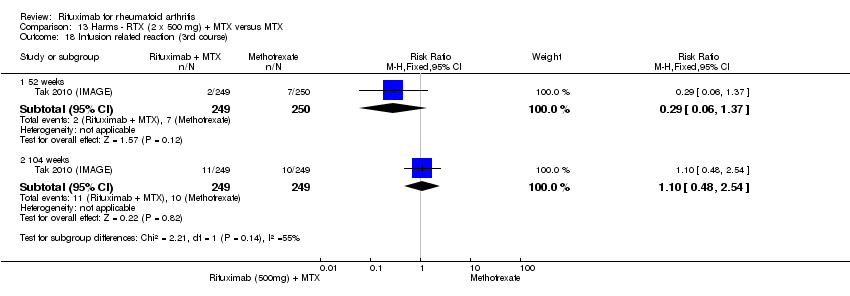
Comparison 13 Harms ‐ RTX (2 x 500 mg) + MTX versus MTX, Outcome 18 Infusion related reaction (3rd course).
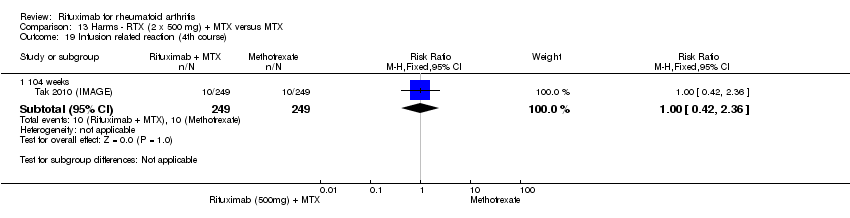
Comparison 13 Harms ‐ RTX (2 x 500 mg) + MTX versus MTX, Outcome 19 Infusion related reaction (4th course).

Comparison 13 Harms ‐ RTX (2 x 500 mg) + MTX versus MTX, Outcome 20 Infusion related reaction (5th course).

Comparison 13 Harms ‐ RTX (2 x 500 mg) + MTX versus MTX, Outcome 21 Lower gastrointestinal events.
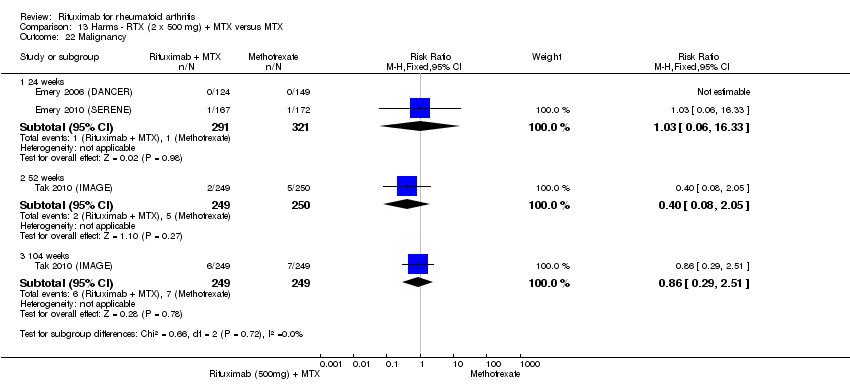
Comparison 13 Harms ‐ RTX (2 x 500 mg) + MTX versus MTX, Outcome 22 Malignancy.

Comparison 13 Harms ‐ RTX (2 x 500 mg) + MTX versus MTX, Outcome 23 Nasopharyngitis.
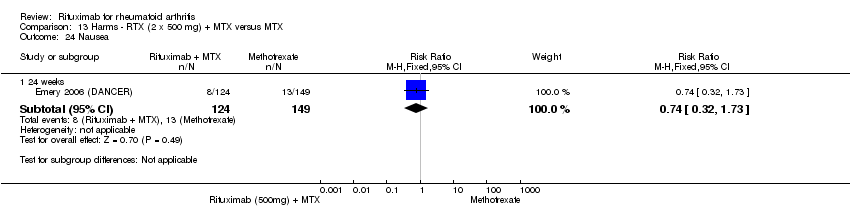
Comparison 13 Harms ‐ RTX (2 x 500 mg) + MTX versus MTX, Outcome 24 Nausea.

Comparison 13 Harms ‐ RTX (2 x 500 mg) + MTX versus MTX, Outcome 25 Upper respiratory tract infection.

Comparison 13 Harms ‐ RTX (2 x 500 mg) + MTX versus MTX, Outcome 26 Vascular disorders.
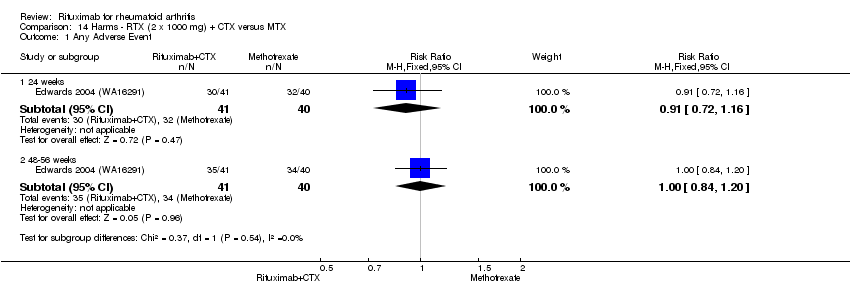
Comparison 14 Harms ‐ RTX (2 x 1000 mg) + CTX versus MTX, Outcome 1 Any Adverse Event.
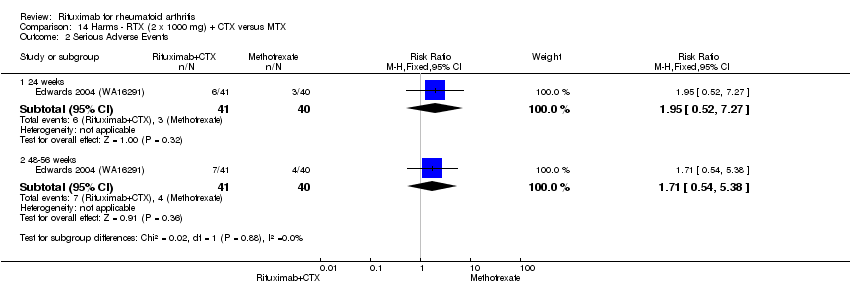
Comparison 14 Harms ‐ RTX (2 x 1000 mg) + CTX versus MTX, Outcome 2 Serious Adverse Events.
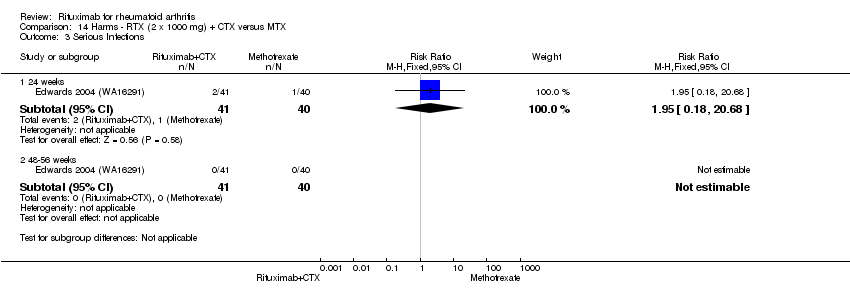
Comparison 14 Harms ‐ RTX (2 x 1000 mg) + CTX versus MTX, Outcome 3 Serious Infections.
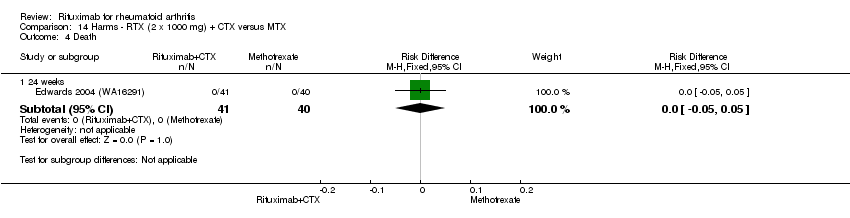
Comparison 14 Harms ‐ RTX (2 x 1000 mg) + CTX versus MTX, Outcome 4 Death.
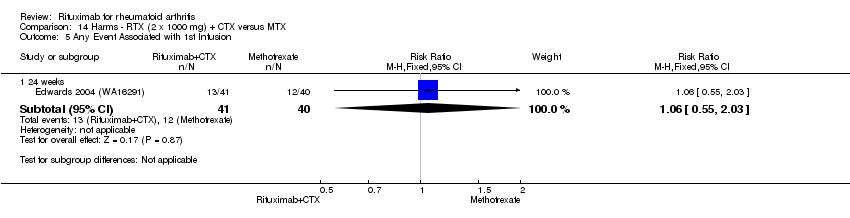
Comparison 14 Harms ‐ RTX (2 x 1000 mg) + CTX versus MTX, Outcome 5 Any Event Associated with 1st Infusion.
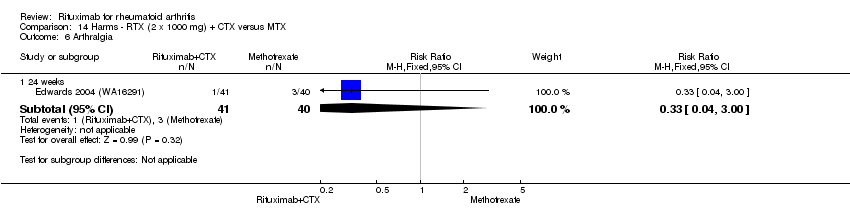
Comparison 14 Harms ‐ RTX (2 x 1000 mg) + CTX versus MTX, Outcome 6 Arthralgia.

Comparison 14 Harms ‐ RTX (2 x 1000 mg) + CTX versus MTX, Outcome 7 Back pain.

Comparison 14 Harms ‐ RTX (2 x 1000 mg) + CTX versus MTX, Outcome 8 Cough.

Comparison 14 Harms ‐ RTX (2 x 1000 mg) + CTX versus MTX, Outcome 9 Dyspnea.

Comparison 14 Harms ‐ RTX (2 x 1000 mg) + CTX versus MTX, Outcome 10 Exacerbation of RA.

Comparison 14 Harms ‐ RTX (2 x 1000 mg) + CTX versus MTX, Outcome 11 Hypertension.
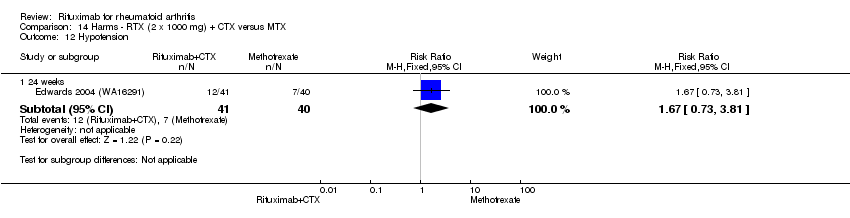
Comparison 14 Harms ‐ RTX (2 x 1000 mg) + CTX versus MTX, Outcome 12 Hypotension.
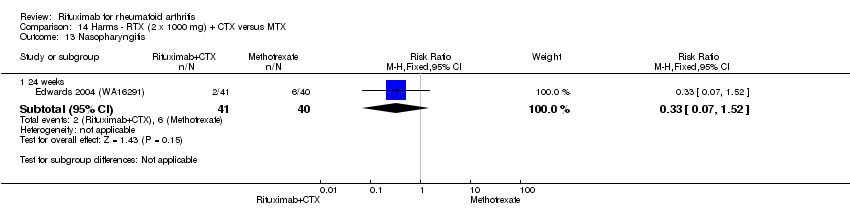
Comparison 14 Harms ‐ RTX (2 x 1000 mg) + CTX versus MTX, Outcome 13 Nasopharyngitis.

Comparison 14 Harms ‐ RTX (2 x 1000 mg) + CTX versus MTX, Outcome 14 Nausea.
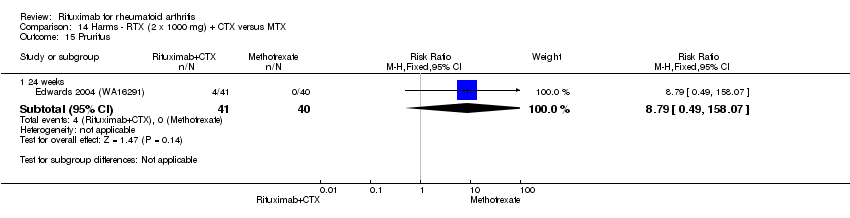
Comparison 14 Harms ‐ RTX (2 x 1000 mg) + CTX versus MTX, Outcome 15 Pruritus.

Comparison 14 Harms ‐ RTX (2 x 1000 mg) + CTX versus MTX, Outcome 16 Rash.
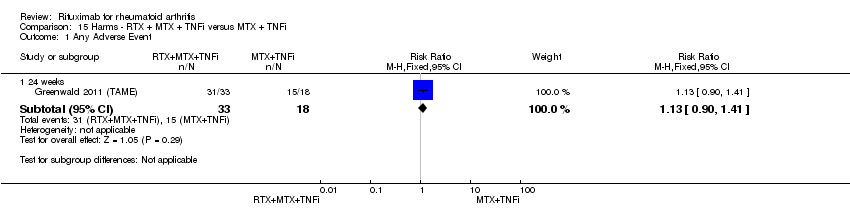
Comparison 15 Harms ‐ RTX + MTX + TNFi versus MTX + TNFi, Outcome 1 Any Adverse Event.
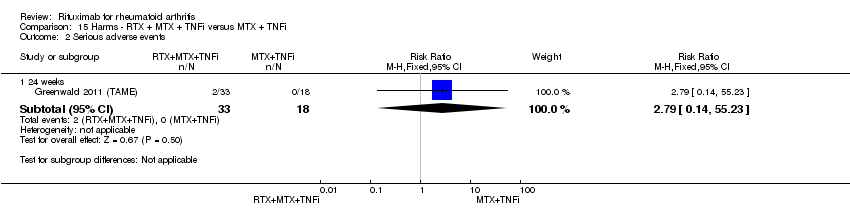
Comparison 15 Harms ‐ RTX + MTX + TNFi versus MTX + TNFi, Outcome 2 Serious adverse events.
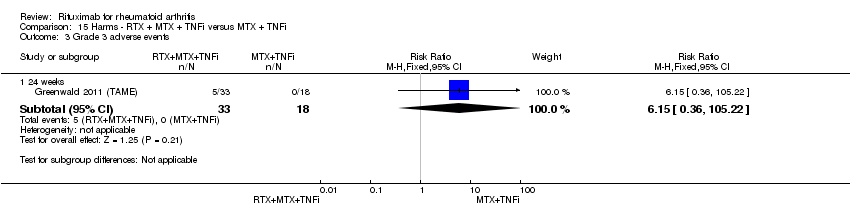
Comparison 15 Harms ‐ RTX + MTX + TNFi versus MTX + TNFi, Outcome 3 Grade 3 adverse events.

Comparison 15 Harms ‐ RTX + MTX + TNFi versus MTX + TNFi, Outcome 4 All infections.

Comparison 15 Harms ‐ RTX + MTX + TNFi versus MTX + TNFi, Outcome 5 Grade 3 infections.

Comparison 15 Harms ‐ RTX + MTX + TNFi versus MTX + TNFi, Outcome 6 Serious infections.

Comparison 15 Harms ‐ RTX + MTX + TNFi versus MTX + TNFi, Outcome 7 Any Event Associated with 1st infusion.

Comparison 15 Harms ‐ RTX + MTX + TNFi versus MTX + TNFi, Outcome 8 Any Event Associated with 2nd infusion.

Comparison 15 Harms ‐ RTX + MTX + TNFi versus MTX + TNFi, Outcome 9 Arthralgia.

Comparison 15 Harms ‐ RTX + MTX + TNFi versus MTX + TNFi, Outcome 10 Coronary artery occlusion.

Comparison 15 Harms ‐ RTX + MTX + TNFi versus MTX + TNFi, Outcome 11 Diarrhea.

Comparison 15 Harms ‐ RTX + MTX + TNFi versus MTX + TNFi, Outcome 12 Exacerbation of RA.

Comparison 15 Harms ‐ RTX + MTX + TNFi versus MTX + TNFi, Outcome 13 Fatigue.
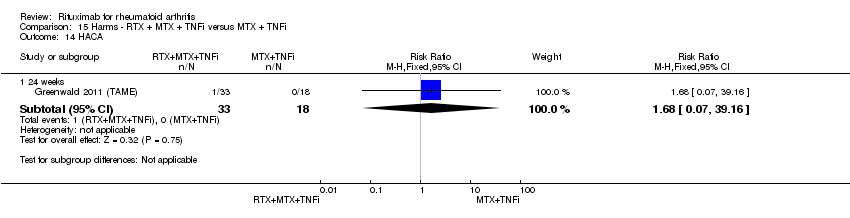
Comparison 15 Harms ‐ RTX + MTX + TNFi versus MTX + TNFi, Outcome 14 HACA.
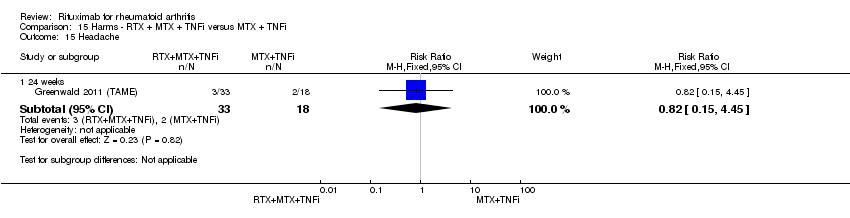
Comparison 15 Harms ‐ RTX + MTX + TNFi versus MTX + TNFi, Outcome 15 Headache.

Comparison 15 Harms ‐ RTX + MTX + TNFi versus MTX + TNFi, Outcome 16 Influenza.
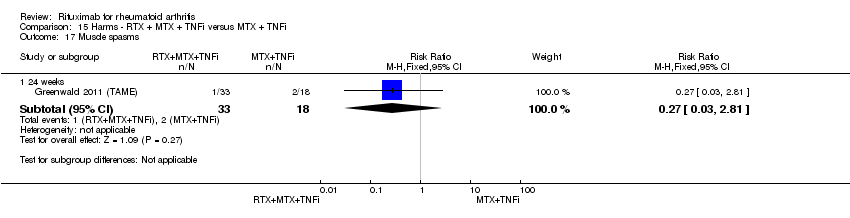
Comparison 15 Harms ‐ RTX + MTX + TNFi versus MTX + TNFi, Outcome 17 Muscle spasms.

Comparison 15 Harms ‐ RTX + MTX + TNFi versus MTX + TNFi, Outcome 18 Nasopharyngitis.

Comparison 15 Harms ‐ RTX + MTX + TNFi versus MTX + TNFi, Outcome 19 Nausea.
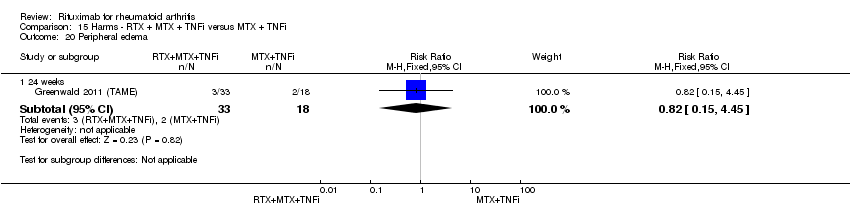
Comparison 15 Harms ‐ RTX + MTX + TNFi versus MTX + TNFi, Outcome 20 Peripheral edema.

Comparison 15 Harms ‐ RTX + MTX + TNFi versus MTX + TNFi, Outcome 21 Pneumonia.

Comparison 15 Harms ‐ RTX + MTX + TNFi versus MTX + TNFi, Outcome 22 Postoperative infection.

Comparison 15 Harms ‐ RTX + MTX + TNFi versus MTX + TNFi, Outcome 23 Pruritus.
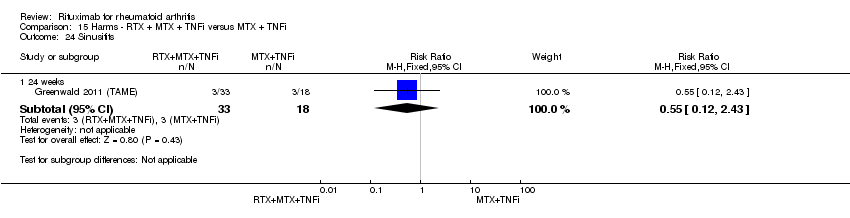
Comparison 15 Harms ‐ RTX + MTX + TNFi versus MTX + TNFi, Outcome 24 Sinusitits.

Comparison 15 Harms ‐ RTX + MTX + TNFi versus MTX + TNFi, Outcome 25 Upper respiratory tract infections.

Comparison 15 Harms ‐ RTX + MTX + TNFi versus MTX + TNFi, Outcome 26 Urinary tract infections.
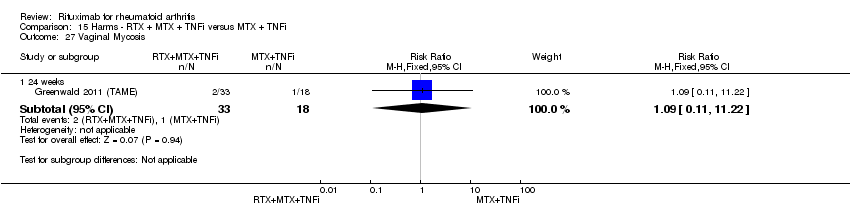
Comparison 15 Harms ‐ RTX + MTX + TNFi versus MTX + TNFi, Outcome 27 Vaginal Mycosis.

Comparison 16 Disease duration (subgroup analysis), Outcome 1 ACR 50.

Comparison 17 Previous treatment (subgroup analysis), Outcome 1 ACR 50.
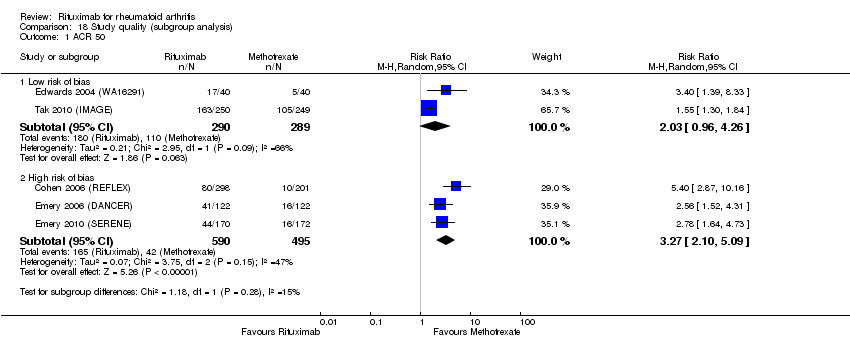
Comparison 18 Study quality (subgroup analysis), Outcome 1 ACR 50.

Comparison 19 Dosage 2 x 1000 mg versus 2 x 500 mg (sensitivity analysis), Outcome 1 ACR 20.

Comparison 19 Dosage 2 x 1000 mg versus 2 x 500 mg (sensitivity analysis), Outcome 2 ACR 50.

Comparison 19 Dosage 2 x 1000 mg versus 2 x 500 mg (sensitivity analysis), Outcome 3 ACR 70.
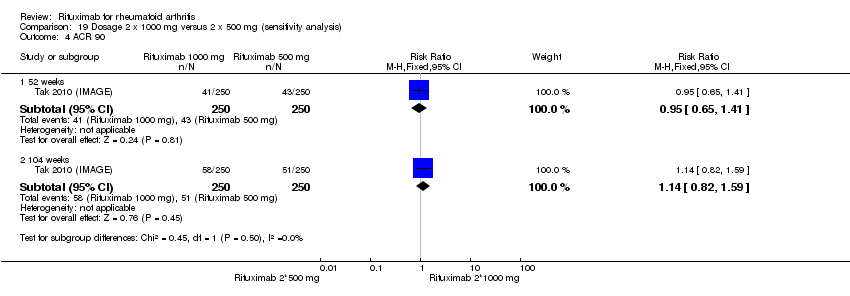
Comparison 19 Dosage 2 x 1000 mg versus 2 x 500 mg (sensitivity analysis), Outcome 4 ACR 90.
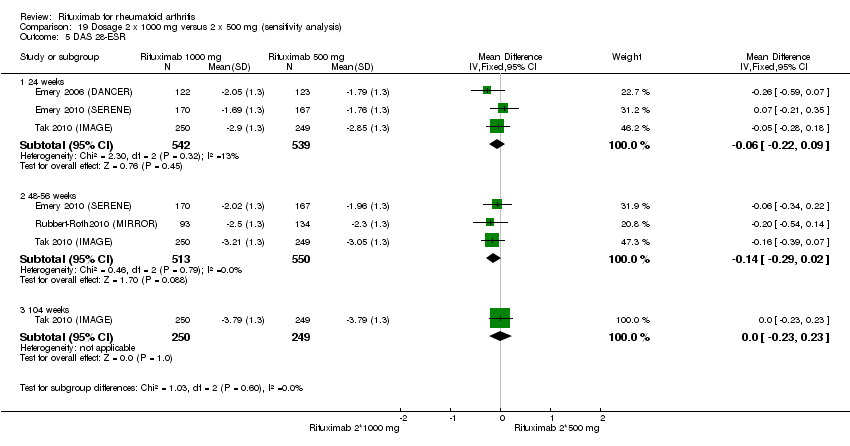
Comparison 19 Dosage 2 x 1000 mg versus 2 x 500 mg (sensitivity analysis), Outcome 5 DAS 28‐ESR.

Comparison 19 Dosage 2 x 1000 mg versus 2 x 500 mg (sensitivity analysis), Outcome 6 LDA (DAS28 =or<3.2).
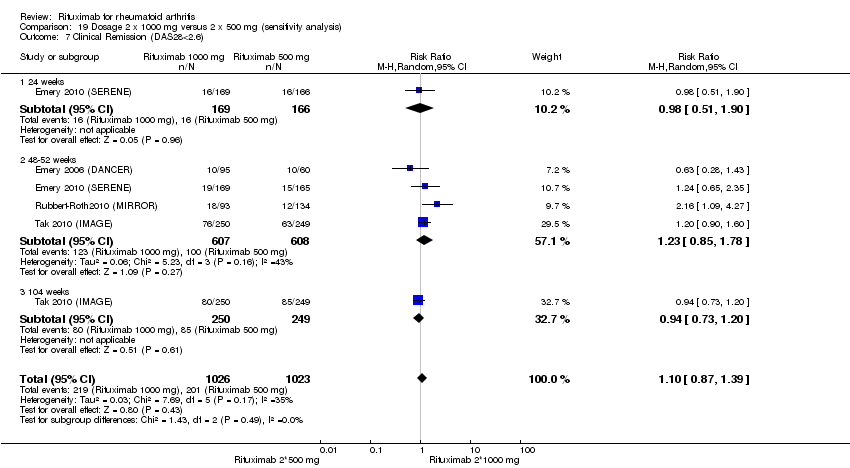
Comparison 19 Dosage 2 x 1000 mg versus 2 x 500 mg (sensitivity analysis), Outcome 7 Clinical Remission (DAS28<2.6).

Comparison 19 Dosage 2 x 1000 mg versus 2 x 500 mg (sensitivity analysis), Outcome 8 Moderate or good EULAR response.

Comparison 19 Dosage 2 x 1000 mg versus 2 x 500 mg (sensitivity analysis), Outcome 9 HAQ‐DI.

Comparison 19 Dosage 2 x 1000 mg versus 2 x 500 mg (sensitivity analysis), Outcome 10 HAQ‐DI MCID=‐0.22.

Comparison 19 Dosage 2 x 1000 mg versus 2 x 500 mg (sensitivity analysis), Outcome 11 SF‐36 PCS.

Comparison 19 Dosage 2 x 1000 mg versus 2 x 500 mg (sensitivity analysis), Outcome 12 SF‐36 PCS (=or>MCID of 5 or 5.42).

Comparison 19 Dosage 2 x 1000 mg versus 2 x 500 mg (sensitivity analysis), Outcome 13 SF‐36 MCS.

Comparison 19 Dosage 2 x 1000 mg versus 2 x 500 mg (sensitivity analysis), Outcome 14 SF‐36 MCS (=or>MCID of 6.33).
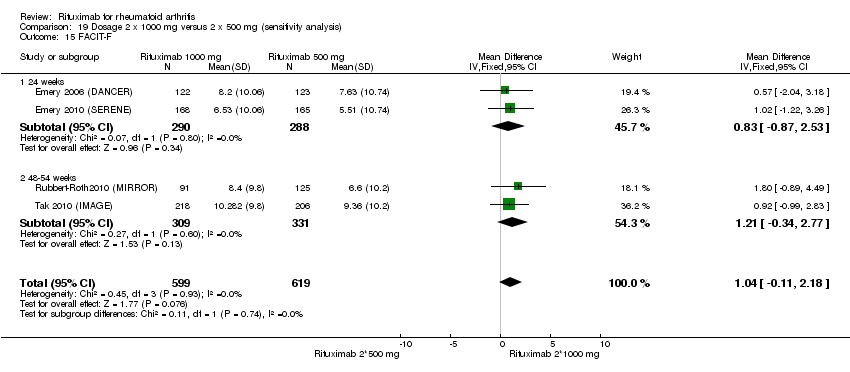
Comparison 19 Dosage 2 x 1000 mg versus 2 x 500 mg (sensitivity analysis), Outcome 15 FACIT‐F.
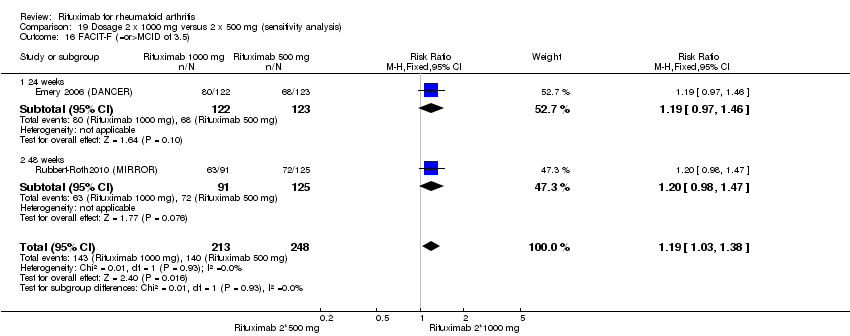
Comparison 19 Dosage 2 x 1000 mg versus 2 x 500 mg (sensitivity analysis), Outcome 16 FACIT‐F (=or>MCID of 3.5).
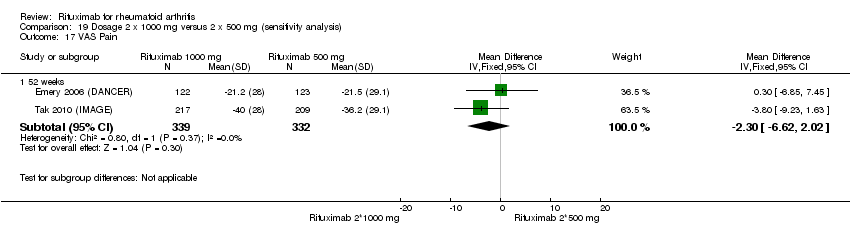
Comparison 19 Dosage 2 x 1000 mg versus 2 x 500 mg (sensitivity analysis), Outcome 17 VAS Pain.

Comparison 19 Dosage 2 x 1000 mg versus 2 x 500 mg (sensitivity analysis), Outcome 18 Total radiographic score.

Comparison 19 Dosage 2 x 1000 mg versus 2 x 500 mg (sensitivity analysis), Outcome 19 Joint space narrowing.

Comparison 19 Dosage 2 x 1000 mg versus 2 x 500 mg (sensitivity analysis), Outcome 20 Radiographic erosions.
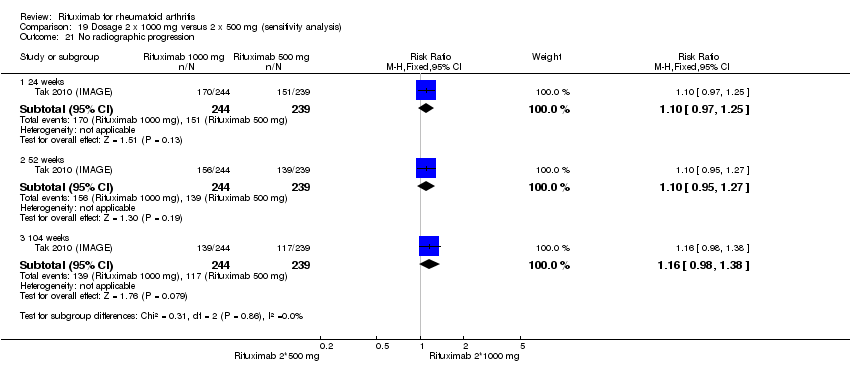
Comparison 19 Dosage 2 x 1000 mg versus 2 x 500 mg (sensitivity analysis), Outcome 21 No radiographic progression.
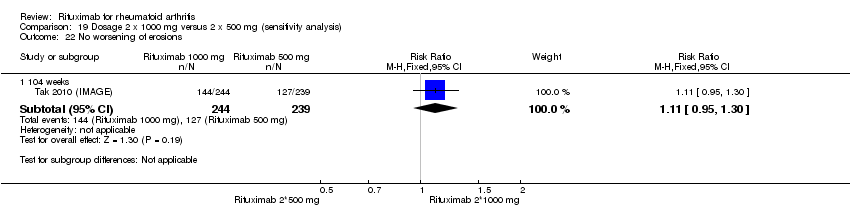
Comparison 19 Dosage 2 x 1000 mg versus 2 x 500 mg (sensitivity analysis), Outcome 22 No worsening of erosions.
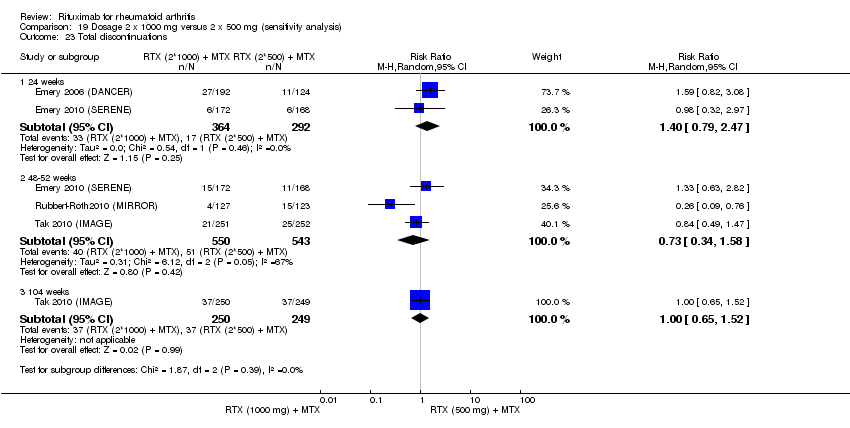
Comparison 19 Dosage 2 x 1000 mg versus 2 x 500 mg (sensitivity analysis), Outcome 23 Total discontinuations.
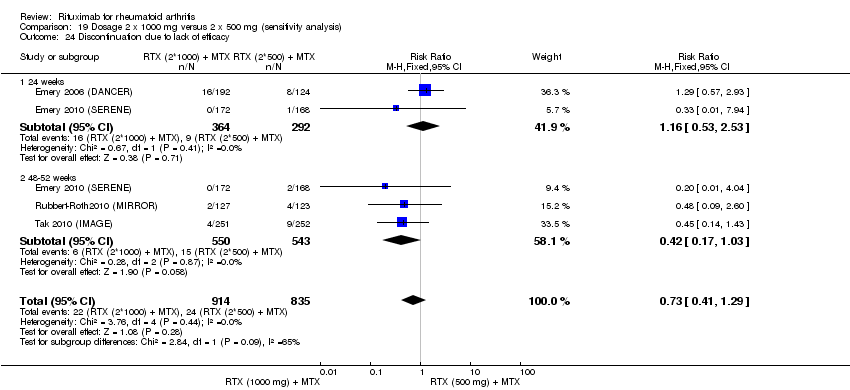
Comparison 19 Dosage 2 x 1000 mg versus 2 x 500 mg (sensitivity analysis), Outcome 24 Discontinuation due to lack of efficacy.
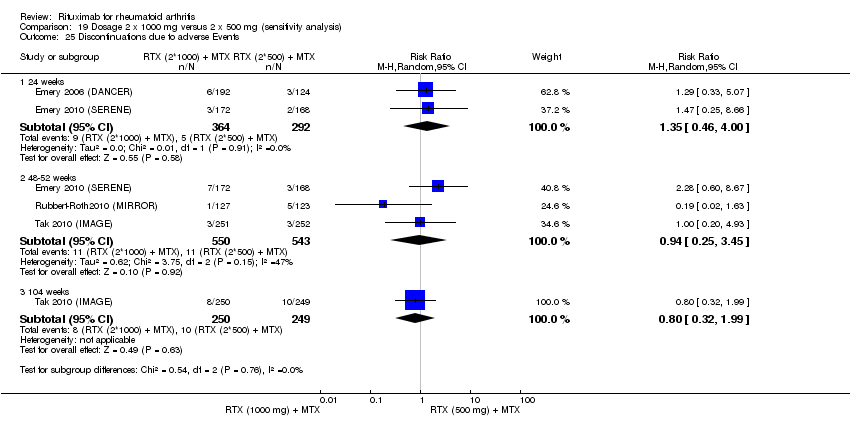
Comparison 19 Dosage 2 x 1000 mg versus 2 x 500 mg (sensitivity analysis), Outcome 25 Discontinuations due to adverse Events.

Comparison 19 Dosage 2 x 1000 mg versus 2 x 500 mg (sensitivity analysis), Outcome 26 Discontinuations due to other reasons.

Comparison 19 Dosage 2 x 1000 mg versus 2 x 500 mg (sensitivity analysis), Outcome 27 Any Adverse Event.

Comparison 19 Dosage 2 x 1000 mg versus 2 x 500 mg (sensitivity analysis), Outcome 28 Serious Adverse Events.
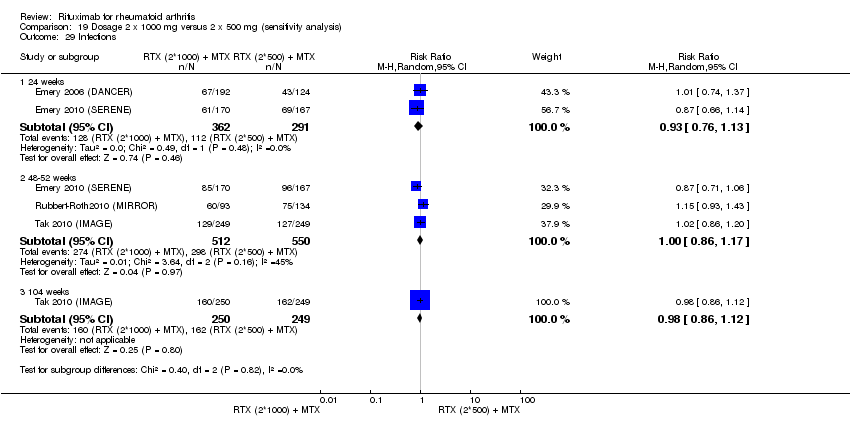
Comparison 19 Dosage 2 x 1000 mg versus 2 x 500 mg (sensitivity analysis), Outcome 29 Infections.

Comparison 19 Dosage 2 x 1000 mg versus 2 x 500 mg (sensitivity analysis), Outcome 30 Serious Infections.
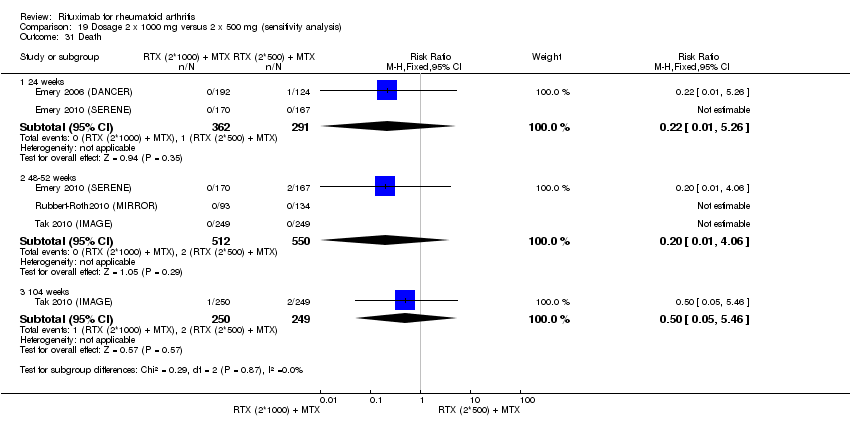
Comparison 19 Dosage 2 x 1000 mg versus 2 x 500 mg (sensitivity analysis), Outcome 31 Death.

Comparison 19 Dosage 2 x 1000 mg versus 2 x 500 mg (sensitivity analysis), Outcome 32 Arthralgia.
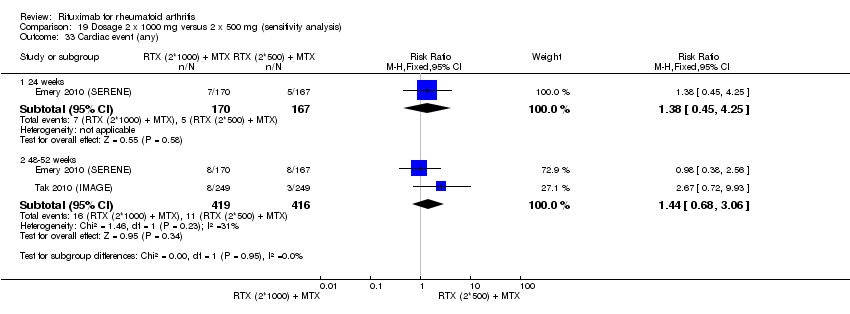
Comparison 19 Dosage 2 x 1000 mg versus 2 x 500 mg (sensitivity analysis), Outcome 33 Cardiac event (any).
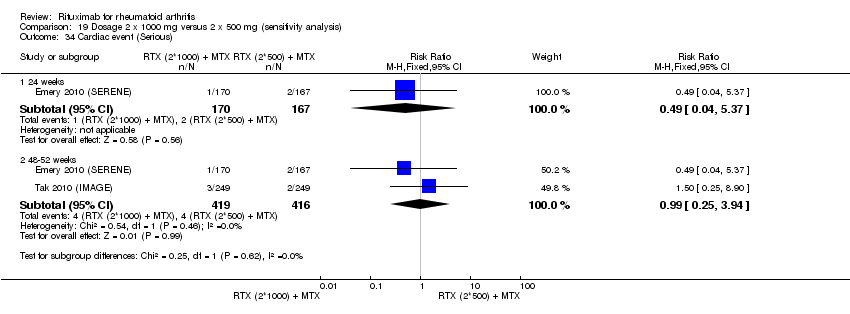
Comparison 19 Dosage 2 x 1000 mg versus 2 x 500 mg (sensitivity analysis), Outcome 34 Cardiac event (Serious).
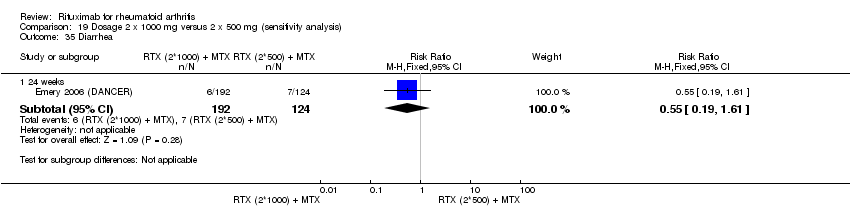
Comparison 19 Dosage 2 x 1000 mg versus 2 x 500 mg (sensitivity analysis), Outcome 35 Diarrhea.

Comparison 19 Dosage 2 x 1000 mg versus 2 x 500 mg (sensitivity analysis), Outcome 36 Exacerbation of RA.

Comparison 19 Dosage 2 x 1000 mg versus 2 x 500 mg (sensitivity analysis), Outcome 37 Fatigue.

Comparison 19 Dosage 2 x 1000 mg versus 2 x 500 mg (sensitivity analysis), Outcome 38 HACA.

Comparison 19 Dosage 2 x 1000 mg versus 2 x 500 mg (sensitivity analysis), Outcome 39 Hypertension.

Comparison 19 Dosage 2 x 1000 mg versus 2 x 500 mg (sensitivity analysis), Outcome 40 Infusion‐related reactions (1st course ‐1st infusion).

Comparison 19 Dosage 2 x 1000 mg versus 2 x 500 mg (sensitivity analysis), Outcome 41 Infusion‐related reaction (1st course ‐2nd infusion).

Comparison 19 Dosage 2 x 1000 mg versus 2 x 500 mg (sensitivity analysis), Outcome 42 Infusion‐related reaction (2nd course).

Comparison 19 Dosage 2 x 1000 mg versus 2 x 500 mg (sensitivity analysis), Outcome 43 Infusion‐related reaction (3rd course).

Comparison 19 Dosage 2 x 1000 mg versus 2 x 500 mg (sensitivity analysis), Outcome 44 Infusion‐related reaction (4th course).
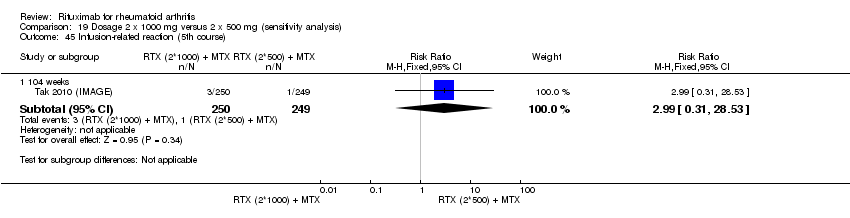
Comparison 19 Dosage 2 x 1000 mg versus 2 x 500 mg (sensitivity analysis), Outcome 45 Infusion‐related reaction (5th course).
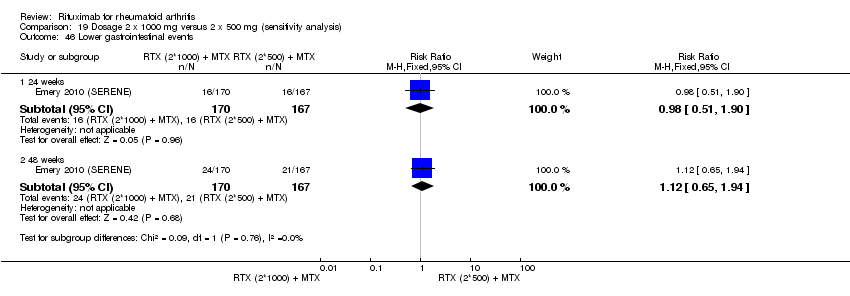
Comparison 19 Dosage 2 x 1000 mg versus 2 x 500 mg (sensitivity analysis), Outcome 46 Lower gastrointestinal events.

Comparison 19 Dosage 2 x 1000 mg versus 2 x 500 mg (sensitivity analysis), Outcome 47 Malignancy.

Comparison 19 Dosage 2 x 1000 mg versus 2 x 500 mg (sensitivity analysis), Outcome 48 Pneumonia.
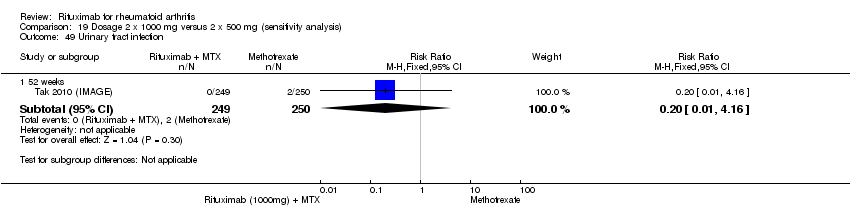
Comparison 19 Dosage 2 x 1000 mg versus 2 x 500 mg (sensitivity analysis), Outcome 49 Urinary tract infection.

Comparison 19 Dosage 2 x 1000 mg versus 2 x 500 mg (sensitivity analysis), Outcome 50 Vascular disorders.

Comparison 20 Concomitant treatment CTX versus MTX (sensitivity analysis), Outcome 1 ACR 20.

Comparison 20 Concomitant treatment CTX versus MTX (sensitivity analysis), Outcome 2 ACR 50.
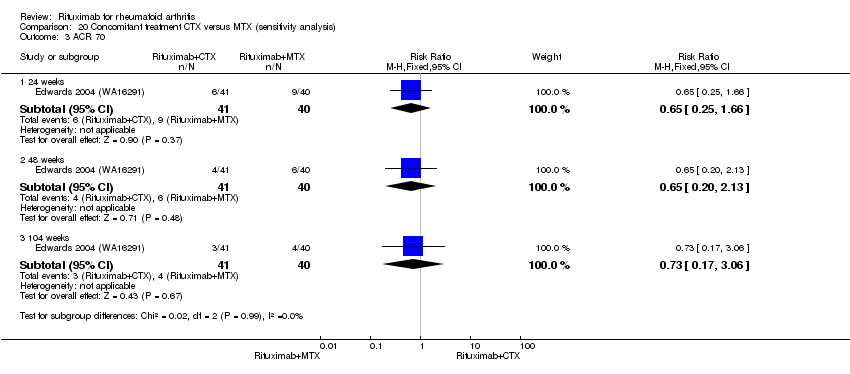
Comparison 20 Concomitant treatment CTX versus MTX (sensitivity analysis), Outcome 3 ACR 70.
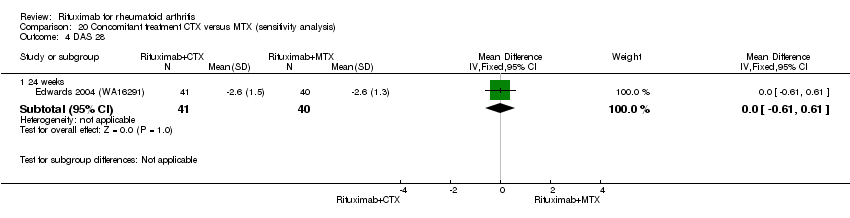
Comparison 20 Concomitant treatment CTX versus MTX (sensitivity analysis), Outcome 4 DAS 28.

Comparison 20 Concomitant treatment CTX versus MTX (sensitivity analysis), Outcome 5 Moderate or good EULAR response.
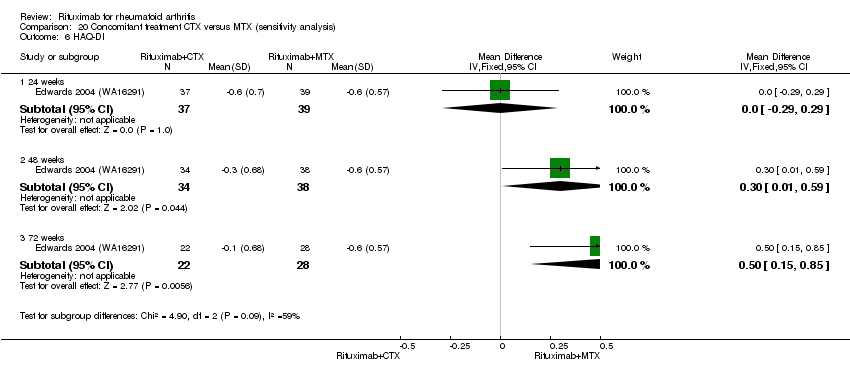
Comparison 20 Concomitant treatment CTX versus MTX (sensitivity analysis), Outcome 6 HAQ‐DI.

Comparison 20 Concomitant treatment CTX versus MTX (sensitivity analysis), Outcome 7 HAQ‐DI MCID=‐0.22.

Comparison 20 Concomitant treatment CTX versus MTX (sensitivity analysis), Outcome 8 Total discontinuations.
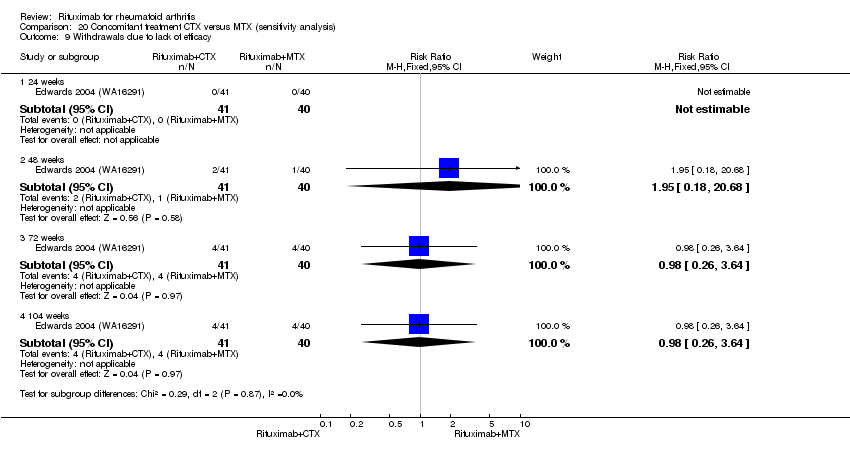
Comparison 20 Concomitant treatment CTX versus MTX (sensitivity analysis), Outcome 9 Withdrawals due to lack of efficacy.
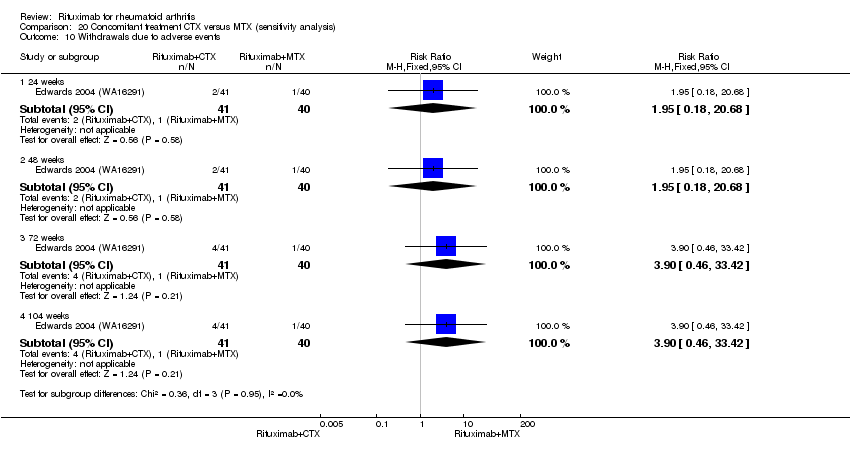
Comparison 20 Concomitant treatment CTX versus MTX (sensitivity analysis), Outcome 10 Withdrawals due to adverse events.

Comparison 20 Concomitant treatment CTX versus MTX (sensitivity analysis), Outcome 11 Withdrawals due to other reasons.
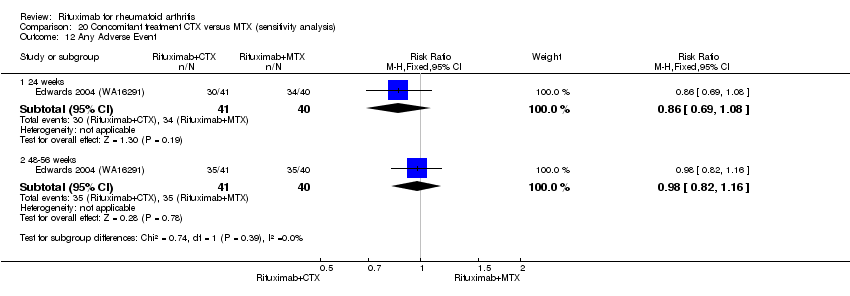
Comparison 20 Concomitant treatment CTX versus MTX (sensitivity analysis), Outcome 12 Any Adverse Event.

Comparison 20 Concomitant treatment CTX versus MTX (sensitivity analysis), Outcome 13 Serious Adverse Events.

Comparison 20 Concomitant treatment CTX versus MTX (sensitivity analysis), Outcome 14 Serious Infections.

Comparison 20 Concomitant treatment CTX versus MTX (sensitivity analysis), Outcome 15 Exacerbation of RA.
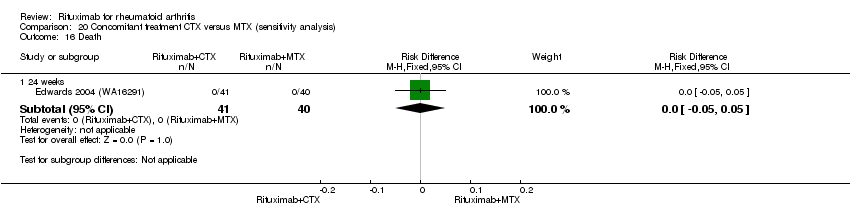
Comparison 20 Concomitant treatment CTX versus MTX (sensitivity analysis), Outcome 16 Death.

Comparison 20 Concomitant treatment CTX versus MTX (sensitivity analysis), Outcome 17 Any Event Associated with 1st Infusion.
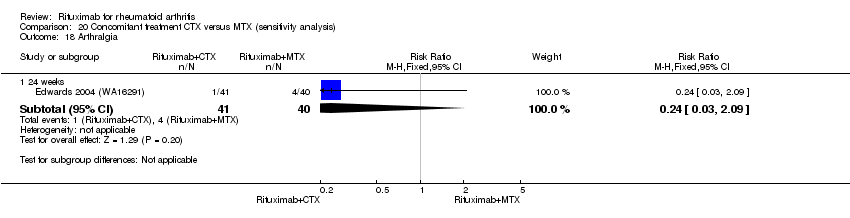
Comparison 20 Concomitant treatment CTX versus MTX (sensitivity analysis), Outcome 18 Arthralgia.

Comparison 20 Concomitant treatment CTX versus MTX (sensitivity analysis), Outcome 19 Back pain.

Comparison 20 Concomitant treatment CTX versus MTX (sensitivity analysis), Outcome 20 Cough.
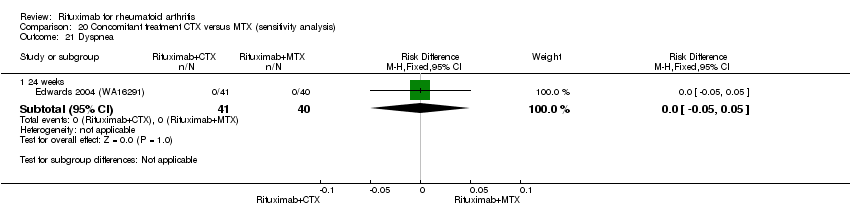
Comparison 20 Concomitant treatment CTX versus MTX (sensitivity analysis), Outcome 21 Dyspnea.

Comparison 20 Concomitant treatment CTX versus MTX (sensitivity analysis), Outcome 22 Hypertension.
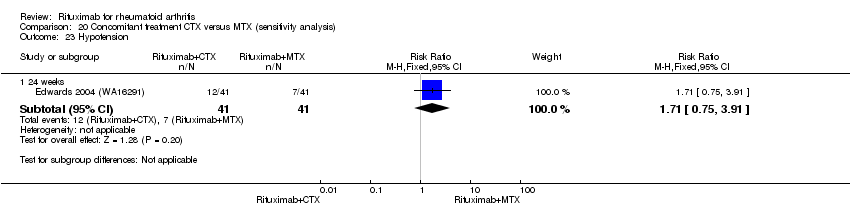
Comparison 20 Concomitant treatment CTX versus MTX (sensitivity analysis), Outcome 23 Hypotension.
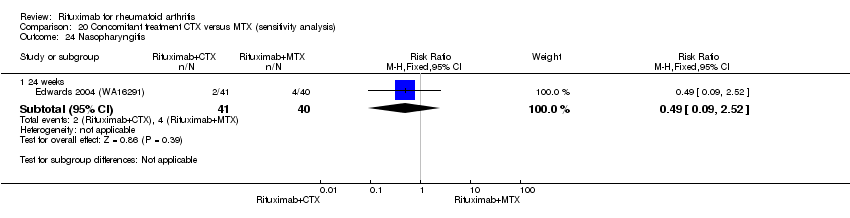
Comparison 20 Concomitant treatment CTX versus MTX (sensitivity analysis), Outcome 24 Nasopharyngitis.

Comparison 20 Concomitant treatment CTX versus MTX (sensitivity analysis), Outcome 25 Nausea.

Comparison 20 Concomitant treatment CTX versus MTX (sensitivity analysis), Outcome 26 Pruritus.

Comparison 20 Concomitant treatment CTX versus MTX (sensitivity analysis), Outcome 27 Rash.

Comparison 21 Concomitant treatment MTX versus none (sensitivity analysis), Outcome 1 ACR 20.
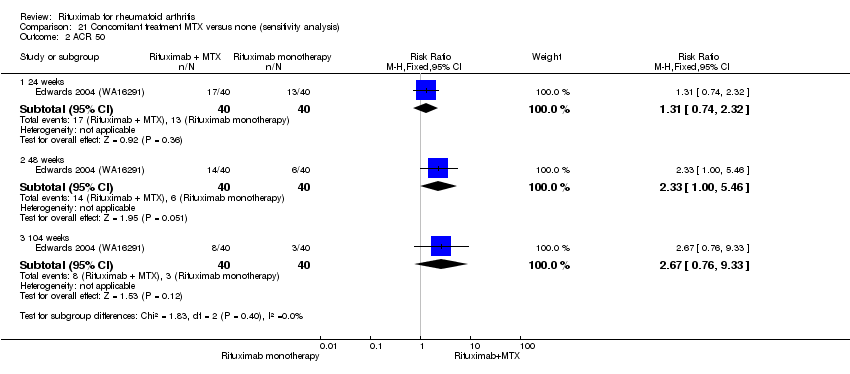
Comparison 21 Concomitant treatment MTX versus none (sensitivity analysis), Outcome 2 ACR 50.

Comparison 21 Concomitant treatment MTX versus none (sensitivity analysis), Outcome 3 ACR 70.

Comparison 21 Concomitant treatment MTX versus none (sensitivity analysis), Outcome 4 DAS 28.
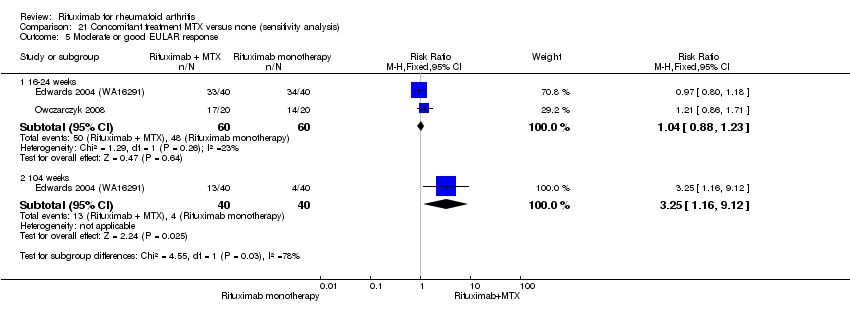
Comparison 21 Concomitant treatment MTX versus none (sensitivity analysis), Outcome 5 Moderate or good EULAR response.

Comparison 21 Concomitant treatment MTX versus none (sensitivity analysis), Outcome 6 HAQ‐DI.

Comparison 21 Concomitant treatment MTX versus none (sensitivity analysis), Outcome 7 HAQ‐DI MCID=‐0.22.

Comparison 21 Concomitant treatment MTX versus none (sensitivity analysis), Outcome 8 Total discontinuations.

Comparison 21 Concomitant treatment MTX versus none (sensitivity analysis), Outcome 9 Withdrawals due to lack of efficacy.
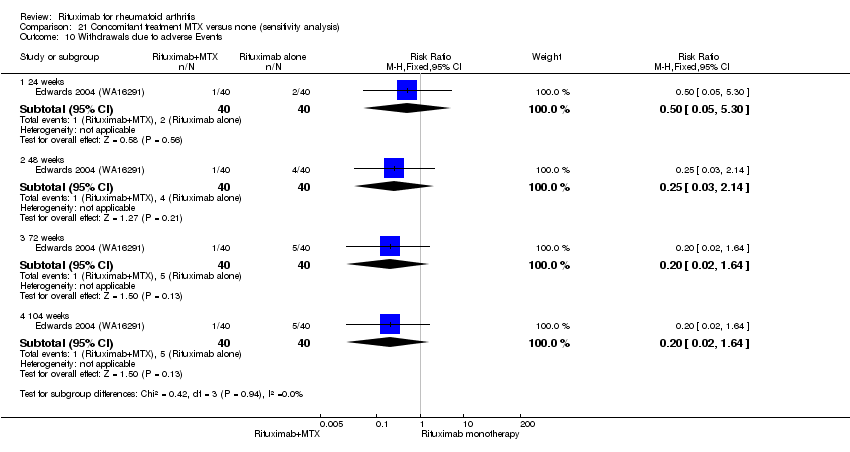
Comparison 21 Concomitant treatment MTX versus none (sensitivity analysis), Outcome 10 Withdrawals due to adverse Events.

Comparison 21 Concomitant treatment MTX versus none (sensitivity analysis), Outcome 11 Withdrawals due to other reasons.
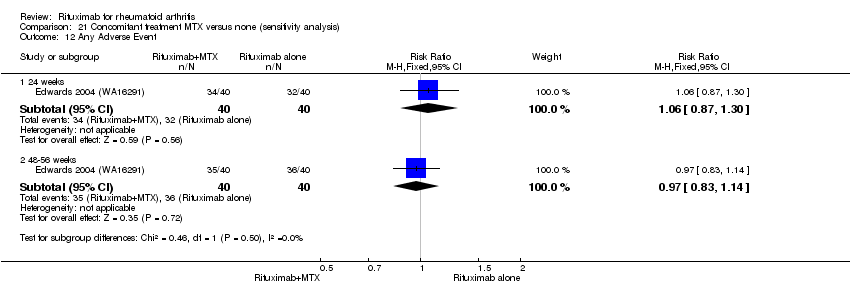
Comparison 21 Concomitant treatment MTX versus none (sensitivity analysis), Outcome 12 Any Adverse Event.
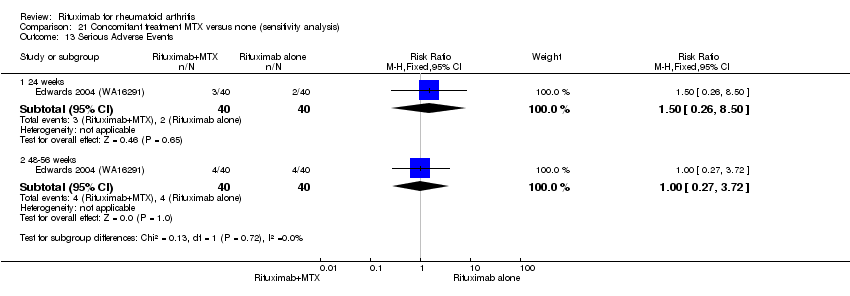
Comparison 21 Concomitant treatment MTX versus none (sensitivity analysis), Outcome 13 Serious Adverse Events.

Comparison 21 Concomitant treatment MTX versus none (sensitivity analysis), Outcome 14 Serious Infections.
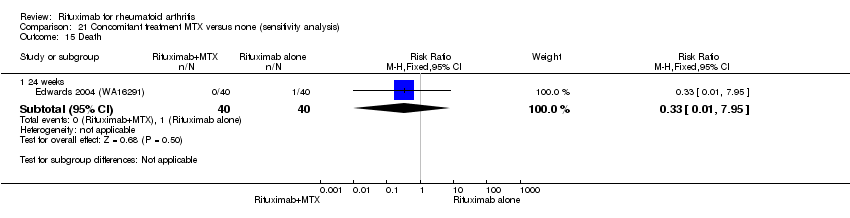
Comparison 21 Concomitant treatment MTX versus none (sensitivity analysis), Outcome 15 Death.

Comparison 21 Concomitant treatment MTX versus none (sensitivity analysis), Outcome 16 Any Event Associated with 1st Infusion.

Comparison 21 Concomitant treatment MTX versus none (sensitivity analysis), Outcome 17 Arthralgia.

Comparison 21 Concomitant treatment MTX versus none (sensitivity analysis), Outcome 18 Back pain.
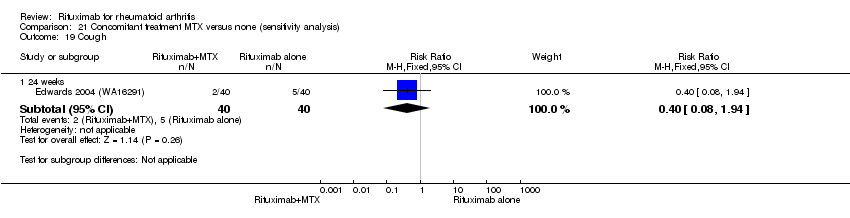
Comparison 21 Concomitant treatment MTX versus none (sensitivity analysis), Outcome 19 Cough.

Comparison 21 Concomitant treatment MTX versus none (sensitivity analysis), Outcome 20 Dyspnea.

Comparison 21 Concomitant treatment MTX versus none (sensitivity analysis), Outcome 21 Exacerbation of RA.
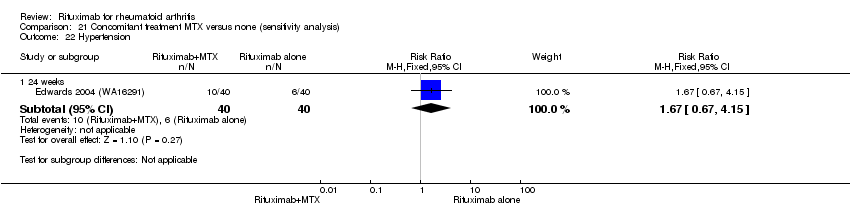
Comparison 21 Concomitant treatment MTX versus none (sensitivity analysis), Outcome 22 Hypertension.
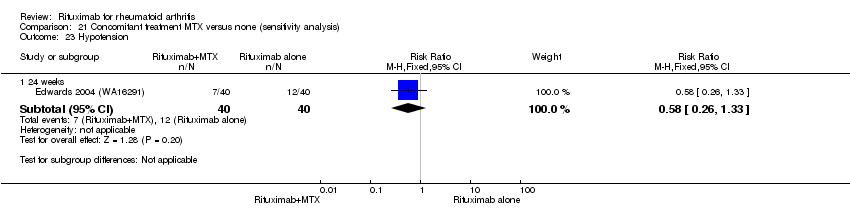
Comparison 21 Concomitant treatment MTX versus none (sensitivity analysis), Outcome 23 Hypotension.

Comparison 21 Concomitant treatment MTX versus none (sensitivity analysis), Outcome 24 Nasopharyngitis.

Comparison 21 Concomitant treatment MTX versus none (sensitivity analysis), Outcome 25 Nausea.

Comparison 21 Concomitant treatment MTX versus none (sensitivity analysis), Outcome 26 Pruritus.
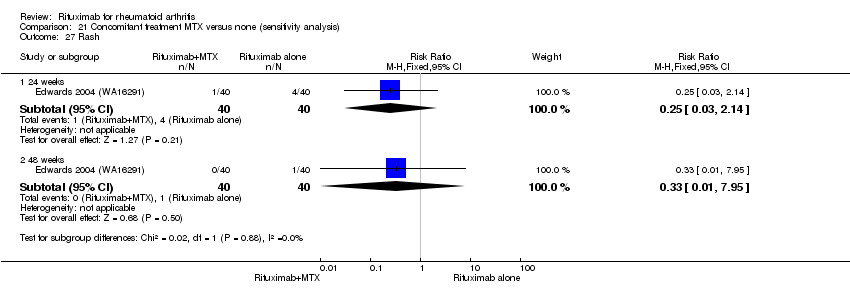
Comparison 21 Concomitant treatment MTX versus none (sensitivity analysis), Outcome 27 Rash.

Comparison 22 Concomitant treatment CTX versus none (sensitivity analysis), Outcome 1 ACR 20.

Comparison 22 Concomitant treatment CTX versus none (sensitivity analysis), Outcome 2 ACR 50.
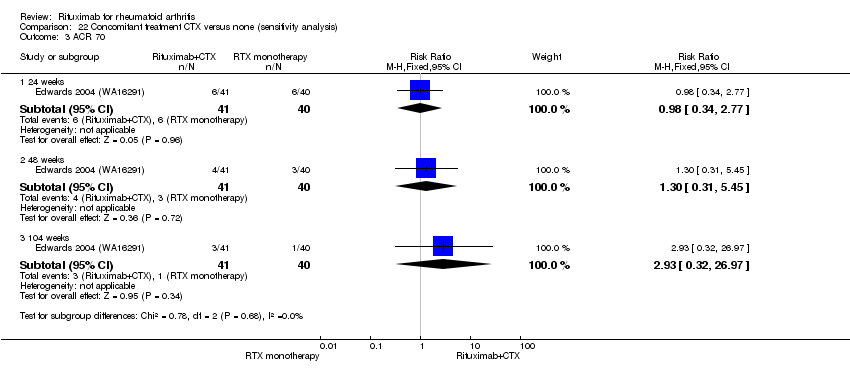
Comparison 22 Concomitant treatment CTX versus none (sensitivity analysis), Outcome 3 ACR 70.

Comparison 22 Concomitant treatment CTX versus none (sensitivity analysis), Outcome 4 DAS 28.

Comparison 22 Concomitant treatment CTX versus none (sensitivity analysis), Outcome 5 Moderate or good EULAR response.

Comparison 22 Concomitant treatment CTX versus none (sensitivity analysis), Outcome 6 HAQ‐DI.
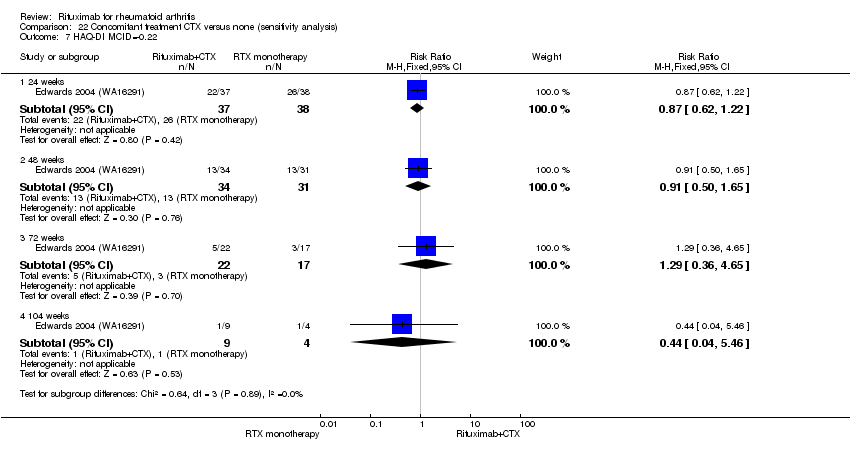
Comparison 22 Concomitant treatment CTX versus none (sensitivity analysis), Outcome 7 HAQ‐DI MCID=‐0.22.

Comparison 22 Concomitant treatment CTX versus none (sensitivity analysis), Outcome 8 Total discontinuations.
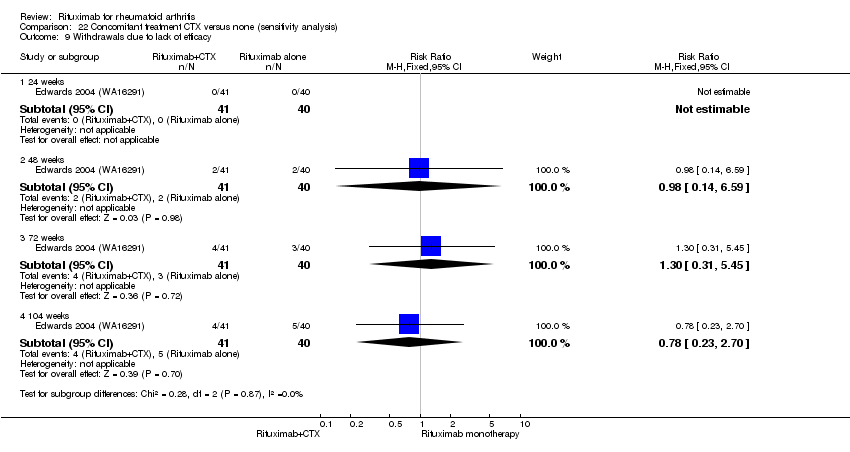
Comparison 22 Concomitant treatment CTX versus none (sensitivity analysis), Outcome 9 Withdrawals due to lack of efficacy.

Comparison 22 Concomitant treatment CTX versus none (sensitivity analysis), Outcome 10 Withdrawals due to adverse Events.

Comparison 22 Concomitant treatment CTX versus none (sensitivity analysis), Outcome 11 Withdrawals due to other reasons.
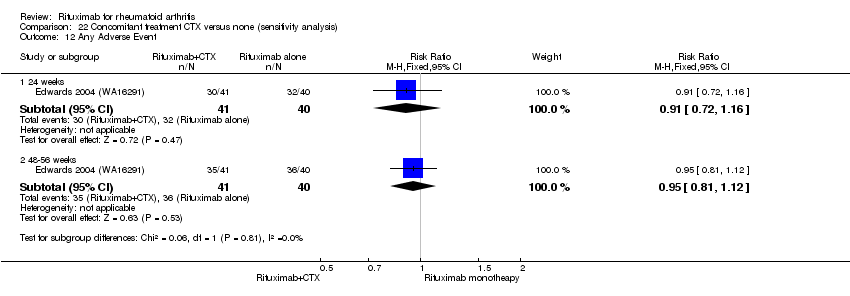
Comparison 22 Concomitant treatment CTX versus none (sensitivity analysis), Outcome 12 Any Adverse Event.
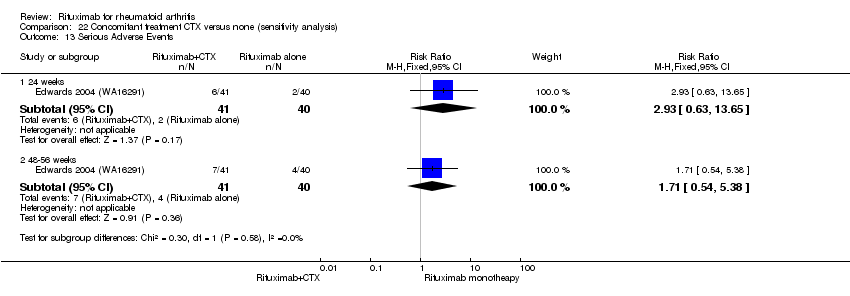
Comparison 22 Concomitant treatment CTX versus none (sensitivity analysis), Outcome 13 Serious Adverse Events.

Comparison 22 Concomitant treatment CTX versus none (sensitivity analysis), Outcome 14 Serious Infections.

Comparison 22 Concomitant treatment CTX versus none (sensitivity analysis), Outcome 15 Death.

Comparison 22 Concomitant treatment CTX versus none (sensitivity analysis), Outcome 16 Any Event Associated with 1st Infusion.
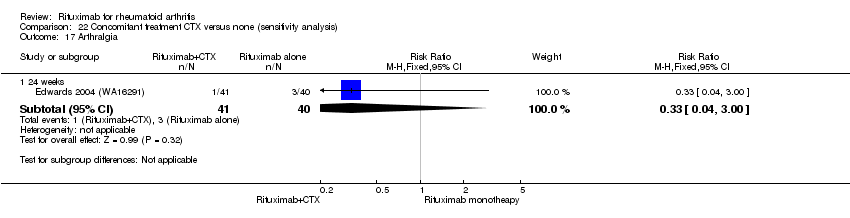
Comparison 22 Concomitant treatment CTX versus none (sensitivity analysis), Outcome 17 Arthralgia.

Comparison 22 Concomitant treatment CTX versus none (sensitivity analysis), Outcome 18 Back pain.

Comparison 22 Concomitant treatment CTX versus none (sensitivity analysis), Outcome 19 Cough.

Comparison 22 Concomitant treatment CTX versus none (sensitivity analysis), Outcome 20 Dyspnea.
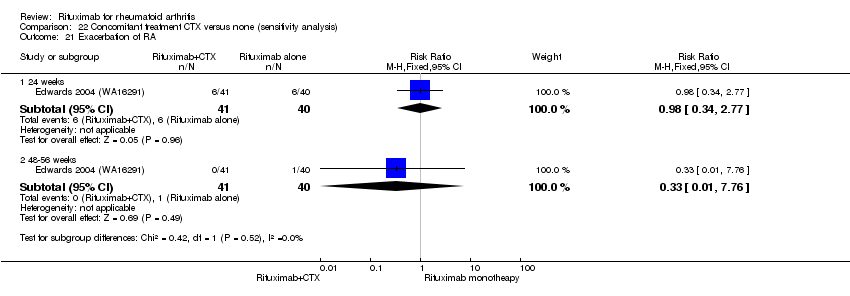
Comparison 22 Concomitant treatment CTX versus none (sensitivity analysis), Outcome 21 Exacerbation of RA.
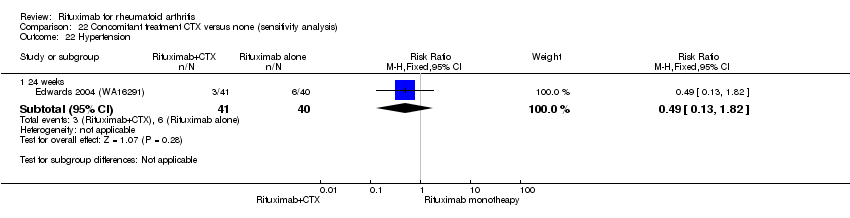
Comparison 22 Concomitant treatment CTX versus none (sensitivity analysis), Outcome 22 Hypertension.

Comparison 22 Concomitant treatment CTX versus none (sensitivity analysis), Outcome 23 Hypotension.

Comparison 22 Concomitant treatment CTX versus none (sensitivity analysis), Outcome 24 Nasopharyngitis.

Comparison 22 Concomitant treatment CTX versus none (sensitivity analysis), Outcome 25 Nausea.
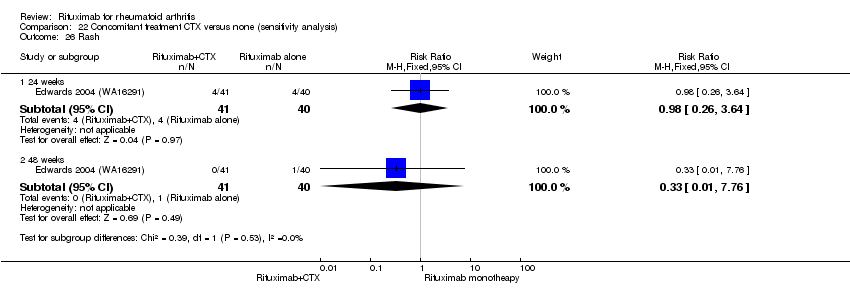
Comparison 22 Concomitant treatment CTX versus none (sensitivity analysis), Outcome 26 Rash.
| Rituximab (2 x 1000 mg) plus methotrexate compared to methotrexate monotherapy for rheumatoid arthritis | ||||||||
| Patient or population: patients with rheumatoid arthritis | ||||||||
| Outcomes | Follow‐up (weeks) | Illustrative comparative risks* (95% CI) | Relative effect | No of participants | Quality of the evidence | Comments | ||
| Assumed risk | Corresponding risk | |||||||
| Methotrexate monotherapy | Rituximab (2 x 1000 mg) plus methotrexate | |||||||
| Clinical improvement American College of Rheumatology 50% improvement criteria | 24 | 88 per 1000 | 286 per 1000 | RR 3.3 | 1165 | ⊕⊕⊕⊝ | Absolute treatment benefit 21% (95% CI 16% to 25%); Relative per cent change 225% (95% CI 131% to 358%); NNTB 6 (95% CI 9 to 4) | |
| 48 to 56 | 331 per 1000 | 742 per 1000 | RR 2.2 | 852 | ⊕⊕⊕⊝ | Absolute treatment benefit 24% (95% CI 18% to 30%); Relative per cent change 124% (95% CI 26% to 295%); NNTB 4 (95% CI 6 to 3) | ||
| 104 | 377 per 1000 | 562 per 1000 | RR 1.5 | 579 | ⊕⊕⊕⊝ | Absolute treatment benefit 17% (95% CI 8% to 27%); Relative per cent change 149% (95% CI 25% to 77%); NNTB 6 (95% CI 11 to 4) | ||
| Clinical remission (Disease Activity Score‐28 joint count < 2.6) (Scale from 2 to 10) | 24 | 11 per 1000 | 99 per 1000 | RR 9.1 | 834 | ⊕⊕⊕⊝ | Not statistically significant. Absolute treatment benefit 8% (95% CI 6% to 11%); Relative per cent change 809% (95% CI ‐24% to 1072%); NNTB N/A | |
| 48 to 52 | 112 per 1000 | 221 per 1000 | RR 2.4 | 772 | ⊕⊕⊕⊝ | Absolute treatment benefit 11% (95% CI 2% to 20%); Relative per cent change 142% (95% CI 70% to 246%); NNTB 7 (95% 13 CI to 4) | ||
| 104 | 129 per 1000 | 320 per 1000 | RR 2.5 | 499 | ⊕⊕⊕⊝ | Absolute treatment benefit 19% (95% CI 12% to 26%); Relative per cent change 149% (95% CI 72% to 261%); NNTB 6 (95% 11 CI to 3) | ||
| Physical function (HAQ‐DI MCID = ‐0.22) | 24 | 387 per 1000 | 623 per 1000 | RR 1.6 | 1161 | ⊕⊕⊕⊕ | Absolute treatment benefit 24% (95% CI 12% to 36%); Relative per cent change 61% (95% CI 22% to 112%); NNTB 5 (95% CI 13 to 3) | |
| 48 to 56 | 726 per 1000 | 1000 per 1000 | RR 1.6 | 562 | ⊕⊕⊕⊕ | Absolute treatment benefit 24% (95% CI ‐5% to 52%); Relative per cent change 57% (95% CI ‐29% to 244%); NNTB N/A | ||
| 72 | 200 per 1000 | 464 per 1000 | RR 2.3 | 43 | ⊕⊕⊕⊕ | Absolute treatment benefit 26% (95% CI ‐1% to 54%); Relative per cent change 132% (95% CI ‐22% to 589%); NNTB N/A | ||
| 104 | 608 per 1000 | 845 per 1000 | RR 1.4 | 523 | ⊕⊕⊕⊕ | Absolute treatment benefit 24% (95% CI 16% to 31%); Relative per cent change 39% (95% CI 25% to 55%); NNTB 5 (95% CI 7 to 3) | ||
| No radiographic progression in total Genant‐modified Sharp score (range 0 to 290) | 24 | 591 per 1000 | 697 per 1000 | RR 1.2 | 476 | ⊕⊕⊕⊝ | Absolute treatment benefit 11% (95% CI 2% to 19%); Relative per cent change 18% (95%CI 3% to 35%); NNTB 10 (95% CI 57 to 5) | |
| 56 | 500 per 1000 | 625 per 1000 | RR 1.3 | 940 | ⊕⊕⊕⊝ | Absolute treatment benefit 12% (95% CI 6% to 19%); Relative per cent change 25% (95%CI 11% to 40%); NNTB 8 (95% CI 19 to 5) | ||
| 104 | 379 per 1000 | 568 per 1000 | RR 1.5 | 945 | ⊕⊕⊕⊝ | Absolute treatment benefit 19% (95% CI 13% to 25%); Relative per cent change 50% (95%CI 30% to 73%); NNTB 6 (95% CI 9 to 4) | ||
| Health‐related quality of life | SF‐36 PCS MCID = ‐5 or 5.42 | 24 to 52 | 355 per 1000 | 697 per 1000 (405 to 1000) | RR 2.0 (1.1 to 3.4) | 1,526 (4 studies) | ⊕⊕⊕⊕ | Absolute treatment benefit 34% (95% CI 5% to 84%); Relative percent change 96% (95%CI 14% to 226%); NNTB 4 (95% CI 8 to 3) |
| SF‐36 MCS MCID = ‐5 or 6.33 | 24 to 52 | 345 per 1000 | 475 per 1000 (352 to 638) | RR 1.4 (1.1 to 1.9) | 1282 (3 studies) | ⊕⊕⊕⊕ | Absolute treatment benefit 13% (95% CI 7% to 18%); Relative per cent change 43% (95% CI 6% to 92%); NNTB 8 (95% CI 19 to 5) | |
| Discontinuations due to adverse events | 24 | 10 per 1000 | 21 per 1000 | RR 2.1 | 1385 | ⊕⊕⊕⊝ | Not statistically significant; Absolute risk difference 1% (95% CI 0% to 3%); Relative per cent change 107% (95% CI ‐12% to 388%); NNTH N/A | |
| 48‐52 | 24 per 1000 | 24 per 1000 | RR 1.0 | 927 | ⊕⊕⊕⊕ | Not statistically significant; Absolute risk difference 0% (95% CI ‐2% to 2%); Relative per cent change 0% (95% CI ‐56% to 129%); NNTH N/A | ||
| 72 | 75 per 1000 | 25 per 1000 | RR 0.33 | 80 | ⊕⊕⊕⊝ | Not statistically significant; Absolute risk difference ‐5% (95% CI ‐14% to 4%); Relative per cent change ‐67% (95% CI ‐96% to 207%); NNTH N/A | ||
| 104 | 55 per 1000 | 31 per 1000 | RR 0.56 | 579 | ⊕⊕⊕⊕ | Not statistically significant; Absolute risk difference ‐2% (95% CI ‐6% to 1%); Relative per cent change ‐44% (95% CI ‐45% to 25%); NNTH N/A | ||
| Serious adverse events | 24 | 75 per 1000 | 75 per 1000 | RR 1 | 1280 | ⊕⊕⊕⊝ | Not statistically significant; Absolute risk difference 0% (95% CI ‐3% to 3%); Relative per cent change 0% (95% CI ‐32% to 45%); NNTH N/A | |
| 48 to 56 | 103 per 1000 | 97 per 1000 | RR 0.94 | 579 | ⊕⊕⊕⊕ | Not statistically significant; Absolute risk difference ‐1% (95% CI ‐6% to 4%); Relative per cent change ‐6% (95% CI ‐43% to 53%); NNTH N/A | ||
| 104 | 169 per 1000 | 132 per 1000 | RR 0.78 | 499 | ⊕⊕⊕⊝ | Not statistically significant; Absolute risk difference ‐4% (95% CI ‐10% to 3%); Relative per cent change ‐22% (95% CI ‐49% to 19%); NNTH N/A | ||
| *The basis for the assumed risk (e.g. the median control group risk across studies) is provided in footnotes. The corresponding risk (and its 95% confidence interval) is based on the assumed risk in the comparison group and the relative effect of the intervention (and its 95% CI). | ||||||||
| GRADE Working Group grades of evidence | ||||||||
| 1 Only one study was graded as having low risk of bias | ||||||||
| Study | Arms | n | Age, mean + SD* | Females, % | Disease duration, mean years | Rheumatoid factor, mean IU/litre | Previous DMARDs, mean no | Prior anti‐TNFα treatment, % | MTX dose, mean mg/week |
| Cohen 2006 (REFLEX) | PBO + MTX | 209 | 52.8 ± 12.6 | 81 | 11.7 ± 7.7 | 317.4 ± 870.2 | 2.4 ± 1.8 | 90† | 16.7 ± 9.9 |
| RTX 2 (100 mg courses) + MTX | 308 | 52.2 ± 12.2 | 81 | 12.1 ± 8.3 | 324.3 ± 613.5 | 2.6 ± 1.8 | 92† | 16.4 ± 8.8 | |
| Edwards 2004 (WA16291) | PBO + MTX | 40 | 54 ± 11 | 80 | 11 ± 7 | ‐ | 2.6 ± 1.3 | ‐ | 12.5 to 15‡ |
| RTX 2 (100 mg courses) + MTX | 40 | 53 ± 10 | 75 | 12 ± 7 | ‐ | 2.5 ± 1.4 | ‐ | 12.5 to 15‡ | |
| RTX 2 (100 mg courses) | 40 | 54 ± 10 | 73 | 9 ± 6 | ‐ | 2.5 ± 1.6 | ‐ | 12.5 to 15‡ | |
| RTX 2 (100 mg courses) + CTX | 41 | 54 ± 12 | 83 | 10 ± 6 | ‐ | 2.6 ± 1.4 | ‐ | 12.5 to 15‡ | |
| Emery 2006 (DANCER) | PBO + MTX | 149 | 51.1 | 80 | 9.3 | 437 | 2.2 | 26 | 15.6 |
| RTX 2 (500 mg courses) + MTX | 124 | 51.4 | 83 | 11.1 | 421 | 2.5 | 33 | 16 | |
| RTX 2 (100 mg courses) + MTX | 192 | 51.1 | 80 | 10.8 | 437 | 2.5 | 28 | 14.9 | |
| Emery 2010 (SERENE) | PBO + MTX | 172 | 52.2 ± 12.4 | 85.5 | 7.5 ± 7.6 | 75.0% positive | 1.1 ± 1.1c | ‐ | 16.6 ± 4.3 |
| RTX 2 (500 mg courses) + MTX | 167 | 51.9 ± 12.9 | 79.6 | 7.1 ± 7.0 | 75.4% positive | 1.2 ± 1.3c | ‐ | 15.4 ± 4.0 | |
| RTX 2 (1000 mg courses) + MTX | 170 | 51.3 ± 12.6 | 81.2 | 6.6 ± 7.3 | 73.5% positive | 1.1 ± 1.1c | ‐ | 16.1 ± 4.3 | |
| Greenwald 2011 (TAME) | MTX + TNFi | 18 | 50.4 | 94 | 10.7 ± 7.5 | 178.6 ± 242.8 | ‐ | 100 | 17.5 ± 4.2 |
| RTX 2 (500 mg courses) + MTX + TNFi | 32 | 49.7 | 85 | 10.3 ± 6.7 | 341.9 ± 521.0 | ‐ | 97 | 16.1 ± 4.2 | |
| Owczarczyk 2008 | RTX | 20 | 55 ± 9 | ‐ | 12 ± 8 | 329 ± 724 | ‐ | 1.47 ± 1.17 | ‐ |
| RTX + MTX | 20 | 53 ± 12 | ‐ | 9 ± 9.6 | 479 ± 574 | ‐ | 0.45 ± 0.75 | ‐ | |
| Rubbert‐Roth 2010 (MIRROR) | RTX (500 mg courses) + MTX | 134 | 53.6 ± 12.8 | 82.1 | 9 + 7.4 | 235.5 ± 4.16 | 2.0 ± 1.5 | 27.6 | 15.2 ± 4.7 |
| RTX 2 (1000mg courses) + MTX | 93 | 51.3 ± 12.2 | 82.8 | 7.7 + 7.4 | 232.4 ± 366.1 | 1.8 ± 1.4 | 24.6 | 15.2 ± 4.7 | |
| Tak 2010 (IMAGE) | PBO + MTX | 249 | 48.1 ± 12.7 | 77 | 0.91 (1.1) | 87% positive | 70% DMARD‐naive | ‐ | ‐ |
| RTX 2 (500 mg courses) + MTX | 249 | 47.9 ± 13.4 | 82 | 0.99 (1.1) | 87% positive | 72% DMARD‐naive | ‐ | ‐ | |
| RTX 2 (1000 mg courses) + MTX | 250 | 47.9 ± 13.3 | 85 | 0.92 (1.3) | 85% positive | 69% DMARD‐naive | ‐ | ‐ | |
| *when reported †Inadequate efficacy of anti‐TNF agents (%) ‡ Median dose per week aPatients were followed 36 weeks in the group receiving rituximab plus MTX and 12 weeks in the group receiving MTX monotherapy bAn upper age limit of 65 years was used because of known attenuation of vaccine response in older patients cExcludes MTX DMARD = Disease Modifying Anti‐Rheumatic Drug; mg = milligrams; MTX = methotrexate; PBO = placebo; RTX = rituximab. | |||||||||
| Outcome or subgroup title | No. of studies | No. of participants | Statistical method | Effect size |
| 1 ACR20 Show forest plot | 5 | Risk Ratio (M‐H, Random, 95% CI) | Subtotals only | |
| 1.1 24 weeks | 4 | 1165 | Risk Ratio (M‐H, Random, 95% CI) | 2.24 [1.86, 2.69] |
| 1.2 48‐52 weeks | 4 | 852 | Risk Ratio (M‐H, Random, 95% CI) | 1.53 [1.09, 2.13] |
| 1.3 104 weeks | 2 | 579 | Risk Ratio (M‐H, Random, 95% CI) | 1.57 [0.82, 3.01] |
| 2 ACR 50 Show forest plot | 5 | Risk Ratio (M‐H, Random, 95% CI) | Subtotals only | |
| 2.1 24 weeks | 4 | 1165 | Risk Ratio (M‐H, Random, 95% CI) | 3.25 [2.31, 4.58] |
| 2.2 48‐56 weeks | 4 | 852 | Risk Ratio (M‐H, Random, 95% CI) | 2.24 [1.26, 3.95] |
| 2.3 104 weeks | 2 | 579 | Risk Ratio (M‐H, Random, 95% CI) | 1.49 [1.25, 1.77] |
| 3 ACR 70 Show forest plot | 5 | Risk Ratio (M‐H, Random, 95% CI) | Subtotals only | |
| 3.1 24 weeks | 4 | 1165 | Risk Ratio (M‐H, Random, 95% CI) | 3.91 [1.84, 8.31] |
| 3.2 48‐56 weeks | 4 | 852 | Risk Ratio (M‐H, Random, 95% CI) | 1.95 [1.53, 2.49] |
| 3.3 104 weeks | 2 | 579 | Risk Ratio (M‐H, Random, 95% CI) | 1.84 [1.44, 2.37] |
| 4 ACR 90 Show forest plot | 1 | Risk Ratio (M‐H, Fixed, 95% CI) | Subtotals only | |
| 4.1 52 weeks | 1 | 499 | Risk Ratio (M‐H, Fixed, 95% CI) | 1.81 [1.11, 2.96] |
| 4.2 104 weeks | 1 | 499 | Risk Ratio (M‐H, Fixed, 95% CI) | 1.81 [1.22, 2.68] |
| 5 DAS 28 Show forest plot | 5 | Mean Difference (IV, Random, 95% CI) | Subtotals only | |
| 5.1 24 weeks | 5 | 1661 | Mean Difference (IV, Random, 95% CI) | ‐1.20 [‐1.48, ‐0.92] |
| 5.2 48‐56 weeks | 1 | 499 | Mean Difference (IV, Random, 95% CI) | ‐1.15 [‐1.37, ‐0.93] |
| 5.3 104 weeks | 1 | 499 | Mean Difference (IV, Random, 95% CI) | ‐1.59 [‐1.81, ‐1.37] |
| 6 LDA (DAS28 =or<3.2) Show forest plot | 4 | Risk Ratio (M‐H, Random, 95% CI) | Subtotals only | |
| 6.1 24 weeks | 2 | 834 | Risk Ratio (M‐H, Random, 95% CI) | 4.23 [1.42, 12.56] |
| 6.2 48‐52 weeks | 3 | 772 | Risk Ratio (M‐H, Random, 95% CI) | 2.09 [1.60, 2.73] |
| 6.3 104 weeks | 1 | 499 | Risk Ratio (M‐H, Random, 95% CI) | 1.93 [1.50, 2.48] |
| 7 Clinical Remission (DAS28<2.6) Show forest plot | 4 | Risk Difference (M‐H, Random, 95% CI) | Subtotals only | |
| 7.1 24 weeks | 2 | 834 | Risk Difference (M‐H, Random, 95% CI) | 0.08 [0.06, 0.11] |
| 7.2 48‐52 weeks | 3 | 772 | Risk Difference (M‐H, Random, 95% CI) | 0.11 [0.02, 0.20] |
| 7.3 104 weeks | 1 | 499 | Risk Difference (M‐H, Random, 95% CI) | 0.19 [0.12, 0.26] |
| 8 Moderate or good EULAR response Show forest plot | 5 | Risk Ratio (M‐H, Random, 95% CI) | Subtotals only | |
| 8.1 24 weeks | 5 | 1664 | Risk Ratio (M‐H, Random, 95% CI) | 1.94 [1.55, 2.43] |
| 8.2 48 weeks | 1 | 499 | Risk Ratio (M‐H, Random, 95% CI) | 2.32 [1.72, 3.14] |
| 8.3 104 weeks | 2 | 579 | Risk Ratio (M‐H, Random, 95% CI) | 2.05 [1.59, 2.64] |
| 9 HAQ‐DI Show forest plot | 4 | Mean Difference (IV, Fixed, 95% CI) | Subtotals only | |
| 9.1 24 weeks | 4 | 1318 | Mean Difference (IV, Fixed, 95% CI) | ‐0.24 [‐0.30, ‐0.18] |
| 9.2 48‐52 weeks | 2 | 562 | Mean Difference (IV, Fixed, 95% CI) | ‐0.29 [‐0.38, ‐0.20] |
| 9.3 72 weeks | 1 | 43 | Mean Difference (IV, Fixed, 95% CI) | ‐0.3 [‐0.64, 0.04] |
| 9.4 104 weeks | 1 | 499 | Mean Difference (IV, Fixed, 95% CI) | ‐0.44 [‐0.54, ‐0.34] |
| 10 HAQ‐DI MCID=‐0.22 Show forest plot | 5 | Risk Ratio (M‐H, Random, 95% CI) | Subtotals only | |
| 10.1 24 weeks | 4 | 1161 | Risk Ratio (M‐H, Random, 95% CI) | 1.61 [1.22, 2.12] |
| 10.2 48‐56 weeks | 2 | 562 | Risk Ratio (M‐H, Random, 95% CI) | 1.57 [0.71, 3.44] |
| 10.3 72 weeks | 1 | 43 | Risk Ratio (M‐H, Random, 95% CI) | 2.32 [0.78, 6.89] |
| 10.4 104 weeks | 2 | 523 | Risk Ratio (M‐H, Random, 95% CI) | 1.39 [1.25, 1.55] |
| 11 SF‐36 PCS Show forest plot | 4 | 1393 | Mean Difference (IV, Fixed, 95% CI) | ‐4.11 [‐4.98, ‐3.25] |
| 11.1 24 weeks | 3 | 912 | Mean Difference (IV, Fixed, 95% CI) | ‐4.44 [‐5.52, ‐3.36] |
| 11.2 52 weeks | 1 | 481 | Mean Difference (IV, Fixed, 95% CI) | ‐3.53 [‐4.97, ‐2.09] |
| 12 SF‐36 PCS (=or>MCID of 5 or 5.42) Show forest plot | 4 | 1526 | Risk Ratio (M‐H, Random, 95% CI) | 1.96 [1.14, 3.36] |
| 12.1 24 weeks | 3 | 1045 | Risk Ratio (M‐H, Random, 95% CI) | 2.32 [1.41, 3.84] |
| 12.2 52 weeks | 1 | 481 | Risk Ratio (M‐H, Random, 95% CI) | 1.21 [1.07, 1.36] |
| 13 SF‐36 MCS Show forest plot | 4 | 1393 | Mean Difference (IV, Fixed, 95% CI) | ‐2.22 [‐3.52, ‐0.92] |
| 13.1 24 weeks | 3 | 912 | Mean Difference (IV, Fixed, 95% CI) | ‐2.44 [‐4.05, ‐0.82] |
| 13.2 52 weeks | 1 | 481 | Mean Difference (IV, Fixed, 95% CI) | ‐1.81 [‐4.02, 0.39] |
| 14 SF‐36 MCS (=or>MCID of 5 or 6.33) Show forest plot | 3 | 1282 | Odds Ratio (M‐H, Random, 95% CI) | 1.75 [1.27, 2.42] |
| 14.1 24 weeks | 2 | 801 | Odds Ratio (M‐H, Random, 95% CI) | 2.07 [1.50, 2.84] |
| 14.2 52 weeks | 1 | 481 | Odds Ratio (M‐H, Random, 95% CI) | 1.38 [0.97, 1.98] |
| 15 FACIT‐F Show forest plot | 4 | 1570 | Mean Difference (IV, Random, 95% CI) | ‐5.22 [‐7.71, ‐2.74] |
| 15.1 24 weeks | 3 | 1081 | Mean Difference (IV, Random, 95% CI) | ‐5.84 [‐8.81, ‐2.88] |
| 15.2 52 weeks | 1 | 489 | Mean Difference (IV, Random, 95% CI) | ‐3.45 [‐5.33, ‐1.57] |
| 16 FACIT‐F MCID>= 4or 3.56 Show forest plot | 3 | 1232 | Risk Ratio (M‐H, Random, 95% CI) | 1.59 [1.00, 2.53] |
| 16.1 24 weeks | 2 | 743 | Risk Ratio (M‐H, Random, 95% CI) | 1.95 [1.65, 2.30] |
| 16.2 52 weeks | 1 | 489 | Risk Ratio (M‐H, Random, 95% CI) | 1.11 [0.99, 1.24] |
| 17 VAS‐pain Show forest plot | 3 | 1238 | Mean Difference (IV, Random, 95% CI) | ‐13.89 [‐21.31, ‐6.48] |
| 17.1 24 weeks | 2 | 743 | Mean Difference (IV, Random, 95% CI) | ‐14.57 [‐27.37, ‐1.77] |
| 17.2 52 weeks | 1 | 495 | Mean Difference (IV, Random, 95% CI) | ‐12.2 [‐16.87, ‐7.53] |
| 18 Total radiographic score Show forest plot | 2 | Mean Difference (IV, Fixed, 95% CI) | Subtotals only | |
| 18.1 24 weeks | 2 | 975 | Mean Difference (IV, Fixed, 95% CI) | ‐0.48 [‐0.83, ‐0.13] |
| 18.2 48‐56 weeks | 2 | 932 | Mean Difference (IV, Fixed, 95% CI) | ‐0.87 [‐1.29, ‐0.45] |
| 18.3 104 weeks | 2 | 945 | Mean Difference (IV, Fixed, 95% CI) | ‐1.57 [‐1.99, ‐1.16] |
| 19 Joint Space Narrowing Show forest plot | 2 | Mean Difference (IV, Fixed, 95% CI) | Subtotals only | |
| 19.1 24 weeks | 2 | 975 | Mean Difference (IV, Fixed, 95% CI) | ‐0.20 [‐0.35, ‐0.04] |
| 19.2 48‐56 weeks | 1 | 456 | Mean Difference (IV, Fixed, 95% CI) | ‐0.58 [‐0.98, ‐0.18] |
| 19.3 104 weeks | 2 | 944 | Mean Difference (IV, Fixed, 95% CI) | ‐0.48 [‐0.67, ‐0.29] |
| 20 Radiologic erosions Show forest plot | 2 | Mean Difference (IV, Fixed, 95% CI) | Subtotals only | |
| 20.1 24 weeks | 2 | 975 | Mean Difference (IV, Fixed, 95% CI) | ‐0.33 [‐0.55, ‐0.11] |
| 20.2 48‐56 weeks | 2 | 932 | Mean Difference (IV, Fixed, 95% CI) | ‐0.56 [‐0.83, ‐0.30] |
| 20.3 104 weeks | 2 | 945 | Mean Difference (IV, Fixed, 95% CI) | ‐1.09 [‐1.35, ‐0.83] |
| 21 No radiographic progression Show forest plot | 2 | Risk Ratio (M‐H, Fixed, 95% CI) | Subtotals only | |
| 21.1 24 weeks | 1 | 476 | Risk Ratio (M‐H, Fixed, 95% CI) | 1.18 [1.03, 1.35] |
| 21.2 52‐56 weeks | 2 | 940 | Risk Ratio (M‐H, Fixed, 95% CI) | 1.25 [1.11, 1.40] |
| 21.3 104 weeks | 2 | 945 | Risk Ratio (M‐H, Fixed, 95% CI) | 1.50 [1.30, 1.73] |
| 22 No worsening of erosions Show forest plot | 2 | Risk Ratio (M‐H, Fixed, 95% CI) | Subtotals only | |
| 22.1 24 weeks | 1 | 445 | Risk Ratio (M‐H, Fixed, 95% CI) | 1.10 [0.95, 1.27] |
| 22.2 52‐56 weeks | 1 | 464 | Risk Ratio (M‐H, Fixed, 95% CI) | 1.29 [1.09, 1.52] |
| 22.3 104 weeks | 2 | 945 | Risk Ratio (M‐H, Fixed, 95% CI) | 1.45 [1.27, 1.67] |
| Outcome or subgroup title | No. of studies | No. of participants | Statistical method | Effect size |
| 1 ACR 20 Show forest plot | 1 | Risk Ratio (M‐H, Fixed, 95% CI) | Totals not selected | |
| 1.1 24 weeks | 1 | Risk Ratio (M‐H, Fixed, 95% CI) | 0.0 [0.0, 0.0] | |
| 1.2 48 weeks | 1 | Risk Ratio (M‐H, Fixed, 95% CI) | 0.0 [0.0, 0.0] | |
| 1.3 104 weeks | 1 | Risk Ratio (M‐H, Fixed, 95% CI) | 0.0 [0.0, 0.0] | |
| 2 ACR 50 Show forest plot | 1 | Risk Ratio (M‐H, Fixed, 95% CI) | Totals not selected | |
| 2.1 24 weeks | 1 | Risk Ratio (M‐H, Fixed, 95% CI) | 0.0 [0.0, 0.0] | |
| 2.2 48‐56 weeks | 1 | Risk Ratio (M‐H, Fixed, 95% CI) | 0.0 [0.0, 0.0] | |
| 2.3 104 weeks | 1 | Risk Ratio (M‐H, Fixed, 95% CI) | 0.0 [0.0, 0.0] | |
| 3 ACR 70 Show forest plot | 1 | Risk Ratio (M‐H, Fixed, 95% CI) | Totals not selected | |
| 3.1 24 weeks | 1 | Risk Ratio (M‐H, Fixed, 95% CI) | 0.0 [0.0, 0.0] | |
| 3.2 48‐56 weeks | 1 | Risk Ratio (M‐H, Fixed, 95% CI) | 0.0 [0.0, 0.0] | |
| 3.3 104 weeks | 1 | Risk Ratio (M‐H, Fixed, 95% CI) | 0.0 [0.0, 0.0] | |
| 4 DAS 28 Show forest plot | 1 | Mean Difference (IV, Fixed, 95% CI) | Subtotals only | |
| 4.1 24 weeks | 1 | 80 | Mean Difference (IV, Fixed, 95% CI) | ‐0.9 [‐1.47, ‐0.33] |
| 5 Moderate or good EULAR response Show forest plot | 1 | Risk Ratio (M‐H, Fixed, 95% CI) | Subtotals only | |
| 5.1 24 weeks | 1 | 80 | Risk Ratio (M‐H, Fixed, 95% CI) | 1.7 [1.21, 2.38] |
| 6 HAQ‐DI Show forest plot | 1 | Mean Difference (IV, Fixed, 95% CI) | Subtotals only | |
| 6.1 24 weeks | 1 | 75 | Mean Difference (IV, Fixed, 95% CI) | ‐0.4 [‐0.65, ‐0.15] |
| 6.2 48 weeks | 1 | 56 | Mean Difference (IV, Fixed, 95% CI) | ‐0.20 [‐0.49, 0.09] |
| 6.3 72 weeks | 1 | 32 | Mean Difference (IV, Fixed, 95% CI) | ‐0.3 [‐0.68, 0.08] |
| 7 % of patients achieving HAQ‐DI MCID=‐0.25 Show forest plot | 1 | Risk Ratio (M‐H, Fixed, 95% CI) | Subtotals only | |
| 7.1 24 weeks | 1 | 75 | Risk Ratio (M‐H, Fixed, 95% CI) | 1.49 [0.99, 2.25] |
| 7.2 48‐56 weeks | 1 | 56 | Risk Ratio (M‐H, Fixed, 95% CI) | 1.50 [0.71, 3.18] |
| 7.3 72 weeks | 1 | 32 | Risk Ratio (M‐H, Fixed, 95% CI) | 0.88 [0.21, 3.73] |
| 7.4 104 weeks | 1 | 10 | Risk Ratio (M‐H, Fixed, 95% CI) | 1.50 [0.13, 17.67] |
| Outcome or subgroup title | No. of studies | No. of participants | Statistical method | Effect size |
| 1 ACR 20 Show forest plot | 3 | Risk Difference (M‐H, Fixed, 95% CI) | Subtotals only | |
| 1.1 24 weeks | 2 | 584 | Risk Difference (M‐H, Fixed, 95% CI) | 0.30 [0.22, 0.37] |
| 1.2 48‐52 weeks | 2 | 598 | Risk Difference (M‐H, Fixed, 95% CI) | 0.14 [0.07, 0.21] |
| 1.3 104 weeks | 1 | 498 | Risk Difference (M‐H, Fixed, 95% CI) | 0.16 [0.08, 0.25] |
| 2 ACR 50 Show forest plot | 3 | Risk Ratio (M‐H, Fixed, 95% CI) | Subtotals only | |
| 2.1 24 weeks | 2 | 584 | Risk Ratio (M‐H, Fixed, 95% CI) | 2.69 [1.85, 3.90] |
| 2.2 48‐52 weeks | 2 | 598 | Risk Ratio (M‐H, Fixed, 95% CI) | 1.47 [1.23, 1.74] |
| 2.3 104 weeks | 1 | 498 | Risk Ratio (M‐H, Fixed, 95% CI) | 1.42 [1.19, 1.69] |
| 3 ACR 70 Show forest plot | 3 | Risk Ratio (M‐H, Random, 95% CI) | Subtotals only | |
| 3.1 24 weeks | 2 | 584 | Risk Ratio (M‐H, Random, 95% CI) | 2.07 [1.14, 3.77] |
| 3.2 48‐52 weeks | 2 | 598 | Risk Ratio (M‐H, Random, 95% CI) | 1.42 [0.71, 2.86] |
| 3.3 104 weeks | 1 | 498 | Risk Ratio (M‐H, Random, 95% CI) | 1.69 [1.31, 2.20] |
| 4 ACR 90 Show forest plot | 1 | Risk Ratio (M‐H, Fixed, 95% CI) | Totals not selected | |
| 4.1 52 weeks | 1 | Risk Ratio (M‐H, Fixed, 95% CI) | 0.0 [0.0, 0.0] | |
| 4.2 104 weeks | 1 | Risk Ratio (M‐H, Fixed, 95% CI) | 0.0 [0.0, 0.0] | |
| 5 DAS 28 Show forest plot | 3 | Mean Difference (IV, Fixed, 95% CI) | Subtotals only | |
| 5.1 24 weeks | 3 | 1079 | Mean Difference (IV, Fixed, 95% CI) | ‐0.96 [‐1.11, ‐0.81] |
| 5.2 52 weeks | 1 | 498 | Mean Difference (IV, Fixed, 95% CI) | ‐0.99 [‐1.21, ‐0.77] |
| 5.3 104 weeks | 1 | 498 | Mean Difference (IV, Fixed, 95% CI) | ‐1.59 [‐1.81, ‐1.37] |
| 6 LDA (DAS28 =or<3.2) Show forest plot | 3 | Risk Ratio (M‐H, Fixed, 95% CI) | Subtotals only | |
| 6.1 24 weeks | 1 | 339 | Risk Ratio (M‐H, Fixed, 95% CI) | 3.73 [1.76, 7.93] |
| 6.2 48‐52 weeks | 2 | 598 | Risk Ratio (M‐H, Fixed, 95% CI) | 1.94 [1.48, 2.56] |
| 6.3 104 weeks | 1 | 498 | Risk Ratio (M‐H, Fixed, 95% CI) | 1.81 [1.40, 2.33] |
| 7 Clinical Remission (DAS28<2.6) Show forest plot | 3 | Risk Ratio (M‐H, Fixed, 95% CI) | Subtotals only | |
| 7.1 24 weeks | 1 | 498 | Risk Ratio (M‐H, Fixed, 95% CI) | 4.0 [1.36, 11.80] |
| 7.2 48 weeks | 2 | 598 | Risk Ratio (M‐H, Fixed, 95% CI) | 2.03 [1.40, 2.96] |
| 7.3 104 weeks | 1 | 498 | Risk Ratio (M‐H, Fixed, 95% CI) | 2.66 [1.84, 3.83] |
| 8 Moderate or good EULAR response Show forest plot | 3 | Risk Ratio (M‐H, Fixed, 95% CI) | Subtotals only | |
| 8.1 24 weeks | 3 | 1082 | Risk Ratio (M‐H, Fixed, 95% CI) | 1.85 [1.58, 2.17] |
| 8.2 52 weeks | 1 | 498 | Risk Ratio (M‐H, Fixed, 95% CI) | 2.11 [1.56, 2.86] |
| 8.3 104 weeks | 1 | 498 | Risk Ratio (M‐H, Fixed, 95% CI) | 1.93 [1.48, 2.52] |
| 9 HAQ‐DI Show forest plot | 2 | Mean Difference (IV, Fixed, 95% CI) | Subtotals only | |
| 9.1 24 weeks | 2 | 742 | Mean Difference (IV, Fixed, 95% CI) | ‐0.22 [‐0.30, ‐0.14] |
| 9.2 52 weeks | 1 | 498 | Mean Difference (IV, Fixed, 95% CI) | ‐0.28 [‐0.37, ‐0.18] |
| 9.3 104 weeks | 1 | 498 | Mean Difference (IV, Fixed, 95% CI) | ‐0.34 [‐0.44, ‐0.24] |
| 10 HAQ‐DI MCID=‐0.22 Show forest plot | 3 | Risk Ratio (M‐H, Random, 95% CI) | Subtotals only | |
| 10.1 24 weeks | 2 | 582 | Risk Ratio (M‐H, Random, 95% CI) | 1.58 [1.18, 2.11] |
| 10.2 52 weeks | 1 | 498 | Risk Ratio (M‐H, Random, 95% CI) | 1.13 [1.04, 1.22] |
| 10.3 104 weeks | 1 | 498 | Risk Ratio (M‐H, Random, 95% CI) | 1.36 [1.21, 1.52] |
| 11 SF‐36 PCS Show forest plot | 3 | 1018 | Mean Difference (IV, Fixed, 95% CI) | ‐3.52 [‐4.49, ‐2.56] |
| 11.1 24 weeks | 2 | 543 | Mean Difference (IV, Fixed, 95% CI) | ‐4.07 [‐5.36, ‐2.78] |
| 11.2 52 weeks | 1 | 475 | Mean Difference (IV, Fixed, 95% CI) | ‐2.84 [‐4.29, ‐1.39] |
| 12 SF‐36 PCS (=or>MCID of 5 or 5.42) Show forest plot | 3 | 1018 | Risk Ratio (M‐H, Random, 95% CI) | 1.53 [0.98, 2.39] |
| 12.1 24 weeks | 2 | 543 | Risk Ratio (M‐H, Random, 95% CI) | 1.84 [1.21, 2.80] |
| 12.2 52 weeks | 1 | 475 | Risk Ratio (M‐H, Random, 95% CI) | 1.11 [0.97, 1.26] |
| 13 SF‐36 MCS Show forest plot | 3 | 1021 | Mean Difference (IV, Fixed, 95% CI) | ‐1.81 [‐3.25, ‐0.36] |
| 13.1 24 weeks | 2 | 546 | Mean Difference (IV, Fixed, 95% CI) | ‐2.16 [‐4.07, ‐0.25] |
| 13.2 52 weeks | 1 | 475 | Mean Difference (IV, Fixed, 95% CI) | ‐1.33 [‐3.55, 0.88] |
| 14 SF‐36 MCS (=or>MCID of 6.33) Show forest plot | 2 | 774 | Risk Ratio (M‐H, Random, 95% CI) | 1.16 [0.87, 1.55] |
| 14.1 24 weeks | 1 | 299 | Risk Ratio (M‐H, Random, 95% CI) | 1.41 [0.98, 2.03] |
| 14.2 52 weeks | 1 | 475 | Risk Ratio (M‐H, Random, 95% CI) | 1.04 [0.87, 1.24] |
| 15 FACIT‐F Show forest plot | 3 | 1063 | Mean Difference (IV, Fixed, 95% CI) | ‐3.09 [‐4.35, ‐1.83] |
| 15.1 24 weeks | 2 | 580 | Mean Difference (IV, Fixed, 95% CI) | ‐3.54 [‐5.23, ‐1.85] |
| 15.2 52 weeks | 1 | 483 | Mean Difference (IV, Fixed, 95% CI) | ‐2.53 [‐4.42, ‐0.64] |
| 16 FACIT‐F (= or > MCID of 3.5 or 4) Show forest plot | 1 | Risk Ratio (M‐H, Fixed, 95% CI) | Subtotals only | |
| 16.1 24 weeks | 1 | 245 | Risk Ratio (M‐H, Fixed, 95% CI) | 1.57 [1.18, 2.09] |
| 17 VAS pain Show forest plot | 2 | 739 | Mean Difference (IV, Fixed, 95% CI) | ‐8.30 [‐12.25, ‐4.35] |
| 17.1 24 weeks | 1 | 245 | Mean Difference (IV, Fixed, 95% CI) | ‐8.1 [‐14.96, ‐1.24] |
| 17.2 52 weeks | 1 | 494 | Mean Difference (IV, Fixed, 95% CI) | ‐8.40 [‐13.23, ‐3.57] |
| 18 Total radiographic score Show forest plot | 1 | Mean Difference (IV, Fixed, 95% CI) | Subtotals only | |
| 18.1 24 weeks | 1 | 471 | Mean Difference (IV, Fixed, 95% CI) | ‐0.12 [‐0.61, 0.37] |
| 18.2 52 weeks | 1 | 471 | Mean Difference (IV, Fixed, 95% CI) | ‐0.43 [‐0.92, 0.06] |
| 18.3 104 weeks | 1 | 472 | Mean Difference (IV, Fixed, 95% CI) | ‐1.19 [‐1.68, ‐0.70] |
| 19 Joint Space Narrowing Show forest plot | 1 | Mean Difference (IV, Fixed, 95% CI) | Subtotals only | |
| 19.1 104 weeks | 1 | 472 | Mean Difference (IV, Fixed, 95% CI) | ‐0.37 [‐0.59, ‐0.15] |
| 20 Radiologic erosions Show forest plot | 1 | Mean Difference (IV, Fixed, 95% CI) | Subtotals only | |
| 20.1 52 weeks | 1 | 471 | Mean Difference (IV, Fixed, 95% CI) | ‐0.29 [‐0.59, 0.02] |
| 20.2 104 weeks | 1 | 472 | Mean Difference (IV, Fixed, 95% CI) | ‐0.82 [‐1.13, ‐0.51] |
| 21 No radiographic progression Show forest plot | 1 | Risk Ratio (M‐H, Fixed, 95% CI) | Subtotals only | |
| 21.1 24 weeks | 1 | 472 | Risk Ratio (M‐H, Fixed, 95% CI) | 1.33 [1.07, 1.64] |
| 22 No increase in erosion score Show forest plot | 1 | Risk Ratio (M‐H, Fixed, 95% CI) | Subtotals only | |
| 22.1 24 weeks | 1 | 472 | Risk Ratio (M‐H, Fixed, 95% CI) | 1.39 [1.14, 1.70] |
| Outcome or subgroup title | No. of studies | No. of participants | Statistical method | Effect size |
| 1 ACR 20 Show forest plot | 1 | Risk Ratio (M‐H, Fixed, 95% CI) | Subtotals only | |
| 1.1 24 weeks | 1 | 81 | Risk Ratio (M‐H, Fixed, 95% CI) | 2.02 [1.30, 3.12] |
| 1.2 48 weeks | 1 | 81 | Risk Ratio (M‐H, Fixed, 95% CI) | 2.44 [1.22, 4.89] |
| 1.3 104 weeks | 1 | 81 | Risk Ratio (M‐H, Fixed, 95% CI) | 0.98 [0.31, 3.11] |
| 2 ACR 50 Show forest plot | 1 | Risk Ratio (M‐H, Fixed, 95% CI) | Subtotals only | |
| 2.1 24 weeks | 1 | 81 | Risk Ratio (M‐H, Fixed, 95% CI) | 3.32 [1.35, 8.13] |
| 2.2 48 weeks | 1 | 81 | Risk Ratio (M‐H, Fixed, 95% CI) | 4.88 [1.14, 20.89] |
| 2.3 104 weeks | 1 | 81 | Risk Ratio (M‐H, Fixed, 95% CI) | 0.98 [0.26, 3.64] |
| 3 ACR 70 Show forest plot | 1 | Risk Ratio (M‐H, Fixed, 95% CI) | Subtotals only | |
| 3.1 24 weeks | 1 | 81 | Risk Ratio (M‐H, Fixed, 95% CI) | 2.93 [0.63, 13.65] |
| 3.2 48 weeks | 1 | 81 | Risk Ratio (M‐H, Fixed, 95% CI) | 8.79 [0.49, 158.07] |
| 3.3 104 weeks | 1 | 81 | Risk Ratio (M‐H, Fixed, 95% CI) | 0.98 [0.21, 4.55] |
| 4 DAS 28 Show forest plot | 1 | Mean Difference (IV, Fixed, 95% CI) | Subtotals only | |
| 4.1 24 weeks | 1 | 81 | Mean Difference (IV, Fixed, 95% CI) | ‐1.3 [‐1.89, ‐0.71] |
| 5 Moderate or good EULAR response Show forest plot | 1 | Risk Ratio (M‐H, Fixed, 95% CI) | Subtotals only | |
| 5.1 24 weeks | 1 | 81 | Risk Ratio (M‐H, Fixed, 95% CI) | 1.71 [1.22, 2.39] |
| 6 HAQ‐DI Show forest plot | 1 | Mean Difference (IV, Fixed, 95% CI) | Subtotals only | |
| 6.1 24 weeks | 1 | 74 | Mean Difference (IV, Fixed, 95% CI) | ‐0.20 [‐0.48, 0.08] |
| 6.2 48 weeks | 1 | 59 | Mean Difference (IV, Fixed, 95% CI) | 0.0 [‐0.31, 0.31] |
| 6.3 72 weeks | 1 | 37 | Mean Difference (IV, Fixed, 95% CI) | 0.20 [‐0.19, 0.59] |
| 7 HAQ‐DI MCID=‐0.22 Show forest plot | 1 | Risk Ratio (M‐H, Fixed, 95% CI) | Subtotals only | |
| 7.1 24 weeks | 1 | 74 | Risk Ratio (M‐H, Fixed, 95% CI) | 1.29 [0.83, 2.01] |
| 7.2 48‐56 weeks | 1 | 59 | Risk Ratio (M‐H, Fixed, 95% CI) | 1.37 [0.64, 2.92] |
| 7.3 72 weeks | 1 | 37 | Risk Ratio (M‐H, Fixed, 95% CI) | 1.14 [0.32, 4.05] |
| 7.4 104 weeks | 1 | 15 | Risk Ratio (M‐H, Fixed, 95% CI) | 0.67 [0.05, 8.73] |
| Outcome or subgroup title | No. of studies | No. of participants | Statistical method | Effect size |
| 1 ACR 20 Show forest plot | 1 | Risk Ratio (M‐H, Fixed, 95% CI) | Subtotals only | |
| 1.1 24 weeks | 1 | 51 | Risk Ratio (M‐H, Fixed, 95% CI) | 1.82 [0.57, 5.77] |
| 2 ACR 50 Show forest plot | 1 | Risk Ratio (M‐H, Fixed, 95% CI) | Subtotals only | |
| 2.1 24 weeks | 1 | 45 | Risk Ratio (M‐H, Fixed, 95% CI) | 1.45 [0.18, 11.75] |
| 3 LDA (DAS28 =or<3.2) Show forest plot | 1 | Risk Ratio (M‐H, Fixed, 95% CI) | Subtotals only | |
| 3.1 24 weeks | 1 | 51 | Risk Ratio (M‐H, Fixed, 95% CI) | 2.18 [0.52, 9.20] |
| 4 Clinical Remission (DAS28<2.6) Show forest plot | 1 | Risk Ratio (M‐H, Fixed, 95% CI) | Subtotals only | |
| 4.1 24 weeks | 1 | 51 | Risk Ratio (M‐H, Fixed, 95% CI) | 3.27 [0.43, 25.11] |
| 5 HAQ‐DI MCID=‐0.25 Show forest plot | 1 | Risk Ratio (M‐H, Fixed, 95% CI) | Subtotals only | |
| 5.1 24 weeks | 1 | 51 | Risk Ratio (M‐H, Fixed, 95% CI) | 3.82 [1.59, 9.17] |
| Outcome or subgroup title | No. of studies | No. of participants | Statistical method | Effect size |
| 1 Total discontinuations Show forest plot | 5 | Risk Ratio (M‐H, Random, 95% CI) | Subtotals only | |
| 1.1 24 weeks | 4 | 1282 | Risk Ratio (M‐H, Random, 95% CI) | 0.40 [0.32, 0.50] |
| 1.2 48‐52 weeks | 4 | 1444 | Risk Ratio (M‐H, Random, 95% CI) | 0.61 [0.40, 0.91] |
| 1.3 72 weeks | 1 | 80 | Risk Ratio (M‐H, Random, 95% CI) | 0.48 [0.28, 0.82] |
| 1.4 104 weeks | 2 | 579 | Risk Ratio (M‐H, Random, 95% CI) | 0.58 [0.45, 0.75] |
| 2 Lack of efficacy Show forest plot | 5 | Risk Ratio (M‐H, Fixed, 95% CI) | Subtotals only | |
| 2.1 24 weeks | 4 | 1282 | Risk Ratio (M‐H, Fixed, 95% CI) | 0.30 [0.23, 0.39] |
| 2.2 48‐52 weeks | 3 | 927 | Risk Ratio (M‐H, Fixed, 95% CI) | 0.15 [0.06, 0.36] |
| 2.3 72 weeks | 1 | 80 | Risk Ratio (M‐H, Fixed, 95% CI) | 0.44 [0.15, 1.33] |
| 2.4 104 weeks | 1 | 80 | Risk Ratio (M‐H, Fixed, 95% CI) | 0.24 [0.09, 0.64] |
| 3 Adverse Events Show forest plot | 5 | Risk Ratio (M‐H, Fixed, 95% CI) | Subtotals only | |
| 3.1 24 weeks | 4 | 1282 | Risk Ratio (M‐H, Fixed, 95% CI) | 2.72 [1.04, 7.13] |
| 3.2 48‐52 weeks | 3 | 927 | Risk Ratio (M‐H, Fixed, 95% CI) | 1.00 [0.44, 2.29] |
| 3.3 72 weeks | 1 | 80 | Risk Ratio (M‐H, Fixed, 95% CI) | 0.33 [0.04, 3.07] |
| 3.4 104 weeks | 2 | 579 | Risk Ratio (M‐H, Fixed, 95% CI) | 0.56 [0.25, 1.25] |
| 4 Other reasons Show forest plot | 5 | Risk Ratio (M‐H, Fixed, 95% CI) | Subtotals only | |
| 4.1 24 weeks | 4 | 1282 | Risk Ratio (M‐H, Fixed, 95% CI) | 0.76 [0.32, 1.81] |
| 4.2 48‐52 weeks | 3 | 927 | Risk Ratio (M‐H, Fixed, 95% CI) | 0.84 [0.47, 1.49] |
| 4.3 72 weeks | 1 | 80 | Risk Ratio (M‐H, Fixed, 95% CI) | 0.54 [0.24, 1.21] |
| 4.4 104 weeks | 1 | 80 | Risk Ratio (M‐H, Fixed, 95% CI) | 1.31 [0.74, 2.32] |
| Outcome or subgroup title | No. of studies | No. of participants | Statistical method | Effect size |
| 1 Total discontinuations Show forest plot | 1 | Risk Ratio (M‐H, Fixed, 95% CI) | Subtotals only | |
| 1.1 24 weeks | 1 | 80 | Risk Ratio (M‐H, Fixed, 95% CI) | 0.67 [0.12, 3.78] |
| 1.2 48 weeks | 1 | 80 | Risk Ratio (M‐H, Fixed, 95% CI) | 0.6 [0.30, 1.21] |
| 1.3 72 weeks | 1 | 80 | Risk Ratio (M‐H, Fixed, 95% CI) | 0.92 [0.64, 1.32] |
| 1.4 104 weeks | 1 | 80 | Risk Ratio (M‐H, Fixed, 95% CI) | 1.06 [0.90, 1.25] |
| 2 Lack of efficacy Show forest plot | 1 | Risk Ratio (M‐H, Fixed, 95% CI) | Subtotals only | |
| 2.1 24 weeks | 1 | 80 | Risk Ratio (M‐H, Fixed, 95% CI) | 0.2 [0.01, 4.04] |
| 2.2 48 weeks | 1 | 80 | Risk Ratio (M‐H, Fixed, 95% CI) | 0.29 [0.06, 1.29] |
| 2.3 72 weeks | 1 | 80 | Risk Ratio (M‐H, Fixed, 95% CI) | 0.33 [0.10, 1.14] |
| 2.4 104 weeks | 1 | 80 | Risk Ratio (M‐H, Fixed, 95% CI) | 0.29 [0.12, 0.72] |
| 3 Adverse Events Show forest plot | 1 | Risk Ratio (M‐H, Fixed, 95% CI) | Subtotals only | |
| 3.1 24 weeks | 1 | 80 | Risk Ratio (M‐H, Fixed, 95% CI) | 2.0 [0.19, 21.18] |
| 3.2 48 weeks | 1 | 80 | Risk Ratio (M‐H, Fixed, 95% CI) | 1.33 [0.32, 5.58] |
| 3.3 72 weeks | 1 | 80 | Risk Ratio (M‐H, Fixed, 95% CI) | 1.67 [0.43, 6.51] |
| 3.4 104 weeks | 1 | 80 | Risk Ratio (M‐H, Fixed, 95% CI) | 1.25 [0.36, 4.32] |
| 4 Other reasons Show forest plot | 1 | Risk Ratio (M‐H, Fixed, 95% CI) | Subtotals only | |
| 4.1 24 weeks | 1 | 80 | Risk Ratio (M‐H, Fixed, 95% CI) | 0.0 [0.0, 0.0] |
| 4.2 48 weeks | 1 | 80 | Risk Ratio (M‐H, Fixed, 95% CI) | 0.6 [0.15, 2.34] |
| 4.3 72 weeks | 1 | 80 | Risk Ratio (M‐H, Fixed, 95% CI) | 1.15 [0.63, 2.10] |
| 4.4 104 weeks | 1 | 80 | Risk Ratio (M‐H, Fixed, 95% CI) | 2.0 [1.21, 3.30] |
| Outcome or subgroup title | No. of studies | No. of participants | Statistical method | Effect size |
| 1 Total discontinuations Show forest plot | 3 | Risk Ratio (M‐H, Fixed, 95% CI) | Subtotals only | |
| 1.1 24 weeks | 2 | 613 | Risk Ratio (M‐H, Fixed, 95% CI) | 0.30 [0.18, 0.50] |
| 1.2 48‐52 weeks | 2 | 844 | Risk Ratio (M‐H, Fixed, 95% CI) | 0.64 [0.43, 0.94] |
| 1.3 104 weeks | 1 | 498 | Risk Ratio (M‐H, Fixed, 95% CI) | 0.51 [0.36, 0.73] |
| 2 Lack of efficacy Show forest plot | 3 | Risk Ratio (M‐H, Fixed, 95% CI) | Subtotals only | |
| 2.1 24 weeks | 2 | 613 | Risk Ratio (M‐H, Fixed, 95% CI) | 0.20 [0.10, 0.39] |
| 2.2 48‐52 weeks | 2 | 844 | Risk Ratio (M‐H, Fixed, 95% CI) | 0.37 [0.19, 0.73] |
| 3 Adverse Events Show forest plot | 3 | Risk Ratio (M‐H, Fixed, 95% CI) | Subtotals only | |
| 3.1 24 weeks | 2 | 613 | Risk Ratio (M‐H, Fixed, 95% CI) | 2.40 [0.56, 10.36] |
| 3.2 48‐52 weeks | 2 | 844 | Risk Ratio (M‐H, Fixed, 95% CI) | 0.76 [0.27, 2.16] |
| 3.3 104 weeks | 1 | 498 | Risk Ratio (M‐H, Fixed, 95% CI) | 0.83 [0.37, 1.89] |
| 4 Other reasons Show forest plot | 3 | Risk Ratio (M‐H, Random, 95% CI) | Subtotals only | |
| 4.1 24 weeks | 2 | 613 | Risk Ratio (M‐H, Random, 95% CI) | 0.37 [0.05, 2.99] |
| 4.2 48‐52 weeks | 2 | 844 | Risk Ratio (M‐H, Random, 95% CI) | 1.00 [0.54, 1.87] |
| Outcome or subgroup title | No. of studies | No. of participants | Statistical method | Effect size |
| 1 Total discontinuations Show forest plot | 1 | Risk Ratio (M‐H, Fixed, 95% CI) | Subtotals only | |
| 1.1 24 weeks | 1 | 81 | Risk Ratio (M‐H, Fixed, 95% CI) | 1.30 [0.31, 5.45] |
| 1.2 48 weeks | 1 | 81 | Risk Ratio (M‐H, Fixed, 95% CI) | 0.46 [0.21, 1.00] |
| 1.3 72 weeks | 1 | 81 | Risk Ratio (M‐H, Fixed, 95% CI) | 0.74 [0.49, 1.11] |
| 1.4 104 weeks | 1 | 81 | Risk Ratio (M‐H, Fixed, 95% CI) | 0.92 [0.75, 1.13] |
| 2 Lack of efficacy Show forest plot | 1 | Risk Ratio (M‐H, Fixed, 95% CI) | Subtotals only | |
| 2.1 24 weeks | 1 | 81 | Risk Ratio (M‐H, Fixed, 95% CI) | 0.20 [0.01, 3.94] |
| 2.2 48 weeks | 1 | 81 | Risk Ratio (M‐H, Fixed, 95% CI) | 0.28 [0.06, 1.26] |
| 2.3 72 weeks | 1 | 81 | Risk Ratio (M‐H, Fixed, 95% CI) | 0.43 [0.15, 1.30] |
| 2.4 104 weeks | 1 | 81 | Risk Ratio (M‐H, Fixed, 95% CI) | 0.23 [0.08, 0.62] |
| 3 Adverse Events Show forest plot | 1 | Risk Ratio (M‐H, Fixed, 95% CI) | Subtotals only | |
| 3.1 24 weeks | 1 | 81 | Risk Ratio (M‐H, Fixed, 95% CI) | 1.95 [0.18, 20.68] |
| 3.2 48 weeks | 1 | 81 | Risk Ratio (M‐H, Fixed, 95% CI) | 0.65 [0.11, 3.69] |
| 3.3 72 weeks | 1 | 81 | Risk Ratio (M‐H, Fixed, 95% CI) | 1.30 [0.31, 5.45] |
| 3.4 104 weeks | 1 | 81 | Risk Ratio (M‐H, Fixed, 95% CI) | 0.98 [0.26, 3.64] |
| 4 Other reasons Show forest plot | 1 | Risk Ratio (M‐H, Fixed, 95% CI) | Subtotals only | |
| 4.1 24 weeks | 1 | 81 | Risk Ratio (M‐H, Fixed, 95% CI) | 4.88 [0.24, 98.60] |
| 4.2 48 weeks | 1 | 81 | Risk Ratio (M‐H, Fixed, 95% CI) | 0.59 [0.15, 2.29] |
| 4.3 72 weeks | 1 | 81 | Risk Ratio (M‐H, Fixed, 95% CI) | 0.83 [0.42, 1.62] |
| 4.4 104 weeks | 1 | 81 | Risk Ratio (M‐H, Fixed, 95% CI) | 1.88 [1.13, 3.12] |
| Outcome or subgroup title | No. of studies | No. of participants | Statistical method | Effect size |
| 1 Total discontinuations Show forest plot | 1 | Risk Ratio (M‐H, Fixed, 95% CI) | Subtotals only | |
| 1.1 24 weeks | 1 | 54 | Risk Ratio (M‐H, Fixed, 95% CI) | 2.57 [0.13, 50.83] |
| 2 Adverse events Show forest plot | 1 | Risk Ratio (M‐H, Fixed, 95% CI) | Subtotals only | |
| 2.1 24 weeks | 1 | 54 | Risk Ratio (M‐H, Fixed, 95% CI) | 2.57 [0.13, 50.83] |
| Outcome or subgroup title | No. of studies | No. of participants | Statistical method | Effect size |
| 1 Any Adverse Event Show forest plot | 5 | Risk Ratio (M‐H, Random, 95% CI) | Subtotals only | |
| 1.1 24 weeks | 4 | 1280 | Risk Ratio (M‐H, Random, 95% CI) | 1.06 [0.95, 1.18] |
| 1.2 48‐56 weeks | 2 | 579 | Risk Ratio (M‐H, Random, 95% CI) | 0.99 [0.91, 1.07] |
| 1.3 104 weeks | 1 | 499 | Risk Ratio (M‐H, Random, 95% CI) | 1.01 [0.94, 1.08] |
| 2 Serious Adverse Events Show forest plot | 5 | Risk Ratio (M‐H, Fixed, 95% CI) | Subtotals only | |
| 2.1 24 weeks | 4 | 1280 | Risk Ratio (M‐H, Fixed, 95% CI) | 1.01 [0.69, 1.49] |
| 2.2 48‐56 weeks | 2 | 579 | Risk Ratio (M‐H, Fixed, 95% CI) | 0.94 [0.57, 1.53] |
| 2.3 104 weeks | 1 | 499 | Risk Ratio (M‐H, Fixed, 95% CI) | 0.78 [0.51, 1.19] |
| 3 Infections Show forest plot | 3 | Risk Ratio (M‐H, Random, 95% CI) | Subtotals only | |
| 3.1 24 weeks | 2 | 683 | Risk Ratio (M‐H, Random, 95% CI) | 1.01 [0.68, 1.48] |
| 3.2 52 weeks | 1 | 499 | Risk Ratio (M‐H, Random, 95% CI) | 1.04 [0.88, 1.24] |
| 3.3 104 weeks | 1 | 499 | Risk Ratio (M‐H, Random, 95% CI) | 1.09 [0.95, 1.26] |
| 4 Serious infections Show forest plot | 4 | 1841 | Risk Ratio (M‐H, Fixed, 95% CI) | 0.68 [0.42, 1.10] |
| 4.1 24 weeks | 3 | 763 | Risk Ratio (M‐H, Fixed, 95% CI) | 0.78 [0.27, 2.25] |
| 4.2 48‐56 weeks | 2 | 579 | Risk Ratio (M‐H, Fixed, 95% CI) | 0.71 [0.31, 1.59] |
| 4.3 104 weeks | 1 | 499 | Risk Ratio (M‐H, Fixed, 95% CI) | 0.63 [0.31, 1.27] |
| 5 Death Show forest plot | 5 | Risk Difference (M‐H, Fixed, 95% CI) | Subtotals only | |
| 5.1 24 weeks | 4 | 1280 | Risk Difference (M‐H, Fixed, 95% CI) | ‐0.00 [‐0.01, 0.01] |
| 5.2 52 weeks | 1 | 499 | Risk Difference (M‐H, Fixed, 95% CI) | ‐0.01 [‐0.03, 0.00] |
| 5.3 104 weeks | 1 | 499 | Risk Difference (M‐H, Fixed, 95% CI) | ‐0.01 [‐0.02, 0.01] |
| 6 Arthralgia Show forest plot | 3 | Risk Ratio (M‐H, Fixed, 95% CI) | Subtotals only | |
| 6.1 24 weeks | 3 | 938 | Risk Ratio (M‐H, Fixed, 95% CI) | 1.33 [0.76, 2.34] |
| 7 Cardiac event (any) Show forest plot | 1 | Risk Ratio (M‐H, Fixed, 95% CI) | Subtotals only | |
| 7.1 52 weeks | 1 | 499 | Risk Ratio (M‐H, Fixed, 95% CI) | 2.68 [0.72, 9.98] |
| 8 Cardiac event (serious) Show forest plot | 1 | Risk Ratio (M‐H, Fixed, 95% CI) | Subtotals only | |
| 8.1 52 weeks | 1 | 499 | Risk Ratio (M‐H, Fixed, 95% CI) | 7.03 [0.36, 135.36] |
| 9 Cough Show forest plot | 2 | Risk Ratio (M‐H, Random, 95% CI) | Subtotals only | |
| 9.1 24 weeks | 2 | 597 | Risk Ratio (M‐H, Random, 95% CI) | 1.06 [0.17, 6.49] |
| 10 Diarrhea Show forest plot | 2 | Risk Ratio (M‐H, Fixed, 95% CI) | Subtotals only | |
| 10.1 24 weeks | 2 | 858 | Risk Ratio (M‐H, Fixed, 95% CI) | 0.71 [0.41, 1.22] |
| 11 Exacerbation of RA Show forest plot | 4 | Risk Ratio (M‐H, Fixed, 95% CI) | Subtotals only | |
| 11.1 24 weeks | 3 | 938 | Risk Ratio (M‐H, Fixed, 95% CI) | 0.46 [0.37, 0.58] |
| 11.2 48‐56 weeks | 2 | 579 | Risk Ratio (M‐H, Fixed, 95% CI) | 2.01 [0.18, 22.00] |
| 12 Fatigue Show forest plot | 2 | Risk Ratio (M‐H, Fixed, 95% CI) | Subtotals only | |
| 12.1 24 weeks | 2 | 858 | Risk Ratio (M‐H, Fixed, 95% CI) | 1.03 [0.59, 1.79] |
| 13 HACA Show forest plot | 3 | Risk Ratio (M‐H, Random, 95% CI) | Subtotals only | |
| 13.1 24 weeks | 3 | 1200 | Risk Ratio (M‐H, Random, 95% CI) | 3.17 [0.76, 13.25] |
| 14 Headache Show forest plot | 2 | Risk Ratio (M‐H, Fixed, 95% CI) | Subtotals only | |
| 14.1 24 weeks | 2 | 858 | Risk Ratio (M‐H, Fixed, 95% CI) | 0.89 [0.60, 1.34] |
| 15 Hypertension Show forest plot | 3 | Risk Ratio (M‐H, Fixed, 95% CI) | Subtotals only | |
| 15.1 24 weeks | 3 | 938 | Risk Ratio (M‐H, Fixed, 95% CI) | 1.59 [0.96, 2.61] |
| 16 Infusion‐related reactions (1st course ‐1st infusion) Show forest plot | 5 | Risk Ratio (M‐H, Fixed, 95% CI) | Subtotals only | |
| 16.1 24 weeks | 4 | 1280 | Risk Ratio (M‐H, Fixed, 95% CI) | 1.59 [1.29, 1.96] |
| 16.2 52 weeks | 1 | 499 | Risk Ratio (M‐H, Fixed, 95% CI) | 1.49 [0.98, 2.27] |
| 16.3 104 weeks | 1 | 499 | Risk Ratio (M‐H, Fixed, 95% CI) | 1.48 [0.97, 2.25] |
| 17 Infusion‐related reaction (1st course ‐2nd infusion) Show forest plot | 2 | Risk Ratio (M‐H, Fixed, 95% CI) | Subtotals only | |
| 17.1 24 weeks | 2 | 761 | Risk Ratio (M‐H, Fixed, 95% CI) | 0.79 [0.52, 1.22] |
| 18 Infusion‐related reaction (2nd course) Show forest plot | 1 | Risk Ratio (M‐H, Fixed, 95% CI) | Subtotals only | |
| 18.1 52 weeks | 1 | 499 | Risk Ratio (M‐H, Fixed, 95% CI) | 1.10 [0.62, 1.97] |
| 18.2 104 weeks | 1 | 499 | Risk Ratio (M‐H, Fixed, 95% CI) | 1.00 [0.56, 1.78] |
| 19 Infusion‐related reaction (3rd course) Show forest plot | 1 | Risk Ratio (M‐H, Fixed, 95% CI) | Subtotals only | |
| 19.1 52 weeks | 1 | 499 | Risk Ratio (M‐H, Fixed, 95% CI) | 1.29 [0.49, 3.41] |
| 19.2 104 weeks | 1 | 499 | Risk Ratio (M‐H, Fixed, 95% CI) | 1.20 [0.53, 2.72] |
| 20 Infusion‐related reaction (4th course) Show forest plot | 1 | Risk Ratio (M‐H, Fixed, 95% CI) | Subtotals only | |
| 20.1 104 weeks | 1 | 499 | Risk Ratio (M‐H, Fixed, 95% CI) | 0.80 [0.32, 1.99] |
| 21 Infusion‐related reaction (5th course) Show forest plot | 1 | Risk Ratio (M‐H, Fixed, 95% CI) | Subtotals only | |
| 21.1 104 weeks | 1 | 499 | Risk Ratio (M‐H, Fixed, 95% CI) | 1.49 [0.25, 8.86] |
| 22 Lower gastrointestinal events Show forest plot | 2 | Risk Ratio (M‐H, Fixed, 95% CI) | Subtotals only | |
| 22.1 24 weeks | 2 | 683 | Risk Ratio (M‐H, Fixed, 95% CI) | 0.74 [0.43, 1.26] |
| 23 Malignancy Show forest plot | 5 | Risk Ratio (M‐H, Fixed, 95% CI) | Subtotals only | |
| 23.1 24 weeks | 3 | 1175 | Risk Ratio (M‐H, Fixed, 95% CI) | 0.87 [0.16, 4.63] |
| 23.2 48‐56 weeks | 2 | 579 | Risk Ratio (M‐H, Fixed, 95% CI) | 0.20 [0.02, 1.71] |
| 23.3 104 weeks | 1 | 499 | Risk Ratio (M‐H, Fixed, 95% CI) | 0.43 [0.11, 1.63] |
| 24 Nasopharyngitis Show forest plot | 3 | Risk Ratio (M‐H, Fixed, 95% CI) | Subtotals only | |
| 24.1 24 weeks | 3 | 938 | Risk Ratio (M‐H, Fixed, 95% CI) | 1.07 [0.66, 1.74] |
| 25 Nausea Show forest plot | 3 | Risk Ratio (M‐H, Fixed, 95% CI) | Subtotals only | |
| 25.1 24 weeks | 3 | 938 | Risk Ratio (M‐H, Fixed, 95% CI) | 0.86 [0.52, 1.43] |
| 26 Pyrexia Show forest plot | 1 | Risk Ratio (M‐H, Fixed, 95% CI) | Subtotals only | |
| 26.1 24 weeks | 1 | 517 | Risk Ratio (M‐H, Fixed, 95% CI) | 1.45 [0.60, 3.50] |
| 27 Upper respiratory tract infection Show forest plot | 2 | 1016 | Risk Ratio (M‐H, Fixed, 95% CI) | 1.09 [0.60, 1.97] |
| 27.1 24 weeks | 1 | 517 | Risk Ratio (M‐H, Fixed, 95% CI) | 1.16 [0.62, 2.20] |
| 27.2 52 weeks | 1 | 499 | Risk Ratio (M‐H, Fixed, 95% CI) | 0.67 [0.11, 3.97] |
| 28 Urinary tract infection Show forest plot | 3 | 1357 | Risk Ratio (M‐H, Random, 95% CI) | 0.61 [0.29, 1.28] |
| 28.1 24 weeks | 2 | 858 | Risk Ratio (M‐H, Random, 95% CI) | 0.65 [0.27, 1.56] |
| 28.2 52 weeks | 1 | 499 | Risk Ratio (M‐H, Random, 95% CI) | 0.20 [0.01, 4.16] |
| 29 Vascular disorders Show forest plot | 4 | 1262 | Risk Ratio (M‐H, Fixed, 95% CI) | 1.54 [1.00, 2.38] |
| 29.1 24 weeks | 3 | 763 | Risk Ratio (M‐H, Fixed, 95% CI) | 1.90 [1.03, 3.51] |
| 29.2 52 weeks | 1 | 499 | Risk Ratio (M‐H, Fixed, 95% CI) | 1.24 [0.67, 2.29] |
| Outcome or subgroup title | No. of studies | No. of participants | Statistical method | Effect size |
| 1 Any Adverse Event Show forest plot | 1 | Risk Ratio (M‐H, Fixed, 95% CI) | Subtotals only | |
| 1.1 24 weeks | 1 | 80 | Risk Ratio (M‐H, Fixed, 95% CI) | 1.0 [0.80, 1.24] |
| 1.2 48 weeks | 1 | 80 | Risk Ratio (M‐H, Fixed, 95% CI) | 1.06 [0.90, 1.25] |
| 2 Serious Adverse Events Show forest plot | 1 | Risk Ratio (M‐H, Fixed, 95% CI) | Subtotals only | |
| 2.1 24 weeks | 1 | 80 | Risk Ratio (M‐H, Fixed, 95% CI) | 0.67 [0.12, 3.78] |
| 2.2 48 weeks | 1 | 80 | Risk Ratio (M‐H, Fixed, 95% CI) | 1.0 [0.27, 3.72] |
| 3 Serious Infections Show forest plot | 1 | Risk Ratio (M‐H, Fixed, 95% CI) | Subtotals only | |
| 3.1 24 weeks | 1 | 80 | Risk Ratio (M‐H, Fixed, 95% CI) | 2.0 [0.19, 21.18] |
| 3.2 48‐56 weeks | 1 | 80 | Risk Ratio (M‐H, Fixed, 95% CI) | 3.0 [0.13, 71.51] |
| 4 Death Show forest plot | 1 | Risk Ratio (M‐H, Fixed, 95% CI) | Subtotals only | |
| 4.1 24 weeks | 1 | 80 | Risk Ratio (M‐H, Fixed, 95% CI) | 3.0 [0.13, 71.51] |
| 5 Any Event Associated with 1st Infusion Show forest plot | 1 | Risk Ratio (M‐H, Fixed, 95% CI) | Subtotals only | |
| 5.1 24 weeks | 1 | 80 | Risk Ratio (M‐H, Fixed, 95% CI) | 1.5 [0.84, 2.69] |
| 6 Arthralgia Show forest plot | 1 | Risk Ratio (M‐H, Fixed, 95% CI) | Subtotals only | |
| 6.1 24 weeks | 1 | 80 | Risk Ratio (M‐H, Fixed, 95% CI) | 1.0 [0.21, 4.66] |
| 7 Back pain Show forest plot | 1 | Risk Ratio (M‐H, Fixed, 95% CI) | Subtotals only | |
| 7.1 24 weeks | 1 | 80 | Risk Ratio (M‐H, Fixed, 95% CI) | 2.0 [0.39, 10.31] |
| 8 Cough Show forest plot | 1 | Peto Odds Ratio (Peto, Fixed, 95% CI) | Subtotals only | |
| 8.1 24 weeks | 1 | 80 | Peto Odds Ratio (Peto, Fixed, 95% CI) | 8.22 [1.36, 49.69] |
| 9 Dyspnea Show forest plot | 1 | Risk Ratio (M‐H, Fixed, 95% CI) | Subtotals only | |
| 9.1 24 weeks | 1 | 80 | Risk Ratio (M‐H, Fixed, 95% CI) | 9.0 [0.50, 161.86] |
| 10 Exacerbation of RA Show forest plot | 1 | Risk Ratio (M‐H, Fixed, 95% CI) | Subtotals only | |
| 10.1 24 weeks | 1 | 80 | Risk Ratio (M‐H, Fixed, 95% CI) | 0.38 [0.16, 0.86] |
| 10.2 48‐56 weeks | 1 | 80 | Risk Ratio (M‐H, Fixed, 95% CI) | 3.0 [0.13, 71.51] |
| 11 Hypertension Show forest plot | 1 | Risk Ratio (M‐H, Fixed, 95% CI) | Subtotals only | |
| 11.1 24 weeks | 1 | 80 | Risk Ratio (M‐H, Fixed, 95% CI) | 1.0 [0.35, 2.84] |
| 12 Hypotension Show forest plot | 1 | Risk Ratio (M‐H, Fixed, 95% CI) | Subtotals only | |
| 12.1 24 weeks | 1 | 80 | Risk Ratio (M‐H, Fixed, 95% CI) | 1.71 [0.75, 3.90] |
| 13 Nasopharyngitis Show forest plot | 1 | Risk Ratio (M‐H, Fixed, 95% CI) | Subtotals only | |
| 13.1 24 weeks | 1 | 80 | Risk Ratio (M‐H, Fixed, 95% CI) | 0.67 [0.20, 2.18] |
| 14 Nausea Show forest plot | 1 | Risk Ratio (M‐H, Fixed, 95% CI) | Subtotals only | |
| 14.1 24 weeks | 1 | 80 | Risk Ratio (M‐H, Fixed, 95% CI) | 2.0 [0.19, 21.18] |
| 15 Rash Show forest plot | 1 | Risk Ratio (M‐H, Fixed, 95% CI) | Subtotals only | |
| 15.1 24 weeks | 1 | 80 | Risk Ratio (M‐H, Fixed, 95% CI) | 4.0 [0.47, 34.24] |
| Outcome or subgroup title | No. of studies | No. of participants | Statistical method | Effect size |
| 1 Any Adverse Event Show forest plot | 3 | Risk Ratio (M‐H, Fixed, 95% CI) | Subtotals only | |
| 1.1 24 weeks | 2 | 612 | Risk Ratio (M‐H, Fixed, 95% CI) | 1.08 [0.99, 1.18] |
| 1.2 52 weeks | 1 | 499 | Risk Ratio (M‐H, Fixed, 95% CI) | 0.93 [0.85, 1.02] |
| 1.3 104 weeks | 1 | 498 | Risk Ratio (M‐H, Fixed, 95% CI) | 0.96 [0.89, 1.03] |
| 2 Serious Adverse Events Show forest plot | 3 | Risk Ratio (M‐H, Random, 95% CI) | Subtotals only | |
| 2.1 24 weeks | 2 | 612 | Risk Ratio (M‐H, Random, 95% CI) | 1.02 [0.16, 6.45] |
| 2.2 52 weeks | 1 | 499 | Risk Ratio (M‐H, Random, 95% CI) | 0.89 [0.52, 1.51] |
| 2.3 104 weeks | 1 | 498 | Risk Ratio (M‐H, Random, 95% CI) | 0.88 [0.59, 1.32] |
| 3 Infections Show forest plot | 3 | Risk Ratio (M‐H, Fixed, 95% CI) | Subtotals only | |
| 3.1 24 weeks | 2 | 612 | Risk Ratio (M‐H, Fixed, 95% CI) | 1.05 [0.86, 1.29] |
| 3.2 52 weeks | 1 | 499 | Risk Ratio (M‐H, Fixed, 95% CI) | 1.03 [0.86, 1.22] |
| 3.3 104 weeks | 1 | 498 | Risk Ratio (M‐H, Fixed, 95% CI) | 1.11 [0.97, 1.27] |
| 4 Serious Infections Show forest plot | 3 | Risk Ratio (M‐H, Fixed, 95% CI) | Subtotals only | |
| 4.1 24 weeks | 2 | 612 | Risk Ratio (M‐H, Fixed, 95% CI) | 0.25 [0.04, 1.47] |
| 4.2 52 weeks | 1 | 499 | Risk Ratio (M‐H, Fixed, 95% CI) | 0.46 [0.18, 1.20] |
| 4.3 104 weeks | 1 | 498 | Risk Ratio (M‐H, Fixed, 95% CI) | 0.68 [0.35, 1.35] |
| 5 Death Show forest plot | 3 | Risk Ratio (M‐H, Fixed, 95% CI) | Subtotals only | |
| 5.1 24 weeks | 2 | 612 | Risk Ratio (M‐H, Fixed, 95% CI) | 3.33 [0.35, 31.82] |
| 5.2 52 weeks | 1 | 499 | Risk Ratio (M‐H, Fixed, 95% CI) | 0.14 [0.01, 2.76] |
| 5.3 104 weeks | 1 | 498 | Risk Ratio (M‐H, Fixed, 95% CI) | 0.67 [0.11, 3.96] |
| 6 Arthralgia Show forest plot | 1 | 273 | Risk Ratio (M‐H, Fixed, 95% CI) | 1.20 [0.36, 4.06] |
| 6.1 24 weeks | 1 | 273 | Risk Ratio (M‐H, Fixed, 95% CI) | 1.20 [0.36, 4.06] |
| 7 Cardiac event (any) Show forest plot | 1 | Risk Ratio (M‐H, Fixed, 95% CI) | Subtotals only | |
| 7.1 52 weeks | 1 | 499 | Risk Ratio (M‐H, Fixed, 95% CI) | 1.00 [0.20, 4.93] |
| 8 Cardiac event (serious) Show forest plot | 1 | Risk Ratio (M‐H, Fixed, 95% CI) | Subtotals only | |
| 8.1 52 weeks | 1 | 499 | Risk Ratio (M‐H, Fixed, 95% CI) | 5.02 [0.24, 104.04] |
| 9 Diarrhea Show forest plot | 1 | Risk Ratio (M‐H, Fixed, 95% CI) | Subtotals only | |
| 9.1 24 weeks | 1 | 273 | Risk Ratio (M‐H, Fixed, 95% CI) | 1.05 [0.39, 2.82] |
| 10 Exacerbation of RA Show forest plot | 2 | 772 | Risk Ratio (M‐H, Fixed, 95% CI) | 0.56 [0.36, 0.89] |
| 10.1 MTX vs RTX 500 mg + MTX | 1 | 273 | Risk Ratio (M‐H, Fixed, 95% CI) | 0.57 [0.36, 0.91] |
| 10.2 52 weeks | 1 | 499 | Risk Ratio (M‐H, Fixed, 95% CI) | 0.33 [0.01, 8.18] |
| 11 Fatigue Show forest plot | 1 | Risk Ratio (M‐H, Fixed, 95% CI) | Subtotals only | |
| 11.1 24 weeks | 1 | 273 | Risk Ratio (M‐H, Fixed, 95% CI) | 0.75 [0.25, 2.24] |
| 12 HACA Show forest plot | 2 | Risk Ratio (M‐H, Fixed, 95% CI) | Subtotals only | |
| 12.1 24 weeks | 2 | 612 | Risk Ratio (M‐H, Fixed, 95% CI) | 2.73 [1.17, 6.40] |
| 13 Headache Show forest plot | 1 | Risk Ratio (M‐H, Fixed, 95% CI) | Subtotals only | |
| 13.1 24 weeks | 1 | 273 | Risk Ratio (M‐H, Fixed, 95% CI) | 0.89 [0.46, 1.69] |
| 14 Hypertension Show forest plot | 1 | Risk Ratio (M‐H, Fixed, 95% CI) | Subtotals only | |
| 14.1 24 weeks | 1 | 273 | Risk Ratio (M‐H, Fixed, 95% CI) | 1.50 [0.41, 5.47] |
| 15 Infusion‐related reactions (1st course ‐ 1st infusion) Show forest plot | 3 | Risk Ratio (M‐H, Fixed, 95% CI) | Subtotals only | |
| 15.1 24 weeks | 2 | 584 | Risk Ratio (M‐H, Fixed, 95% CI) | 0.79 [0.46, 1.36] |
| 15.2 52 weeks | 1 | 499 | Risk Ratio (M‐H, Fixed, 95% CI) | 1.13 [0.72, 1.78] |
| 15.3 104 weeks | 1 | 498 | Risk Ratio (M‐H, Fixed, 95% CI) | 1.13 [0.72, 1.77] |
| 16 Infusion related reaction (1st course ‐2nd infusion) Show forest plot | 2 | Risk Ratio (M‐H, Fixed, 95% CI) | Subtotals only | |
| 16.1 24 weeks | 2 | 612 | Risk Ratio (M‐H, Fixed, 95% CI) | 1.51 [1.10, 2.09] |
| 17 Infusion related reaction (2nd course) Show forest plot | 1 | Risk Ratio (M‐H, Fixed, 95% CI) | Subtotals only | |
| 17.1 52 weeks | 1 | 499 | Risk Ratio (M‐H, Fixed, 95% CI) | 0.95 [0.52, 1.74] |
| 17.2 104 weeks | 1 | 498 | Risk Ratio (M‐H, Fixed, 95% CI) | 0.95 [0.53, 1.71] |
| 18 Infusion related reaction (3rd course) Show forest plot | 1 | Risk Ratio (M‐H, Fixed, 95% CI) | Subtotals only | |
| 18.1 52 weeks | 1 | 499 | Risk Ratio (M‐H, Fixed, 95% CI) | 0.29 [0.06, 1.37] |
| 18.2 104 weeks | 1 | 498 | Risk Ratio (M‐H, Fixed, 95% CI) | 1.1 [0.48, 2.54] |
| 19 Infusion related reaction (4th course) Show forest plot | 1 | Risk Ratio (M‐H, Fixed, 95% CI) | Subtotals only | |
| 19.1 104 weeks | 1 | 498 | Risk Ratio (M‐H, Fixed, 95% CI) | 1.0 [0.42, 2.36] |
| 20 Infusion related reaction (5th course) Show forest plot | 1 | Risk Ratio (M‐H, Fixed, 95% CI) | Subtotals only | |
| 20.1 104 weeks | 1 | 498 | Risk Ratio (M‐H, Fixed, 95% CI) | 0.5 [0.05, 5.48] |
| 21 Lower gastrointestinal events Show forest plot | 2 | Risk Ratio (M‐H, Fixed, 95% CI) | Subtotals only | |
| 21.1 24 weeks | 2 | 612 | Risk Ratio (M‐H, Fixed, 95% CI) | 0.89 [0.52, 1.50] |
| 22 Malignancy Show forest plot | 3 | Risk Ratio (M‐H, Fixed, 95% CI) | Subtotals only | |
| 22.1 24 weeks | 2 | 612 | Risk Ratio (M‐H, Fixed, 95% CI) | 1.03 [0.06, 16.33] |
| 22.2 52 weeks | 1 | 499 | Risk Ratio (M‐H, Fixed, 95% CI) | 0.40 [0.08, 2.05] |
| 22.3 104 weeks | 1 | 498 | Risk Ratio (M‐H, Fixed, 95% CI) | 0.86 [0.29, 2.51] |
| 23 Nasopharyngitis Show forest plot | 1 | Risk Ratio (M‐H, Fixed, 95% CI) | Subtotals only | |
| 23.1 24 weeks | 1 | 273 | Risk Ratio (M‐H, Fixed, 95% CI) | 1.05 [0.39, 2.82] |
| 24 Nausea Show forest plot | 1 | Risk Ratio (M‐H, Fixed, 95% CI) | Subtotals only | |
| 24.1 24 weeks | 1 | 273 | Risk Ratio (M‐H, Fixed, 95% CI) | 0.74 [0.32, 1.73] |
| 25 Upper respiratory tract infection Show forest plot | 2 | 772 | Risk Ratio (M‐H, Fixed, 95% CI) | 1.07 [0.49, 2.35] |
| 25.1 24 weeks | 1 | 273 | Risk Ratio (M‐H, Fixed, 95% CI) | 1.34 [0.56, 3.18] |
| 25.2 52 weeks | 1 | 499 | Risk Ratio (M‐H, Fixed, 95% CI) | 0.33 [0.04, 3.20] |
| 26 Vascular disorders Show forest plot | 3 | 1111 | Risk Ratio (M‐H, Fixed, 95% CI) | 1.25 [0.74, 2.09] |
| 26.1 24 weeks | 2 | 612 | Risk Ratio (M‐H, Fixed, 95% CI) | 1.52 [0.62, 3.74] |
| 26.2 52 weeks | 1 | 499 | Risk Ratio (M‐H, Fixed, 95% CI) | 1.12 [0.60, 2.11] |
| Outcome or subgroup title | No. of studies | No. of participants | Statistical method | Effect size |
| 1 Any Adverse Event Show forest plot | 1 | Risk Ratio (M‐H, Fixed, 95% CI) | Subtotals only | |
| 1.1 24 weeks | 1 | 81 | Risk Ratio (M‐H, Fixed, 95% CI) | 0.91 [0.72, 1.16] |
| 1.2 48‐56 weeks | 1 | 81 | Risk Ratio (M‐H, Fixed, 95% CI) | 1.00 [0.84, 1.20] |
| 2 Serious Adverse Events Show forest plot | 1 | Risk Ratio (M‐H, Fixed, 95% CI) | Subtotals only | |
| 2.1 24 weeks | 1 | 81 | Risk Ratio (M‐H, Fixed, 95% CI) | 1.95 [0.52, 7.27] |
| 2.2 48‐56 weeks | 1 | 81 | Risk Ratio (M‐H, Fixed, 95% CI) | 1.71 [0.54, 5.38] |
| 3 Serious Infections Show forest plot | 1 | Risk Ratio (M‐H, Fixed, 95% CI) | Subtotals only | |
| 3.1 24 weeks | 1 | 81 | Risk Ratio (M‐H, Fixed, 95% CI) | 1.95 [0.18, 20.68] |
| 3.2 48‐56 weeks | 1 | 81 | Risk Ratio (M‐H, Fixed, 95% CI) | 0.0 [0.0, 0.0] |
| 4 Death Show forest plot | 1 | Risk Difference (M‐H, Fixed, 95% CI) | Subtotals only | |
| 4.1 24 weeks | 1 | 81 | Risk Difference (M‐H, Fixed, 95% CI) | 0.0 [‐0.05, 0.05] |
| 5 Any Event Associated with 1st Infusion Show forest plot | 1 | Risk Ratio (M‐H, Fixed, 95% CI) | Subtotals only | |
| 5.1 24 weeks | 1 | 81 | Risk Ratio (M‐H, Fixed, 95% CI) | 1.06 [0.55, 2.03] |
| 6 Arthralgia Show forest plot | 1 | Risk Ratio (M‐H, Fixed, 95% CI) | Subtotals only | |
| 6.1 24 weeks | 1 | 81 | Risk Ratio (M‐H, Fixed, 95% CI) | 0.33 [0.04, 3.00] |
| 7 Back pain Show forest plot | 1 | Risk Ratio (M‐H, Fixed, 95% CI) | Subtotals only | |
| 7.1 24 weeks | 1 | 81 | Risk Ratio (M‐H, Fixed, 95% CI) | 1.46 [0.26, 8.30] |
| 8 Cough Show forest plot | 1 | Risk Ratio (M‐H, Fixed, 95% CI) | Subtotals only | |
| 8.1 24 weeks | 1 | 81 | Risk Ratio (M‐H, Fixed, 95% CI) | 2.93 [0.12, 69.83] |
| 9 Dyspnea Show forest plot | 1 | Risk Difference (M‐H, Fixed, 95% CI) | Subtotals only | |
| 9.1 24 weeks | 1 | 81 | Risk Difference (M‐H, Fixed, 95% CI) | 0.0 [‐0.05, 0.05] |
| 10 Exacerbation of RA Show forest plot | 1 | Risk Ratio (M‐H, Fixed, 95% CI) | Subtotals only | |
| 10.1 24 weeks | 1 | 81 | Risk Ratio (M‐H, Fixed, 95% CI) | 0.37 [0.16, 0.84] |
| 10.2 48‐56 weeks | 1 | 81 | Risk Ratio (M‐H, Fixed, 95% CI) | 0.0 [0.0, 0.0] |
| 11 Hypertension Show forest plot | 1 | Risk Ratio (M‐H, Fixed, 95% CI) | Subtotals only | |
| 11.1 24 weeks | 1 | 81 | Risk Ratio (M‐H, Fixed, 95% CI) | 0.49 [0.13, 1.82] |
| 12 Hypotension Show forest plot | 1 | Risk Ratio (M‐H, Fixed, 95% CI) | Subtotals only | |
| 12.1 24 weeks | 1 | 81 | Risk Ratio (M‐H, Fixed, 95% CI) | 1.67 [0.73, 3.81] |
| 13 Nasopharyngitis Show forest plot | 1 | Risk Ratio (M‐H, Fixed, 95% CI) | Subtotals only | |
| 13.1 24 weeks | 1 | 81 | Risk Ratio (M‐H, Fixed, 95% CI) | 0.33 [0.07, 1.52] |
| 14 Nausea Show forest plot | 1 | Risk Ratio (M‐H, Fixed, 95% CI) | Subtotals only | |
| 14.1 24 weeks | 1 | 81 | Risk Ratio (M‐H, Fixed, 95% CI) | 3.90 [0.46, 33.42] |
| 15 Pruritus Show forest plot | 1 | Risk Ratio (M‐H, Fixed, 95% CI) | Subtotals only | |
| 15.1 24 weeks | 1 | 81 | Risk Ratio (M‐H, Fixed, 95% CI) | 8.79 [0.49, 158.07] |
| 16 Rash Show forest plot | 1 | Risk Ratio (M‐H, Fixed, 95% CI) | Subtotals only | |
| 16.1 24 weeks | 1 | 81 | Risk Ratio (M‐H, Fixed, 95% CI) | 3.90 [0.46, 33.42] |
| 16.2 48 weeks | 1 | 80 | Risk Ratio (M‐H, Fixed, 95% CI) | 0.0 [0.0, 0.0] |
| Outcome or subgroup title | No. of studies | No. of participants | Statistical method | Effect size |
| 1 Any Adverse Event Show forest plot | 1 | Risk Ratio (M‐H, Fixed, 95% CI) | Subtotals only | |
| 1.1 24 weeks | 1 | 51 | Risk Ratio (M‐H, Fixed, 95% CI) | 1.13 [0.90, 1.41] |
| 2 Serious adverse events Show forest plot | 1 | Risk Ratio (M‐H, Fixed, 95% CI) | Subtotals only | |
| 2.1 24 weeks | 1 | 51 | Risk Ratio (M‐H, Fixed, 95% CI) | 2.79 [0.14, 55.23] |
| 3 Grade 3 adverse events Show forest plot | 1 | Risk Ratio (M‐H, Fixed, 95% CI) | Subtotals only | |
| 3.1 24 weeks | 1 | 51 | Risk Ratio (M‐H, Fixed, 95% CI) | 6.15 [0.36, 105.22] |
| 4 All infections Show forest plot | 1 | Risk Ratio (M‐H, Fixed, 95% CI) | Subtotals only | |
| 4.1 24 weeks | 1 | 51 | Risk Ratio (M‐H, Fixed, 95% CI) | 0.89 [0.55, 1.45] |
| 5 Grade 3 infections Show forest plot | 1 | Risk Ratio (M‐H, Fixed, 95% CI) | Subtotals only | |
| 5.1 24 weeks | 1 | 51 | Risk Ratio (M‐H, Fixed, 95% CI) | 3.91 [0.21, 71.77] |
| 6 Serious infections Show forest plot | 1 | Risk Ratio (M‐H, Fixed, 95% CI) | Subtotals only | |
| 6.1 24 weeks | 1 | 51 | Risk Ratio (M‐H, Fixed, 95% CI) | 1.68 [0.07, 39.16] |
| 7 Any Event Associated with 1st infusion Show forest plot | 1 | Risk Ratio (M‐H, Fixed, 95% CI) | Subtotals only | |
| 7.1 24 weeks | 1 | 51 | Risk Ratio (M‐H, Fixed, 95% CI) | 5.45 [0.76, 39.26] |
| 8 Any Event Associated with 2nd infusion Show forest plot | 1 | Risk Ratio (M‐H, Fixed, 95% CI) | Subtotals only | |
| 8.1 24 weeks | 1 | 51 | Risk Ratio (M‐H, Fixed, 95% CI) | 0.82 [0.15, 4.45] |
| 9 Arthralgia Show forest plot | 1 | Risk Ratio (M‐H, Fixed, 95% CI) | Subtotals only | |
| 9.1 24 weeks | 1 | 51 | Risk Ratio (M‐H, Fixed, 95% CI) | 0.82 [0.15, 4.45] |
| 10 Coronary artery occlusion Show forest plot | 1 | Risk Ratio (M‐H, Fixed, 95% CI) | Subtotals only | |
| 10.1 24 weeks | 1 | 51 | Risk Ratio (M‐H, Fixed, 95% CI) | 1.68 [0.07, 39.16] |
| 11 Diarrhea Show forest plot | 1 | Risk Ratio (M‐H, Fixed, 95% CI) | Subtotals only | |
| 11.1 24 weeks | 1 | 51 | Risk Ratio (M‐H, Fixed, 95% CI) | 1.64 [0.18, 14.61] |
| 12 Exacerbation of RA Show forest plot | 1 | Risk Ratio (M‐H, Fixed, 95% CI) | Subtotals only | |
| 12.1 24 weeks | 1 | 51 | Risk Ratio (M‐H, Fixed, 95% CI) | 0.73 [0.18, 2.90] |
| 13 Fatigue Show forest plot | 1 | Risk Ratio (M‐H, Fixed, 95% CI) | Subtotals only | |
| 13.1 24 weeks | 1 | 51 | Risk Ratio (M‐H, Fixed, 95% CI) | 5.03 [0.29, 88.46] |
| 14 HACA Show forest plot | 1 | Risk Ratio (M‐H, Fixed, 95% CI) | Subtotals only | |
| 14.1 24 weeks | 1 | 51 | Risk Ratio (M‐H, Fixed, 95% CI) | 1.68 [0.07, 39.16] |
| 15 Headache Show forest plot | 1 | Risk Ratio (M‐H, Fixed, 95% CI) | Subtotals only | |
| 15.1 24 weeks | 1 | 51 | Risk Ratio (M‐H, Fixed, 95% CI) | 0.82 [0.15, 4.45] |
| 16 Influenza Show forest plot | 1 | Risk Ratio (M‐H, Fixed, 95% CI) | Subtotals only | |
| 16.1 24 weeks | 1 | 51 | Risk Ratio (M‐H, Fixed, 95% CI) | 1.68 [0.07, 39.16] |
| 17 Muscle spasms Show forest plot | 1 | Risk Ratio (M‐H, Fixed, 95% CI) | Subtotals only | |
| 17.1 24 weeks | 1 | 51 | Risk Ratio (M‐H, Fixed, 95% CI) | 0.27 [0.03, 2.81] |
| 18 Nasopharyngitis Show forest plot | 1 | Risk Ratio (M‐H, Fixed, 95% CI) | Subtotals only | |
| 18.1 24 weeks | 1 | 51 | Risk Ratio (M‐H, Fixed, 95% CI) | 1.09 [0.11, 11.22] |
| 19 Nausea Show forest plot | 1 | Risk Ratio (M‐H, Fixed, 95% CI) | Subtotals only | |
| 19.1 24 weeks | 1 | 51 | Risk Ratio (M‐H, Fixed, 95% CI) | 1.36 [0.29, 6.34] |
| 20 Peripheral edema Show forest plot | 1 | Risk Ratio (M‐H, Fixed, 95% CI) | Subtotals only | |
| 20.1 24 weeks | 1 | 51 | Risk Ratio (M‐H, Fixed, 95% CI) | 0.82 [0.15, 4.45] |
| 21 Pneumonia Show forest plot | 1 | Risk Ratio (M‐H, Fixed, 95% CI) | Subtotals only | |
| 21.1 24 weeks | 1 | 51 | Risk Ratio (M‐H, Fixed, 95% CI) | 1.68 [0.07, 39.16] |
| 22 Postoperative infection Show forest plot | 1 | Risk Ratio (M‐H, Fixed, 95% CI) | Subtotals only | |
| 22.1 24 weeks | 1 | 51 | Risk Ratio (M‐H, Fixed, 95% CI) | 1.68 [0.07, 39.16] |
| 23 Pruritus Show forest plot | 1 | Risk Ratio (M‐H, Fixed, 95% CI) | Subtotals only | |
| 23.1 24 weeks | 1 | 51 | Risk Ratio (M‐H, Fixed, 95% CI) | 5.03 [0.29, 88.46] |
| 24 Sinusitits Show forest plot | 1 | Risk Ratio (M‐H, Fixed, 95% CI) | Subtotals only | |
| 24.1 24 weeks | 1 | 51 | Risk Ratio (M‐H, Fixed, 95% CI) | 0.55 [0.12, 2.43] |
| 25 Upper respiratory tract infections Show forest plot | 1 | Risk Ratio (M‐H, Fixed, 95% CI) | Subtotals only | |
| 25.1 24 weeks | 1 | 51 | Risk Ratio (M‐H, Fixed, 95% CI) | 0.65 [0.23, 1.85] |
| 26 Urinary tract infections Show forest plot | 1 | Risk Ratio (M‐H, Fixed, 95% CI) | Subtotals only | |
| 26.1 24 weeks | 1 | 51 | Risk Ratio (M‐H, Fixed, 95% CI) | 1.09 [0.11, 11.22] |
| 27 Vaginal Mycosis Show forest plot | 1 | Risk Ratio (M‐H, Fixed, 95% CI) | Subtotals only | |
| 27.1 24 weeks | 1 | 51 | Risk Ratio (M‐H, Fixed, 95% CI) | 1.09 [0.11, 11.22] |
| Outcome or subgroup title | No. of studies | No. of participants | Statistical method | Effect size |
| 1 ACR 50 Show forest plot | 5 | Risk Ratio (M‐H, Fixed, 95% CI) | Subtotals only | |
| 1.1 = or < 4 years | 1 | 499 | Risk Ratio (M‐H, Fixed, 95% CI) | 1.55 [1.30, 1.84] |
| 1.2 > 4 years | 4 | 1165 | Risk Ratio (M‐H, Fixed, 95% CI) | 3.41 [2.52, 4.63] |
| Outcome or subgroup title | No. of studies | No. of participants | Statistical method | Effect size |
| 1 ACR 50 Show forest plot | 5 | Risk Ratio (M‐H, Fixed, 95% CI) | Subtotals only | |
| 1.1 Methotrexate‐naive | 1 | 499 | Risk Ratio (M‐H, Fixed, 95% CI) | 1.55 [1.30, 1.84] |
| 1.2 DMARDs failure | 2 | 422 | Risk Ratio (M‐H, Fixed, 95% CI) | 2.93 [1.86, 4.63] |
| 1.3 DMARD and TNFi failure | 2 | 743 | Risk Ratio (M‐H, Fixed, 95% CI) | 3.77 [2.51, 5.66] |
| Outcome or subgroup title | No. of studies | No. of participants | Statistical method | Effect size |
| 1 ACR 50 Show forest plot | 5 | Risk Ratio (M‐H, Random, 95% CI) | Subtotals only | |
| 1.1 Low risk of bias | 2 | 579 | Risk Ratio (M‐H, Random, 95% CI) | 2.03 [0.96, 4.26] |
| 1.2 High risk of bias | 3 | 1085 | Risk Ratio (M‐H, Random, 95% CI) | 3.27 [2.10, 5.09] |
| Outcome or subgroup title | No. of studies | No. of participants | Statistical method | Effect size |
| 1 ACR 20 Show forest plot | 4 | Risk Ratio (M‐H, Random, 95% CI) | Subtotals only | |
| 1.1 24 weeks | 3 | 809 | Risk Ratio (M‐H, Random, 95% CI) | 1.05 [0.87, 1.26] |
| 1.2 48‐52 weeks | 4 | 1218 | Risk Ratio (M‐H, Random, 95% CI) | 1.04 [0.96, 1.11] |
| 1.3 104 weeks | 1 | 436 | Risk Ratio (M‐H, Random, 95% CI) | 0.92 [0.83, 1.02] |
| 2 ACR 50 Show forest plot | 4 | Risk Ratio (M‐H, Fixed, 95% CI) | Subtotals only | |
| 2.1 24 weeks | 2 | 582 | Risk Ratio (M‐H, Fixed, 95% CI) | 0.99 [0.77, 1.28] |
| 2.2 48‐56 weeks | 4 | 1218 | Risk Ratio (M‐H, Fixed, 95% CI) | 1.08 [0.97, 1.21] |
| 2.3 104 weeks | 1 | 499 | Risk Ratio (M‐H, Fixed, 95% CI) | 1.04 [0.91, 1.20] |
| 3 ACR 70 Show forest plot | 4 | Risk Ratio (M‐H, Fixed, 95% CI) | Subtotals only | |
| 3.1 24 weeks | 2 | 582 | Risk Ratio (M‐H, Fixed, 95% CI) | 1.32 [0.85, 2.04] |
| 3.2 48‐56 weeks | 4 | 1218 | Risk Ratio (M‐H, Fixed, 95% CI) | 1.08 [0.91, 1.28] |
| 3.3 104 weeks | 1 | 499 | Risk Ratio (M‐H, Fixed, 95% CI) | 1.10 [0.90, 1.34] |
| 4 ACR 90 Show forest plot | 1 | Risk Ratio (M‐H, Fixed, 95% CI) | Subtotals only | |
| 4.1 52 weeks | 1 | 500 | Risk Ratio (M‐H, Fixed, 95% CI) | 0.95 [0.65, 1.41] |
| 4.2 104 weeks | 1 | 500 | Risk Ratio (M‐H, Fixed, 95% CI) | 1.14 [0.82, 1.59] |
| 5 DAS 28‐ESR Show forest plot | 4 | Mean Difference (IV, Fixed, 95% CI) | Subtotals only | |
| 5.1 24 weeks | 3 | 1081 | Mean Difference (IV, Fixed, 95% CI) | ‐0.06 [‐0.22, 0.09] |
| 5.2 48‐56 weeks | 3 | 1063 | Mean Difference (IV, Fixed, 95% CI) | ‐0.14 [‐0.29, 0.02] |
| 5.3 104 weeks | 1 | 499 | Mean Difference (IV, Fixed, 95% CI) | 0.0 [‐0.23, 0.23] |
| 6 LDA (DAS28 =or<3.2) Show forest plot | 4 | Risk Ratio (M‐H, Fixed, 95% CI) | Subtotals only | |
| 6.1 24 weeks | 1 | 335 | Risk Ratio (M‐H, Fixed, 95% CI) | 0.71 [0.42, 1.20] |
| 6.2 48 weeks | 4 | 1215 | Risk Ratio (M‐H, Fixed, 95% CI) | 1.11 [0.94, 1.31] |
| 6.3 104 weeks | 1 | 499 | Risk Ratio (M‐H, Fixed, 95% CI) | 1.07 [0.88, 1.29] |
| 7 Clinical Remission (DAS28<2.6) Show forest plot | 4 | 2049 | Risk Ratio (M‐H, Random, 95% CI) | 1.10 [0.87, 1.39] |
| 7.1 24 weeks | 1 | 335 | Risk Ratio (M‐H, Random, 95% CI) | 0.98 [0.51, 1.90] |
| 7.2 48‐52 weeks | 4 | 1215 | Risk Ratio (M‐H, Random, 95% CI) | 1.23 [0.85, 1.78] |
| 7.3 104 weeks | 1 | 499 | Risk Ratio (M‐H, Random, 95% CI) | 0.94 [0.73, 1.20] |
| 8 Moderate or good EULAR response Show forest plot | 4 | Risk Ratio (M‐H, Random, 95% CI) | Subtotals only | |
| 8.1 24 weeks | 3 | 1082 | Risk Ratio (M‐H, Random, 95% CI) | 0.94 [0.85, 1.05] |
| 8.2 48‐52 weeks | 3 | 1063 | Risk Ratio (M‐H, Random, 95% CI) | 1.07 [0.90, 1.28] |
| 8.3 104 weeks | 1 | 499 | Risk Ratio (M‐H, Random, 95% CI) | 1.09 [0.90, 1.31] |
| 9 HAQ‐DI Show forest plot | 3 | 1969 | Mean Difference (IV, Random, 95% CI) | ‐0.03 [‐0.17, 0.11] |
| 9.1 24 weeks | 2 | 744 | Mean Difference (IV, Random, 95% CI) | 0.09 [‐0.13, 0.30] |
| 9.2 48‐52 weeks | 2 | 726 | Mean Difference (IV, Random, 95% CI) | ‐0.04 [‐0.13, 0.05] |
| 9.3 104 weeks | 1 | 499 | Mean Difference (IV, Random, 95% CI) | ‐0.20 [‐0.31, ‐0.09] |
| 10 HAQ‐DI MCID=‐0.22 Show forest plot | 4 | Risk Ratio (M‐H, Random, 95% CI) | Subtotals only | |
| 10.1 24 weeks | 2 | 580 | Risk Ratio (M‐H, Random, 95% CI) | 0.97 [0.80, 1.18] |
| 10.2 48‐56 weeks | 3 | 1061 | Risk Ratio (M‐H, Random, 95% CI) | 0.99 [0.94, 1.05] |
| 10.3 104 weeks | 1 | 499 | Risk Ratio (M‐H, Random, 95% CI) | 1.02 [0.95, 1.10] |
| 11 SF‐36 PCS Show forest plot | 4 | 1167 | Mean Difference (IV, Fixed, 95% CI) | 0.53 [‐0.49, 1.54] |
| 11.1 24 weeks | 2 | 545 | Mean Difference (IV, Fixed, 95% CI) | 0.02 [‐1.39, 1.44] |
| 11.2 48‐52 weeks | 2 | 622 | Mean Difference (IV, Fixed, 95% CI) | 1.05 [‐0.39, 2.49] |
| 12 SF‐36 PCS (=or>MCID of 5 or 5.42) Show forest plot | 4 | 1287 | Risk Ratio (M‐H, Fixed, 95% CI) | 1.06 [0.97, 1.16] |
| 12.1 24 weeks | 2 | 582 | Risk Ratio (M‐H, Fixed, 95% CI) | 1.00 [0.85, 1.19] |
| 12.2 48‐52 weeks | 2 | 705 | Risk Ratio (M‐H, Fixed, 95% CI) | 1.10 [0.99, 1.21] |
| 13 SF‐36 MCS Show forest plot | 4 | 1167 | Mean Difference (IV, Fixed, 95% CI) | ‐0.02 [‐1.42, 1.38] |
| 13.1 24 weeks | 2 | 545 | Mean Difference (IV, Fixed, 95% CI) | ‐0.07 [‐2.21, 2.06] |
| 13.2 48‐52 weeks | 2 | 622 | Mean Difference (IV, Fixed, 95% CI) | 0.02 [‐1.83, 1.88] |
| 14 SF‐36 MCS (=or>MCID of 6.33) Show forest plot | 2 | Risk Ratio (M‐H, Fixed, 95% CI) | Subtotals only | |
| 14.1 48‐52 weeks | 2 | 705 | Risk Ratio (M‐H, Fixed, 95% CI) | 1.06 [0.92, 1.23] |
| 15 FACIT‐F Show forest plot | 4 | 1218 | Mean Difference (IV, Fixed, 95% CI) | 1.04 [‐0.11, 2.18] |
| 15.1 24 weeks | 2 | 578 | Mean Difference (IV, Fixed, 95% CI) | 0.83 [‐0.87, 2.53] |
| 15.2 48‐54 weeks | 2 | 640 | Mean Difference (IV, Fixed, 95% CI) | 1.21 [‐0.34, 2.77] |
| 16 FACIT‐F (=or>MCID of 3.5) Show forest plot | 2 | 461 | Risk Ratio (M‐H, Fixed, 95% CI) | 1.19 [1.03, 1.38] |
| 16.1 24 weeks | 1 | 245 | Risk Ratio (M‐H, Fixed, 95% CI) | 1.19 [0.97, 1.46] |
| 16.2 48 weeks | 1 | 216 | Risk Ratio (M‐H, Fixed, 95% CI) | 1.20 [0.98, 1.47] |
| 17 VAS Pain Show forest plot | 2 | Mean Difference (IV, Fixed, 95% CI) | Subtotals only | |
| 17.1 52 weeks | 2 | 671 | Mean Difference (IV, Fixed, 95% CI) | ‐2.30 [‐6.62, 2.02] |
| 18 Total radiographic score Show forest plot | 1 | Mean Difference (IV, Fixed, 95% CI) | Subtotals only | |
| 18.1 24 weeks | 1 | 483 | Mean Difference (IV, Fixed, 95% CI) | 0.25 [‐0.09, 0.59] |
| 18.2 52 weeks | 1 | 483 | Mean Difference (IV, Fixed, 95% CI) | 0.29 [‐0.05, 0.63] |
| 18.3 104 weeks | 1 | 483 | Mean Difference (IV, Fixed, 95% CI) | 0.35 [0.01, 0.69] |
| 19 Joint space narrowing Show forest plot | 1 | Mean Difference (IV, Fixed, 95% CI) | Subtotals only | |
| 19.1 24 weeks | 1 | 480 | Mean Difference (IV, Fixed, 95% CI) | 0.07 [‐0.07, 0.21] |
| 19.2 104 weeks | 1 | 483 | Mean Difference (IV, Fixed, 95% CI) | 0.08 [‐0.06, 0.22] |
| 20 Radiographic erosions Show forest plot | 1 | Mean Difference (IV, Fixed, 95% CI) | Subtotals only | |
| 20.1 24 weeks | 1 | 480 | Mean Difference (IV, Fixed, 95% CI) | 0.18 [‐0.05, 0.41] |
| 20.2 52 weeks | 1 | 483 | Mean Difference (IV, Fixed, 95% CI) | 0.22 [‐0.01, 0.45] |
| 20.3 104 weeks | 1 | 483 | Mean Difference (IV, Fixed, 95% CI) | 0.27 [0.04, 0.50] |
| 21 No radiographic progression Show forest plot | 1 | Risk Ratio (M‐H, Fixed, 95% CI) | Subtotals only | |
| 21.1 24 weeks | 1 | 483 | Risk Ratio (M‐H, Fixed, 95% CI) | 1.10 [0.97, 1.25] |
| 21.2 52 weeks | 1 | 483 | Risk Ratio (M‐H, Fixed, 95% CI) | 1.10 [0.95, 1.27] |
| 21.3 104 weeks | 1 | 483 | Risk Ratio (M‐H, Fixed, 95% CI) | 1.16 [0.98, 1.38] |
| 22 No worsening of erosions Show forest plot | 1 | Risk Ratio (M‐H, Fixed, 95% CI) | Subtotals only | |
| 22.1 104 weeks | 1 | 483 | Risk Ratio (M‐H, Fixed, 95% CI) | 1.11 [0.95, 1.30] |
| 23 Total discontinuations Show forest plot | 4 | Risk Ratio (M‐H, Random, 95% CI) | Subtotals only | |
| 23.1 24 weeks | 2 | 656 | Risk Ratio (M‐H, Random, 95% CI) | 1.40 [0.79, 2.47] |
| 23.2 48‐52 weeks | 3 | 1093 | Risk Ratio (M‐H, Random, 95% CI) | 0.73 [0.34, 1.58] |
| 23.3 104 weeks | 1 | 499 | Risk Ratio (M‐H, Random, 95% CI) | 1.00 [0.65, 1.52] |
| 24 Discontinuation due to lack of efficacy Show forest plot | 4 | 1749 | Risk Ratio (M‐H, Fixed, 95% CI) | 0.73 [0.41, 1.29] |
| 24.1 24 weeks | 2 | 656 | Risk Ratio (M‐H, Fixed, 95% CI) | 1.16 [0.53, 2.53] |
| 24.2 48‐52 weeks | 3 | 1093 | Risk Ratio (M‐H, Fixed, 95% CI) | 0.42 [0.17, 1.03] |
| 25 Discontinuations due to adverse Events Show forest plot | 4 | Risk Ratio (M‐H, Random, 95% CI) | Subtotals only | |
| 25.1 24 weeks | 2 | 656 | Risk Ratio (M‐H, Random, 95% CI) | 1.35 [0.46, 4.00] |
| 25.2 48‐52 weeks | 3 | 1093 | Risk Ratio (M‐H, Random, 95% CI) | 0.94 [0.25, 3.45] |
| 25.3 104 weeks | 1 | 499 | Risk Ratio (M‐H, Random, 95% CI) | 0.80 [0.32, 1.99] |
| 26 Discontinuations due to other reasons Show forest plot | 4 | Risk Ratio (M‐H, Fixed, 95% CI) | Subtotals only | |
| 26.1 24 weeks | 2 | 656 | Risk Ratio (M‐H, Fixed, 95% CI) | 2.00 [0.55, 7.30] |
| 26.2 48‐52 weeks | 3 | 1693 | Risk Ratio (M‐H, Fixed, 95% CI) | 1.17 [0.68, 1.99] |
| 27 Any Adverse Event Show forest plot | 4 | Risk Ratio (M‐H, Fixed, 95% CI) | Subtotals only | |
| 27.1 24 weeks | 2 | 653 | Risk Ratio (M‐H, Fixed, 95% CI) | 1.03 [0.95, 1.11] |
| 27.2 48‐52 weeks | 3 | 1062 | Risk Ratio (M‐H, Fixed, 95% CI) | 1.01 [0.95, 1.06] |
| 27.3 104 weeks | 1 | 499 | Risk Ratio (M‐H, Fixed, 95% CI) | 1.05 [0.97, 1.13] |
| 28 Serious Adverse Events Show forest plot | 4 | Risk Ratio (M‐H, Random, 95% CI) | Subtotals only | |
| 28.1 24 weeks | 2 | 653 | Risk Ratio (M‐H, Random, 95% CI) | 1.48 [0.57, 3.82] |
| 28.2 48‐52 weeks | 3 | 1062 | Risk Ratio (M‐H, Random, 95% CI) | 1.24 [0.87, 1.77] |
| 28.3 104 weeks | 1 | 499 | Risk Ratio (M‐H, Random, 95% CI) | 0.89 [0.57, 1.37] |
| 29 Infections Show forest plot | 4 | Risk Ratio (M‐H, Random, 95% CI) | Subtotals only | |
| 29.1 24 weeks | 2 | 653 | Risk Ratio (M‐H, Random, 95% CI) | 0.93 [0.76, 1.13] |
| 29.2 48‐52 weeks | 3 | 1062 | Risk Ratio (M‐H, Random, 95% CI) | 1.00 [0.86, 1.17] |
| 29.3 104 weeks | 1 | 499 | Risk Ratio (M‐H, Random, 95% CI) | 0.98 [0.86, 1.12] |
| 30 Serious Infections Show forest plot | 4 | Risk Ratio (M‐H, Fixed, 95% CI) | Subtotals only | |
| 30.1 24 weeks | 2 | 653 | Risk Ratio (M‐H, Fixed, 95% CI) | 1.49 [0.38, 5.86] |
| 30.2 48‐56 weeks | 3 | 1062 | Risk Ratio (M‐H, Fixed, 95% CI) | 1.08 [0.50, 2.34] |
| 30.3 104 weeks | 1 | 499 | Risk Ratio (M‐H, Fixed, 95% CI) | 0.92 [0.43, 1.98] |
| 31 Death Show forest plot | 4 | Risk Ratio (M‐H, Fixed, 95% CI) | Subtotals only | |
| 31.1 24 weeks | 2 | 653 | Risk Ratio (M‐H, Fixed, 95% CI) | 0.22 [0.01, 5.26] |
| 31.2 48‐52 weeks | 3 | 1062 | Risk Ratio (M‐H, Fixed, 95% CI) | 0.20 [0.01, 4.06] |
| 31.3 104 weeks | 1 | 499 | Risk Ratio (M‐H, Fixed, 95% CI) | 0.50 [0.05, 5.46] |
| 32 Arthralgia Show forest plot | 1 | Risk Ratio (M‐H, Fixed, 95% CI) | Subtotals only | |
| 32.1 24 weeks | 1 | 316 | Risk Ratio (M‐H, Fixed, 95% CI) | 1.42 [0.51, 3.99] |
| 33 Cardiac event (any) Show forest plot | 2 | Risk Ratio (M‐H, Fixed, 95% CI) | Subtotals only | |
| 33.1 24 weeks | 1 | 337 | Risk Ratio (M‐H, Fixed, 95% CI) | 1.38 [0.45, 4.25] |
| 33.2 48‐52 weeks | 2 | 835 | Risk Ratio (M‐H, Fixed, 95% CI) | 1.44 [0.68, 3.06] |
| 34 Cardiac event (Serious) Show forest plot | 2 | Risk Ratio (M‐H, Fixed, 95% CI) | Subtotals only | |
| 34.1 24 weeks | 1 | 337 | Risk Ratio (M‐H, Fixed, 95% CI) | 0.49 [0.04, 5.37] |
| 34.2 48‐52 weeks | 2 | 835 | Risk Ratio (M‐H, Fixed, 95% CI) | 0.99 [0.25, 3.94] |
| 35 Diarrhea Show forest plot | 1 | Risk Ratio (M‐H, Fixed, 95% CI) | Subtotals only | |
| 35.1 24 weeks | 1 | 316 | Risk Ratio (M‐H, Fixed, 95% CI) | 0.55 [0.19, 1.61] |
| 36 Exacerbation of RA Show forest plot | 2 | 814 | Risk Ratio (M‐H, Fixed, 95% CI) | 0.91 [0.55, 1.51] |
| 36.1 24 weeks | 1 | 316 | Risk Ratio (M‐H, Fixed, 95% CI) | 0.83 [0.49, 1.40] |
| 36.2 52 weeks | 1 | 498 | Risk Ratio (M‐H, Fixed, 95% CI) | 5.0 [0.24, 103.62] |
| 37 Fatigue Show forest plot | 1 | Risk Ratio (M‐H, Fixed, 95% CI) | Subtotals only | |
| 37.1 24 weeks | 1 | 316 | Risk Ratio (M‐H, Fixed, 95% CI) | 1.03 [0.35, 3.09] |
| 38 HACA Show forest plot | 2 | Risk Ratio (M‐H, Fixed, 95% CI) | Subtotals only | |
| 38.1 24 weeks | 2 | 543 | Risk Ratio (M‐H, Fixed, 95% CI) | 0.53 [0.20, 1.38] |
| 39 Hypertension Show forest plot | 1 | Risk Ratio (M‐H, Fixed, 95% CI) | Subtotals only | |
| 39.1 24 weeks | 1 | 316 | Risk Ratio (M‐H, Fixed, 95% CI) | 1.55 [0.56, 4.29] |
| 40 Infusion‐related reactions (1st course ‐1st infusion) Show forest plot | 4 | Risk Ratio (M‐H, Fixed, 95% CI) | Subtotals only | |
| 40.1 24 weeks | 2 | 653 | Risk Ratio (M‐H, Fixed, 95% CI) | 1.35 [1.02, 1.78] |
| 40.2 48‐56 weeks | 3 | 1062 | Risk Ratio (M‐H, Fixed, 95% CI) | 1.02 [0.79, 1.33] |
| 40.3 104 weeks | 1 | 499 | Risk Ratio (M‐H, Fixed, 95% CI) | 1.31 [0.87, 1.96] |
| 41 Infusion‐related reaction (1st course ‐2nd infusion) Show forest plot | 2 | Risk Ratio (M‐H, Fixed, 95% CI) | Subtotals only | |
| 41.1 24 weeks | 2 | 582 | Risk Ratio (M‐H, Fixed, 95% CI) | 1.04 [0.59, 1.85] |
| 42 Infusion‐related reaction (2nd course) Show forest plot | 3 | Risk Ratio (M‐H, Fixed, 95% CI) | Subtotals only | |
| 42.1 48‐52 weeks | 3 | 1062 | Risk Ratio (M‐H, Fixed, 95% CI) | 1.16 [0.79, 1.70] |
| 42.2 104 weeks | 1 | 499 | Risk Ratio (M‐H, Fixed, 95% CI) | 1.05 [0.58, 1.88] |
| 43 Infusion‐related reaction (3rd course) Show forest plot | 1 | Risk Ratio (M‐H, Fixed, 95% CI) | Subtotals only | |
| 43.1 52 weeks | 1 | 498 | Risk Ratio (M‐H, Fixed, 95% CI) | 4.5 [0.98, 20.62] |
| 43.2 104 weeks | 1 | 499 | Risk Ratio (M‐H, Fixed, 95% CI) | 1.09 [0.49, 2.42] |
| 44 Infusion‐related reaction (4th course) Show forest plot | 1 | Risk Ratio (M‐H, Fixed, 95% CI) | Subtotals only | |
| 44.1 104 weeks | 1 | 499 | Risk Ratio (M‐H, Fixed, 95% CI) | 0.80 [0.32, 1.99] |
| 45 Infusion‐related reaction (5th course) Show forest plot | 1 | Risk Ratio (M‐H, Fixed, 95% CI) | Subtotals only | |
| 45.1 104 weeks | 1 | 499 | Risk Ratio (M‐H, Fixed, 95% CI) | 2.99 [0.31, 28.53] |
| 46 Lower gastrointestinal events Show forest plot | 1 | Risk Ratio (M‐H, Fixed, 95% CI) | Subtotals only | |
| 46.1 24 weeks | 1 | 337 | Risk Ratio (M‐H, Fixed, 95% CI) | 0.98 [0.51, 1.90] |
| 46.2 48 weeks | 1 | 337 | Risk Ratio (M‐H, Fixed, 95% CI) | 1.12 [0.65, 1.94] |
| 47 Malignancy Show forest plot | 3 | Risk Ratio (M‐H, Fixed, 95% CI) | Subtotals only | |
| 47.1 24 weeks | 1 | 337 | Risk Ratio (M‐H, Fixed, 95% CI) | 1.96 [0.18, 21.46] |
| 47.2 48‐52 weeks | 3 | 1062 | Risk Ratio (M‐H, Fixed, 95% CI) | 1.09 [0.27, 4.31] |
| 47.3 104 weeks | 1 | 499 | Risk Ratio (M‐H, Fixed, 95% CI) | 0.50 [0.13, 1.97] |
| 48 Pneumonia Show forest plot | 1 | Risk Ratio (M‐H, Fixed, 95% CI) | Subtotals only | |
| 48.1 52 weeks | 1 | 498 | Risk Ratio (M‐H, Fixed, 95% CI) | 0.33 [0.01, 8.14] |
| 49 Urinary tract infection Show forest plot | 1 | Risk Ratio (M‐H, Fixed, 95% CI) | Subtotals only | |
| 49.1 52 weeks | 1 | 499 | Risk Ratio (M‐H, Fixed, 95% CI) | 0.20 [0.01, 4.16] |
| 50 Vascular disorders Show forest plot | 2 | Risk Ratio (M‐H, Fixed, 95% CI) | Subtotals only | |
| 50.1 24 weeks | 1 | 337 | Risk Ratio (M‐H, Fixed, 95% CI) | 1.15 [0.39, 3.34] |
| 50.2 48‐52 weeks | 2 | 835 | Risk Ratio (M‐H, Fixed, 95% CI) | 0.96 [0.59, 1.57] |
| Outcome or subgroup title | No. of studies | No. of participants | Statistical method | Effect size |
| 1 ACR 20 Show forest plot | 1 | Risk Ratio (M‐H, Fixed, 95% CI) | Subtotals only | |
| 1.1 24 weeks | 1 | 81 | Risk Ratio (M‐H, Fixed, 95% CI) | 1.04 [0.81, 1.35] |
| 1.2 48 weeks | 1 | 81 | Risk Ratio (M‐H, Fixed, 95% CI) | 0.72 [0.49, 1.06] |
| 1.3 104 weeks | 1 | 81 | Risk Ratio (M‐H, Fixed, 95% CI) | 0.38 [0.15, 0.96] |
| 2 ACR 50 Show forest plot | 1 | Risk Ratio (M‐H, Fixed, 95% CI) | Subtotals only | |
| 2.1 24 weeks | 1 | 81 | Risk Ratio (M‐H, Fixed, 95% CI) | 0.98 [0.58, 1.63] |
| 2.2 48 weeks | 1 | 81 | Risk Ratio (M‐H, Fixed, 95% CI) | 0.77 [0.40, 1.48] |
| 2.3 104 weeks | 1 | 81 | Risk Ratio (M‐H, Fixed, 95% CI) | 0.49 [0.16, 1.49] |
| 3 ACR 70 Show forest plot | 1 | Risk Ratio (M‐H, Fixed, 95% CI) | Subtotals only | |
| 3.1 24 weeks | 1 | 81 | Risk Ratio (M‐H, Fixed, 95% CI) | 0.65 [0.25, 1.66] |
| 3.2 48 weeks | 1 | 81 | Risk Ratio (M‐H, Fixed, 95% CI) | 0.65 [0.20, 2.13] |
| 3.3 104 weeks | 1 | 81 | Risk Ratio (M‐H, Fixed, 95% CI) | 0.73 [0.17, 3.06] |
| 4 DAS 28 Show forest plot | 1 | Mean Difference (IV, Fixed, 95% CI) | Subtotals only | |
| 4.1 24 weeks | 1 | 81 | Mean Difference (IV, Fixed, 95% CI) | 0.0 [‐0.61, 0.61] |
| 5 Moderate or good EULAR response Show forest plot | 1 | Risk Ratio (M‐H, Fixed, 95% CI) | Subtotals only | |
| 5.1 24 weeks | 1 | 81 | Risk Ratio (M‐H, Fixed, 95% CI) | 1.03 [0.85, 1.25] |
| 6 HAQ‐DI Show forest plot | 1 | Mean Difference (IV, Fixed, 95% CI) | Subtotals only | |
| 6.1 24 weeks | 1 | 76 | Mean Difference (IV, Fixed, 95% CI) | 0.0 [‐0.29, 0.29] |
| 6.2 48 weeks | 1 | 72 | Mean Difference (IV, Fixed, 95% CI) | 0.3 [0.01, 0.59] |
| 6.3 72 weeks | 1 | 50 | Mean Difference (IV, Fixed, 95% CI) | 0.5 [0.15, 0.85] |
| 7 HAQ‐DI MCID=‐0.22 Show forest plot | 1 | Risk Ratio (M‐H, Fixed, 95% CI) | Subtotals only | |
| 7.1 24 weeks | 1 | 76 | Risk Ratio (M‐H, Fixed, 95% CI) | 0.93 [0.65, 1.32] |
| 7.2 48 weeks | 1 | 72 | Risk Ratio (M‐H, Fixed, 95% CI) | 0.56 [0.35, 0.90] |
| 7.3 72 weeks | 1 | 50 | Risk Ratio (M‐H, Fixed, 95% CI) | 0.49 [0.21, 1.17] |
| 7.4 104 weeks | 1 | 27 | Risk Ratio (M‐H, Fixed, 95% CI) | 0.4 [0.05, 2.93] |
| 8 Total discontinuations Show forest plot | 1 | Risk Ratio (M‐H, Fixed, 95% CI) | Subtotals only | |
| 8.1 24 weeks | 1 | 81 | Risk Ratio (M‐H, Fixed, 95% CI) | 3.90 [0.46, 33.42] |
| 8.2 48 weeks | 1 | 81 | Risk Ratio (M‐H, Fixed, 95% CI) | 3.41 [0.75, 15.46] |
| 8.3 72 weeks | 1 | 81 | Risk Ratio (M‐H, Fixed, 95% CI) | 1.54 [0.87, 2.75] |
| 8.4 104 weeks | 1 | 81 | Risk Ratio (M‐H, Fixed, 95% CI) | 1.42 [1.03, 1.96] |
| 9 Withdrawals due to lack of efficacy Show forest plot | 1 | Risk Ratio (M‐H, Fixed, 95% CI) | Subtotals only | |
| 9.1 24 weeks | 1 | 81 | Risk Ratio (M‐H, Fixed, 95% CI) | 0.0 [0.0, 0.0] |
| 9.2 48 weeks | 1 | 81 | Risk Ratio (M‐H, Fixed, 95% CI) | 1.95 [0.18, 20.68] |
| 9.3 72 weeks | 1 | 81 | Risk Ratio (M‐H, Fixed, 95% CI) | 0.98 [0.26, 3.64] |
| 9.4 104 weeks | 1 | 81 | Risk Ratio (M‐H, Fixed, 95% CI) | 0.98 [0.26, 3.64] |
| 10 Withdrawals due to adverse events Show forest plot | 1 | Risk Ratio (M‐H, Fixed, 95% CI) | Subtotals only | |
| 10.1 24 weeks | 1 | 81 | Risk Ratio (M‐H, Fixed, 95% CI) | 1.95 [0.18, 20.68] |
| 10.2 48 weeks | 1 | 81 | Risk Ratio (M‐H, Fixed, 95% CI) | 1.95 [0.18, 20.68] |
| 10.3 72 weeks | 1 | 81 | Risk Ratio (M‐H, Fixed, 95% CI) | 3.90 [0.46, 33.42] |
| 10.4 104 weeks | 1 | 81 | Risk Ratio (M‐H, Fixed, 95% CI) | 3.90 [0.46, 33.42] |
| 11 Withdrawals due to other reasons Show forest plot | 1 | Risk Ratio (M‐H, Fixed, 95% CI) | Subtotals only | |
| 11.1 24 weeks | 1 | 81 | Risk Ratio (M‐H, Fixed, 95% CI) | 4.88 [0.24, 98.60] |
| 11.2 48 weeks | 1 | 81 | Risk Ratio (M‐H, Fixed, 95% CI) | 6.83 [0.36, 128.20] |
| 11.3 72 weeks | 1 | 81 | Risk Ratio (M‐H, Fixed, 95% CI) | 1.53 [0.66, 3.56] |
| 11.4 104 weeks | 1 | 81 | Risk Ratio (M‐H, Fixed, 95% CI) | 1.43 [0.93, 2.22] |
| 12 Any Adverse Event Show forest plot | 1 | Risk Ratio (M‐H, Fixed, 95% CI) | Subtotals only | |
| 12.1 24 weeks | 1 | 81 | Risk Ratio (M‐H, Fixed, 95% CI) | 0.86 [0.69, 1.08] |
| 12.2 48‐56 weeks | 1 | 81 | Risk Ratio (M‐H, Fixed, 95% CI) | 0.98 [0.82, 1.16] |
| 13 Serious Adverse Events Show forest plot | 1 | Risk Ratio (M‐H, Fixed, 95% CI) | Subtotals only | |
| 13.1 24 weeks | 1 | 81 | Risk Ratio (M‐H, Fixed, 95% CI) | 1.95 [0.52, 7.27] |
| 13.2 48‐56 weeks | 1 | 81 | Risk Ratio (M‐H, Fixed, 95% CI) | 1.71 [0.54, 5.38] |
| 14 Serious Infections Show forest plot | 1 | Risk Ratio (M‐H, Fixed, 95% CI) | Subtotals only | |
| 14.1 24 weeks | 1 | 81 | Risk Ratio (M‐H, Fixed, 95% CI) | 4.88 [0.24, 98.60] |
| 14.2 48‐56 weeks | 1 | 81 | Risk Ratio (M‐H, Fixed, 95% CI) | 0.33 [0.01, 7.76] |
| 15 Exacerbation of RA Show forest plot | 1 | Risk Ratio (M‐H, Fixed, 95% CI) | Subtotals only | |
| 15.1 24 weeks | 1 | 81 | Risk Ratio (M‐H, Fixed, 95% CI) | 2.93 [0.63, 13.65] |
| 15.2 48‐56 weeks | 1 | 81 | Risk Ratio (M‐H, Fixed, 95% CI) | 0.0 [0.0, 0.0] |
| 16 Death Show forest plot | 1 | Risk Difference (M‐H, Fixed, 95% CI) | Subtotals only | |
| 16.1 24 weeks | 1 | 81 | Risk Difference (M‐H, Fixed, 95% CI) | 0.0 [‐0.05, 0.05] |
| 17 Any Event Associated with 1st Infusion Show forest plot | 1 | Risk Ratio (M‐H, Fixed, 95% CI) | Subtotals only | |
| 17.1 24 weeks | 1 | 81 | Risk Ratio (M‐H, Fixed, 95% CI) | 0.98 [0.52, 1.84] |
| 18 Arthralgia Show forest plot | 1 | Risk Ratio (M‐H, Fixed, 95% CI) | Subtotals only | |
| 18.1 24 weeks | 1 | 81 | Risk Ratio (M‐H, Fixed, 95% CI) | 0.24 [0.03, 2.09] |
| 19 Back pain Show forest plot | 1 | Risk Ratio (M‐H, Fixed, 95% CI) | Subtotals only | |
| 19.1 24 weeks | 1 | 81 | Risk Ratio (M‐H, Fixed, 95% CI) | 6.83 [0.36, 128.20] |
| 20 Cough Show forest plot | 1 | Risk Ratio (M‐H, Fixed, 95% CI) | Subtotals only | |
| 20.1 24 weeks | 1 | 81 | Risk Ratio (M‐H, Fixed, 95% CI) | 0.49 [0.05, 5.17] |
| 21 Dyspnea Show forest plot | 1 | Risk Difference (M‐H, Fixed, 95% CI) | Subtotals only | |
| 21.1 24 weeks | 1 | 81 | Risk Difference (M‐H, Fixed, 95% CI) | 0.0 [‐0.05, 0.05] |
| 22 Hypertension Show forest plot | 1 | Risk Ratio (M‐H, Fixed, 95% CI) | Subtotals only | |
| 22.1 24 weeks | 1 | 81 | Risk Ratio (M‐H, Fixed, 95% CI) | 0.29 [0.09, 0.99] |
| 23 Hypotension Show forest plot | 1 | Risk Ratio (M‐H, Fixed, 95% CI) | Subtotals only | |
| 23.1 24 weeks | 1 | 82 | Risk Ratio (M‐H, Fixed, 95% CI) | 1.71 [0.75, 3.91] |
| 24 Nasopharyngitis Show forest plot | 1 | Risk Ratio (M‐H, Fixed, 95% CI) | Subtotals only | |
| 24.1 24 weeks | 1 | 81 | Risk Ratio (M‐H, Fixed, 95% CI) | 0.49 [0.09, 2.52] |
| 25 Nausea Show forest plot | 1 | Risk Ratio (M‐H, Fixed, 95% CI) | Subtotals only | |
| 25.1 24 weeks | 1 | 81 | Risk Ratio (M‐H, Fixed, 95% CI) | 8.79 [0.49, 158.07] |
| 26 Pruritus Show forest plot | 1 | Risk Ratio (M‐H, Fixed, 95% CI) | Subtotals only | |
| 26.1 24 weeks | 1 | 81 | Risk Ratio (M‐H, Fixed, 95% CI) | 8.79 [0.49, 158.07] |
| 27 Rash Show forest plot | 1 | Risk Ratio (M‐H, Fixed, 95% CI) | Subtotals only | |
| 27.1 24 weeks | 1 | 81 | Risk Ratio (M‐H, Fixed, 95% CI) | 3.90 [0.46, 33.42] |
| 27.2 48 weeks | 1 | 81 | Risk Ratio (M‐H, Fixed, 95% CI) | 0.0 [0.0, 0.0] |
| Outcome or subgroup title | No. of studies | No. of participants | Statistical method | Effect size |
| 1 ACR 20 Show forest plot | 1 | Risk Ratio (M‐H, Fixed, 95% CI) | Subtotals only | |
| 1.1 24 weeks | 1 | 80 | Risk Ratio (M‐H, Fixed, 95% CI) | 1.12 [0.83, 1.50] |
| 1.2 48 weeks | 1 | 80 | Risk Ratio (M‐H, Fixed, 95% CI) | 2.0 [1.21, 3.30] |
| 1.3 104 weeks | 1 | 80 | Risk Ratio (M‐H, Fixed, 95% CI) | 4.33 [1.34, 14.05] |
| 2 ACR 50 Show forest plot | 1 | Risk Ratio (M‐H, Fixed, 95% CI) | Subtotals only | |
| 2.1 24 weeks | 1 | 80 | Risk Ratio (M‐H, Fixed, 95% CI) | 1.31 [0.74, 2.32] |
| 2.2 48 weeks | 1 | 80 | Risk Ratio (M‐H, Fixed, 95% CI) | 2.33 [1.00, 5.46] |
| 2.3 104 weeks | 1 | 80 | Risk Ratio (M‐H, Fixed, 95% CI) | 2.67 [0.76, 9.33] |
| 3 ACR 70 Show forest plot | 1 | Risk Ratio (M‐H, Fixed, 95% CI) | Subtotals only | |
| 3.1 24 weeks | 1 | 80 | Risk Ratio (M‐H, Fixed, 95% CI) | 1.5 [0.59, 3.82] |
| 3.2 48 weeks | 1 | 80 | Risk Ratio (M‐H, Fixed, 95% CI) | 2.0 [0.54, 7.45] |
| 3.3 104 weeks | 1 | 80 | Risk Ratio (M‐H, Fixed, 95% CI) | 4.0 [0.47, 34.24] |
| 4 DAS 28 Show forest plot | 2 | Mean Difference (IV, Fixed, 95% CI) | Subtotals only | |
| 4.1 16‐24 weeks | 2 | 120 | Mean Difference (IV, Fixed, 95% CI) | ‐1.06 [‐1.76, ‐0.36] |
| 5 Moderate or good EULAR response Show forest plot | 2 | Risk Ratio (M‐H, Fixed, 95% CI) | Subtotals only | |
| 5.1 16‐24 weeks | 2 | 120 | Risk Ratio (M‐H, Fixed, 95% CI) | 1.04 [0.88, 1.23] |
| 5.2 104 weeks | 1 | 80 | Risk Ratio (M‐H, Fixed, 95% CI) | 3.25 [1.16, 9.12] |
| 6 HAQ‐DI Show forest plot | 1 | Mean Difference (IV, Fixed, 95% CI) | Subtotals only | |
| 6.1 24 weeks | 1 | 80 | Mean Difference (IV, Fixed, 95% CI) | 0.20 [‐0.06, 0.46] |
| 6.2 48 weeks | 1 | 80 | Mean Difference (IV, Fixed, 95% CI) | ‐0.10 [‐0.36, 0.16] |
| 6.3 72 weeks | 1 | 80 | Mean Difference (IV, Fixed, 95% CI) | 0.0 [‐0.26, 0.26] |
| 7 HAQ‐DI MCID=‐0.22 Show forest plot | 1 | Risk Ratio (M‐H, Fixed, 95% CI) | Subtotals only | |
| 7.1 24 weeks | 1 | 77 | Risk Ratio (M‐H, Fixed, 95% CI) | 0.94 [0.68, 1.29] |
| 7.2 48 weeks | 1 | 69 | Risk Ratio (M‐H, Fixed, 95% CI) | 1.63 [1.02, 2.60] |
| 7.3 72 weeks | 1 | 45 | Risk Ratio (M‐H, Fixed, 95% CI) | 2.63 [0.87, 7.91] |
| 7.4 104 weeks | 1 | 22 | Risk Ratio (M‐H, Fixed, 95% CI) | 1.11 [0.17, 7.09] |
| 8 Total discontinuations Show forest plot | 1 | Risk Ratio (M‐H, Fixed, 95% CI) | Subtotals only | |
| 8.1 24 weeks | 1 | 80 | Risk Ratio (M‐H, Fixed, 95% CI) | 0.5 [0.05, 5.30] |
| 8.2 48 weeks | 1 | 80 | Risk Ratio (M‐H, Fixed, 95% CI) | 0.22 [0.05, 0.96] |
| 8.3 72 weeks | 1 | 80 | Risk Ratio (M‐H, Fixed, 95% CI) | 0.52 [0.30, 0.90] |
| 8.4 104 weeks | 1 | 80 | Risk Ratio (M‐H, Fixed, 95% CI) | 0.61 [0.45, 0.82] |
| 9 Withdrawals due to lack of efficacy Show forest plot | 1 | Risk Ratio (M‐H, Fixed, 95% CI) | Subtotals only | |
| 9.1 24 weeks | 1 | 80 | Risk Ratio (M‐H, Fixed, 95% CI) | 0.0 [0.0, 0.0] |
| 9.2 48 weeks | 1 | 80 | Risk Ratio (M‐H, Fixed, 95% CI) | 0.5 [0.05, 5.30] |
| 9.3 72 weeks | 1 | 80 | Risk Ratio (M‐H, Fixed, 95% CI) | 1.33 [0.32, 5.58] |
| 9.4 104 weeks | 1 | 80 | Risk Ratio (M‐H, Fixed, 95% CI) | 0.8 [0.23, 2.76] |
| 10 Withdrawals due to adverse Events Show forest plot | 1 | Risk Ratio (M‐H, Fixed, 95% CI) | Subtotals only | |
| 10.1 24 weeks | 1 | 80 | Risk Ratio (M‐H, Fixed, 95% CI) | 0.5 [0.05, 5.30] |
| 10.2 48 weeks | 1 | 80 | Risk Ratio (M‐H, Fixed, 95% CI) | 0.25 [0.03, 2.14] |
| 10.3 72 weeks | 1 | 80 | Risk Ratio (M‐H, Fixed, 95% CI) | 0.2 [0.02, 1.64] |
| 10.4 104 weeks | 1 | 80 | Risk Ratio (M‐H, Fixed, 95% CI) | 0.2 [0.02, 1.64] |
| 11 Withdrawals due to other reasons Show forest plot | 1 | Risk Ratio (M‐H, Fixed, 95% CI) | Subtotals only | |
| 11.1 24 weeks | 1 | 80 | Risk Ratio (M‐H, Fixed, 95% CI) | 0.0 [0.0, 0.0] |
| 11.2 48 weeks | 1 | 80 | Risk Ratio (M‐H, Fixed, 95% CI) | 0.14 [0.01, 2.68] |
| 11.3 72 weeks | 1 | 80 | Risk Ratio (M‐H, Fixed, 95% CI) | 0.47 [0.21, 1.02] |
| 11.4 104 weeks | 1 | 80 | Risk Ratio (M‐H, Fixed, 95% CI) | 0.65 [0.43, 1.00] |
| 12 Any Adverse Event Show forest plot | 1 | Risk Ratio (M‐H, Fixed, 95% CI) | Subtotals only | |
| 12.1 24 weeks | 1 | 80 | Risk Ratio (M‐H, Fixed, 95% CI) | 1.06 [0.87, 1.30] |
| 12.2 48‐56 weeks | 1 | 80 | Risk Ratio (M‐H, Fixed, 95% CI) | 0.97 [0.83, 1.14] |
| 13 Serious Adverse Events Show forest plot | 1 | Risk Ratio (M‐H, Fixed, 95% CI) | Subtotals only | |
| 13.1 24 weeks | 1 | 80 | Risk Ratio (M‐H, Fixed, 95% CI) | 1.5 [0.26, 8.50] |
| 13.2 48‐56 weeks | 1 | 80 | Risk Ratio (M‐H, Fixed, 95% CI) | 1.0 [0.27, 3.72] |
| 14 Serious Infections Show forest plot | 2 | Risk Ratio (M‐H, Fixed, 95% CI) | Subtotals only | |
| 14.1 16‐24 weeks | 2 | 120 | Risk Ratio (M‐H, Fixed, 95% CI) | 0.33 [0.05, 2.03] |
| 14.2 48‐56 weeks | 1 | 80 | Risk Ratio (M‐H, Fixed, 95% CI) | 1.0 [0.06, 15.44] |
| 15 Death Show forest plot | 1 | Risk Ratio (M‐H, Fixed, 95% CI) | Subtotals only | |
| 15.1 24 weeks | 1 | 80 | Risk Ratio (M‐H, Fixed, 95% CI) | 0.33 [0.01, 7.95] |
| 16 Any Event Associated with 1st Infusion Show forest plot | 2 | Risk Ratio (M‐H, Fixed, 95% CI) | Subtotals only | |
| 16.1 16‐24 weeks | 2 | 120 | Risk Ratio (M‐H, Fixed, 95% CI) | 0.8 [0.47, 1.36] |
| 17 Arthralgia Show forest plot | 1 | Risk Ratio (M‐H, Fixed, 95% CI) | Subtotals only | |
| 17.1 24 weeks | 1 | 80 | Risk Ratio (M‐H, Fixed, 95% CI) | 1.33 [0.32, 5.58] |
| 18 Back pain Show forest plot | 1 | Risk Ratio (M‐H, Fixed, 95% CI) | Subtotals only | |
| 18.1 24 weeks | 1 | 80 | Risk Ratio (M‐H, Fixed, 95% CI) | 0.11 [0.01, 2.00] |
| 19 Cough Show forest plot | 1 | Risk Ratio (M‐H, Fixed, 95% CI) | Subtotals only | |
| 19.1 24 weeks | 1 | 80 | Risk Ratio (M‐H, Fixed, 95% CI) | 0.4 [0.08, 1.94] |
| 20 Dyspnea Show forest plot | 1 | Risk Ratio (M‐H, Fixed, 95% CI) | Subtotals only | |
| 20.1 24 weeks | 1 | 80 | Risk Ratio (M‐H, Fixed, 95% CI) | 0.11 [0.01, 2.00] |
| 21 Exacerbation of RA Show forest plot | 1 | Risk Ratio (M‐H, Fixed, 95% CI) | Subtotals only | |
| 21.1 24 weeks | 1 | 80 | Risk Ratio (M‐H, Fixed, 95% CI) | 0.33 [0.07, 1.55] |
| 21.2 48‐56 weeks | 1 | 80 | Risk Ratio (M‐H, Fixed, 95% CI) | 0.33 [0.01, 7.95] |
| 22 Hypertension Show forest plot | 1 | Risk Ratio (M‐H, Fixed, 95% CI) | Subtotals only | |
| 22.1 24 weeks | 1 | 80 | Risk Ratio (M‐H, Fixed, 95% CI) | 1.67 [0.67, 4.15] |
| 23 Hypotension Show forest plot | 1 | Risk Ratio (M‐H, Fixed, 95% CI) | Subtotals only | |
| 23.1 24 weeks | 1 | 80 | Risk Ratio (M‐H, Fixed, 95% CI) | 0.58 [0.26, 1.33] |
| 24 Nasopharyngitis Show forest plot | 1 | Risk Ratio (M‐H, Fixed, 95% CI) | Subtotals only | |
| 24.1 24 weeks | 1 | 80 | Risk Ratio (M‐H, Fixed, 95% CI) | 1.0 [0.27, 3.72] |
| 25 Nausea Show forest plot | 1 | Risk Ratio (M‐H, Fixed, 95% CI) | Subtotals only | |
| 25.1 24 weeks | 1 | 80 | Risk Ratio (M‐H, Fixed, 95% CI) | 0.2 [0.01, 4.04] |
| 26 Pruritus Show forest plot | 1 | Risk Ratio (M‐H, Fixed, 95% CI) | Subtotals only | |
| 26.1 24 weeks | 1 | 80 | Risk Ratio (M‐H, Fixed, 95% CI) | 0.11 [0.01, 2.00] |
| 27 Rash Show forest plot | 1 | Risk Ratio (M‐H, Fixed, 95% CI) | Subtotals only | |
| 27.1 24 weeks | 1 | 80 | Risk Ratio (M‐H, Fixed, 95% CI) | 0.25 [0.03, 2.14] |
| 27.2 48 weeks | 1 | 80 | Risk Ratio (M‐H, Fixed, 95% CI) | 0.33 [0.01, 7.95] |
| Outcome or subgroup title | No. of studies | No. of participants | Statistical method | Effect size |
| 1 ACR 20 Show forest plot | 1 | Risk Ratio (M‐H, Fixed, 95% CI) | Subtotals only | |
| 1.1 24 weeks | 1 | 81 | Risk Ratio (M‐H, Fixed, 95% CI) | 1.16 [0.87, 1.55] |
| 1.2 48 weeks | 1 | 81 | Risk Ratio (M‐H, Fixed, 95% CI) | 1.50 [0.87, 2.59] |
| 1.3 104 weeks | 1 | 81 | Risk Ratio (M‐H, Fixed, 95% CI) | 1.63 [0.42, 6.36] |
| 2 ACR 50 Show forest plot | 1 | Risk Ratio (M‐H, Fixed, 95% CI) | Subtotals only | |
| 2.1 24 weeks | 1 | 81 | Risk Ratio (M‐H, Fixed, 95% CI) | 1.28 [0.72, 2.27] |
| 2.2 48 weeks | 1 | 81 | Risk Ratio (M‐H, Fixed, 95% CI) | 1.79 [0.73, 4.37] |
| 2.3 104 weeks | 1 | 81 | Risk Ratio (M‐H, Fixed, 95% CI) | 1.30 [0.31, 5.45] |
| 3 ACR 70 Show forest plot | 1 | Risk Ratio (M‐H, Fixed, 95% CI) | Subtotals only | |
| 3.1 24 weeks | 1 | 81 | Risk Ratio (M‐H, Fixed, 95% CI) | 0.98 [0.34, 2.77] |
| 3.2 48 weeks | 1 | 81 | Risk Ratio (M‐H, Fixed, 95% CI) | 1.30 [0.31, 5.45] |
| 3.3 104 weeks | 1 | 81 | Risk Ratio (M‐H, Fixed, 95% CI) | 2.93 [0.32, 26.97] |
| 4 DAS 28 Show forest plot | 1 | Mean Difference (IV, Fixed, 95% CI) | Subtotals only | |
| 4.1 24 weeks | 1 | 81 | Mean Difference (IV, Fixed, 95% CI) | ‐0.40 [‐1.03, 0.23] |
| 5 Moderate or good EULAR response Show forest plot | 1 | Risk Ratio (M‐H, Fixed, 95% CI) | Subtotals only | |
| 5.1 24 weeks | 1 | 81 | Risk Ratio (M‐H, Fixed, 95% CI) | 1.00 [0.84, 1.20] |
| 6 HAQ‐DI Show forest plot | 1 | Mean Difference (IV, Fixed, 95% CI) | Subtotals only | |
| 6.1 24 weeks | 1 | 75 | Mean Difference (IV, Fixed, 95% CI) | 0.20 [‐0.08, 0.48] |
| 6.2 48 weeks | 1 | 65 | Mean Difference (IV, Fixed, 95% CI) | 0.2 [‐0.10, 0.50] |
| 6.3 72 weeks | 1 | 39 | Mean Difference (IV, Fixed, 95% CI) | 0.5 [0.12, 0.88] |
| 7 HAQ‐DI MCID=‐0.22 Show forest plot | 1 | Risk Ratio (M‐H, Fixed, 95% CI) | Subtotals only | |
| 7.1 24 weeks | 1 | 75 | Risk Ratio (M‐H, Fixed, 95% CI) | 0.87 [0.62, 1.22] |
| 7.2 48 weeks | 1 | 65 | Risk Ratio (M‐H, Fixed, 95% CI) | 0.91 [0.50, 1.65] |
| 7.3 72 weeks | 1 | 39 | Risk Ratio (M‐H, Fixed, 95% CI) | 1.29 [0.36, 4.65] |
| 7.4 104 weeks | 1 | 13 | Risk Ratio (M‐H, Fixed, 95% CI) | 0.44 [0.04, 5.46] |
| 8 Total discontinuations Show forest plot | 1 | Risk Ratio (M‐H, Fixed, 95% CI) | Subtotals only | |
| 8.1 24 weeks | 1 | 81 | Risk Ratio (M‐H, Fixed, 95% CI) | 1.95 [0.38, 10.06] |
| 8.2 48 weeks | 1 | 81 | Risk Ratio (M‐H, Fixed, 95% CI) | 0.76 [0.31, 1.84] |
| 8.3 72 weeks | 1 | 81 | Risk Ratio (M‐H, Fixed, 95% CI) | 0.81 [0.53, 1.23] |
| 8.4 104 weeks | 1 | 81 | Risk Ratio (M‐H, Fixed, 95% CI) | 0.87 [0.72, 1.05] |
| 9 Withdrawals due to lack of efficacy Show forest plot | 1 | Risk Ratio (M‐H, Fixed, 95% CI) | Subtotals only | |
| 9.1 24 weeks | 1 | 81 | Risk Ratio (M‐H, Fixed, 95% CI) | 0.0 [0.0, 0.0] |
| 9.2 48 weeks | 1 | 81 | Risk Ratio (M‐H, Fixed, 95% CI) | 0.98 [0.14, 6.59] |
| 9.3 72 weeks | 1 | 81 | Risk Ratio (M‐H, Fixed, 95% CI) | 1.30 [0.31, 5.45] |
| 9.4 104 weeks | 1 | 81 | Risk Ratio (M‐H, Fixed, 95% CI) | 0.78 [0.23, 2.70] |
| 10 Withdrawals due to adverse Events Show forest plot | 1 | Risk Ratio (M‐H, Fixed, 95% CI) | Subtotals only | |
| 10.1 24 weeks | 1 | 81 | Risk Ratio (M‐H, Fixed, 95% CI) | 0.98 [0.14, 6.59] |
| 10.2 48 weeks | 1 | 81 | Risk Ratio (M‐H, Fixed, 95% CI) | 0.49 [0.09, 2.52] |
| 10.3 72 weeks | 1 | 81 | Risk Ratio (M‐H, Fixed, 95% CI) | 0.78 [0.23, 2.70] |
| 10.4 104 weeks | 1 | 81 | Risk Ratio (M‐H, Fixed, 95% CI) | 0.78 [0.23, 2.70] |
| 11 Withdrawals due to other reasons Show forest plot | 1 | Risk Ratio (M‐H, Fixed, 95% CI) | Subtotals only | |
| 11.1 24 weeks | 1 | 81 | Risk Ratio (M‐H, Fixed, 95% CI) | 4.88 [0.24, 98.60] |
| 11.2 48 weeks | 1 | 81 | Risk Ratio (M‐H, Fixed, 95% CI) | 0.98 [0.21, 4.55] |
| 11.3 72 weeks | 1 | 81 | Risk Ratio (M‐H, Fixed, 95% CI) | 0.72 [0.38, 1.36] |
| 11.4 104 weeks | 1 | 81 | Risk Ratio (M‐H, Fixed, 95% CI) | 0.94 [0.67, 1.31] |
| 12 Any Adverse Event Show forest plot | 1 | Risk Ratio (M‐H, Fixed, 95% CI) | Subtotals only | |
| 12.1 24 weeks | 1 | 81 | Risk Ratio (M‐H, Fixed, 95% CI) | 0.91 [0.72, 1.16] |
| 12.2 48‐56 weeks | 1 | 81 | Risk Ratio (M‐H, Fixed, 95% CI) | 0.95 [0.81, 1.12] |
| 13 Serious Adverse Events Show forest plot | 1 | Risk Ratio (M‐H, Fixed, 95% CI) | Subtotals only | |
| 13.1 24 weeks | 1 | 81 | Risk Ratio (M‐H, Fixed, 95% CI) | 2.93 [0.63, 13.65] |
| 13.2 48‐56 weeks | 1 | 81 | Risk Ratio (M‐H, Fixed, 95% CI) | 1.71 [0.54, 5.38] |
| 14 Serious Infections Show forest plot | 1 | Risk Ratio (M‐H, Fixed, 95% CI) | Subtotals only | |
| 14.1 24 weeks | 1 | 81 | Risk Ratio (M‐H, Fixed, 95% CI) | 0.98 [0.14, 6.59] |
| 14.2 48‐56 weeks | 1 | 81 | Risk Ratio (M‐H, Fixed, 95% CI) | 0.33 [0.01, 7.76] |
| 15 Death Show forest plot | 1 | Risk Ratio (M‐H, Fixed, 95% CI) | Subtotals only | |
| 15.1 24 weeks | 1 | 81 | Risk Ratio (M‐H, Fixed, 95% CI) | 0.33 [0.01, 7.76] |
| 16 Any Event Associated with 1st Infusion Show forest plot | 1 | Risk Ratio (M‐H, Fixed, 95% CI) | Subtotals only | |
| 16.1 24 weeks | 1 | 81 | Risk Ratio (M‐H, Fixed, 95% CI) | 0.70 [0.40, 1.24] |
| 17 Arthralgia Show forest plot | 1 | Risk Ratio (M‐H, Fixed, 95% CI) | Subtotals only | |
| 17.1 24 weeks | 1 | 81 | Risk Ratio (M‐H, Fixed, 95% CI) | 0.33 [0.04, 3.00] |
| 18 Back pain Show forest plot | 1 | Risk Ratio (M‐H, Fixed, 95% CI) | Subtotals only | |
| 18.1 24 weeks | 1 | 81 | Risk Ratio (M‐H, Fixed, 95% CI) | 0.73 [0.17, 3.06] |
| 19 Cough Show forest plot | 1 | Risk Ratio (M‐H, Fixed, 95% CI) | Subtotals only | |
| 19.1 24 weeks | 1 | 81 | Risk Ratio (M‐H, Fixed, 95% CI) | 0.20 [0.02, 1.60] |
| 20 Dyspnea Show forest plot | 1 | Risk Ratio (M‐H, Fixed, 95% CI) | Subtotals only | |
| 20.1 24 weeks | 1 | 81 | Risk Ratio (M‐H, Fixed, 95% CI) | 0.11 [0.01, 1.95] |
| 21 Exacerbation of RA Show forest plot | 1 | Risk Ratio (M‐H, Fixed, 95% CI) | Subtotals only | |
| 21.1 24 weeks | 1 | 81 | Risk Ratio (M‐H, Fixed, 95% CI) | 0.98 [0.34, 2.77] |
| 21.2 48‐56 weeks | 1 | 81 | Risk Ratio (M‐H, Fixed, 95% CI) | 0.33 [0.01, 7.76] |
| 22 Hypertension Show forest plot | 1 | Risk Ratio (M‐H, Fixed, 95% CI) | Subtotals only | |
| 22.1 24 weeks | 1 | 81 | Risk Ratio (M‐H, Fixed, 95% CI) | 0.49 [0.13, 1.82] |
| 23 Hypotension Show forest plot | 1 | Risk Ratio (M‐H, Fixed, 95% CI) | Subtotals only | |
| 23.1 24 weeks | 1 | 81 | Risk Ratio (M‐H, Fixed, 95% CI) | 0.98 [0.50, 1.91] |
| 24 Nasopharyngitis Show forest plot | 1 | Risk Ratio (M‐H, Fixed, 95% CI) | Subtotals only | |
| 24.1 24 weeks | 1 | 81 | Risk Ratio (M‐H, Fixed, 95% CI) | 0.49 [0.09, 2.52] |
| 25 Nausea Show forest plot | 1 | Risk Ratio (M‐H, Fixed, 95% CI) | Subtotals only | |
| 25.1 24 weeks | 1 | 80 | Risk Ratio (M‐H, Fixed, 95% CI) | 2.0 [0.39, 10.31] |
| 26 Rash Show forest plot | 1 | Risk Ratio (M‐H, Fixed, 95% CI) | Subtotals only | |
| 26.1 24 weeks | 1 | 81 | Risk Ratio (M‐H, Fixed, 95% CI) | 0.98 [0.26, 3.64] |
| 26.2 48 weeks | 1 | 81 | Risk Ratio (M‐H, Fixed, 95% CI) | 0.33 [0.01, 7.76] |