Rituximab for rheumatoid arthritis
Information
- DOI:
- https://doi.org/10.1002/14651858.CD007356.pub2Copy DOI

- Database:
-
- Cochrane Database of Systematic Reviews
- Version published:
-
- 20 January 2015see what's new
- Type:
-
- Intervention
- Stage:
-
- Review
- Cochrane Editorial Group:
-
Cochrane Musculoskeletal Group
- Copyright:
-
- Copyright © 2015 The Cochrane Collaboration. Published by John Wiley & Sons, Ltd.
Article metrics
Altmetric:
Cited by:
Authors
Contributions of authors
Link with editorial base and co‐ordinate contributions from co‐authors (MSA)
Draft review (MLO, MAU, LM, MSA)
Run search (LF, GP)
Identify relevant titles and abstracts from searches (MLO, MAU, NP, SKM, PS)
Obtain copies of trials (MLO, NP)
Selection of trials (MLO, MAU, NP, MSA)
Extract data from trials (MLO, MAU, LM, SKM, PS)
Enter data into RevMan (MLO)
Carry out analysis (MLO, MSA)
Interpret data (MLO, MAU, LM, NP MSA)
Draft final review (MLO, MSA, NP, MAU)
Update review (MLO, LM, MSA)
Sources of support
Internal sources
-
University of Texas. MD Anderson Cancer Center, USA.
External sources
-
No sources of support supplied
Declarations of interest
Dr Suarez‐Almazor is the recipient of a K24 career award from the National Institute for Musculoskeletal and Skin Disorders.
Acknowledgements
The authors would like to thank Louis Falcon and Gregory Pratt who have kindly contributed to completing the search for this review. We also would like to acknowledge the contributions of Siva Kumar Muddana and Srikanth Puli to help in the cross‐checking of the data abstraction and quality appraisal of the included studies.
Version history
| Published | Title | Stage | Authors | Version |
| 2015 Jan 20 | Rituximab for rheumatoid arthritis | Review | Maria Angeles Lopez‐Olivo, Matxalen Amezaga Urruela, Lynda McGahan, Eduardo N Pollono, Maria E Suarez‐Almazor | |
| 2008 Oct 08 | Rituximab for rheumatoid arthritis | Protocol | Maria Angeles Lopez‐Olivo, Matxalen Amezaga, Lynda McGahan, Maria E Suarez‐Almazor | |
Differences between protocol and review
Eligibility criteria
-
The allowed minimum trial duration was changed from 6 months to 4 months.
-
The allowed minimum patient age was changed from 16 to 18 years.
-
The allowed doses of rituximab were changed from 300 mg/m2, 350 mg/m2, 500 mg/m2 and 600 mg/m2 to any dose.
Major outcomes
-
The list was modified to reflect the standard outcomes used in reviews from the Cochrane Musculoskeletal Group.
Search methods for identification of studies
-
Pharmaceutical companies that manufacture rituximab (Roche in Canada, Genetech and Biogen Idec in the USA) were not contacted.
-
Clinical trials registries and websites of the regulatory agencies were also searched.
Prioritisation of comparisons
Studies reported multiple comparisons (rituximab alone or combined) and doses. Due to the space limitations, we have prioritised reporting of rituximab (two 1000 mg doses) in combination with methotrexate since this is the most commonly use combination and approved dose. We also report additional data in the results section of the review as supplementary information on: (i) rituximab monotherapy versus methotrexate monotherapy, (ii) rituximab (two 500 mg doses) in combination with methotrexate versus methotrexate, (iii) rituximab (two 1000 mg doses) in combination with cyclophosphamide versus rituximab monotherapy, and (iv) rituximab in combination with methotrexate and a TNF inhibitor versus methotrexate in combination with a TNF inhibitor.
Subgroup analyses
-
Disease duration (more or less than 4 years).
-
Previous treatment (methotrexate‐naive, prior DMARD failure, or prior DMARD and TNF inhibitor failure).
-
Study quality (low or high risk of bias) on the response to rituximab.
-
Whether RF or anti‐CCP status predicts response to treatment.
Sensitivity analysis
-
Dosages (1000 mg versus 500 mg doses).
-
Concomitant treatment (methotrexate or cyclophosphamide or none ‐ rituximab monotherapy).
Keywords
MeSH
Medical Subject Headings (MeSH) Keywords
Medical Subject Headings Check Words
Humans;
PICOs

Flow diagram of included studies.
aStudy reported results on cycle 1 and cycle 2 (re‐treatment)
bRe‐treatment was permitted at 24 weeks for patients not responding at least 20%
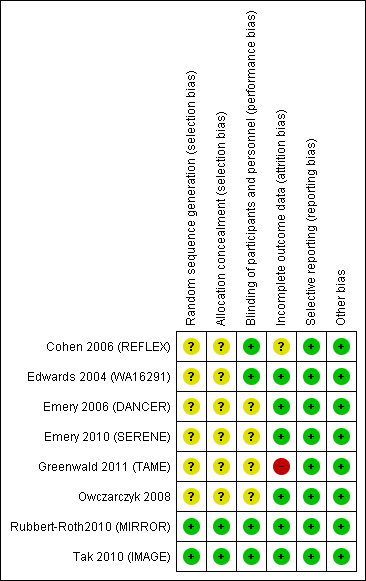
Risk of bias summary: review authors' judgements about each risk of bias item for each included study.

Risk of bias graph: review authors' judgements about each risk of bias item presented as percentages across all included studies.

Twenty‐nine out of every 100 rituximab plus methotrexate recipients experience a clinical improvement of 50% versus 9 methotrexate recipients.

Funnel plot of comparison: 1 Benefits ‐ RTX (2*1000 mg) + MTX versus MTX, outcome: 1.2 ACR 50.

Comparison 1 Benefits ‐ RTX (2 x 1000 mg) + MTX versus MTX, Outcome 1 ACR20.

Comparison 1 Benefits ‐ RTX (2 x 1000 mg) + MTX versus MTX, Outcome 2 ACR 50.

Comparison 1 Benefits ‐ RTX (2 x 1000 mg) + MTX versus MTX, Outcome 3 ACR 70.

Comparison 1 Benefits ‐ RTX (2 x 1000 mg) + MTX versus MTX, Outcome 4 ACR 90.

Comparison 1 Benefits ‐ RTX (2 x 1000 mg) + MTX versus MTX, Outcome 5 DAS 28.

Comparison 1 Benefits ‐ RTX (2 x 1000 mg) + MTX versus MTX, Outcome 6 LDA (DAS28 =or<3.2).

Comparison 1 Benefits ‐ RTX (2 x 1000 mg) + MTX versus MTX, Outcome 7 Clinical Remission (DAS28<2.6).

Comparison 1 Benefits ‐ RTX (2 x 1000 mg) + MTX versus MTX, Outcome 8 Moderate or good EULAR response.

Comparison 1 Benefits ‐ RTX (2 x 1000 mg) + MTX versus MTX, Outcome 9 HAQ‐DI.

Comparison 1 Benefits ‐ RTX (2 x 1000 mg) + MTX versus MTX, Outcome 10 HAQ‐DI MCID=‐0.22.

Comparison 1 Benefits ‐ RTX (2 x 1000 mg) + MTX versus MTX, Outcome 11 SF‐36 PCS.

Comparison 1 Benefits ‐ RTX (2 x 1000 mg) + MTX versus MTX, Outcome 12 SF‐36 PCS (=or>MCID of 5 or 5.42).

Comparison 1 Benefits ‐ RTX (2 x 1000 mg) + MTX versus MTX, Outcome 13 SF‐36 MCS.

Comparison 1 Benefits ‐ RTX (2 x 1000 mg) + MTX versus MTX, Outcome 14 SF‐36 MCS (=or>MCID of 5 or 6.33).

Comparison 1 Benefits ‐ RTX (2 x 1000 mg) + MTX versus MTX, Outcome 15 FACIT‐F.

Comparison 1 Benefits ‐ RTX (2 x 1000 mg) + MTX versus MTX, Outcome 16 FACIT‐F MCID>= 4or 3.56.

Comparison 1 Benefits ‐ RTX (2 x 1000 mg) + MTX versus MTX, Outcome 17 VAS‐pain.

Comparison 1 Benefits ‐ RTX (2 x 1000 mg) + MTX versus MTX, Outcome 18 Total radiographic score.

Comparison 1 Benefits ‐ RTX (2 x 1000 mg) + MTX versus MTX, Outcome 19 Joint Space Narrowing.

Comparison 1 Benefits ‐ RTX (2 x 1000 mg) + MTX versus MTX, Outcome 20 Radiologic erosions.

Comparison 1 Benefits ‐ RTX (2 x 1000 mg) + MTX versus MTX, Outcome 21 No radiographic progression.

Comparison 1 Benefits ‐ RTX (2 x 1000 mg) + MTX versus MTX, Outcome 22 No worsening of erosions.

Comparison 2 Benefits ‐ RTX monotherapy versus MTX monotherapy, Outcome 1 ACR 20.

Comparison 2 Benefits ‐ RTX monotherapy versus MTX monotherapy, Outcome 2 ACR 50.

Comparison 2 Benefits ‐ RTX monotherapy versus MTX monotherapy, Outcome 3 ACR 70.

Comparison 2 Benefits ‐ RTX monotherapy versus MTX monotherapy, Outcome 4 DAS 28.

Comparison 2 Benefits ‐ RTX monotherapy versus MTX monotherapy, Outcome 5 Moderate or good EULAR response.

Comparison 2 Benefits ‐ RTX monotherapy versus MTX monotherapy, Outcome 6 HAQ‐DI.

Comparison 2 Benefits ‐ RTX monotherapy versus MTX monotherapy, Outcome 7 % of patients achieving HAQ‐DI MCID=‐0.25.

Comparison 3 Benefits ‐ RTX (2 x 500 mg) + MTX versus MTX, Outcome 1 ACR 20.

Comparison 3 Benefits ‐ RTX (2 x 500 mg) + MTX versus MTX, Outcome 2 ACR 50.

Comparison 3 Benefits ‐ RTX (2 x 500 mg) + MTX versus MTX, Outcome 3 ACR 70.

Comparison 3 Benefits ‐ RTX (2 x 500 mg) + MTX versus MTX, Outcome 4 ACR 90.

Comparison 3 Benefits ‐ RTX (2 x 500 mg) + MTX versus MTX, Outcome 5 DAS 28.

Comparison 3 Benefits ‐ RTX (2 x 500 mg) + MTX versus MTX, Outcome 6 LDA (DAS28 =or<3.2).

Comparison 3 Benefits ‐ RTX (2 x 500 mg) + MTX versus MTX, Outcome 7 Clinical Remission (DAS28<2.6).

Comparison 3 Benefits ‐ RTX (2 x 500 mg) + MTX versus MTX, Outcome 8 Moderate or good EULAR response.

Comparison 3 Benefits ‐ RTX (2 x 500 mg) + MTX versus MTX, Outcome 9 HAQ‐DI.

Comparison 3 Benefits ‐ RTX (2 x 500 mg) + MTX versus MTX, Outcome 10 HAQ‐DI MCID=‐0.22.

Comparison 3 Benefits ‐ RTX (2 x 500 mg) + MTX versus MTX, Outcome 11 SF‐36 PCS.

Comparison 3 Benefits ‐ RTX (2 x 500 mg) + MTX versus MTX, Outcome 12 SF‐36 PCS (=or>MCID of 5 or 5.42).

Comparison 3 Benefits ‐ RTX (2 x 500 mg) + MTX versus MTX, Outcome 13 SF‐36 MCS.

Comparison 3 Benefits ‐ RTX (2 x 500 mg) + MTX versus MTX, Outcome 14 SF‐36 MCS (=or>MCID of 6.33).

Comparison 3 Benefits ‐ RTX (2 x 500 mg) + MTX versus MTX, Outcome 15 FACIT‐F.

Comparison 3 Benefits ‐ RTX (2 x 500 mg) + MTX versus MTX, Outcome 16 FACIT‐F (= or > MCID of 3.5 or 4).

Comparison 3 Benefits ‐ RTX (2 x 500 mg) + MTX versus MTX, Outcome 17 VAS pain.

Comparison 3 Benefits ‐ RTX (2 x 500 mg) + MTX versus MTX, Outcome 18 Total radiographic score.

Comparison 3 Benefits ‐ RTX (2 x 500 mg) + MTX versus MTX, Outcome 19 Joint Space Narrowing.

Comparison 3 Benefits ‐ RTX (2 x 500 mg) + MTX versus MTX, Outcome 20 Radiologic erosions.

Comparison 3 Benefits ‐ RTX (2 x 500 mg) + MTX versus MTX, Outcome 21 No radiographic progression.

Comparison 3 Benefits ‐ RTX (2 x 500 mg) + MTX versus MTX, Outcome 22 No increase in erosion score.

Comparison 4 Benefits ‐ RTX (2 x 1000 mg) + CTX versus MTX, Outcome 1 ACR 20.

Comparison 4 Benefits ‐ RTX (2 x 1000 mg) + CTX versus MTX, Outcome 2 ACR 50.

Comparison 4 Benefits ‐ RTX (2 x 1000 mg) + CTX versus MTX, Outcome 3 ACR 70.

Comparison 4 Benefits ‐ RTX (2 x 1000 mg) + CTX versus MTX, Outcome 4 DAS 28.

Comparison 4 Benefits ‐ RTX (2 x 1000 mg) + CTX versus MTX, Outcome 5 Moderate or good EULAR response.

Comparison 4 Benefits ‐ RTX (2 x 1000 mg) + CTX versus MTX, Outcome 6 HAQ‐DI.

Comparison 4 Benefits ‐ RTX (2 x 1000 mg) + CTX versus MTX, Outcome 7 HAQ‐DI MCID=‐0.22.

Comparison 5 Benefits ‐ RTX (2 x 500 mg) + MTX + TNFi versus MTX + TNFi, Outcome 1 ACR 20.

Comparison 5 Benefits ‐ RTX (2 x 500 mg) + MTX + TNFi versus MTX + TNFi, Outcome 2 ACR 50.

Comparison 5 Benefits ‐ RTX (2 x 500 mg) + MTX + TNFi versus MTX + TNFi, Outcome 3 LDA (DAS28 =or<3.2).

Comparison 5 Benefits ‐ RTX (2 x 500 mg) + MTX + TNFi versus MTX + TNFi, Outcome 4 Clinical Remission (DAS28<2.6).

Comparison 5 Benefits ‐ RTX (2 x 500 mg) + MTX + TNFi versus MTX + TNFi, Outcome 5 HAQ‐DI MCID=‐0.25.

Comparison 6 Withdrawals ‐ RTX (2 x 1000 mg) + MTX versus MTX, Outcome 1 Total discontinuations.

Comparison 6 Withdrawals ‐ RTX (2 x 1000 mg) + MTX versus MTX, Outcome 2 Lack of efficacy.

Comparison 6 Withdrawals ‐ RTX (2 x 1000 mg) + MTX versus MTX, Outcome 3 Adverse Events.

Comparison 6 Withdrawals ‐ RTX (2 x 1000 mg) + MTX versus MTX, Outcome 4 Other reasons.

Comparison 7 Withdrawals ‐ RTX monotherapy versus MTX monotherapy, Outcome 1 Total discontinuations.

Comparison 7 Withdrawals ‐ RTX monotherapy versus MTX monotherapy, Outcome 2 Lack of efficacy.

Comparison 7 Withdrawals ‐ RTX monotherapy versus MTX monotherapy, Outcome 3 Adverse Events.

Comparison 7 Withdrawals ‐ RTX monotherapy versus MTX monotherapy, Outcome 4 Other reasons.

Comparison 8 Withdrawals ‐ RTX (2 x 500 mg) + MTX versus MTX, Outcome 1 Total discontinuations.

Comparison 8 Withdrawals ‐ RTX (2 x 500 mg) + MTX versus MTX, Outcome 2 Lack of efficacy.

Comparison 8 Withdrawals ‐ RTX (2 x 500 mg) + MTX versus MTX, Outcome 3 Adverse Events.

Comparison 8 Withdrawals ‐ RTX (2 x 500 mg) + MTX versus MTX, Outcome 4 Other reasons.

Comparison 9 Withdrawals ‐ RTX (2 x 1000 mg) + CTX versus MTX, Outcome 1 Total discontinuations.

Comparison 9 Withdrawals ‐ RTX (2 x 1000 mg) + CTX versus MTX, Outcome 2 Lack of efficacy.

Comparison 9 Withdrawals ‐ RTX (2 x 1000 mg) + CTX versus MTX, Outcome 3 Adverse Events.

Comparison 9 Withdrawals ‐ RTX (2 x 1000 mg) + CTX versus MTX, Outcome 4 Other reasons.

Comparison 10 Withdrawals ‐ RTX + MTX + TNFi versus MTX + TNFi, Outcome 1 Total discontinuations.

Comparison 10 Withdrawals ‐ RTX + MTX + TNFi versus MTX + TNFi, Outcome 2 Adverse events.

Comparison 11 Harms ‐ RTX (2 x 1000 mg) + MTX versus MTX, Outcome 1 Any Adverse Event.

Comparison 11 Harms ‐ RTX (2 x 1000 mg) + MTX versus MTX, Outcome 2 Serious Adverse Events.

Comparison 11 Harms ‐ RTX (2 x 1000 mg) + MTX versus MTX, Outcome 3 Infections.

Comparison 11 Harms ‐ RTX (2 x 1000 mg) + MTX versus MTX, Outcome 4 Serious infections.

Comparison 11 Harms ‐ RTX (2 x 1000 mg) + MTX versus MTX, Outcome 5 Death.

Comparison 11 Harms ‐ RTX (2 x 1000 mg) + MTX versus MTX, Outcome 6 Arthralgia.

Comparison 11 Harms ‐ RTX (2 x 1000 mg) + MTX versus MTX, Outcome 7 Cardiac event (any).

Comparison 11 Harms ‐ RTX (2 x 1000 mg) + MTX versus MTX, Outcome 8 Cardiac event (serious).

Comparison 11 Harms ‐ RTX (2 x 1000 mg) + MTX versus MTX, Outcome 9 Cough.

Comparison 11 Harms ‐ RTX (2 x 1000 mg) + MTX versus MTX, Outcome 10 Diarrhea.

Comparison 11 Harms ‐ RTX (2 x 1000 mg) + MTX versus MTX, Outcome 11 Exacerbation of RA.

Comparison 11 Harms ‐ RTX (2 x 1000 mg) + MTX versus MTX, Outcome 12 Fatigue.

Comparison 11 Harms ‐ RTX (2 x 1000 mg) + MTX versus MTX, Outcome 13 HACA.

Comparison 11 Harms ‐ RTX (2 x 1000 mg) + MTX versus MTX, Outcome 14 Headache.

Comparison 11 Harms ‐ RTX (2 x 1000 mg) + MTX versus MTX, Outcome 15 Hypertension.

Comparison 11 Harms ‐ RTX (2 x 1000 mg) + MTX versus MTX, Outcome 16 Infusion‐related reactions (1st course ‐1st infusion).

Comparison 11 Harms ‐ RTX (2 x 1000 mg) + MTX versus MTX, Outcome 17 Infusion‐related reaction (1st course ‐2nd infusion).

Comparison 11 Harms ‐ RTX (2 x 1000 mg) + MTX versus MTX, Outcome 18 Infusion‐related reaction (2nd course).

Comparison 11 Harms ‐ RTX (2 x 1000 mg) + MTX versus MTX, Outcome 19 Infusion‐related reaction (3rd course).

Comparison 11 Harms ‐ RTX (2 x 1000 mg) + MTX versus MTX, Outcome 20 Infusion‐related reaction (4th course).

Comparison 11 Harms ‐ RTX (2 x 1000 mg) + MTX versus MTX, Outcome 21 Infusion‐related reaction (5th course).

Comparison 11 Harms ‐ RTX (2 x 1000 mg) + MTX versus MTX, Outcome 22 Lower gastrointestinal events.

Comparison 11 Harms ‐ RTX (2 x 1000 mg) + MTX versus MTX, Outcome 23 Malignancy.

Comparison 11 Harms ‐ RTX (2 x 1000 mg) + MTX versus MTX, Outcome 24 Nasopharyngitis.

Comparison 11 Harms ‐ RTX (2 x 1000 mg) + MTX versus MTX, Outcome 25 Nausea.

Comparison 11 Harms ‐ RTX (2 x 1000 mg) + MTX versus MTX, Outcome 26 Pyrexia.

Comparison 11 Harms ‐ RTX (2 x 1000 mg) + MTX versus MTX, Outcome 27 Upper respiratory tract infection.

Comparison 11 Harms ‐ RTX (2 x 1000 mg) + MTX versus MTX, Outcome 28 Urinary tract infection.

Comparison 11 Harms ‐ RTX (2 x 1000 mg) + MTX versus MTX, Outcome 29 Vascular disorders.

Comparison 12 Harms ‐ RTX monotherapy versus MTX monotherapy, Outcome 1 Any Adverse Event.

Comparison 12 Harms ‐ RTX monotherapy versus MTX monotherapy, Outcome 2 Serious Adverse Events.

Comparison 12 Harms ‐ RTX monotherapy versus MTX monotherapy, Outcome 3 Serious Infections.

Comparison 12 Harms ‐ RTX monotherapy versus MTX monotherapy, Outcome 4 Death.

Comparison 12 Harms ‐ RTX monotherapy versus MTX monotherapy, Outcome 5 Any Event Associated with 1st Infusion.

Comparison 12 Harms ‐ RTX monotherapy versus MTX monotherapy, Outcome 6 Arthralgia.

Comparison 12 Harms ‐ RTX monotherapy versus MTX monotherapy, Outcome 7 Back pain.

Comparison 12 Harms ‐ RTX monotherapy versus MTX monotherapy, Outcome 8 Cough.

Comparison 12 Harms ‐ RTX monotherapy versus MTX monotherapy, Outcome 9 Dyspnea.

Comparison 12 Harms ‐ RTX monotherapy versus MTX monotherapy, Outcome 10 Exacerbation of RA.

Comparison 12 Harms ‐ RTX monotherapy versus MTX monotherapy, Outcome 11 Hypertension.

Comparison 12 Harms ‐ RTX monotherapy versus MTX monotherapy, Outcome 12 Hypotension.

Comparison 12 Harms ‐ RTX monotherapy versus MTX monotherapy, Outcome 13 Nasopharyngitis.

Comparison 12 Harms ‐ RTX monotherapy versus MTX monotherapy, Outcome 14 Nausea.

Comparison 12 Harms ‐ RTX monotherapy versus MTX monotherapy, Outcome 15 Rash.

Comparison 13 Harms ‐ RTX (2 x 500 mg) + MTX versus MTX, Outcome 1 Any Adverse Event.

Comparison 13 Harms ‐ RTX (2 x 500 mg) + MTX versus MTX, Outcome 2 Serious Adverse Events.

Comparison 13 Harms ‐ RTX (2 x 500 mg) + MTX versus MTX, Outcome 3 Infections.

Comparison 13 Harms ‐ RTX (2 x 500 mg) + MTX versus MTX, Outcome 4 Serious Infections.

Comparison 13 Harms ‐ RTX (2 x 500 mg) + MTX versus MTX, Outcome 5 Death.

Comparison 13 Harms ‐ RTX (2 x 500 mg) + MTX versus MTX, Outcome 6 Arthralgia.

Comparison 13 Harms ‐ RTX (2 x 500 mg) + MTX versus MTX, Outcome 7 Cardiac event (any).

Comparison 13 Harms ‐ RTX (2 x 500 mg) + MTX versus MTX, Outcome 8 Cardiac event (serious).

Comparison 13 Harms ‐ RTX (2 x 500 mg) + MTX versus MTX, Outcome 9 Diarrhea.

Comparison 13 Harms ‐ RTX (2 x 500 mg) + MTX versus MTX, Outcome 10 Exacerbation of RA.

Comparison 13 Harms ‐ RTX (2 x 500 mg) + MTX versus MTX, Outcome 11 Fatigue.

Comparison 13 Harms ‐ RTX (2 x 500 mg) + MTX versus MTX, Outcome 12 HACA.

Comparison 13 Harms ‐ RTX (2 x 500 mg) + MTX versus MTX, Outcome 13 Headache.

Comparison 13 Harms ‐ RTX (2 x 500 mg) + MTX versus MTX, Outcome 14 Hypertension.

Comparison 13 Harms ‐ RTX (2 x 500 mg) + MTX versus MTX, Outcome 15 Infusion‐related reactions (1st course ‐ 1st infusion).

Comparison 13 Harms ‐ RTX (2 x 500 mg) + MTX versus MTX, Outcome 16 Infusion related reaction (1st course ‐2nd infusion).

Comparison 13 Harms ‐ RTX (2 x 500 mg) + MTX versus MTX, Outcome 17 Infusion related reaction (2nd course).

Comparison 13 Harms ‐ RTX (2 x 500 mg) + MTX versus MTX, Outcome 18 Infusion related reaction (3rd course).

Comparison 13 Harms ‐ RTX (2 x 500 mg) + MTX versus MTX, Outcome 19 Infusion related reaction (4th course).

Comparison 13 Harms ‐ RTX (2 x 500 mg) + MTX versus MTX, Outcome 20 Infusion related reaction (5th course).

Comparison 13 Harms ‐ RTX (2 x 500 mg) + MTX versus MTX, Outcome 21 Lower gastrointestinal events.

Comparison 13 Harms ‐ RTX (2 x 500 mg) + MTX versus MTX, Outcome 22 Malignancy.

Comparison 13 Harms ‐ RTX (2 x 500 mg) + MTX versus MTX, Outcome 23 Nasopharyngitis.

Comparison 13 Harms ‐ RTX (2 x 500 mg) + MTX versus MTX, Outcome 24 Nausea.

Comparison 13 Harms ‐ RTX (2 x 500 mg) + MTX versus MTX, Outcome 25 Upper respiratory tract infection.

Comparison 13 Harms ‐ RTX (2 x 500 mg) + MTX versus MTX, Outcome 26 Vascular disorders.

Comparison 14 Harms ‐ RTX (2 x 1000 mg) + CTX versus MTX, Outcome 1 Any Adverse Event.

Comparison 14 Harms ‐ RTX (2 x 1000 mg) + CTX versus MTX, Outcome 2 Serious Adverse Events.

Comparison 14 Harms ‐ RTX (2 x 1000 mg) + CTX versus MTX, Outcome 3 Serious Infections.

Comparison 14 Harms ‐ RTX (2 x 1000 mg) + CTX versus MTX, Outcome 4 Death.

Comparison 14 Harms ‐ RTX (2 x 1000 mg) + CTX versus MTX, Outcome 5 Any Event Associated with 1st Infusion.

Comparison 14 Harms ‐ RTX (2 x 1000 mg) + CTX versus MTX, Outcome 6 Arthralgia.

Comparison 14 Harms ‐ RTX (2 x 1000 mg) + CTX versus MTX, Outcome 7 Back pain.

Comparison 14 Harms ‐ RTX (2 x 1000 mg) + CTX versus MTX, Outcome 8 Cough.

Comparison 14 Harms ‐ RTX (2 x 1000 mg) + CTX versus MTX, Outcome 9 Dyspnea.

Comparison 14 Harms ‐ RTX (2 x 1000 mg) + CTX versus MTX, Outcome 10 Exacerbation of RA.

Comparison 14 Harms ‐ RTX (2 x 1000 mg) + CTX versus MTX, Outcome 11 Hypertension.

Comparison 14 Harms ‐ RTX (2 x 1000 mg) + CTX versus MTX, Outcome 12 Hypotension.

Comparison 14 Harms ‐ RTX (2 x 1000 mg) + CTX versus MTX, Outcome 13 Nasopharyngitis.

Comparison 14 Harms ‐ RTX (2 x 1000 mg) + CTX versus MTX, Outcome 14 Nausea.

Comparison 14 Harms ‐ RTX (2 x 1000 mg) + CTX versus MTX, Outcome 15 Pruritus.

Comparison 14 Harms ‐ RTX (2 x 1000 mg) + CTX versus MTX, Outcome 16 Rash.

Comparison 15 Harms ‐ RTX + MTX + TNFi versus MTX + TNFi, Outcome 1 Any Adverse Event.

Comparison 15 Harms ‐ RTX + MTX + TNFi versus MTX + TNFi, Outcome 2 Serious adverse events.

Comparison 15 Harms ‐ RTX + MTX + TNFi versus MTX + TNFi, Outcome 3 Grade 3 adverse events.

Comparison 15 Harms ‐ RTX + MTX + TNFi versus MTX + TNFi, Outcome 4 All infections.

Comparison 15 Harms ‐ RTX + MTX + TNFi versus MTX + TNFi, Outcome 5 Grade 3 infections.

Comparison 15 Harms ‐ RTX + MTX + TNFi versus MTX + TNFi, Outcome 6 Serious infections.

Comparison 15 Harms ‐ RTX + MTX + TNFi versus MTX + TNFi, Outcome 7 Any Event Associated with 1st infusion.

Comparison 15 Harms ‐ RTX + MTX + TNFi versus MTX + TNFi, Outcome 8 Any Event Associated with 2nd infusion.

Comparison 15 Harms ‐ RTX + MTX + TNFi versus MTX + TNFi, Outcome 9 Arthralgia.

Comparison 15 Harms ‐ RTX + MTX + TNFi versus MTX + TNFi, Outcome 10 Coronary artery occlusion.

Comparison 15 Harms ‐ RTX + MTX + TNFi versus MTX + TNFi, Outcome 11 Diarrhea.

Comparison 15 Harms ‐ RTX + MTX + TNFi versus MTX + TNFi, Outcome 12 Exacerbation of RA.

Comparison 15 Harms ‐ RTX + MTX + TNFi versus MTX + TNFi, Outcome 13 Fatigue.

Comparison 15 Harms ‐ RTX + MTX + TNFi versus MTX + TNFi, Outcome 14 HACA.

Comparison 15 Harms ‐ RTX + MTX + TNFi versus MTX + TNFi, Outcome 15 Headache.

Comparison 15 Harms ‐ RTX + MTX + TNFi versus MTX + TNFi, Outcome 16 Influenza.

Comparison 15 Harms ‐ RTX + MTX + TNFi versus MTX + TNFi, Outcome 17 Muscle spasms.

Comparison 15 Harms ‐ RTX + MTX + TNFi versus MTX + TNFi, Outcome 18 Nasopharyngitis.

Comparison 15 Harms ‐ RTX + MTX + TNFi versus MTX + TNFi, Outcome 19 Nausea.

Comparison 15 Harms ‐ RTX + MTX + TNFi versus MTX + TNFi, Outcome 20 Peripheral edema.

Comparison 15 Harms ‐ RTX + MTX + TNFi versus MTX + TNFi, Outcome 21 Pneumonia.

Comparison 15 Harms ‐ RTX + MTX + TNFi versus MTX + TNFi, Outcome 22 Postoperative infection.

Comparison 15 Harms ‐ RTX + MTX + TNFi versus MTX + TNFi, Outcome 23 Pruritus.

Comparison 15 Harms ‐ RTX + MTX + TNFi versus MTX + TNFi, Outcome 24 Sinusitits.

Comparison 15 Harms ‐ RTX + MTX + TNFi versus MTX + TNFi, Outcome 25 Upper respiratory tract infections.

Comparison 15 Harms ‐ RTX + MTX + TNFi versus MTX + TNFi, Outcome 26 Urinary tract infections.

Comparison 15 Harms ‐ RTX + MTX + TNFi versus MTX + TNFi, Outcome 27 Vaginal Mycosis.

Comparison 16 Disease duration (subgroup analysis), Outcome 1 ACR 50.

Comparison 17 Previous treatment (subgroup analysis), Outcome 1 ACR 50.

Comparison 18 Study quality (subgroup analysis), Outcome 1 ACR 50.

Comparison 19 Dosage 2 x 1000 mg versus 2 x 500 mg (sensitivity analysis), Outcome 1 ACR 20.

Comparison 19 Dosage 2 x 1000 mg versus 2 x 500 mg (sensitivity analysis), Outcome 2 ACR 50.

Comparison 19 Dosage 2 x 1000 mg versus 2 x 500 mg (sensitivity analysis), Outcome 3 ACR 70.

Comparison 19 Dosage 2 x 1000 mg versus 2 x 500 mg (sensitivity analysis), Outcome 4 ACR 90.

Comparison 19 Dosage 2 x 1000 mg versus 2 x 500 mg (sensitivity analysis), Outcome 5 DAS 28‐ESR.

Comparison 19 Dosage 2 x 1000 mg versus 2 x 500 mg (sensitivity analysis), Outcome 6 LDA (DAS28 =or<3.2).

Comparison 19 Dosage 2 x 1000 mg versus 2 x 500 mg (sensitivity analysis), Outcome 7 Clinical Remission (DAS28<2.6).

Comparison 19 Dosage 2 x 1000 mg versus 2 x 500 mg (sensitivity analysis), Outcome 8 Moderate or good EULAR response.

Comparison 19 Dosage 2 x 1000 mg versus 2 x 500 mg (sensitivity analysis), Outcome 9 HAQ‐DI.

Comparison 19 Dosage 2 x 1000 mg versus 2 x 500 mg (sensitivity analysis), Outcome 10 HAQ‐DI MCID=‐0.22.

Comparison 19 Dosage 2 x 1000 mg versus 2 x 500 mg (sensitivity analysis), Outcome 11 SF‐36 PCS.

Comparison 19 Dosage 2 x 1000 mg versus 2 x 500 mg (sensitivity analysis), Outcome 12 SF‐36 PCS (=or>MCID of 5 or 5.42).

Comparison 19 Dosage 2 x 1000 mg versus 2 x 500 mg (sensitivity analysis), Outcome 13 SF‐36 MCS.

Comparison 19 Dosage 2 x 1000 mg versus 2 x 500 mg (sensitivity analysis), Outcome 14 SF‐36 MCS (=or>MCID of 6.33).

Comparison 19 Dosage 2 x 1000 mg versus 2 x 500 mg (sensitivity analysis), Outcome 15 FACIT‐F.

Comparison 19 Dosage 2 x 1000 mg versus 2 x 500 mg (sensitivity analysis), Outcome 16 FACIT‐F (=or>MCID of 3.5).

Comparison 19 Dosage 2 x 1000 mg versus 2 x 500 mg (sensitivity analysis), Outcome 17 VAS Pain.

Comparison 19 Dosage 2 x 1000 mg versus 2 x 500 mg (sensitivity analysis), Outcome 18 Total radiographic score.

Comparison 19 Dosage 2 x 1000 mg versus 2 x 500 mg (sensitivity analysis), Outcome 19 Joint space narrowing.

Comparison 19 Dosage 2 x 1000 mg versus 2 x 500 mg (sensitivity analysis), Outcome 20 Radiographic erosions.

Comparison 19 Dosage 2 x 1000 mg versus 2 x 500 mg (sensitivity analysis), Outcome 21 No radiographic progression.

Comparison 19 Dosage 2 x 1000 mg versus 2 x 500 mg (sensitivity analysis), Outcome 22 No worsening of erosions.

Comparison 19 Dosage 2 x 1000 mg versus 2 x 500 mg (sensitivity analysis), Outcome 23 Total discontinuations.

Comparison 19 Dosage 2 x 1000 mg versus 2 x 500 mg (sensitivity analysis), Outcome 24 Discontinuation due to lack of efficacy.

Comparison 19 Dosage 2 x 1000 mg versus 2 x 500 mg (sensitivity analysis), Outcome 25 Discontinuations due to adverse Events.

Comparison 19 Dosage 2 x 1000 mg versus 2 x 500 mg (sensitivity analysis), Outcome 26 Discontinuations due to other reasons.

Comparison 19 Dosage 2 x 1000 mg versus 2 x 500 mg (sensitivity analysis), Outcome 27 Any Adverse Event.

Comparison 19 Dosage 2 x 1000 mg versus 2 x 500 mg (sensitivity analysis), Outcome 28 Serious Adverse Events.

Comparison 19 Dosage 2 x 1000 mg versus 2 x 500 mg (sensitivity analysis), Outcome 29 Infections.

Comparison 19 Dosage 2 x 1000 mg versus 2 x 500 mg (sensitivity analysis), Outcome 30 Serious Infections.

Comparison 19 Dosage 2 x 1000 mg versus 2 x 500 mg (sensitivity analysis), Outcome 31 Death.

Comparison 19 Dosage 2 x 1000 mg versus 2 x 500 mg (sensitivity analysis), Outcome 32 Arthralgia.

Comparison 19 Dosage 2 x 1000 mg versus 2 x 500 mg (sensitivity analysis), Outcome 33 Cardiac event (any).

Comparison 19 Dosage 2 x 1000 mg versus 2 x 500 mg (sensitivity analysis), Outcome 34 Cardiac event (Serious).

Comparison 19 Dosage 2 x 1000 mg versus 2 x 500 mg (sensitivity analysis), Outcome 35 Diarrhea.

Comparison 19 Dosage 2 x 1000 mg versus 2 x 500 mg (sensitivity analysis), Outcome 36 Exacerbation of RA.

Comparison 19 Dosage 2 x 1000 mg versus 2 x 500 mg (sensitivity analysis), Outcome 37 Fatigue.

Comparison 19 Dosage 2 x 1000 mg versus 2 x 500 mg (sensitivity analysis), Outcome 38 HACA.

Comparison 19 Dosage 2 x 1000 mg versus 2 x 500 mg (sensitivity analysis), Outcome 39 Hypertension.

Comparison 19 Dosage 2 x 1000 mg versus 2 x 500 mg (sensitivity analysis), Outcome 40 Infusion‐related reactions (1st course ‐1st infusion).

Comparison 19 Dosage 2 x 1000 mg versus 2 x 500 mg (sensitivity analysis), Outcome 41 Infusion‐related reaction (1st course ‐2nd infusion).

Comparison 19 Dosage 2 x 1000 mg versus 2 x 500 mg (sensitivity analysis), Outcome 42 Infusion‐related reaction (2nd course).

Comparison 19 Dosage 2 x 1000 mg versus 2 x 500 mg (sensitivity analysis), Outcome 43 Infusion‐related reaction (3rd course).

Comparison 19 Dosage 2 x 1000 mg versus 2 x 500 mg (sensitivity analysis), Outcome 44 Infusion‐related reaction (4th course).

Comparison 19 Dosage 2 x 1000 mg versus 2 x 500 mg (sensitivity analysis), Outcome 45 Infusion‐related reaction (5th course).

Comparison 19 Dosage 2 x 1000 mg versus 2 x 500 mg (sensitivity analysis), Outcome 46 Lower gastrointestinal events.

Comparison 19 Dosage 2 x 1000 mg versus 2 x 500 mg (sensitivity analysis), Outcome 47 Malignancy.

Comparison 19 Dosage 2 x 1000 mg versus 2 x 500 mg (sensitivity analysis), Outcome 48 Pneumonia.

Comparison 19 Dosage 2 x 1000 mg versus 2 x 500 mg (sensitivity analysis), Outcome 49 Urinary tract infection.

Comparison 19 Dosage 2 x 1000 mg versus 2 x 500 mg (sensitivity analysis), Outcome 50 Vascular disorders.

Comparison 20 Concomitant treatment CTX versus MTX (sensitivity analysis), Outcome 1 ACR 20.

Comparison 20 Concomitant treatment CTX versus MTX (sensitivity analysis), Outcome 2 ACR 50.

Comparison 20 Concomitant treatment CTX versus MTX (sensitivity analysis), Outcome 3 ACR 70.

Comparison 20 Concomitant treatment CTX versus MTX (sensitivity analysis), Outcome 4 DAS 28.

Comparison 20 Concomitant treatment CTX versus MTX (sensitivity analysis), Outcome 5 Moderate or good EULAR response.

Comparison 20 Concomitant treatment CTX versus MTX (sensitivity analysis), Outcome 6 HAQ‐DI.

Comparison 20 Concomitant treatment CTX versus MTX (sensitivity analysis), Outcome 7 HAQ‐DI MCID=‐0.22.

Comparison 20 Concomitant treatment CTX versus MTX (sensitivity analysis), Outcome 8 Total discontinuations.

Comparison 20 Concomitant treatment CTX versus MTX (sensitivity analysis), Outcome 9 Withdrawals due to lack of efficacy.

Comparison 20 Concomitant treatment CTX versus MTX (sensitivity analysis), Outcome 10 Withdrawals due to adverse events.

Comparison 20 Concomitant treatment CTX versus MTX (sensitivity analysis), Outcome 11 Withdrawals due to other reasons.

Comparison 20 Concomitant treatment CTX versus MTX (sensitivity analysis), Outcome 12 Any Adverse Event.

Comparison 20 Concomitant treatment CTX versus MTX (sensitivity analysis), Outcome 13 Serious Adverse Events.

Comparison 20 Concomitant treatment CTX versus MTX (sensitivity analysis), Outcome 14 Serious Infections.

Comparison 20 Concomitant treatment CTX versus MTX (sensitivity analysis), Outcome 15 Exacerbation of RA.

Comparison 20 Concomitant treatment CTX versus MTX (sensitivity analysis), Outcome 16 Death.

Comparison 20 Concomitant treatment CTX versus MTX (sensitivity analysis), Outcome 17 Any Event Associated with 1st Infusion.

Comparison 20 Concomitant treatment CTX versus MTX (sensitivity analysis), Outcome 18 Arthralgia.

Comparison 20 Concomitant treatment CTX versus MTX (sensitivity analysis), Outcome 19 Back pain.

Comparison 20 Concomitant treatment CTX versus MTX (sensitivity analysis), Outcome 20 Cough.

Comparison 20 Concomitant treatment CTX versus MTX (sensitivity analysis), Outcome 21 Dyspnea.

Comparison 20 Concomitant treatment CTX versus MTX (sensitivity analysis), Outcome 22 Hypertension.

Comparison 20 Concomitant treatment CTX versus MTX (sensitivity analysis), Outcome 23 Hypotension.

Comparison 20 Concomitant treatment CTX versus MTX (sensitivity analysis), Outcome 24 Nasopharyngitis.

Comparison 20 Concomitant treatment CTX versus MTX (sensitivity analysis), Outcome 25 Nausea.

Comparison 20 Concomitant treatment CTX versus MTX (sensitivity analysis), Outcome 26 Pruritus.

Comparison 20 Concomitant treatment CTX versus MTX (sensitivity analysis), Outcome 27 Rash.

Comparison 21 Concomitant treatment MTX versus none (sensitivity analysis), Outcome 1 ACR 20.

Comparison 21 Concomitant treatment MTX versus none (sensitivity analysis), Outcome 2 ACR 50.

Comparison 21 Concomitant treatment MTX versus none (sensitivity analysis), Outcome 3 ACR 70.

Comparison 21 Concomitant treatment MTX versus none (sensitivity analysis), Outcome 4 DAS 28.

Comparison 21 Concomitant treatment MTX versus none (sensitivity analysis), Outcome 5 Moderate or good EULAR response.

Comparison 21 Concomitant treatment MTX versus none (sensitivity analysis), Outcome 6 HAQ‐DI.

Comparison 21 Concomitant treatment MTX versus none (sensitivity analysis), Outcome 7 HAQ‐DI MCID=‐0.22.

Comparison 21 Concomitant treatment MTX versus none (sensitivity analysis), Outcome 8 Total discontinuations.

Comparison 21 Concomitant treatment MTX versus none (sensitivity analysis), Outcome 9 Withdrawals due to lack of efficacy.

Comparison 21 Concomitant treatment MTX versus none (sensitivity analysis), Outcome 10 Withdrawals due to adverse Events.

Comparison 21 Concomitant treatment MTX versus none (sensitivity analysis), Outcome 11 Withdrawals due to other reasons.

Comparison 21 Concomitant treatment MTX versus none (sensitivity analysis), Outcome 12 Any Adverse Event.

Comparison 21 Concomitant treatment MTX versus none (sensitivity analysis), Outcome 13 Serious Adverse Events.

Comparison 21 Concomitant treatment MTX versus none (sensitivity analysis), Outcome 14 Serious Infections.

Comparison 21 Concomitant treatment MTX versus none (sensitivity analysis), Outcome 15 Death.

Comparison 21 Concomitant treatment MTX versus none (sensitivity analysis), Outcome 16 Any Event Associated with 1st Infusion.

Comparison 21 Concomitant treatment MTX versus none (sensitivity analysis), Outcome 17 Arthralgia.

Comparison 21 Concomitant treatment MTX versus none (sensitivity analysis), Outcome 18 Back pain.

Comparison 21 Concomitant treatment MTX versus none (sensitivity analysis), Outcome 19 Cough.

Comparison 21 Concomitant treatment MTX versus none (sensitivity analysis), Outcome 20 Dyspnea.

Comparison 21 Concomitant treatment MTX versus none (sensitivity analysis), Outcome 21 Exacerbation of RA.

Comparison 21 Concomitant treatment MTX versus none (sensitivity analysis), Outcome 22 Hypertension.

Comparison 21 Concomitant treatment MTX versus none (sensitivity analysis), Outcome 23 Hypotension.

Comparison 21 Concomitant treatment MTX versus none (sensitivity analysis), Outcome 24 Nasopharyngitis.

Comparison 21 Concomitant treatment MTX versus none (sensitivity analysis), Outcome 25 Nausea.

Comparison 21 Concomitant treatment MTX versus none (sensitivity analysis), Outcome 26 Pruritus.

Comparison 21 Concomitant treatment MTX versus none (sensitivity analysis), Outcome 27 Rash.

Comparison 22 Concomitant treatment CTX versus none (sensitivity analysis), Outcome 1 ACR 20.

Comparison 22 Concomitant treatment CTX versus none (sensitivity analysis), Outcome 2 ACR 50.

Comparison 22 Concomitant treatment CTX versus none (sensitivity analysis), Outcome 3 ACR 70.

Comparison 22 Concomitant treatment CTX versus none (sensitivity analysis), Outcome 4 DAS 28.

Comparison 22 Concomitant treatment CTX versus none (sensitivity analysis), Outcome 5 Moderate or good EULAR response.

Comparison 22 Concomitant treatment CTX versus none (sensitivity analysis), Outcome 6 HAQ‐DI.

Comparison 22 Concomitant treatment CTX versus none (sensitivity analysis), Outcome 7 HAQ‐DI MCID=‐0.22.

Comparison 22 Concomitant treatment CTX versus none (sensitivity analysis), Outcome 8 Total discontinuations.

Comparison 22 Concomitant treatment CTX versus none (sensitivity analysis), Outcome 9 Withdrawals due to lack of efficacy.

Comparison 22 Concomitant treatment CTX versus none (sensitivity analysis), Outcome 10 Withdrawals due to adverse Events.

Comparison 22 Concomitant treatment CTX versus none (sensitivity analysis), Outcome 11 Withdrawals due to other reasons.

Comparison 22 Concomitant treatment CTX versus none (sensitivity analysis), Outcome 12 Any Adverse Event.

Comparison 22 Concomitant treatment CTX versus none (sensitivity analysis), Outcome 13 Serious Adverse Events.

Comparison 22 Concomitant treatment CTX versus none (sensitivity analysis), Outcome 14 Serious Infections.

Comparison 22 Concomitant treatment CTX versus none (sensitivity analysis), Outcome 15 Death.

Comparison 22 Concomitant treatment CTX versus none (sensitivity analysis), Outcome 16 Any Event Associated with 1st Infusion.

Comparison 22 Concomitant treatment CTX versus none (sensitivity analysis), Outcome 17 Arthralgia.

Comparison 22 Concomitant treatment CTX versus none (sensitivity analysis), Outcome 18 Back pain.

Comparison 22 Concomitant treatment CTX versus none (sensitivity analysis), Outcome 19 Cough.

Comparison 22 Concomitant treatment CTX versus none (sensitivity analysis), Outcome 20 Dyspnea.

Comparison 22 Concomitant treatment CTX versus none (sensitivity analysis), Outcome 21 Exacerbation of RA.

Comparison 22 Concomitant treatment CTX versus none (sensitivity analysis), Outcome 22 Hypertension.

Comparison 22 Concomitant treatment CTX versus none (sensitivity analysis), Outcome 23 Hypotension.

Comparison 22 Concomitant treatment CTX versus none (sensitivity analysis), Outcome 24 Nasopharyngitis.

Comparison 22 Concomitant treatment CTX versus none (sensitivity analysis), Outcome 25 Nausea.

Comparison 22 Concomitant treatment CTX versus none (sensitivity analysis), Outcome 26 Rash.
| Rituximab (2 x 1000 mg) plus methotrexate compared to methotrexate monotherapy for rheumatoid arthritis | ||||||||
| Patient or population: patients with rheumatoid arthritis | ||||||||
| Outcomes | Follow‐up (weeks) | Illustrative comparative risks* (95% CI) | Relative effect | No of participants | Quality of the evidence | Comments | ||
| Assumed risk | Corresponding risk | |||||||
| Methotrexate monotherapy | Rituximab (2 x 1000 mg) plus methotrexate | |||||||
| Clinical improvement American College of Rheumatology 50% improvement criteria | 24 | 88 per 1000 | 286 per 1000 | RR 3.3 | 1165 | ⊕⊕⊕⊝ | Absolute treatment benefit 21% (95% CI 16% to 25%); Relative per cent change 225% (95% CI 131% to 358%); NNTB 6 (95% CI 9 to 4) | |
| 48 to 56 | 331 per 1000 | 742 per 1000 | RR 2.2 | 852 | ⊕⊕⊕⊝ | Absolute treatment benefit 24% (95% CI 18% to 30%); Relative per cent change 124% (95% CI 26% to 295%); NNTB 4 (95% CI 6 to 3) | ||
| 104 | 377 per 1000 | 562 per 1000 | RR 1.5 | 579 | ⊕⊕⊕⊝ | Absolute treatment benefit 17% (95% CI 8% to 27%); Relative per cent change 149% (95% CI 25% to 77%); NNTB 6 (95% CI 11 to 4) | ||
| Clinical remission (Disease Activity Score‐28 joint count < 2.6) (Scale from 2 to 10) | 24 | 11 per 1000 | 99 per 1000 | RR 9.1 | 834 | ⊕⊕⊕⊝ | Not statistically significant. Absolute treatment benefit 8% (95% CI 6% to 11%); Relative per cent change 809% (95% CI ‐24% to 1072%); NNTB N/A | |
| 48 to 52 | 112 per 1000 | 221 per 1000 | RR 2.4 | 772 | ⊕⊕⊕⊝ | Absolute treatment benefit 11% (95% CI 2% to 20%); Relative per cent change 142% (95% CI 70% to 246%); NNTB 7 (95% 13 CI to 4) | ||
| 104 | 129 per 1000 | 320 per 1000 | RR 2.5 | 499 | ⊕⊕⊕⊝ | Absolute treatment benefit 19% (95% CI 12% to 26%); Relative per cent change 149% (95% CI 72% to 261%); NNTB 6 (95% 11 CI to 3) | ||
| Physical function (HAQ‐DI MCID = ‐0.22) | 24 | 387 per 1000 | 623 per 1000 | RR 1.6 | 1161 | ⊕⊕⊕⊕ | Absolute treatment benefit 24% (95% CI 12% to 36%); Relative per cent change 61% (95% CI 22% to 112%); NNTB 5 (95% CI 13 to 3) | |
| 48 to 56 | 726 per 1000 | 1000 per 1000 | RR 1.6 | 562 | ⊕⊕⊕⊕ | Absolute treatment benefit 24% (95% CI ‐5% to 52%); Relative per cent change 57% (95% CI ‐29% to 244%); NNTB N/A | ||
| 72 | 200 per 1000 | 464 per 1000 | RR 2.3 | 43 | ⊕⊕⊕⊕ | Absolute treatment benefit 26% (95% CI ‐1% to 54%); Relative per cent change 132% (95% CI ‐22% to 589%); NNTB N/A | ||
| 104 | 608 per 1000 | 845 per 1000 | RR 1.4 | 523 | ⊕⊕⊕⊕ | Absolute treatment benefit 24% (95% CI 16% to 31%); Relative per cent change 39% (95% CI 25% to 55%); NNTB 5 (95% CI 7 to 3) | ||
| No radiographic progression in total Genant‐modified Sharp score (range 0 to 290) | 24 | 591 per 1000 | 697 per 1000 | RR 1.2 | 476 | ⊕⊕⊕⊝ | Absolute treatment benefit 11% (95% CI 2% to 19%); Relative per cent change 18% (95%CI 3% to 35%); NNTB 10 (95% CI 57 to 5) | |
| 56 | 500 per 1000 | 625 per 1000 | RR 1.3 | 940 | ⊕⊕⊕⊝ | Absolute treatment benefit 12% (95% CI 6% to 19%); Relative per cent change 25% (95%CI 11% to 40%); NNTB 8 (95% CI 19 to 5) | ||
| 104 | 379 per 1000 | 568 per 1000 | RR 1.5 | 945 | ⊕⊕⊕⊝ | Absolute treatment benefit 19% (95% CI 13% to 25%); Relative per cent change 50% (95%CI 30% to 73%); NNTB 6 (95% CI 9 to 4) | ||
| Health‐related quality of life | SF‐36 PCS MCID = ‐5 or 5.42 | 24 to 52 | 355 per 1000 | 697 per 1000 (405 to 1000) | RR 2.0 (1.1 to 3.4) | 1,526 (4 studies) | ⊕⊕⊕⊕ | Absolute treatment benefit 34% (95% CI 5% to 84%); Relative percent change 96% (95%CI 14% to 226%); NNTB 4 (95% CI 8 to 3) |
| SF‐36 MCS MCID = ‐5 or 6.33 | 24 to 52 | 345 per 1000 | 475 per 1000 (352 to 638) | RR 1.4 (1.1 to 1.9) | 1282 (3 studies) | ⊕⊕⊕⊕ | Absolute treatment benefit 13% (95% CI 7% to 18%); Relative per cent change 43% (95% CI 6% to 92%); NNTB 8 (95% CI 19 to 5) | |
| Discontinuations due to adverse events | 24 | 10 per 1000 | 21 per 1000 | RR 2.1 | 1385 | ⊕⊕⊕⊝ | Not statistically significant; Absolute risk difference 1% (95% CI 0% to 3%); Relative per cent change 107% (95% CI ‐12% to 388%); NNTH N/A | |
| 48‐52 | 24 per 1000 | 24 per 1000 | RR 1.0 | 927 | ⊕⊕⊕⊕ | Not statistically significant; Absolute risk difference 0% (95% CI ‐2% to 2%); Relative per cent change 0% (95% CI ‐56% to 129%); NNTH N/A | ||
| 72 | 75 per 1000 | 25 per 1000 | RR 0.33 | 80 | ⊕⊕⊕⊝ | Not statistically significant; Absolute risk difference ‐5% (95% CI ‐14% to 4%); Relative per cent change ‐67% (95% CI ‐96% to 207%); NNTH N/A | ||
| 104 | 55 per 1000 | 31 per 1000 | RR 0.56 | 579 | ⊕⊕⊕⊕ | Not statistically significant; Absolute risk difference ‐2% (95% CI ‐6% to 1%); Relative per cent change ‐44% (95% CI ‐45% to 25%); NNTH N/A | ||
| Serious adverse events | 24 | 75 per 1000 | 75 per 1000 | RR 1 | 1280 | ⊕⊕⊕⊝ | Not statistically significant; Absolute risk difference 0% (95% CI ‐3% to 3%); Relative per cent change 0% (95% CI ‐32% to 45%); NNTH N/A | |
| 48 to 56 | 103 per 1000 | 97 per 1000 | RR 0.94 | 579 | ⊕⊕⊕⊕ | Not statistically significant; Absolute risk difference ‐1% (95% CI ‐6% to 4%); Relative per cent change ‐6% (95% CI ‐43% to 53%); NNTH N/A | ||
| 104 | 169 per 1000 | 132 per 1000 | RR 0.78 | 499 | ⊕⊕⊕⊝ | Not statistically significant; Absolute risk difference ‐4% (95% CI ‐10% to 3%); Relative per cent change ‐22% (95% CI ‐49% to 19%); NNTH N/A | ||
| *The basis for the assumed risk (e.g. the median control group risk across studies) is provided in footnotes. The corresponding risk (and its 95% confidence interval) is based on the assumed risk in the comparison group and the relative effect of the intervention (and its 95% CI). | ||||||||
| GRADE Working Group grades of evidence | ||||||||
| 1 Only one study was graded as having low risk of bias | ||||||||
| Study | Arms | n | Age, mean + SD* | Females, % | Disease duration, mean years | Rheumatoid factor, mean IU/litre | Previous DMARDs, mean no | Prior anti‐TNFα treatment, % | MTX dose, mean mg/week |
| Cohen 2006 (REFLEX) | PBO + MTX | 209 | 52.8 ± 12.6 | 81 | 11.7 ± 7.7 | 317.4 ± 870.2 | 2.4 ± 1.8 | 90† | 16.7 ± 9.9 |
| RTX 2 (100 mg courses) + MTX | 308 | 52.2 ± 12.2 | 81 | 12.1 ± 8.3 | 324.3 ± 613.5 | 2.6 ± 1.8 | 92† | 16.4 ± 8.8 | |
| Edwards 2004 (WA16291) | PBO + MTX | 40 | 54 ± 11 | 80 | 11 ± 7 | ‐ | 2.6 ± 1.3 | ‐ | 12.5 to 15‡ |
| RTX 2 (100 mg courses) + MTX | 40 | 53 ± 10 | 75 | 12 ± 7 | ‐ | 2.5 ± 1.4 | ‐ | 12.5 to 15‡ | |
| RTX 2 (100 mg courses) | 40 | 54 ± 10 | 73 | 9 ± 6 | ‐ | 2.5 ± 1.6 | ‐ | 12.5 to 15‡ | |
| RTX 2 (100 mg courses) + CTX | 41 | 54 ± 12 | 83 | 10 ± 6 | ‐ | 2.6 ± 1.4 | ‐ | 12.5 to 15‡ | |
| Emery 2006 (DANCER) | PBO + MTX | 149 | 51.1 | 80 | 9.3 | 437 | 2.2 | 26 | 15.6 |
| RTX 2 (500 mg courses) + MTX | 124 | 51.4 | 83 | 11.1 | 421 | 2.5 | 33 | 16 | |
| RTX 2 (100 mg courses) + MTX | 192 | 51.1 | 80 | 10.8 | 437 | 2.5 | 28 | 14.9 | |
| Emery 2010 (SERENE) | PBO + MTX | 172 | 52.2 ± 12.4 | 85.5 | 7.5 ± 7.6 | 75.0% positive | 1.1 ± 1.1c | ‐ | 16.6 ± 4.3 |
| RTX 2 (500 mg courses) + MTX | 167 | 51.9 ± 12.9 | 79.6 | 7.1 ± 7.0 | 75.4% positive | 1.2 ± 1.3c | ‐ | 15.4 ± 4.0 | |
| RTX 2 (1000 mg courses) + MTX | 170 | 51.3 ± 12.6 | 81.2 | 6.6 ± 7.3 | 73.5% positive | 1.1 ± 1.1c | ‐ | 16.1 ± 4.3 | |
| Greenwald 2011 (TAME) | MTX + TNFi | 18 | 50.4 | 94 | 10.7 ± 7.5 | 178.6 ± 242.8 | ‐ | 100 | 17.5 ± 4.2 |
| RTX 2 (500 mg courses) + MTX + TNFi | 32 | 49.7 | 85 | 10.3 ± 6.7 | 341.9 ± 521.0 | ‐ | 97 | 16.1 ± 4.2 | |
| Owczarczyk 2008 | RTX | 20 | 55 ± 9 | ‐ | 12 ± 8 | 329 ± 724 | ‐ | 1.47 ± 1.17 | ‐ |
| RTX + MTX | 20 | 53 ± 12 | ‐ | 9 ± 9.6 | 479 ± 574 | ‐ | 0.45 ± 0.75 | ‐ | |
| Rubbert‐Roth 2010 (MIRROR) | RTX (500 mg courses) + MTX | 134 | 53.6 ± 12.8 | 82.1 | 9 + 7.4 | 235.5 ± 4.16 | 2.0 ± 1.5 | 27.6 | 15.2 ± 4.7 |
| RTX 2 (1000mg courses) + MTX | 93 | 51.3 ± 12.2 | 82.8 | 7.7 + 7.4 | 232.4 ± 366.1 | 1.8 ± 1.4 | 24.6 | 15.2 ± 4.7 | |
| Tak 2010 (IMAGE) | PBO + MTX | 249 | 48.1 ± 12.7 | 77 | 0.91 (1.1) | 87% positive | 70% DMARD‐naive | ‐ | ‐ |
| RTX 2 (500 mg courses) + MTX | 249 | 47.9 ± 13.4 | 82 | 0.99 (1.1) | 87% positive | 72% DMARD‐naive | ‐ | ‐ | |
| RTX 2 (1000 mg courses) + MTX | 250 | 47.9 ± 13.3 | 85 | 0.92 (1.3) | 85% positive | 69% DMARD‐naive | ‐ | ‐ | |
| *when reported †Inadequate efficacy of anti‐TNF agents (%) ‡ Median dose per week aPatients were followed 36 weeks in the group receiving rituximab plus MTX and 12 weeks in the group receiving MTX monotherapy bAn upper age limit of 65 years was used because of known attenuation of vaccine response in older patients cExcludes MTX DMARD = Disease Modifying Anti‐Rheumatic Drug; mg = milligrams; MTX = methotrexate; PBO = placebo; RTX = rituximab. | |||||||||
| Outcome or subgroup title | No. of studies | No. of participants | Statistical method | Effect size |
| 1 ACR20 Show forest plot | 5 | Risk Ratio (M‐H, Random, 95% CI) | Subtotals only | |
| 1.1 24 weeks | 4 | 1165 | Risk Ratio (M‐H, Random, 95% CI) | 2.24 [1.86, 2.69] |
| 1.2 48‐52 weeks | 4 | 852 | Risk Ratio (M‐H, Random, 95% CI) | 1.53 [1.09, 2.13] |
| 1.3 104 weeks | 2 | 579 | Risk Ratio (M‐H, Random, 95% CI) | 1.57 [0.82, 3.01] |
| 2 ACR 50 Show forest plot | 5 | Risk Ratio (M‐H, Random, 95% CI) | Subtotals only | |
| 2.1 24 weeks | 4 | 1165 | Risk Ratio (M‐H, Random, 95% CI) | 3.25 [2.31, 4.58] |
| 2.2 48‐56 weeks | 4 | 852 | Risk Ratio (M‐H, Random, 95% CI) | 2.24 [1.26, 3.95] |
| 2.3 104 weeks | 2 | 579 | Risk Ratio (M‐H, Random, 95% CI) | 1.49 [1.25, 1.77] |
| 3 ACR 70 Show forest plot | 5 | Risk Ratio (M‐H, Random, 95% CI) | Subtotals only | |
| 3.1 24 weeks | 4 | 1165 | Risk Ratio (M‐H, Random, 95% CI) | 3.91 [1.84, 8.31] |
| 3.2 48‐56 weeks | 4 | 852 | Risk Ratio (M‐H, Random, 95% CI) | 1.95 [1.53, 2.49] |
| 3.3 104 weeks | 2 | 579 | Risk Ratio (M‐H, Random, 95% CI) | 1.84 [1.44, 2.37] |
| 4 ACR 90 Show forest plot | 1 | Risk Ratio (M‐H, Fixed, 95% CI) | Subtotals only | |
| 4.1 52 weeks | 1 | 499 | Risk Ratio (M‐H, Fixed, 95% CI) | 1.81 [1.11, 2.96] |
| 4.2 104 weeks | 1 | 499 | Risk Ratio (M‐H, Fixed, 95% CI) | 1.81 [1.22, 2.68] |
| 5 DAS 28 Show forest plot | 5 | Mean Difference (IV, Random, 95% CI) | Subtotals only | |
| 5.1 24 weeks | 5 | 1661 | Mean Difference (IV, Random, 95% CI) | ‐1.20 [‐1.48, ‐0.92] |
| 5.2 48‐56 weeks | 1 | 499 | Mean Difference (IV, Random, 95% CI) | ‐1.15 [‐1.37, ‐0.93] |
| 5.3 104 weeks | 1 | 499 | Mean Difference (IV, Random, 95% CI) | ‐1.59 [‐1.81, ‐1.37] |
| 6 LDA (DAS28 =or<3.2) Show forest plot | 4 | Risk Ratio (M‐H, Random, 95% CI) | Subtotals only | |
| 6.1 24 weeks | 2 | 834 | Risk Ratio (M‐H, Random, 95% CI) | 4.23 [1.42, 12.56] |
| 6.2 48‐52 weeks | 3 | 772 | Risk Ratio (M‐H, Random, 95% CI) | 2.09 [1.60, 2.73] |
| 6.3 104 weeks | 1 | 499 | Risk Ratio (M‐H, Random, 95% CI) | 1.93 [1.50, 2.48] |
| 7 Clinical Remission (DAS28<2.6) Show forest plot | 4 | Risk Difference (M‐H, Random, 95% CI) | Subtotals only | |
| 7.1 24 weeks | 2 | 834 | Risk Difference (M‐H, Random, 95% CI) | 0.08 [0.06, 0.11] |
| 7.2 48‐52 weeks | 3 | 772 | Risk Difference (M‐H, Random, 95% CI) | 0.11 [0.02, 0.20] |
| 7.3 104 weeks | 1 | 499 | Risk Difference (M‐H, Random, 95% CI) | 0.19 [0.12, 0.26] |
| 8 Moderate or good EULAR response Show forest plot | 5 | Risk Ratio (M‐H, Random, 95% CI) | Subtotals only | |
| 8.1 24 weeks | 5 | 1664 | Risk Ratio (M‐H, Random, 95% CI) | 1.94 [1.55, 2.43] |
| 8.2 48 weeks | 1 | 499 | Risk Ratio (M‐H, Random, 95% CI) | 2.32 [1.72, 3.14] |
| 8.3 104 weeks | 2 | 579 | Risk Ratio (M‐H, Random, 95% CI) | 2.05 [1.59, 2.64] |
| 9 HAQ‐DI Show forest plot | 4 | Mean Difference (IV, Fixed, 95% CI) | Subtotals only | |
| 9.1 24 weeks | 4 | 1318 | Mean Difference (IV, Fixed, 95% CI) | ‐0.24 [‐0.30, ‐0.18] |
| 9.2 48‐52 weeks | 2 | 562 | Mean Difference (IV, Fixed, 95% CI) | ‐0.29 [‐0.38, ‐0.20] |
| 9.3 72 weeks | 1 | 43 | Mean Difference (IV, Fixed, 95% CI) | ‐0.3 [‐0.64, 0.04] |
| 9.4 104 weeks | 1 | 499 | Mean Difference (IV, Fixed, 95% CI) | ‐0.44 [‐0.54, ‐0.34] |
| 10 HAQ‐DI MCID=‐0.22 Show forest plot | 5 | Risk Ratio (M‐H, Random, 95% CI) | Subtotals only | |
| 10.1 24 weeks | 4 | 1161 | Risk Ratio (M‐H, Random, 95% CI) | 1.61 [1.22, 2.12] |
| 10.2 48‐56 weeks | 2 | 562 | Risk Ratio (M‐H, Random, 95% CI) | 1.57 [0.71, 3.44] |
| 10.3 72 weeks | 1 | 43 | Risk Ratio (M‐H, Random, 95% CI) | 2.32 [0.78, 6.89] |
| 10.4 104 weeks | 2 | 523 | Risk Ratio (M‐H, Random, 95% CI) | 1.39 [1.25, 1.55] |
| 11 SF‐36 PCS Show forest plot | 4 | 1393 | Mean Difference (IV, Fixed, 95% CI) | ‐4.11 [‐4.98, ‐3.25] |
| 11.1 24 weeks | 3 | 912 | Mean Difference (IV, Fixed, 95% CI) | ‐4.44 [‐5.52, ‐3.36] |
| 11.2 52 weeks | 1 | 481 | Mean Difference (IV, Fixed, 95% CI) | ‐3.53 [‐4.97, ‐2.09] |
| 12 SF‐36 PCS (=or>MCID of 5 or 5.42) Show forest plot | 4 | 1526 | Risk Ratio (M‐H, Random, 95% CI) | 1.96 [1.14, 3.36] |
| 12.1 24 weeks | 3 | 1045 | Risk Ratio (M‐H, Random, 95% CI) | 2.32 [1.41, 3.84] |
| 12.2 52 weeks | 1 | 481 | Risk Ratio (M‐H, Random, 95% CI) | 1.21 [1.07, 1.36] |
| 13 SF‐36 MCS Show forest plot | 4 | 1393 | Mean Difference (IV, Fixed, 95% CI) | ‐2.22 [‐3.52, ‐0.92] |
| 13.1 24 weeks | 3 | 912 | Mean Difference (IV, Fixed, 95% CI) | ‐2.44 [‐4.05, ‐0.82] |
| 13.2 52 weeks | 1 | 481 | Mean Difference (IV, Fixed, 95% CI) | ‐1.81 [‐4.02, 0.39] |
| 14 SF‐36 MCS (=or>MCID of 5 or 6.33) Show forest plot | 3 | 1282 | Odds Ratio (M‐H, Random, 95% CI) | 1.75 [1.27, 2.42] |
| 14.1 24 weeks | 2 | 801 | Odds Ratio (M‐H, Random, 95% CI) | 2.07 [1.50, 2.84] |
| 14.2 52 weeks | 1 | 481 | Odds Ratio (M‐H, Random, 95% CI) | 1.38 [0.97, 1.98] |
| 15 FACIT‐F Show forest plot | 4 | 1570 | Mean Difference (IV, Random, 95% CI) | ‐5.22 [‐7.71, ‐2.74] |
| 15.1 24 weeks | 3 | 1081 | Mean Difference (IV, Random, 95% CI) | ‐5.84 [‐8.81, ‐2.88] |
| 15.2 52 weeks | 1 | 489 | Mean Difference (IV, Random, 95% CI) | ‐3.45 [‐5.33, ‐1.57] |
| 16 FACIT‐F MCID>= 4or 3.56 Show forest plot | 3 | 1232 | Risk Ratio (M‐H, Random, 95% CI) | 1.59 [1.00, 2.53] |
| 16.1 24 weeks | 2 | 743 | Risk Ratio (M‐H, Random, 95% CI) | 1.95 [1.65, 2.30] |
| 16.2 52 weeks | 1 | 489 | Risk Ratio (M‐H, Random, 95% CI) | 1.11 [0.99, 1.24] |
| 17 VAS‐pain Show forest plot | 3 | 1238 | Mean Difference (IV, Random, 95% CI) | ‐13.89 [‐21.31, ‐6.48] |
| 17.1 24 weeks | 2 | 743 | Mean Difference (IV, Random, 95% CI) | ‐14.57 [‐27.37, ‐1.77] |
| 17.2 52 weeks | 1 | 495 | Mean Difference (IV, Random, 95% CI) | ‐12.2 [‐16.87, ‐7.53] |
| 18 Total radiographic score Show forest plot | 2 | Mean Difference (IV, Fixed, 95% CI) | Subtotals only | |
| 18.1 24 weeks | 2 | 975 | Mean Difference (IV, Fixed, 95% CI) | ‐0.48 [‐0.83, ‐0.13] |
| 18.2 48‐56 weeks | 2 | 932 | Mean Difference (IV, Fixed, 95% CI) | ‐0.87 [‐1.29, ‐0.45] |
| 18.3 104 weeks | 2 | 945 | Mean Difference (IV, Fixed, 95% CI) | ‐1.57 [‐1.99, ‐1.16] |
| 19 Joint Space Narrowing Show forest plot | 2 | Mean Difference (IV, Fixed, 95% CI) | Subtotals only | |
| 19.1 24 weeks | 2 | 975 | Mean Difference (IV, Fixed, 95% CI) | ‐0.20 [‐0.35, ‐0.04] |
| 19.2 48‐56 weeks | 1 | 456 | Mean Difference (IV, Fixed, 95% CI) | ‐0.58 [‐0.98, ‐0.18] |
| 19.3 104 weeks | 2 | 944 | Mean Difference (IV, Fixed, 95% CI) | ‐0.48 [‐0.67, ‐0.29] |
| 20 Radiologic erosions Show forest plot | 2 | Mean Difference (IV, Fixed, 95% CI) | Subtotals only | |
| 20.1 24 weeks | 2 | 975 | Mean Difference (IV, Fixed, 95% CI) | ‐0.33 [‐0.55, ‐0.11] |
| 20.2 48‐56 weeks | 2 | 932 | Mean Difference (IV, Fixed, 95% CI) | ‐0.56 [‐0.83, ‐0.30] |
| 20.3 104 weeks | 2 | 945 | Mean Difference (IV, Fixed, 95% CI) | ‐1.09 [‐1.35, ‐0.83] |
| 21 No radiographic progression Show forest plot | 2 | Risk Ratio (M‐H, Fixed, 95% CI) | Subtotals only | |
| 21.1 24 weeks | 1 | 476 | Risk Ratio (M‐H, Fixed, 95% CI) | 1.18 [1.03, 1.35] |
| 21.2 52‐56 weeks | 2 | 940 | Risk Ratio (M‐H, Fixed, 95% CI) | 1.25 [1.11, 1.40] |
| 21.3 104 weeks | 2 | 945 | Risk Ratio (M‐H, Fixed, 95% CI) | 1.50 [1.30, 1.73] |
| 22 No worsening of erosions Show forest plot | 2 | Risk Ratio (M‐H, Fixed, 95% CI) | Subtotals only | |
| 22.1 24 weeks | 1 | 445 | Risk Ratio (M‐H, Fixed, 95% CI) | 1.10 [0.95, 1.27] |
| 22.2 52‐56 weeks | 1 | 464 | Risk Ratio (M‐H, Fixed, 95% CI) | 1.29 [1.09, 1.52] |
| 22.3 104 weeks | 2 | 945 | Risk Ratio (M‐H, Fixed, 95% CI) | 1.45 [1.27, 1.67] |
| Outcome or subgroup title | No. of studies | No. of participants | Statistical method | Effect size |
| 1 ACR 20 Show forest plot | 1 | Risk Ratio (M‐H, Fixed, 95% CI) | Totals not selected | |
| 1.1 24 weeks | 1 | Risk Ratio (M‐H, Fixed, 95% CI) | 0.0 [0.0, 0.0] | |
| 1.2 48 weeks | 1 | Risk Ratio (M‐H, Fixed, 95% CI) | 0.0 [0.0, 0.0] | |
| 1.3 104 weeks | 1 | Risk Ratio (M‐H, Fixed, 95% CI) | 0.0 [0.0, 0.0] | |
| 2 ACR 50 Show forest plot | 1 | Risk Ratio (M‐H, Fixed, 95% CI) | Totals not selected | |
| 2.1 24 weeks | 1 | Risk Ratio (M‐H, Fixed, 95% CI) | 0.0 [0.0, 0.0] | |
| 2.2 48‐56 weeks | 1 | Risk Ratio (M‐H, Fixed, 95% CI) | 0.0 [0.0, 0.0] | |
| 2.3 104 weeks | 1 | Risk Ratio (M‐H, Fixed, 95% CI) | 0.0 [0.0, 0.0] | |
| 3 ACR 70 Show forest plot | 1 | Risk Ratio (M‐H, Fixed, 95% CI) | Totals not selected | |
| 3.1 24 weeks | 1 | Risk Ratio (M‐H, Fixed, 95% CI) | 0.0 [0.0, 0.0] | |
| 3.2 48‐56 weeks | 1 | Risk Ratio (M‐H, Fixed, 95% CI) | 0.0 [0.0, 0.0] | |
| 3.3 104 weeks | 1 | Risk Ratio (M‐H, Fixed, 95% CI) | 0.0 [0.0, 0.0] | |
| 4 DAS 28 Show forest plot | 1 | Mean Difference (IV, Fixed, 95% CI) | Subtotals only | |
| 4.1 24 weeks | 1 | 80 | Mean Difference (IV, Fixed, 95% CI) | ‐0.9 [‐1.47, ‐0.33] |
| 5 Moderate or good EULAR response Show forest plot | 1 | Risk Ratio (M‐H, Fixed, 95% CI) | Subtotals only | |
| 5.1 24 weeks | 1 | 80 | Risk Ratio (M‐H, Fixed, 95% CI) | 1.7 [1.21, 2.38] |
| 6 HAQ‐DI Show forest plot | 1 | Mean Difference (IV, Fixed, 95% CI) | Subtotals only | |
| 6.1 24 weeks | 1 | 75 | Mean Difference (IV, Fixed, 95% CI) | ‐0.4 [‐0.65, ‐0.15] |
| 6.2 48 weeks | 1 | 56 | Mean Difference (IV, Fixed, 95% CI) | ‐0.20 [‐0.49, 0.09] |
| 6.3 72 weeks | 1 | 32 | Mean Difference (IV, Fixed, 95% CI) | ‐0.3 [‐0.68, 0.08] |
| 7 % of patients achieving HAQ‐DI MCID=‐0.25 Show forest plot | 1 | Risk Ratio (M‐H, Fixed, 95% CI) | Subtotals only | |
| 7.1 24 weeks | 1 | 75 | Risk Ratio (M‐H, Fixed, 95% CI) | 1.49 [0.99, 2.25] |
| 7.2 48‐56 weeks | 1 | 56 | Risk Ratio (M‐H, Fixed, 95% CI) | 1.50 [0.71, 3.18] |
| 7.3 72 weeks | 1 | 32 | Risk Ratio (M‐H, Fixed, 95% CI) | 0.88 [0.21, 3.73] |
| 7.4 104 weeks | 1 | 10 | Risk Ratio (M‐H, Fixed, 95% CI) | 1.50 [0.13, 17.67] |
| Outcome or subgroup title | No. of studies | No. of participants | Statistical method | Effect size |
| 1 ACR 20 Show forest plot | 3 | Risk Difference (M‐H, Fixed, 95% CI) | Subtotals only | |
| 1.1 24 weeks | 2 | 584 | Risk Difference (M‐H, Fixed, 95% CI) | 0.30 [0.22, 0.37] |
| 1.2 48‐52 weeks | 2 | 598 | Risk Difference (M‐H, Fixed, 95% CI) | 0.14 [0.07, 0.21] |
| 1.3 104 weeks | 1 | 498 | Risk Difference (M‐H, Fixed, 95% CI) | 0.16 [0.08, 0.25] |
| 2 ACR 50 Show forest plot | 3 | Risk Ratio (M‐H, Fixed, 95% CI) | Subtotals only | |
| 2.1 24 weeks | 2 | 584 | Risk Ratio (M‐H, Fixed, 95% CI) | 2.69 [1.85, 3.90] |
| 2.2 48‐52 weeks | 2 | 598 | Risk Ratio (M‐H, Fixed, 95% CI) | 1.47 [1.23, 1.74] |
| 2.3 104 weeks | 1 | 498 | Risk Ratio (M‐H, Fixed, 95% CI) | 1.42 [1.19, 1.69] |
| 3 ACR 70 Show forest plot | 3 | Risk Ratio (M‐H, Random, 95% CI) | Subtotals only | |
| 3.1 24 weeks | 2 | 584 | Risk Ratio (M‐H, Random, 95% CI) | 2.07 [1.14, 3.77] |
| 3.2 48‐52 weeks | 2 | 598 | Risk Ratio (M‐H, Random, 95% CI) | 1.42 [0.71, 2.86] |
| 3.3 104 weeks | 1 | 498 | Risk Ratio (M‐H, Random, 95% CI) | 1.69 [1.31, 2.20] |
| 4 ACR 90 Show forest plot | 1 | Risk Ratio (M‐H, Fixed, 95% CI) | Totals not selected | |
| 4.1 52 weeks | 1 | Risk Ratio (M‐H, Fixed, 95% CI) | 0.0 [0.0, 0.0] | |
| 4.2 104 weeks | 1 | Risk Ratio (M‐H, Fixed, 95% CI) | 0.0 [0.0, 0.0] | |
| 5 DAS 28 Show forest plot | 3 | Mean Difference (IV, Fixed, 95% CI) | Subtotals only | |
| 5.1 24 weeks | 3 | 1079 | Mean Difference (IV, Fixed, 95% CI) | ‐0.96 [‐1.11, ‐0.81] |
| 5.2 52 weeks | 1 | 498 | Mean Difference (IV, Fixed, 95% CI) | ‐0.99 [‐1.21, ‐0.77] |
| 5.3 104 weeks | 1 | 498 | Mean Difference (IV, Fixed, 95% CI) | ‐1.59 [‐1.81, ‐1.37] |
| 6 LDA (DAS28 =or<3.2) Show forest plot | 3 | Risk Ratio (M‐H, Fixed, 95% CI) | Subtotals only | |
| 6.1 24 weeks | 1 | 339 | Risk Ratio (M‐H, Fixed, 95% CI) | 3.73 [1.76, 7.93] |
| 6.2 48‐52 weeks | 2 | 598 | Risk Ratio (M‐H, Fixed, 95% CI) | 1.94 [1.48, 2.56] |
| 6.3 104 weeks | 1 | 498 | Risk Ratio (M‐H, Fixed, 95% CI) | 1.81 [1.40, 2.33] |
| 7 Clinical Remission (DAS28<2.6) Show forest plot | 3 | Risk Ratio (M‐H, Fixed, 95% CI) | Subtotals only | |
| 7.1 24 weeks | 1 | 498 | Risk Ratio (M‐H, Fixed, 95% CI) | 4.0 [1.36, 11.80] |
| 7.2 48 weeks | 2 | 598 | Risk Ratio (M‐H, Fixed, 95% CI) | 2.03 [1.40, 2.96] |
| 7.3 104 weeks | 1 | 498 | Risk Ratio (M‐H, Fixed, 95% CI) | 2.66 [1.84, 3.83] |
| 8 Moderate or good EULAR response Show forest plot | 3 | Risk Ratio (M‐H, Fixed, 95% CI) | Subtotals only | |
| 8.1 24 weeks | 3 | 1082 | Risk Ratio (M‐H, Fixed, 95% CI) | 1.85 [1.58, 2.17] |
| 8.2 52 weeks | 1 | 498 | Risk Ratio (M‐H, Fixed, 95% CI) | 2.11 [1.56, 2.86] |
| 8.3 104 weeks | 1 | 498 | Risk Ratio (M‐H, Fixed, 95% CI) | 1.93 [1.48, 2.52] |
| 9 HAQ‐DI Show forest plot | 2 | Mean Difference (IV, Fixed, 95% CI) | Subtotals only | |
| 9.1 24 weeks | 2 | 742 | Mean Difference (IV, Fixed, 95% CI) | ‐0.22 [‐0.30, ‐0.14] |
| 9.2 52 weeks | 1 | 498 | Mean Difference (IV, Fixed, 95% CI) | ‐0.28 [‐0.37, ‐0.18] |
| 9.3 104 weeks | 1 | 498 | Mean Difference (IV, Fixed, 95% CI) | ‐0.34 [‐0.44, ‐0.24] |
| 10 HAQ‐DI MCID=‐0.22 Show forest plot | 3 | Risk Ratio (M‐H, Random, 95% CI) | Subtotals only | |
| 10.1 24 weeks | 2 | 582 | Risk Ratio (M‐H, Random, 95% CI) | 1.58 [1.18, 2.11] |
| 10.2 52 weeks | 1 | 498 | Risk Ratio (M‐H, Random, 95% CI) | 1.13 [1.04, 1.22] |
| 10.3 104 weeks | 1 | 498 | Risk Ratio (M‐H, Random, 95% CI) | 1.36 [1.21, 1.52] |
| 11 SF‐36 PCS Show forest plot | 3 | 1018 | Mean Difference (IV, Fixed, 95% CI) | ‐3.52 [‐4.49, ‐2.56] |
| 11.1 24 weeks | 2 | 543 | Mean Difference (IV, Fixed, 95% CI) | ‐4.07 [‐5.36, ‐2.78] |
| 11.2 52 weeks | 1 | 475 | Mean Difference (IV, Fixed, 95% CI) | ‐2.84 [‐4.29, ‐1.39] |
| 12 SF‐36 PCS (=or>MCID of 5 or 5.42) Show forest plot | 3 | 1018 | Risk Ratio (M‐H, Random, 95% CI) | 1.53 [0.98, 2.39] |
| 12.1 24 weeks | 2 | 543 | Risk Ratio (M‐H, Random, 95% CI) | 1.84 [1.21, 2.80] |
| 12.2 52 weeks | 1 | 475 | Risk Ratio (M‐H, Random, 95% CI) | 1.11 [0.97, 1.26] |
| 13 SF‐36 MCS Show forest plot | 3 | 1021 | Mean Difference (IV, Fixed, 95% CI) | ‐1.81 [‐3.25, ‐0.36] |
| 13.1 24 weeks | 2 | 546 | Mean Difference (IV, Fixed, 95% CI) | ‐2.16 [‐4.07, ‐0.25] |
| 13.2 52 weeks | 1 | 475 | Mean Difference (IV, Fixed, 95% CI) | ‐1.33 [‐3.55, 0.88] |
| 14 SF‐36 MCS (=or>MCID of 6.33) Show forest plot | 2 | 774 | Risk Ratio (M‐H, Random, 95% CI) | 1.16 [0.87, 1.55] |
| 14.1 24 weeks | 1 | 299 | Risk Ratio (M‐H, Random, 95% CI) | 1.41 [0.98, 2.03] |
| 14.2 52 weeks | 1 | 475 | Risk Ratio (M‐H, Random, 95% CI) | 1.04 [0.87, 1.24] |
| 15 FACIT‐F Show forest plot | 3 | 1063 | Mean Difference (IV, Fixed, 95% CI) | ‐3.09 [‐4.35, ‐1.83] |
| 15.1 24 weeks | 2 | 580 | Mean Difference (IV, Fixed, 95% CI) | ‐3.54 [‐5.23, ‐1.85] |
| 15.2 52 weeks | 1 | 483 | Mean Difference (IV, Fixed, 95% CI) | ‐2.53 [‐4.42, ‐0.64] |
| 16 FACIT‐F (= or > MCID of 3.5 or 4) Show forest plot | 1 | Risk Ratio (M‐H, Fixed, 95% CI) | Subtotals only | |
| 16.1 24 weeks | 1 | 245 | Risk Ratio (M‐H, Fixed, 95% CI) | 1.57 [1.18, 2.09] |
| 17 VAS pain Show forest plot | 2 | 739 | Mean Difference (IV, Fixed, 95% CI) | ‐8.30 [‐12.25, ‐4.35] |
| 17.1 24 weeks | 1 | 245 | Mean Difference (IV, Fixed, 95% CI) | ‐8.1 [‐14.96, ‐1.24] |
| 17.2 52 weeks | 1 | 494 | Mean Difference (IV, Fixed, 95% CI) | ‐8.40 [‐13.23, ‐3.57] |
| 18 Total radiographic score Show forest plot | 1 | Mean Difference (IV, Fixed, 95% CI) | Subtotals only | |
| 18.1 24 weeks | 1 | 471 | Mean Difference (IV, Fixed, 95% CI) | ‐0.12 [‐0.61, 0.37] |
| 18.2 52 weeks | 1 | 471 | Mean Difference (IV, Fixed, 95% CI) | ‐0.43 [‐0.92, 0.06] |
| 18.3 104 weeks | 1 | 472 | Mean Difference (IV, Fixed, 95% CI) | ‐1.19 [‐1.68, ‐0.70] |
| 19 Joint Space Narrowing Show forest plot | 1 | Mean Difference (IV, Fixed, 95% CI) | Subtotals only | |
| 19.1 104 weeks | 1 | 472 | Mean Difference (IV, Fixed, 95% CI) | ‐0.37 [‐0.59, ‐0.15] |
| 20 Radiologic erosions Show forest plot | 1 | Mean Difference (IV, Fixed, 95% CI) | Subtotals only | |
| 20.1 52 weeks | 1 | 471 | Mean Difference (IV, Fixed, 95% CI) | ‐0.29 [‐0.59, 0.02] |
| 20.2 104 weeks | 1 | 472 | Mean Difference (IV, Fixed, 95% CI) | ‐0.82 [‐1.13, ‐0.51] |
| 21 No radiographic progression Show forest plot | 1 | Risk Ratio (M‐H, Fixed, 95% CI) | Subtotals only | |
| 21.1 24 weeks | 1 | 472 | Risk Ratio (M‐H, Fixed, 95% CI) | 1.33 [1.07, 1.64] |
| 22 No increase in erosion score Show forest plot | 1 | Risk Ratio (M‐H, Fixed, 95% CI) | Subtotals only | |
| 22.1 24 weeks | 1 | 472 | Risk Ratio (M‐H, Fixed, 95% CI) | 1.39 [1.14, 1.70] |
| Outcome or subgroup title | No. of studies | No. of participants | Statistical method | Effect size |
| 1 ACR 20 Show forest plot | 1 | Risk Ratio (M‐H, Fixed, 95% CI) | Subtotals only | |
| 1.1 24 weeks | 1 | 81 | Risk Ratio (M‐H, Fixed, 95% CI) | 2.02 [1.30, 3.12] |
| 1.2 48 weeks | 1 | 81 | Risk Ratio (M‐H, Fixed, 95% CI) | 2.44 [1.22, 4.89] |
| 1.3 104 weeks | 1 | 81 | Risk Ratio (M‐H, Fixed, 95% CI) | 0.98 [0.31, 3.11] |
| 2 ACR 50 Show forest plot | 1 | Risk Ratio (M‐H, Fixed, 95% CI) | Subtotals only | |
| 2.1 24 weeks | 1 | 81 | Risk Ratio (M‐H, Fixed, 95% CI) | 3.32 [1.35, 8.13] |
| 2.2 48 weeks | 1 | 81 | Risk Ratio (M‐H, Fixed, 95% CI) | 4.88 [1.14, 20.89] |
| 2.3 104 weeks | 1 | 81 | Risk Ratio (M‐H, Fixed, 95% CI) | 0.98 [0.26, 3.64] |
| 3 ACR 70 Show forest plot | 1 | Risk Ratio (M‐H, Fixed, 95% CI) | Subtotals only | |
| 3.1 24 weeks | 1 | 81 | Risk Ratio (M‐H, Fixed, 95% CI) | 2.93 [0.63, 13.65] |
| 3.2 48 weeks | 1 | 81 | Risk Ratio (M‐H, Fixed, 95% CI) | 8.79 [0.49, 158.07] |
| 3.3 104 weeks | 1 | 81 | Risk Ratio (M‐H, Fixed, 95% CI) | 0.98 [0.21, 4.55] |
| 4 DAS 28 Show forest plot | 1 | Mean Difference (IV, Fixed, 95% CI) | Subtotals only | |
| 4.1 24 weeks | 1 | 81 | Mean Difference (IV, Fixed, 95% CI) | ‐1.3 [‐1.89, ‐0.71] |
| 5 Moderate or good EULAR response Show forest plot | 1 | Risk Ratio (M‐H, Fixed, 95% CI) | Subtotals only | |
| 5.1 24 weeks | 1 | 81 | Risk Ratio (M‐H, Fixed, 95% CI) | 1.71 [1.22, 2.39] |
| 6 HAQ‐DI Show forest plot | 1 | Mean Difference (IV, Fixed, 95% CI) | Subtotals only | |
| 6.1 24 weeks | 1 | 74 | Mean Difference (IV, Fixed, 95% CI) | ‐0.20 [‐0.48, 0.08] |
| 6.2 48 weeks | 1 | 59 | Mean Difference (IV, Fixed, 95% CI) | 0.0 [‐0.31, 0.31] |
| 6.3 72 weeks | 1 | 37 | Mean Difference (IV, Fixed, 95% CI) | 0.20 [‐0.19, 0.59] |
| 7 HAQ‐DI MCID=‐0.22 Show forest plot | 1 | Risk Ratio (M‐H, Fixed, 95% CI) | Subtotals only | |
| 7.1 24 weeks | 1 | 74 | Risk Ratio (M‐H, Fixed, 95% CI) | 1.29 [0.83, 2.01] |
| 7.2 48‐56 weeks | 1 | 59 | Risk Ratio (M‐H, Fixed, 95% CI) | 1.37 [0.64, 2.92] |
| 7.3 72 weeks | 1 | 37 | Risk Ratio (M‐H, Fixed, 95% CI) | 1.14 [0.32, 4.05] |
| 7.4 104 weeks | 1 | 15 | Risk Ratio (M‐H, Fixed, 95% CI) | 0.67 [0.05, 8.73] |
| Outcome or subgroup title | No. of studies | No. of participants | Statistical method | Effect size |
| 1 ACR 20 Show forest plot | 1 | Risk Ratio (M‐H, Fixed, 95% CI) | Subtotals only | |
| 1.1 24 weeks | 1 | 51 | Risk Ratio (M‐H, Fixed, 95% CI) | 1.82 [0.57, 5.77] |
| 2 ACR 50 Show forest plot | 1 | Risk Ratio (M‐H, Fixed, 95% CI) | Subtotals only | |
| 2.1 24 weeks | 1 | 45 | Risk Ratio (M‐H, Fixed, 95% CI) | 1.45 [0.18, 11.75] |
| 3 LDA (DAS28 =or<3.2) Show forest plot | 1 | Risk Ratio (M‐H, Fixed, 95% CI) | Subtotals only | |
| 3.1 24 weeks | 1 | 51 | Risk Ratio (M‐H, Fixed, 95% CI) | 2.18 [0.52, 9.20] |
| 4 Clinical Remission (DAS28<2.6) Show forest plot | 1 | Risk Ratio (M‐H, Fixed, 95% CI) | Subtotals only | |
| 4.1 24 weeks | 1 | 51 | Risk Ratio (M‐H, Fixed, 95% CI) | 3.27 [0.43, 25.11] |
| 5 HAQ‐DI MCID=‐0.25 Show forest plot | 1 | Risk Ratio (M‐H, Fixed, 95% CI) | Subtotals only | |
| 5.1 24 weeks | 1 | 51 | Risk Ratio (M‐H, Fixed, 95% CI) | 3.82 [1.59, 9.17] |
| Outcome or subgroup title | No. of studies | No. of participants | Statistical method | Effect size |
| 1 Total discontinuations Show forest plot | 5 | Risk Ratio (M‐H, Random, 95% CI) | Subtotals only | |
| 1.1 24 weeks | 4 | 1282 | Risk Ratio (M‐H, Random, 95% CI) | 0.40 [0.32, 0.50] |
| 1.2 48‐52 weeks | 4 | 1444 | Risk Ratio (M‐H, Random, 95% CI) | 0.61 [0.40, 0.91] |
| 1.3 72 weeks | 1 | 80 | Risk Ratio (M‐H, Random, 95% CI) | 0.48 [0.28, 0.82] |
| 1.4 104 weeks | 2 | 579 | Risk Ratio (M‐H, Random, 95% CI) | 0.58 [0.45, 0.75] |
| 2 Lack of efficacy Show forest plot | 5 | Risk Ratio (M‐H, Fixed, 95% CI) | Subtotals only | |
| 2.1 24 weeks | 4 | 1282 | Risk Ratio (M‐H, Fixed, 95% CI) | 0.30 [0.23, 0.39] |
| 2.2 48‐52 weeks | 3 | 927 | Risk Ratio (M‐H, Fixed, 95% CI) | 0.15 [0.06, 0.36] |
| 2.3 72 weeks | 1 | 80 | Risk Ratio (M‐H, Fixed, 95% CI) | 0.44 [0.15, 1.33] |
| 2.4 104 weeks | 1 | 80 | Risk Ratio (M‐H, Fixed, 95% CI) | 0.24 [0.09, 0.64] |
| 3 Adverse Events Show forest plot | 5 | Risk Ratio (M‐H, Fixed, 95% CI) | Subtotals only | |
| 3.1 24 weeks | 4 | 1282 | Risk Ratio (M‐H, Fixed, 95% CI) | 2.72 [1.04, 7.13] |
| 3.2 48‐52 weeks | 3 | 927 | Risk Ratio (M‐H, Fixed, 95% CI) | 1.00 [0.44, 2.29] |
| 3.3 72 weeks | 1 | 80 | Risk Ratio (M‐H, Fixed, 95% CI) | 0.33 [0.04, 3.07] |
| 3.4 104 weeks | 2 | 579 | Risk Ratio (M‐H, Fixed, 95% CI) | 0.56 [0.25, 1.25] |
| 4 Other reasons Show forest plot | 5 | Risk Ratio (M‐H, Fixed, 95% CI) | Subtotals only | |
| 4.1 24 weeks | 4 | 1282 | Risk Ratio (M‐H, Fixed, 95% CI) | 0.76 [0.32, 1.81] |
| 4.2 48‐52 weeks | 3 | 927 | Risk Ratio (M‐H, Fixed, 95% CI) | 0.84 [0.47, 1.49] |
| 4.3 72 weeks | 1 | 80 | Risk Ratio (M‐H, Fixed, 95% CI) | 0.54 [0.24, 1.21] |
| 4.4 104 weeks | 1 | 80 | Risk Ratio (M‐H, Fixed, 95% CI) | 1.31 [0.74, 2.32] |
| Outcome or subgroup title | No. of studies | No. of participants | Statistical method | Effect size |
| 1 Total discontinuations Show forest plot | 1 | Risk Ratio (M‐H, Fixed, 95% CI) | Subtotals only | |
| 1.1 24 weeks | 1 | 80 | Risk Ratio (M‐H, Fixed, 95% CI) | 0.67 [0.12, 3.78] |
| 1.2 48 weeks | 1 | 80 | Risk Ratio (M‐H, Fixed, 95% CI) | 0.6 [0.30, 1.21] |
| 1.3 72 weeks | 1 | 80 | Risk Ratio (M‐H, Fixed, 95% CI) | 0.92 [0.64, 1.32] |
| 1.4 104 weeks | 1 | 80 | Risk Ratio (M‐H, Fixed, 95% CI) | 1.06 [0.90, 1.25] |
| 2 Lack of efficacy Show forest plot | 1 | Risk Ratio (M‐H, Fixed, 95% CI) | Subtotals only | |
| 2.1 24 weeks | 1 | 80 | Risk Ratio (M‐H, Fixed, 95% CI) | 0.2 [0.01, 4.04] |
| 2.2 48 weeks | 1 | 80 | Risk Ratio (M‐H, Fixed, 95% CI) | 0.29 [0.06, 1.29] |
| 2.3 72 weeks | 1 | 80 | Risk Ratio (M‐H, Fixed, 95% CI) | 0.33 [0.10, 1.14] |
| 2.4 104 weeks | 1 | 80 | Risk Ratio (M‐H, Fixed, 95% CI) | 0.29 [0.12, 0.72] |
| 3 Adverse Events Show forest plot | 1 | Risk Ratio (M‐H, Fixed, 95% CI) | Subtotals only | |
| 3.1 24 weeks | 1 | 80 | Risk Ratio (M‐H, Fixed, 95% CI) | 2.0 [0.19, 21.18] |
| 3.2 48 weeks | 1 | 80 | Risk Ratio (M‐H, Fixed, 95% CI) | 1.33 [0.32, 5.58] |
| 3.3 72 weeks | 1 | 80 | Risk Ratio (M‐H, Fixed, 95% CI) | 1.67 [0.43, 6.51] |
| 3.4 104 weeks | 1 | 80 | Risk Ratio (M‐H, Fixed, 95% CI) | 1.25 [0.36, 4.32] |
| 4 Other reasons Show forest plot | 1 | Risk Ratio (M‐H, Fixed, 95% CI) | Subtotals only | |
| 4.1 24 weeks | 1 | 80 | Risk Ratio (M‐H, Fixed, 95% CI) | 0.0 [0.0, 0.0] |
| 4.2 48 weeks | 1 | 80 | Risk Ratio (M‐H, Fixed, 95% CI) | 0.6 [0.15, 2.34] |
| 4.3 72 weeks | 1 | 80 | Risk Ratio (M‐H, Fixed, 95% CI) | 1.15 [0.63, 2.10] |
| 4.4 104 weeks | 1 | 80 | Risk Ratio (M‐H, Fixed, 95% CI) | 2.0 [1.21, 3.30] |
| Outcome or subgroup title | No. of studies | No. of participants | Statistical method | Effect size |
| 1 Total discontinuations Show forest plot | 3 | Risk Ratio (M‐H, Fixed, 95% CI) | Subtotals only | |
| 1.1 24 weeks | 2 | 613 | Risk Ratio (M‐H, Fixed, 95% CI) | 0.30 [0.18, 0.50] |
| 1.2 48‐52 weeks | 2 | 844 | Risk Ratio (M‐H, Fixed, 95% CI) | 0.64 [0.43, 0.94] |
| 1.3 104 weeks | 1 | 498 | Risk Ratio (M‐H, Fixed, 95% CI) | 0.51 [0.36, 0.73] |
| 2 Lack of efficacy Show forest plot | 3 | Risk Ratio (M‐H, Fixed, 95% CI) | Subtotals only | |
| 2.1 24 weeks | 2 | 613 | Risk Ratio (M‐H, Fixed, 95% CI) | 0.20 [0.10, 0.39] |
| 2.2 48‐52 weeks | 2 | 844 | Risk Ratio (M‐H, Fixed, 95% CI) | 0.37 [0.19, 0.73] |
| 3 Adverse Events Show forest plot | 3 | Risk Ratio (M‐H, Fixed, 95% CI) | Subtotals only | |
| 3.1 24 weeks | 2 | 613 | Risk Ratio (M‐H, Fixed, 95% CI) | 2.40 [0.56, 10.36] |
| 3.2 48‐52 weeks | 2 | 844 | Risk Ratio (M‐H, Fixed, 95% CI) | 0.76 [0.27, 2.16] |
| 3.3 104 weeks | 1 | 498 | Risk Ratio (M‐H, Fixed, 95% CI) | 0.83 [0.37, 1.89] |
| 4 Other reasons Show forest plot | 3 | Risk Ratio (M‐H, Random, 95% CI) | Subtotals only | |
| 4.1 24 weeks | 2 | 613 | Risk Ratio (M‐H, Random, 95% CI) | 0.37 [0.05, 2.99] |
| 4.2 48‐52 weeks | 2 | 844 | Risk Ratio (M‐H, Random, 95% CI) | 1.00 [0.54, 1.87] |
| Outcome or subgroup title | No. of studies | No. of participants | Statistical method | Effect size |
| 1 Total discontinuations Show forest plot | 1 | Risk Ratio (M‐H, Fixed, 95% CI) | Subtotals only | |
| 1.1 24 weeks | 1 | 81 | Risk Ratio (M‐H, Fixed, 95% CI) | 1.30 [0.31, 5.45] |
| 1.2 48 weeks | 1 | 81 | Risk Ratio (M‐H, Fixed, 95% CI) | 0.46 [0.21, 1.00] |
| 1.3 72 weeks | 1 | 81 | Risk Ratio (M‐H, Fixed, 95% CI) | 0.74 [0.49, 1.11] |
| 1.4 104 weeks | 1 | 81 | Risk Ratio (M‐H, Fixed, 95% CI) | 0.92 [0.75, 1.13] |
| 2 Lack of efficacy Show forest plot | 1 | Risk Ratio (M‐H, Fixed, 95% CI) | Subtotals only | |
| 2.1 24 weeks | 1 | 81 | Risk Ratio (M‐H, Fixed, 95% CI) | 0.20 [0.01, 3.94] |
| 2.2 48 weeks | 1 | 81 | Risk Ratio (M‐H, Fixed, 95% CI) | 0.28 [0.06, 1.26] |
| 2.3 72 weeks | 1 | 81 | Risk Ratio (M‐H, Fixed, 95% CI) | 0.43 [0.15, 1.30] |
| 2.4 104 weeks | 1 | 81 | Risk Ratio (M‐H, Fixed, 95% CI) | 0.23 [0.08, 0.62] |
| 3 Adverse Events Show forest plot | 1 | Risk Ratio (M‐H, Fixed, 95% CI) | Subtotals only | |
| 3.1 24 weeks | 1 | 81 | Risk Ratio (M‐H, Fixed, 95% CI) | 1.95 [0.18, 20.68] |
| 3.2 48 weeks | 1 | 81 | Risk Ratio (M‐H, Fixed, 95% CI) | 0.65 [0.11, 3.69] |
| 3.3 72 weeks | 1 | 81 | Risk Ratio (M‐H, Fixed, 95% CI) | 1.30 [0.31, 5.45] |
| 3.4 104 weeks | 1 | 81 | Risk Ratio (M‐H, Fixed, 95% CI) | 0.98 [0.26, 3.64] |
| 4 Other reasons Show forest plot | 1 | Risk Ratio (M‐H, Fixed, 95% CI) | Subtotals only | |
| 4.1 24 weeks | 1 | 81 | Risk Ratio (M‐H, Fixed, 95% CI) | 4.88 [0.24, 98.60] |
| 4.2 48 weeks | 1 | 81 | Risk Ratio (M‐H, Fixed, 95% CI) | 0.59 [0.15, 2.29] |
| 4.3 72 weeks | 1 | 81 | Risk Ratio (M‐H, Fixed, 95% CI) | 0.83 [0.42, 1.62] |
| 4.4 104 weeks | 1 | 81 | Risk Ratio (M‐H, Fixed, 95% CI) | 1.88 [1.13, 3.12] |
| Outcome or subgroup title | No. of studies | No. of participants | Statistical method | Effect size |
| 1 Total discontinuations Show forest plot | 1 | Risk Ratio (M‐H, Fixed, 95% CI) | Subtotals only | |
| 1.1 24 weeks | 1 | 54 | Risk Ratio (M‐H, Fixed, 95% CI) | 2.57 [0.13, 50.83] |
| 2 Adverse events Show forest plot | 1 | Risk Ratio (M‐H, Fixed, 95% CI) | Subtotals only | |
| 2.1 24 weeks | 1 | 54 | Risk Ratio (M‐H, Fixed, 95% CI) | 2.57 [0.13, 50.83] |
| Outcome or subgroup title | No. of studies | No. of participants | Statistical method | Effect size |
| 1 Any Adverse Event Show forest plot | 5 | Risk Ratio (M‐H, Random, 95% CI) | Subtotals only | |
| 1.1 24 weeks | 4 | 1280 | Risk Ratio (M‐H, Random, 95% CI) | 1.06 [0.95, 1.18] |
| 1.2 48‐56 weeks | 2 | 579 | Risk Ratio (M‐H, Random, 95% CI) | 0.99 [0.91, 1.07] |
| 1.3 104 weeks | 1 | 499 | Risk Ratio (M‐H, Random, 95% CI) | 1.01 [0.94, 1.08] |
| 2 Serious Adverse Events Show forest plot | 5 | Risk Ratio (M‐H, Fixed, 95% CI) | Subtotals only | |
| 2.1 24 weeks | 4 | 1280 | Risk Ratio (M‐H, Fixed, 95% CI) | 1.01 [0.69, 1.49] |
| 2.2 48‐56 weeks | 2 | 579 | Risk Ratio (M‐H, Fixed, 95% CI) | 0.94 [0.57, 1.53] |
| 2.3 104 weeks | 1 | 499 | Risk Ratio (M‐H, Fixed, 95% CI) | 0.78 [0.51, 1.19] |
| 3 Infections Show forest plot | 3 | Risk Ratio (M‐H, Random, 95% CI) | Subtotals only | |
| 3.1 24 weeks | 2 | 683 | Risk Ratio (M‐H, Random, 95% CI) | 1.01 [0.68, 1.48] |
| 3.2 52 weeks | 1 | 499 | Risk Ratio (M‐H, Random, 95% CI) | 1.04 [0.88, 1.24] |
| 3.3 104 weeks | 1 | 499 | Risk Ratio (M‐H, Random, 95% CI) | 1.09 [0.95, 1.26] |
| 4 Serious infections Show forest plot | 4 | 1841 | Risk Ratio (M‐H, Fixed, 95% CI) | 0.68 [0.42, 1.10] |
| 4.1 24 weeks | 3 | 763 | Risk Ratio (M‐H, Fixed, 95% CI) | 0.78 [0.27, 2.25] |
| 4.2 48‐56 weeks | 2 | 579 | Risk Ratio (M‐H, Fixed, 95% CI) | 0.71 [0.31, 1.59] |
| 4.3 104 weeks | 1 | 499 | Risk Ratio (M‐H, Fixed, 95% CI) | 0.63 [0.31, 1.27] |
| 5 Death Show forest plot | 5 | Risk Difference (M‐H, Fixed, 95% CI) | Subtotals only | |
| 5.1 24 weeks | 4 | 1280 | Risk Difference (M‐H, Fixed, 95% CI) | ‐0.00 [‐0.01, 0.01] |
| 5.2 52 weeks | 1 | 499 | Risk Difference (M‐H, Fixed, 95% CI) | ‐0.01 [‐0.03, 0.00] |
| 5.3 104 weeks | 1 | 499 | Risk Difference (M‐H, Fixed, 95% CI) | ‐0.01 [‐0.02, 0.01] |
| 6 Arthralgia Show forest plot | 3 | Risk Ratio (M‐H, Fixed, 95% CI) | Subtotals only | |
| 6.1 24 weeks | 3 | 938 | Risk Ratio (M‐H, Fixed, 95% CI) | 1.33 [0.76, 2.34] |
| 7 Cardiac event (any) Show forest plot | 1 | Risk Ratio (M‐H, Fixed, 95% CI) | Subtotals only | |
| 7.1 52 weeks | 1 | 499 | Risk Ratio (M‐H, Fixed, 95% CI) | 2.68 [0.72, 9.98] |
| 8 Cardiac event (serious) Show forest plot | 1 | Risk Ratio (M‐H, Fixed, 95% CI) | Subtotals only | |
| 8.1 52 weeks | 1 | 499 | Risk Ratio (M‐H, Fixed, 95% CI) | 7.03 [0.36, 135.36] |
| 9 Cough Show forest plot | 2 | Risk Ratio (M‐H, Random, 95% CI) | Subtotals only | |
| 9.1 24 weeks | 2 | 597 | Risk Ratio (M‐H, Random, 95% CI) | 1.06 [0.17, 6.49] |
| 10 Diarrhea Show forest plot | 2 | Risk Ratio (M‐H, Fixed, 95% CI) | Subtotals only | |
| 10.1 24 weeks | 2 | 858 | Risk Ratio (M‐H, Fixed, 95% CI) | 0.71 [0.41, 1.22] |
| 11 Exacerbation of RA Show forest plot | 4 | Risk Ratio (M‐H, Fixed, 95% CI) | Subtotals only | |
| 11.1 24 weeks | 3 | 938 | Risk Ratio (M‐H, Fixed, 95% CI) | 0.46 [0.37, 0.58] |
| 11.2 48‐56 weeks | 2 | 579 | Risk Ratio (M‐H, Fixed, 95% CI) | 2.01 [0.18, 22.00] |
| 12 Fatigue Show forest plot | 2 | Risk Ratio (M‐H, Fixed, 95% CI) | Subtotals only | |
| 12.1 24 weeks | 2 | 858 | Risk Ratio (M‐H, Fixed, 95% CI) | 1.03 [0.59, 1.79] |
| 13 HACA Show forest plot | 3 | Risk Ratio (M‐H, Random, 95% CI) | Subtotals only | |
| 13.1 24 weeks | 3 | 1200 | Risk Ratio (M‐H, Random, 95% CI) | 3.17 [0.76, 13.25] |
| 14 Headache Show forest plot | 2 | Risk Ratio (M‐H, Fixed, 95% CI) | Subtotals only | |
| 14.1 24 weeks | 2 | 858 | Risk Ratio (M‐H, Fixed, 95% CI) | 0.89 [0.60, 1.34] |
| 15 Hypertension Show forest plot | 3 | Risk Ratio (M‐H, Fixed, 95% CI) | Subtotals only | |
| 15.1 24 weeks | 3 | 938 | Risk Ratio (M‐H, Fixed, 95% CI) | 1.59 [0.96, 2.61] |
| 16 Infusion‐related reactions (1st course ‐1st infusion) Show forest plot | 5 | Risk Ratio (M‐H, Fixed, 95% CI) | Subtotals only | |
| 16.1 24 weeks | 4 | 1280 | Risk Ratio (M‐H, Fixed, 95% CI) | 1.59 [1.29, 1.96] |
| 16.2 52 weeks | 1 | 499 | Risk Ratio (M‐H, Fixed, 95% CI) | 1.49 [0.98, 2.27] |
| 16.3 104 weeks | 1 | 499 | Risk Ratio (M‐H, Fixed, 95% CI) | 1.48 [0.97, 2.25] |
| 17 Infusion‐related reaction (1st course ‐2nd infusion) Show forest plot | 2 | Risk Ratio (M‐H, Fixed, 95% CI) | Subtotals only | |
| 17.1 24 weeks | 2 | 761 | Risk Ratio (M‐H, Fixed, 95% CI) | 0.79 [0.52, 1.22] |
| 18 Infusion‐related reaction (2nd course) Show forest plot | 1 | Risk Ratio (M‐H, Fixed, 95% CI) | Subtotals only | |
| 18.1 52 weeks | 1 | 499 | Risk Ratio (M‐H, Fixed, 95% CI) | 1.10 [0.62, 1.97] |
| 18.2 104 weeks | 1 | 499 | Risk Ratio (M‐H, Fixed, 95% CI) | 1.00 [0.56, 1.78] |
| 19 Infusion‐related reaction (3rd course) Show forest plot | 1 | Risk Ratio (M‐H, Fixed, 95% CI) | Subtotals only | |
| 19.1 52 weeks | 1 | 499 | Risk Ratio (M‐H, Fixed, 95% CI) | 1.29 [0.49, 3.41] |
| 19.2 104 weeks | 1 | 499 | Risk Ratio (M‐H, Fixed, 95% CI) | 1.20 [0.53, 2.72] |
| 20 Infusion‐related reaction (4th course) Show forest plot | 1 | Risk Ratio (M‐H, Fixed, 95% CI) | Subtotals only | |
| 20.1 104 weeks | 1 | 499 | Risk Ratio (M‐H, Fixed, 95% CI) | 0.80 [0.32, 1.99] |
| 21 Infusion‐related reaction (5th course) Show forest plot | 1 | Risk Ratio (M‐H, Fixed, 95% CI) | Subtotals only | |
| 21.1 104 weeks | 1 | 499 | Risk Ratio (M‐H, Fixed, 95% CI) | 1.49 [0.25, 8.86] |
| 22 Lower gastrointestinal events Show forest plot | 2 | Risk Ratio (M‐H, Fixed, 95% CI) | Subtotals only | |
| 22.1 24 weeks | 2 | 683 | Risk Ratio (M‐H, Fixed, 95% CI) | 0.74 [0.43, 1.26] |
| 23 Malignancy Show forest plot | 5 | Risk Ratio (M‐H, Fixed, 95% CI) | Subtotals only | |
| 23.1 24 weeks | 3 | 1175 | Risk Ratio (M‐H, Fixed, 95% CI) | 0.87 [0.16, 4.63] |
| 23.2 48‐56 weeks | 2 | 579 | Risk Ratio (M‐H, Fixed, 95% CI) | 0.20 [0.02, 1.71] |
| 23.3 104 weeks | 1 | 499 | Risk Ratio (M‐H, Fixed, 95% CI) | 0.43 [0.11, 1.63] |
| 24 Nasopharyngitis Show forest plot | 3 | Risk Ratio (M‐H, Fixed, 95% CI) | Subtotals only | |
| 24.1 24 weeks | 3 | 938 | Risk Ratio (M‐H, Fixed, 95% CI) | 1.07 [0.66, 1.74] |
| 25 Nausea Show forest plot | 3 | Risk Ratio (M‐H, Fixed, 95% CI) | Subtotals only | |
| 25.1 24 weeks | 3 | 938 | Risk Ratio (M‐H, Fixed, 95% CI) | 0.86 [0.52, 1.43] |
| 26 Pyrexia Show forest plot | 1 | Risk Ratio (M‐H, Fixed, 95% CI) | Subtotals only | |
| 26.1 24 weeks | 1 | 517 | Risk Ratio (M‐H, Fixed, 95% CI) | 1.45 [0.60, 3.50] |
| 27 Upper respiratory tract infection Show forest plot | 2 | 1016 | Risk Ratio (M‐H, Fixed, 95% CI) | 1.09 [0.60, 1.97] |
| 27.1 24 weeks | 1 | 517 | Risk Ratio (M‐H, Fixed, 95% CI) | 1.16 [0.62, 2.20] |
| 27.2 52 weeks | 1 | 499 | Risk Ratio (M‐H, Fixed, 95% CI) | 0.67 [0.11, 3.97] |
| 28 Urinary tract infection Show forest plot | 3 | 1357 | Risk Ratio (M‐H, Random, 95% CI) | 0.61 [0.29, 1.28] |
| 28.1 24 weeks | 2 | 858 | Risk Ratio (M‐H, Random, 95% CI) | 0.65 [0.27, 1.56] |
| 28.2 52 weeks | 1 | 499 | Risk Ratio (M‐H, Random, 95% CI) | 0.20 [0.01, 4.16] |
| 29 Vascular disorders Show forest plot | 4 | 1262 | Risk Ratio (M‐H, Fixed, 95% CI) | 1.54 [1.00, 2.38] |
| 29.1 24 weeks | 3 | 763 | Risk Ratio (M‐H, Fixed, 95% CI) | 1.90 [1.03, 3.51] |
| 29.2 52 weeks | 1 | 499 | Risk Ratio (M‐H, Fixed, 95% CI) | 1.24 [0.67, 2.29] |
| Outcome or subgroup title | No. of studies | No. of participants | Statistical method | Effect size |
| 1 Any Adverse Event Show forest plot | 1 | Risk Ratio (M‐H, Fixed, 95% CI) | Subtotals only | |
| 1.1 24 weeks | 1 | 80 | Risk Ratio (M‐H, Fixed, 95% CI) | 1.0 [0.80, 1.24] |
| 1.2 48 weeks | 1 | 80 | Risk Ratio (M‐H, Fixed, 95% CI) | 1.06 [0.90, 1.25] |
| 2 Serious Adverse Events Show forest plot | 1 | Risk Ratio (M‐H, Fixed, 95% CI) | Subtotals only | |
| 2.1 24 weeks | 1 | 80 | Risk Ratio (M‐H, Fixed, 95% CI) | 0.67 [0.12, 3.78] |
| 2.2 48 weeks | 1 | 80 | Risk Ratio (M‐H, Fixed, 95% CI) | 1.0 [0.27, 3.72] |
| 3 Serious Infections Show forest plot | 1 | Risk Ratio (M‐H, Fixed, 95% CI) | Subtotals only | |
| 3.1 24 weeks | 1 | 80 | Risk Ratio (M‐H, Fixed, 95% CI) | 2.0 [0.19, 21.18] |
| 3.2 48‐56 weeks | 1 | 80 | Risk Ratio (M‐H, Fixed, 95% CI) | 3.0 [0.13, 71.51] |
| 4 Death Show forest plot | 1 | Risk Ratio (M‐H, Fixed, 95% CI) | Subtotals only | |
| 4.1 24 weeks | 1 | 80 | Risk Ratio (M‐H, Fixed, 95% CI) | 3.0 [0.13, 71.51] |
| 5 Any Event Associated with 1st Infusion Show forest plot | 1 | Risk Ratio (M‐H, Fixed, 95% CI) | Subtotals only | |
| 5.1 24 weeks | 1 | 80 | Risk Ratio (M‐H, Fixed, 95% CI) | 1.5 [0.84, 2.69] |
| 6 Arthralgia Show forest plot | 1 | Risk Ratio (M‐H, Fixed, 95% CI) | Subtotals only | |
| 6.1 24 weeks | 1 | 80 | Risk Ratio (M‐H, Fixed, 95% CI) | 1.0 [0.21, 4.66] |
| 7 Back pain Show forest plot | 1 | Risk Ratio (M‐H, Fixed, 95% CI) | Subtotals only | |
| 7.1 24 weeks | 1 | 80 | Risk Ratio (M‐H, Fixed, 95% CI) | 2.0 [0.39, 10.31] |
| 8 Cough Show forest plot | 1 | Peto Odds Ratio (Peto, Fixed, 95% CI) | Subtotals only | |
| 8.1 24 weeks | 1 | 80 | Peto Odds Ratio (Peto, Fixed, 95% CI) | 8.22 [1.36, 49.69] |
| 9 Dyspnea Show forest plot | 1 | Risk Ratio (M‐H, Fixed, 95% CI) | Subtotals only | |
| 9.1 24 weeks | 1 | 80 | Risk Ratio (M‐H, Fixed, 95% CI) | 9.0 [0.50, 161.86] |
| 10 Exacerbation of RA Show forest plot | 1 | Risk Ratio (M‐H, Fixed, 95% CI) | Subtotals only | |
| 10.1 24 weeks | 1 | 80 | Risk Ratio (M‐H, Fixed, 95% CI) | 0.38 [0.16, 0.86] |
| 10.2 48‐56 weeks | 1 | 80 | Risk Ratio (M‐H, Fixed, 95% CI) | 3.0 [0.13, 71.51] |
| 11 Hypertension Show forest plot | 1 | Risk Ratio (M‐H, Fixed, 95% CI) | Subtotals only | |
| 11.1 24 weeks | 1 | 80 | Risk Ratio (M‐H, Fixed, 95% CI) | 1.0 [0.35, 2.84] |
| 12 Hypotension Show forest plot | 1 | Risk Ratio (M‐H, Fixed, 95% CI) | Subtotals only | |
| 12.1 24 weeks | 1 | 80 | Risk Ratio (M‐H, Fixed, 95% CI) | 1.71 [0.75, 3.90] |
| 13 Nasopharyngitis Show forest plot | 1 | Risk Ratio (M‐H, Fixed, 95% CI) | Subtotals only | |
| 13.1 24 weeks | 1 | 80 | Risk Ratio (M‐H, Fixed, 95% CI) | 0.67 [0.20, 2.18] |
| 14 Nausea Show forest plot | 1 | Risk Ratio (M‐H, Fixed, 95% CI) | Subtotals only | |
| 14.1 24 weeks | 1 | 80 | Risk Ratio (M‐H, Fixed, 95% CI) | 2.0 [0.19, 21.18] |
| 15 Rash Show forest plot | 1 | Risk Ratio (M‐H, Fixed, 95% CI) | Subtotals only | |
| 15.1 24 weeks | 1 | 80 | Risk Ratio (M‐H, Fixed, 95% CI) | 4.0 [0.47, 34.24] |
| Outcome or subgroup title | No. of studies | No. of participants | Statistical method | Effect size |
| 1 Any Adverse Event Show forest plot | 3 | Risk Ratio (M‐H, Fixed, 95% CI) | Subtotals only | |
| 1.1 24 weeks | 2 | 612 | Risk Ratio (M‐H, Fixed, 95% CI) | 1.08 [0.99, 1.18] |
| 1.2 52 weeks | 1 | 499 | Risk Ratio (M‐H, Fixed, 95% CI) | 0.93 [0.85, 1.02] |
| 1.3 104 weeks | 1 | 498 | Risk Ratio (M‐H, Fixed, 95% CI) | 0.96 [0.89, 1.03] |
| 2 Serious Adverse Events Show forest plot | 3 | Risk Ratio (M‐H, Random, 95% CI) | Subtotals only | |
| 2.1 24 weeks | 2 | 612 | Risk Ratio (M‐H, Random, 95% CI) | 1.02 [0.16, 6.45] |
| 2.2 52 weeks | 1 | 499 | Risk Ratio (M‐H, Random, 95% CI) | 0.89 [0.52, 1.51] |
| 2.3 104 weeks | 1 | 498 | Risk Ratio (M‐H, Random, 95% CI) | 0.88 [0.59, 1.32] |
| 3 Infections Show forest plot | 3 | Risk Ratio (M‐H, Fixed, 95% CI) | Subtotals only | |
| 3.1 24 weeks | 2 | 612 | Risk Ratio (M‐H, Fixed, 95% CI) | 1.05 [0.86, 1.29] |
| 3.2 52 weeks | 1 | 499 | Risk Ratio (M‐H, Fixed, 95% CI) | 1.03 [0.86, 1.22] |
| 3.3 104 weeks | 1 | 498 | Risk Ratio (M‐H, Fixed, 95% CI) | 1.11 [0.97, 1.27] |
| 4 Serious Infections Show forest plot | 3 | Risk Ratio (M‐H, Fixed, 95% CI) | Subtotals only | |
| 4.1 24 weeks | 2 | 612 | Risk Ratio (M‐H, Fixed, 95% CI) | 0.25 [0.04, 1.47] |
| 4.2 52 weeks | 1 | 499 | Risk Ratio (M‐H, Fixed, 95% CI) | 0.46 [0.18, 1.20] |
| 4.3 104 weeks | 1 | 498 | Risk Ratio (M‐H, Fixed, 95% CI) | 0.68 [0.35, 1.35] |
| 5 Death Show forest plot | 3 | Risk Ratio (M‐H, Fixed, 95% CI) | Subtotals only | |
| 5.1 24 weeks | 2 | 612 | Risk Ratio (M‐H, Fixed, 95% CI) | 3.33 [0.35, 31.82] |
| 5.2 52 weeks | 1 | 499 | Risk Ratio (M‐H, Fixed, 95% CI) | 0.14 [0.01, 2.76] |
| 5.3 104 weeks | 1 | 498 | Risk Ratio (M‐H, Fixed, 95% CI) | 0.67 [0.11, 3.96] |
| 6 Arthralgia Show forest plot | 1 | 273 | Risk Ratio (M‐H, Fixed, 95% CI) | 1.20 [0.36, 4.06] |
| 6.1 24 weeks | 1 | 273 | Risk Ratio (M‐H, Fixed, 95% CI) | 1.20 [0.36, 4.06] |
| 7 Cardiac event (any) Show forest plot | 1 | Risk Ratio (M‐H, Fixed, 95% CI) | Subtotals only | |
| 7.1 52 weeks | 1 | 499 | Risk Ratio (M‐H, Fixed, 95% CI) | 1.00 [0.20, 4.93] |
| 8 Cardiac event (serious) Show forest plot | 1 | Risk Ratio (M‐H, Fixed, 95% CI) | Subtotals only | |
| 8.1 52 weeks | 1 | 499 | Risk Ratio (M‐H, Fixed, 95% CI) | 5.02 [0.24, 104.04] |
| 9 Diarrhea Show forest plot | 1 | Risk Ratio (M‐H, Fixed, 95% CI) | Subtotals only | |
| 9.1 24 weeks | 1 | 273 | Risk Ratio (M‐H, Fixed, 95% CI) | 1.05 [0.39, 2.82] |
| 10 Exacerbation of RA Show forest plot | 2 | 772 | Risk Ratio (M‐H, Fixed, 95% CI) | 0.56 [0.36, 0.89] |
| 10.1 MTX vs RTX 500 mg + MTX | 1 | 273 | Risk Ratio (M‐H, Fixed, 95% CI) | 0.57 [0.36, 0.91] |
| 10.2 52 weeks | 1 | 499 | Risk Ratio (M‐H, Fixed, 95% CI) | 0.33 [0.01, 8.18] |
| 11 Fatigue Show forest plot | 1 | Risk Ratio (M‐H, Fixed, 95% CI) | Subtotals only | |
| 11.1 24 weeks | 1 | 273 | Risk Ratio (M‐H, Fixed, 95% CI) | 0.75 [0.25, 2.24] |
| 12 HACA Show forest plot | 2 | Risk Ratio (M‐H, Fixed, 95% CI) | Subtotals only | |
| 12.1 24 weeks | 2 | 612 | Risk Ratio (M‐H, Fixed, 95% CI) | 2.73 [1.17, 6.40] |
| 13 Headache Show forest plot | 1 | Risk Ratio (M‐H, Fixed, 95% CI) | Subtotals only | |
| 13.1 24 weeks | 1 | 273 | Risk Ratio (M‐H, Fixed, 95% CI) | 0.89 [0.46, 1.69] |
| 14 Hypertension Show forest plot | 1 | Risk Ratio (M‐H, Fixed, 95% CI) | Subtotals only | |
| 14.1 24 weeks | 1 | 273 | Risk Ratio (M‐H, Fixed, 95% CI) | 1.50 [0.41, 5.47] |
| 15 Infusion‐related reactions (1st course ‐ 1st infusion) Show forest plot | 3 | Risk Ratio (M‐H, Fixed, 95% CI) | Subtotals only | |
| 15.1 24 weeks | 2 | 584 | Risk Ratio (M‐H, Fixed, 95% CI) | 0.79 [0.46, 1.36] |
| 15.2 52 weeks | 1 | 499 | Risk Ratio (M‐H, Fixed, 95% CI) | 1.13 [0.72, 1.78] |
| 15.3 104 weeks | 1 | 498 | Risk Ratio (M‐H, Fixed, 95% CI) | 1.13 [0.72, 1.77] |
| 16 Infusion related reaction (1st course ‐2nd infusion) Show forest plot | 2 | Risk Ratio (M‐H, Fixed, 95% CI) | Subtotals only | |
| 16.1 24 weeks | 2 | 612 | Risk Ratio (M‐H, Fixed, 95% CI) | 1.51 [1.10, 2.09] |
| 17 Infusion related reaction (2nd course) Show forest plot | 1 | Risk Ratio (M‐H, Fixed, 95% CI) | Subtotals only | |
| 17.1 52 weeks | 1 | 499 | Risk Ratio (M‐H, Fixed, 95% CI) | 0.95 [0.52, 1.74] |
| 17.2 104 weeks | 1 | 498 | Risk Ratio (M‐H, Fixed, 95% CI) | 0.95 [0.53, 1.71] |
| 18 Infusion related reaction (3rd course) Show forest plot | 1 | Risk Ratio (M‐H, Fixed, 95% CI) | Subtotals only | |
| 18.1 52 weeks | 1 | 499 | Risk Ratio (M‐H, Fixed, 95% CI) | 0.29 [0.06, 1.37] |
| 18.2 104 weeks | 1 | 498 | Risk Ratio (M‐H, Fixed, 95% CI) | 1.1 [0.48, 2.54] |
| 19 Infusion related reaction (4th course) Show forest plot | 1 | Risk Ratio (M‐H, Fixed, 95% CI) | Subtotals only | |
| 19.1 104 weeks | 1 | 498 | Risk Ratio (M‐H, Fixed, 95% CI) | 1.0 [0.42, 2.36] |
| 20 Infusion related reaction (5th course) Show forest plot | 1 | Risk Ratio (M‐H, Fixed, 95% CI) | Subtotals only | |
| 20.1 104 weeks | 1 | 498 | Risk Ratio (M‐H, Fixed, 95% CI) | 0.5 [0.05, 5.48] |
| 21 Lower gastrointestinal events Show forest plot | 2 | Risk Ratio (M‐H, Fixed, 95% CI) | Subtotals only | |
| 21.1 24 weeks | 2 | 612 | Risk Ratio (M‐H, Fixed, 95% CI) | 0.89 [0.52, 1.50] |
| 22 Malignancy Show forest plot | 3 | Risk Ratio (M‐H, Fixed, 95% CI) | Subtotals only | |
| 22.1 24 weeks | 2 | 612 | Risk Ratio (M‐H, Fixed, 95% CI) | 1.03 [0.06, 16.33] |
| 22.2 52 weeks | 1 | 499 | Risk Ratio (M‐H, Fixed, 95% CI) | 0.40 [0.08, 2.05] |
| 22.3 104 weeks | 1 | 498 | Risk Ratio (M‐H, Fixed, 95% CI) | 0.86 [0.29, 2.51] |
| 23 Nasopharyngitis Show forest plot | 1 | Risk Ratio (M‐H, Fixed, 95% CI) | Subtotals only | |
| 23.1 24 weeks | 1 | 273 | Risk Ratio (M‐H, Fixed, 95% CI) | 1.05 [0.39, 2.82] |
| 24 Nausea Show forest plot | 1 | Risk Ratio (M‐H, Fixed, 95% CI) | Subtotals only | |
| 24.1 24 weeks | 1 | 273 | Risk Ratio (M‐H, Fixed, 95% CI) | 0.74 [0.32, 1.73] |
| 25 Upper respiratory tract infection Show forest plot | 2 | 772 | Risk Ratio (M‐H, Fixed, 95% CI) | 1.07 [0.49, 2.35] |
| 25.1 24 weeks | 1 | 273 | Risk Ratio (M‐H, Fixed, 95% CI) | 1.34 [0.56, 3.18] |
| 25.2 52 weeks | 1 | 499 | Risk Ratio (M‐H, Fixed, 95% CI) | 0.33 [0.04, 3.20] |
| 26 Vascular disorders Show forest plot | 3 | 1111 | Risk Ratio (M‐H, Fixed, 95% CI) | 1.25 [0.74, 2.09] |
| 26.1 24 weeks | 2 | 612 | Risk Ratio (M‐H, Fixed, 95% CI) | 1.52 [0.62, 3.74] |
| 26.2 52 weeks | 1 | 499 | Risk Ratio (M‐H, Fixed, 95% CI) | 1.12 [0.60, 2.11] |
| Outcome or subgroup title | No. of studies | No. of participants | Statistical method | Effect size |
| 1 Any Adverse Event Show forest plot | 1 | Risk Ratio (M‐H, Fixed, 95% CI) | Subtotals only | |
| 1.1 24 weeks | 1 | 81 | Risk Ratio (M‐H, Fixed, 95% CI) | 0.91 [0.72, 1.16] |
| 1.2 48‐56 weeks | 1 | 81 | Risk Ratio (M‐H, Fixed, 95% CI) | 1.00 [0.84, 1.20] |
| 2 Serious Adverse Events Show forest plot | 1 | Risk Ratio (M‐H, Fixed, 95% CI) | Subtotals only | |
| 2.1 24 weeks | 1 | 81 | Risk Ratio (M‐H, Fixed, 95% CI) | 1.95 [0.52, 7.27] |
| 2.2 48‐56 weeks | 1 | 81 | Risk Ratio (M‐H, Fixed, 95% CI) | 1.71 [0.54, 5.38] |
| 3 Serious Infections Show forest plot | 1 | Risk Ratio (M‐H, Fixed, 95% CI) | Subtotals only | |
| 3.1 24 weeks | 1 | 81 | Risk Ratio (M‐H, Fixed, 95% CI) | 1.95 [0.18, 20.68] |
| 3.2 48‐56 weeks | 1 | 81 | Risk Ratio (M‐H, Fixed, 95% CI) | 0.0 [0.0, 0.0] |
| 4 Death Show forest plot | 1 | Risk Difference (M‐H, Fixed, 95% CI) | Subtotals only | |
| 4.1 24 weeks | 1 | 81 | Risk Difference (M‐H, Fixed, 95% CI) | 0.0 [‐0.05, 0.05] |
| 5 Any Event Associated with 1st Infusion Show forest plot | 1 | Risk Ratio (M‐H, Fixed, 95% CI) | Subtotals only | |
| 5.1 24 weeks | 1 | 81 | Risk Ratio (M‐H, Fixed, 95% CI) | 1.06 [0.55, 2.03] |
| 6 Arthralgia Show forest plot | 1 | Risk Ratio (M‐H, Fixed, 95% CI) | Subtotals only | |
| 6.1 24 weeks | 1 | 81 | Risk Ratio (M‐H, Fixed, 95% CI) | 0.33 [0.04, 3.00] |
| 7 Back pain Show forest plot | 1 | Risk Ratio (M‐H, Fixed, 95% CI) | Subtotals only | |
| 7.1 24 weeks | 1 | 81 | Risk Ratio (M‐H, Fixed, 95% CI) | 1.46 [0.26, 8.30] |
| 8 Cough Show forest plot | 1 | Risk Ratio (M‐H, Fixed, 95% CI) | Subtotals only | |
| 8.1 24 weeks | 1 | 81 | Risk Ratio (M‐H, Fixed, 95% CI) | 2.93 [0.12, 69.83] |
| 9 Dyspnea Show forest plot | 1 | Risk Difference (M‐H, Fixed, 95% CI) | Subtotals only | |
| 9.1 24 weeks | 1 | 81 | Risk Difference (M‐H, Fixed, 95% CI) | 0.0 [‐0.05, 0.05] |
| 10 Exacerbation of RA Show forest plot | 1 | Risk Ratio (M‐H, Fixed, 95% CI) | Subtotals only | |
| 10.1 24 weeks | 1 | 81 | Risk Ratio (M‐H, Fixed, 95% CI) | 0.37 [0.16, 0.84] |
| 10.2 48‐56 weeks | 1 | 81 | Risk Ratio (M‐H, Fixed, 95% CI) | 0.0 [0.0, 0.0] |
| 11 Hypertension Show forest plot | 1 | Risk Ratio (M‐H, Fixed, 95% CI) | Subtotals only | |
| 11.1 24 weeks | 1 | 81 | Risk Ratio (M‐H, Fixed, 95% CI) | 0.49 [0.13, 1.82] |
| 12 Hypotension Show forest plot | 1 | Risk Ratio (M‐H, Fixed, 95% CI) | Subtotals only | |
| 12.1 24 weeks | 1 | 81 | Risk Ratio (M‐H, Fixed, 95% CI) | 1.67 [0.73, 3.81] |
| 13 Nasopharyngitis Show forest plot | 1 | Risk Ratio (M‐H, Fixed, 95% CI) | Subtotals only | |
| 13.1 24 weeks | 1 | 81 | Risk Ratio (M‐H, Fixed, 95% CI) | 0.33 [0.07, 1.52] |
| 14 Nausea Show forest plot | 1 | Risk Ratio (M‐H, Fixed, 95% CI) | Subtotals only | |
| 14.1 24 weeks | 1 | 81 | Risk Ratio (M‐H, Fixed, 95% CI) | 3.90 [0.46, 33.42] |
| 15 Pruritus Show forest plot | 1 | Risk Ratio (M‐H, Fixed, 95% CI) | Subtotals only | |
| 15.1 24 weeks | 1 | 81 | Risk Ratio (M‐H, Fixed, 95% CI) | 8.79 [0.49, 158.07] |
| 16 Rash Show forest plot | 1 | Risk Ratio (M‐H, Fixed, 95% CI) | Subtotals only | |
| 16.1 24 weeks | 1 | 81 | Risk Ratio (M‐H, Fixed, 95% CI) | 3.90 [0.46, 33.42] |
| 16.2 48 weeks | 1 | 80 | Risk Ratio (M‐H, Fixed, 95% CI) | 0.0 [0.0, 0.0] |
| Outcome or subgroup title | No. of studies | No. of participants | Statistical method | Effect size |
| 1 Any Adverse Event Show forest plot | 1 | Risk Ratio (M‐H, Fixed, 95% CI) | Subtotals only | |
| 1.1 24 weeks | 1 | 51 | Risk Ratio (M‐H, Fixed, 95% CI) | 1.13 [0.90, 1.41] |
| 2 Serious adverse events Show forest plot | 1 | Risk Ratio (M‐H, Fixed, 95% CI) | Subtotals only | |
| 2.1 24 weeks | 1 | 51 | Risk Ratio (M‐H, Fixed, 95% CI) | 2.79 [0.14, 55.23] |
| 3 Grade 3 adverse events Show forest plot | 1 | Risk Ratio (M‐H, Fixed, 95% CI) | Subtotals only | |
| 3.1 24 weeks | 1 | 51 | Risk Ratio (M‐H, Fixed, 95% CI) | 6.15 [0.36, 105.22] |
| 4 All infections Show forest plot | 1 | Risk Ratio (M‐H, Fixed, 95% CI) | Subtotals only | |
| 4.1 24 weeks | 1 | 51 | Risk Ratio (M‐H, Fixed, 95% CI) | 0.89 [0.55, 1.45] |
| 5 Grade 3 infections Show forest plot | 1 | Risk Ratio (M‐H, Fixed, 95% CI) | Subtotals only | |
| 5.1 24 weeks | 1 | 51 | Risk Ratio (M‐H, Fixed, 95% CI) | 3.91 [0.21, 71.77] |
| 6 Serious infections Show forest plot | 1 | Risk Ratio (M‐H, Fixed, 95% CI) | Subtotals only | |
| 6.1 24 weeks | 1 | 51 | Risk Ratio (M‐H, Fixed, 95% CI) | 1.68 [0.07, 39.16] |
| 7 Any Event Associated with 1st infusion Show forest plot | 1 | Risk Ratio (M‐H, Fixed, 95% CI) | Subtotals only | |
| 7.1 24 weeks | 1 | 51 | Risk Ratio (M‐H, Fixed, 95% CI) | 5.45 [0.76, 39.26] |
| 8 Any Event Associated with 2nd infusion Show forest plot | 1 | Risk Ratio (M‐H, Fixed, 95% CI) | Subtotals only | |
| 8.1 24 weeks | 1 | 51 | Risk Ratio (M‐H, Fixed, 95% CI) | 0.82 [0.15, 4.45] |
| 9 Arthralgia Show forest plot | 1 | Risk Ratio (M‐H, Fixed, 95% CI) | Subtotals only | |
| 9.1 24 weeks | 1 | 51 | Risk Ratio (M‐H, Fixed, 95% CI) | 0.82 [0.15, 4.45] |
| 10 Coronary artery occlusion Show forest plot | 1 | Risk Ratio (M‐H, Fixed, 95% CI) | Subtotals only | |
| 10.1 24 weeks | 1 | 51 | Risk Ratio (M‐H, Fixed, 95% CI) | 1.68 [0.07, 39.16] |
| 11 Diarrhea Show forest plot | 1 | Risk Ratio (M‐H, Fixed, 95% CI) | Subtotals only | |
| 11.1 24 weeks | 1 | 51 | Risk Ratio (M‐H, Fixed, 95% CI) | 1.64 [0.18, 14.61] |
| 12 Exacerbation of RA Show forest plot | 1 | Risk Ratio (M‐H, Fixed, 95% CI) | Subtotals only | |
| 12.1 24 weeks | 1 | 51 | Risk Ratio (M‐H, Fixed, 95% CI) | 0.73 [0.18, 2.90] |
| 13 Fatigue Show forest plot | 1 | Risk Ratio (M‐H, Fixed, 95% CI) | Subtotals only | |
| 13.1 24 weeks | 1 | 51 | Risk Ratio (M‐H, Fixed, 95% CI) | 5.03 [0.29, 88.46] |
| 14 HACA Show forest plot | 1 | Risk Ratio (M‐H, Fixed, 95% CI) | Subtotals only | |
| 14.1 24 weeks | 1 | 51 | Risk Ratio (M‐H, Fixed, 95% CI) | 1.68 [0.07, 39.16] |
| 15 Headache Show forest plot | 1 | Risk Ratio (M‐H, Fixed, 95% CI) | Subtotals only | |
| 15.1 24 weeks | 1 | 51 | Risk Ratio (M‐H, Fixed, 95% CI) | 0.82 [0.15, 4.45] |
| 16 Influenza Show forest plot | 1 | Risk Ratio (M‐H, Fixed, 95% CI) | Subtotals only | |
| 16.1 24 weeks | 1 | 51 | Risk Ratio (M‐H, Fixed, 95% CI) | 1.68 [0.07, 39.16] |
| 17 Muscle spasms Show forest plot | 1 | Risk Ratio (M‐H, Fixed, 95% CI) | Subtotals only | |
| 17.1 24 weeks | 1 | 51 | Risk Ratio (M‐H, Fixed, 95% CI) | 0.27 [0.03, 2.81] |
| 18 Nasopharyngitis Show forest plot | 1 | Risk Ratio (M‐H, Fixed, 95% CI) | Subtotals only | |
| 18.1 24 weeks | 1 | 51 | Risk Ratio (M‐H, Fixed, 95% CI) | 1.09 [0.11, 11.22] |
| 19 Nausea Show forest plot | 1 | Risk Ratio (M‐H, Fixed, 95% CI) | Subtotals only | |
| 19.1 24 weeks | 1 | 51 | Risk Ratio (M‐H, Fixed, 95% CI) | 1.36 [0.29, 6.34] |
| 20 Peripheral edema Show forest plot | 1 | Risk Ratio (M‐H, Fixed, 95% CI) | Subtotals only | |
| 20.1 24 weeks | 1 | 51 | Risk Ratio (M‐H, Fixed, 95% CI) | 0.82 [0.15, 4.45] |
| 21 Pneumonia Show forest plot | 1 | Risk Ratio (M‐H, Fixed, 95% CI) | Subtotals only | |
| 21.1 24 weeks | 1 | 51 | Risk Ratio (M‐H, Fixed, 95% CI) | 1.68 [0.07, 39.16] |
| 22 Postoperative infection Show forest plot | 1 | Risk Ratio (M‐H, Fixed, 95% CI) | Subtotals only | |
| 22.1 24 weeks | 1 | 51 | Risk Ratio (M‐H, Fixed, 95% CI) | 1.68 [0.07, 39.16] |
| 23 Pruritus Show forest plot | 1 | Risk Ratio (M‐H, Fixed, 95% CI) | Subtotals only | |
| 23.1 24 weeks | 1 | 51 | Risk Ratio (M‐H, Fixed, 95% CI) | 5.03 [0.29, 88.46] |
| 24 Sinusitits Show forest plot | 1 | Risk Ratio (M‐H, Fixed, 95% CI) | Subtotals only | |
| 24.1 24 weeks | 1 | 51 | Risk Ratio (M‐H, Fixed, 95% CI) | 0.55 [0.12, 2.43] |
| 25 Upper respiratory tract infections Show forest plot | 1 | Risk Ratio (M‐H, Fixed, 95% CI) | Subtotals only | |
| 25.1 24 weeks | 1 | 51 | Risk Ratio (M‐H, Fixed, 95% CI) | 0.65 [0.23, 1.85] |
| 26 Urinary tract infections Show forest plot | 1 | Risk Ratio (M‐H, Fixed, 95% CI) | Subtotals only | |
| 26.1 24 weeks | 1 | 51 | Risk Ratio (M‐H, Fixed, 95% CI) | 1.09 [0.11, 11.22] |
| 27 Vaginal Mycosis Show forest plot | 1 | Risk Ratio (M‐H, Fixed, 95% CI) | Subtotals only | |
| 27.1 24 weeks | 1 | 51 | Risk Ratio (M‐H, Fixed, 95% CI) | 1.09 [0.11, 11.22] |
| Outcome or subgroup title | No. of studies | No. of participants | Statistical method | Effect size |
| 1 ACR 50 Show forest plot | 5 | Risk Ratio (M‐H, Fixed, 95% CI) | Subtotals only | |
| 1.1 = or < 4 years | 1 | 499 | Risk Ratio (M‐H, Fixed, 95% CI) | 1.55 [1.30, 1.84] |
| 1.2 > 4 years | 4 | 1165 | Risk Ratio (M‐H, Fixed, 95% CI) | 3.41 [2.52, 4.63] |
| Outcome or subgroup title | No. of studies | No. of participants | Statistical method | Effect size |
| 1 ACR 50 Show forest plot | 5 | Risk Ratio (M‐H, Fixed, 95% CI) | Subtotals only | |
| 1.1 Methotrexate‐naive | 1 | 499 | Risk Ratio (M‐H, Fixed, 95% CI) | 1.55 [1.30, 1.84] |
| 1.2 DMARDs failure | 2 | 422 | Risk Ratio (M‐H, Fixed, 95% CI) | 2.93 [1.86, 4.63] |
| 1.3 DMARD and TNFi failure | 2 | 743 | Risk Ratio (M‐H, Fixed, 95% CI) | 3.77 [2.51, 5.66] |
| Outcome or subgroup title | No. of studies | No. of participants | Statistical method | Effect size |
| 1 ACR 50 Show forest plot | 5 | Risk Ratio (M‐H, Random, 95% CI) | Subtotals only | |
| 1.1 Low risk of bias | 2 | 579 | Risk Ratio (M‐H, Random, 95% CI) | 2.03 [0.96, 4.26] |
| 1.2 High risk of bias | 3 | 1085 | Risk Ratio (M‐H, Random, 95% CI) | 3.27 [2.10, 5.09] |
| Outcome or subgroup title | No. of studies | No. of participants | Statistical method | Effect size |
| 1 ACR 20 Show forest plot | 4 | Risk Ratio (M‐H, Random, 95% CI) | Subtotals only | |
| 1.1 24 weeks | 3 | 809 | Risk Ratio (M‐H, Random, 95% CI) | 1.05 [0.87, 1.26] |
| 1.2 48‐52 weeks | 4 | 1218 | Risk Ratio (M‐H, Random, 95% CI) | 1.04 [0.96, 1.11] |
| 1.3 104 weeks | 1 | 436 | Risk Ratio (M‐H, Random, 95% CI) | 0.92 [0.83, 1.02] |
| 2 ACR 50 Show forest plot | 4 | Risk Ratio (M‐H, Fixed, 95% CI) | Subtotals only | |
| 2.1 24 weeks | 2 | 582 | Risk Ratio (M‐H, Fixed, 95% CI) | 0.99 [0.77, 1.28] |
| 2.2 48‐56 weeks | 4 | 1218 | Risk Ratio (M‐H, Fixed, 95% CI) | 1.08 [0.97, 1.21] |
| 2.3 104 weeks | 1 | 499 | Risk Ratio (M‐H, Fixed, 95% CI) | 1.04 [0.91, 1.20] |
| 3 ACR 70 Show forest plot | 4 | Risk Ratio (M‐H, Fixed, 95% CI) | Subtotals only | |
| 3.1 24 weeks | 2 | 582 | Risk Ratio (M‐H, Fixed, 95% CI) | 1.32 [0.85, 2.04] |
| 3.2 48‐56 weeks | 4 | 1218 | Risk Ratio (M‐H, Fixed, 95% CI) | 1.08 [0.91, 1.28] |
| 3.3 104 weeks | 1 | 499 | Risk Ratio (M‐H, Fixed, 95% CI) | 1.10 [0.90, 1.34] |
| 4 ACR 90 Show forest plot | 1 | Risk Ratio (M‐H, Fixed, 95% CI) | Subtotals only | |
| 4.1 52 weeks | 1 | 500 | Risk Ratio (M‐H, Fixed, 95% CI) | 0.95 [0.65, 1.41] |
| 4.2 104 weeks | 1 | 500 | Risk Ratio (M‐H, Fixed, 95% CI) | 1.14 [0.82, 1.59] |
| 5 DAS 28‐ESR Show forest plot | 4 | Mean Difference (IV, Fixed, 95% CI) | Subtotals only | |
| 5.1 24 weeks | 3 | 1081 | Mean Difference (IV, Fixed, 95% CI) | ‐0.06 [‐0.22, 0.09] |
| 5.2 48‐56 weeks | 3 | 1063 | Mean Difference (IV, Fixed, 95% CI) | ‐0.14 [‐0.29, 0.02] |
| 5.3 104 weeks | 1 | 499 | Mean Difference (IV, Fixed, 95% CI) | 0.0 [‐0.23, 0.23] |
| 6 LDA (DAS28 =or<3.2) Show forest plot | 4 | Risk Ratio (M‐H, Fixed, 95% CI) | Subtotals only | |
| 6.1 24 weeks | 1 | 335 | Risk Ratio (M‐H, Fixed, 95% CI) | 0.71 [0.42, 1.20] |
| 6.2 48 weeks | 4 | 1215 | Risk Ratio (M‐H, Fixed, 95% CI) | 1.11 [0.94, 1.31] |
| 6.3 104 weeks | 1 | 499 | Risk Ratio (M‐H, Fixed, 95% CI) | 1.07 [0.88, 1.29] |
| 7 Clinical Remission (DAS28<2.6) Show forest plot | 4 | 2049 | Risk Ratio (M‐H, Random, 95% CI) | 1.10 [0.87, 1.39] |
| 7.1 24 weeks | 1 | 335 | Risk Ratio (M‐H, Random, 95% CI) | 0.98 [0.51, 1.90] |
| 7.2 48‐52 weeks | 4 | 1215 | Risk Ratio (M‐H, Random, 95% CI) | 1.23 [0.85, 1.78] |
| 7.3 104 weeks | 1 | 499 | Risk Ratio (M‐H, Random, 95% CI) | 0.94 [0.73, 1.20] |
| 8 Moderate or good EULAR response Show forest plot | 4 | Risk Ratio (M‐H, Random, 95% CI) | Subtotals only | |
| 8.1 24 weeks | 3 | 1082 | Risk Ratio (M‐H, Random, 95% CI) | 0.94 [0.85, 1.05] |
| 8.2 48‐52 weeks | 3 | 1063 | Risk Ratio (M‐H, Random, 95% CI) | 1.07 [0.90, 1.28] |
| 8.3 104 weeks | 1 | 499 | Risk Ratio (M‐H, Random, 95% CI) | 1.09 [0.90, 1.31] |
| 9 HAQ‐DI Show forest plot | 3 | 1969 | Mean Difference (IV, Random, 95% CI) | ‐0.03 [‐0.17, 0.11] |
| 9.1 24 weeks | 2 | 744 | Mean Difference (IV, Random, 95% CI) | 0.09 [‐0.13, 0.30] |
| 9.2 48‐52 weeks | 2 | 726 | Mean Difference (IV, Random, 95% CI) | ‐0.04 [‐0.13, 0.05] |
| 9.3 104 weeks | 1 | 499 | Mean Difference (IV, Random, 95% CI) | ‐0.20 [‐0.31, ‐0.09] |
| 10 HAQ‐DI MCID=‐0.22 Show forest plot | 4 | Risk Ratio (M‐H, Random, 95% CI) | Subtotals only | |
| 10.1 24 weeks | 2 | 580 | Risk Ratio (M‐H, Random, 95% CI) | 0.97 [0.80, 1.18] |
| 10.2 48‐56 weeks | 3 | 1061 | Risk Ratio (M‐H, Random, 95% CI) | 0.99 [0.94, 1.05] |
| 10.3 104 weeks | 1 | 499 | Risk Ratio (M‐H, Random, 95% CI) | 1.02 [0.95, 1.10] |
| 11 SF‐36 PCS Show forest plot | 4 | 1167 | Mean Difference (IV, Fixed, 95% CI) | 0.53 [‐0.49, 1.54] |
| 11.1 24 weeks | 2 | 545 | Mean Difference (IV, Fixed, 95% CI) | 0.02 [‐1.39, 1.44] |
| 11.2 48‐52 weeks | 2 | 622 | Mean Difference (IV, Fixed, 95% CI) | 1.05 [‐0.39, 2.49] |
| 12 SF‐36 PCS (=or>MCID of 5 or 5.42) Show forest plot | 4 | 1287 | Risk Ratio (M‐H, Fixed, 95% CI) | 1.06 [0.97, 1.16] |
| 12.1 24 weeks | 2 | 582 | Risk Ratio (M‐H, Fixed, 95% CI) | 1.00 [0.85, 1.19] |
| 12.2 48‐52 weeks | 2 | 705 | Risk Ratio (M‐H, Fixed, 95% CI) | 1.10 [0.99, 1.21] |
| 13 SF‐36 MCS Show forest plot | 4 | 1167 | Mean Difference (IV, Fixed, 95% CI) | ‐0.02 [‐1.42, 1.38] |
| 13.1 24 weeks | 2 | 545 | Mean Difference (IV, Fixed, 95% CI) | ‐0.07 [‐2.21, 2.06] |
| 13.2 48‐52 weeks | 2 | 622 | Mean Difference (IV, Fixed, 95% CI) | 0.02 [‐1.83, 1.88] |
| 14 SF‐36 MCS (=or>MCID of 6.33) Show forest plot | 2 | Risk Ratio (M‐H, Fixed, 95% CI) | Subtotals only | |
| 14.1 48‐52 weeks | 2 | 705 | Risk Ratio (M‐H, Fixed, 95% CI) | 1.06 [0.92, 1.23] |
| 15 FACIT‐F Show forest plot | 4 | 1218 | Mean Difference (IV, Fixed, 95% CI) | 1.04 [‐0.11, 2.18] |
| 15.1 24 weeks | 2 | 578 | Mean Difference (IV, Fixed, 95% CI) | 0.83 [‐0.87, 2.53] |
| 15.2 48‐54 weeks | 2 | 640 | Mean Difference (IV, Fixed, 95% CI) | 1.21 [‐0.34, 2.77] |
| 16 FACIT‐F (=or>MCID of 3.5) Show forest plot | 2 | 461 | Risk Ratio (M‐H, Fixed, 95% CI) | 1.19 [1.03, 1.38] |
| 16.1 24 weeks | 1 | 245 | Risk Ratio (M‐H, Fixed, 95% CI) | 1.19 [0.97, 1.46] |
| 16.2 48 weeks | 1 | 216 | Risk Ratio (M‐H, Fixed, 95% CI) | 1.20 [0.98, 1.47] |
| 17 VAS Pain Show forest plot | 2 | Mean Difference (IV, Fixed, 95% CI) | Subtotals only | |
| 17.1 52 weeks | 2 | 671 | Mean Difference (IV, Fixed, 95% CI) | ‐2.30 [‐6.62, 2.02] |
| 18 Total radiographic score Show forest plot | 1 | Mean Difference (IV, Fixed, 95% CI) | Subtotals only | |
| 18.1 24 weeks | 1 | 483 | Mean Difference (IV, Fixed, 95% CI) | 0.25 [‐0.09, 0.59] |
| 18.2 52 weeks | 1 | 483 | Mean Difference (IV, Fixed, 95% CI) | 0.29 [‐0.05, 0.63] |
| 18.3 104 weeks | 1 | 483 | Mean Difference (IV, Fixed, 95% CI) | 0.35 [0.01, 0.69] |
| 19 Joint space narrowing Show forest plot | 1 | Mean Difference (IV, Fixed, 95% CI) | Subtotals only | |
| 19.1 24 weeks | 1 | 480 | Mean Difference (IV, Fixed, 95% CI) | 0.07 [‐0.07, 0.21] |
| 19.2 104 weeks | 1 | 483 | Mean Difference (IV, Fixed, 95% CI) | 0.08 [‐0.06, 0.22] |
| 20 Radiographic erosions Show forest plot | 1 | Mean Difference (IV, Fixed, 95% CI) | Subtotals only | |
| 20.1 24 weeks | 1 | 480 | Mean Difference (IV, Fixed, 95% CI) | 0.18 [‐0.05, 0.41] |
| 20.2 52 weeks | 1 | 483 | Mean Difference (IV, Fixed, 95% CI) | 0.22 [‐0.01, 0.45] |
| 20.3 104 weeks | 1 | 483 | Mean Difference (IV, Fixed, 95% CI) | 0.27 [0.04, 0.50] |
| 21 No radiographic progression Show forest plot | 1 | Risk Ratio (M‐H, Fixed, 95% CI) | Subtotals only | |
| 21.1 24 weeks | 1 | 483 | Risk Ratio (M‐H, Fixed, 95% CI) | 1.10 [0.97, 1.25] |
| 21.2 52 weeks | 1 | 483 | Risk Ratio (M‐H, Fixed, 95% CI) | 1.10 [0.95, 1.27] |
| 21.3 104 weeks | 1 | 483 | Risk Ratio (M‐H, Fixed, 95% CI) | 1.16 [0.98, 1.38] |
| 22 No worsening of erosions Show forest plot | 1 | Risk Ratio (M‐H, Fixed, 95% CI) | Subtotals only | |
| 22.1 104 weeks | 1 | 483 | Risk Ratio (M‐H, Fixed, 95% CI) | 1.11 [0.95, 1.30] |
| 23 Total discontinuations Show forest plot | 4 | Risk Ratio (M‐H, Random, 95% CI) | Subtotals only | |
| 23.1 24 weeks | 2 | 656 | Risk Ratio (M‐H, Random, 95% CI) | 1.40 [0.79, 2.47] |
| 23.2 48‐52 weeks | 3 | 1093 | Risk Ratio (M‐H, Random, 95% CI) | 0.73 [0.34, 1.58] |
| 23.3 104 weeks | 1 | 499 | Risk Ratio (M‐H, Random, 95% CI) | 1.00 [0.65, 1.52] |
| 24 Discontinuation due to lack of efficacy Show forest plot | 4 | 1749 | Risk Ratio (M‐H, Fixed, 95% CI) | 0.73 [0.41, 1.29] |
| 24.1 24 weeks | 2 | 656 | Risk Ratio (M‐H, Fixed, 95% CI) | 1.16 [0.53, 2.53] |
| 24.2 48‐52 weeks | 3 | 1093 | Risk Ratio (M‐H, Fixed, 95% CI) | 0.42 [0.17, 1.03] |
| 25 Discontinuations due to adverse Events Show forest plot | 4 | Risk Ratio (M‐H, Random, 95% CI) | Subtotals only | |
| 25.1 24 weeks | 2 | 656 | Risk Ratio (M‐H, Random, 95% CI) | 1.35 [0.46, 4.00] |
| 25.2 48‐52 weeks | 3 | 1093 | Risk Ratio (M‐H, Random, 95% CI) | 0.94 [0.25, 3.45] |
| 25.3 104 weeks | 1 | 499 | Risk Ratio (M‐H, Random, 95% CI) | 0.80 [0.32, 1.99] |
| 26 Discontinuations due to other reasons Show forest plot | 4 | Risk Ratio (M‐H, Fixed, 95% CI) | Subtotals only | |
| 26.1 24 weeks | 2 | 656 | Risk Ratio (M‐H, Fixed, 95% CI) | 2.00 [0.55, 7.30] |
| 26.2 48‐52 weeks | 3 | 1693 | Risk Ratio (M‐H, Fixed, 95% CI) | 1.17 [0.68, 1.99] |
| 27 Any Adverse Event Show forest plot | 4 | Risk Ratio (M‐H, Fixed, 95% CI) | Subtotals only | |
| 27.1 24 weeks | 2 | 653 | Risk Ratio (M‐H, Fixed, 95% CI) | 1.03 [0.95, 1.11] |
| 27.2 48‐52 weeks | 3 | 1062 | Risk Ratio (M‐H, Fixed, 95% CI) | 1.01 [0.95, 1.06] |
| 27.3 104 weeks | 1 | 499 | Risk Ratio (M‐H, Fixed, 95% CI) | 1.05 [0.97, 1.13] |
| 28 Serious Adverse Events Show forest plot | 4 | Risk Ratio (M‐H, Random, 95% CI) | Subtotals only | |
| 28.1 24 weeks | 2 | 653 | Risk Ratio (M‐H, Random, 95% CI) | 1.48 [0.57, 3.82] |
| 28.2 48‐52 weeks | 3 | 1062 | Risk Ratio (M‐H, Random, 95% CI) | 1.24 [0.87, 1.77] |
| 28.3 104 weeks | 1 | 499 | Risk Ratio (M‐H, Random, 95% CI) | 0.89 [0.57, 1.37] |
| 29 Infections Show forest plot | 4 | Risk Ratio (M‐H, Random, 95% CI) | Subtotals only | |
| 29.1 24 weeks | 2 | 653 | Risk Ratio (M‐H, Random, 95% CI) | 0.93 [0.76, 1.13] |
| 29.2 48‐52 weeks | 3 | 1062 | Risk Ratio (M‐H, Random, 95% CI) | 1.00 [0.86, 1.17] |
| 29.3 104 weeks | 1 | 499 | Risk Ratio (M‐H, Random, 95% CI) | 0.98 [0.86, 1.12] |
| 30 Serious Infections Show forest plot | 4 | Risk Ratio (M‐H, Fixed, 95% CI) | Subtotals only | |
| 30.1 24 weeks | 2 | 653 | Risk Ratio (M‐H, Fixed, 95% CI) | 1.49 [0.38, 5.86] |
| 30.2 48‐56 weeks | 3 | 1062 | Risk Ratio (M‐H, Fixed, 95% CI) | 1.08 [0.50, 2.34] |
| 30.3 104 weeks | 1 | 499 | Risk Ratio (M‐H, Fixed, 95% CI) | 0.92 [0.43, 1.98] |
| 31 Death Show forest plot | 4 | Risk Ratio (M‐H, Fixed, 95% CI) | Subtotals only | |
| 31.1 24 weeks | 2 | 653 | Risk Ratio (M‐H, Fixed, 95% CI) | 0.22 [0.01, 5.26] |
| 31.2 48‐52 weeks | 3 | 1062 | Risk Ratio (M‐H, Fixed, 95% CI) | 0.20 [0.01, 4.06] |
| 31.3 104 weeks | 1 | 499 | Risk Ratio (M‐H, Fixed, 95% CI) | 0.50 [0.05, 5.46] |
| 32 Arthralgia Show forest plot | 1 | Risk Ratio (M‐H, Fixed, 95% CI) | Subtotals only | |
| 32.1 24 weeks | 1 | 316 | Risk Ratio (M‐H, Fixed, 95% CI) | 1.42 [0.51, 3.99] |
| 33 Cardiac event (any) Show forest plot | 2 | Risk Ratio (M‐H, Fixed, 95% CI) | Subtotals only | |
| 33.1 24 weeks | 1 | 337 | Risk Ratio (M‐H, Fixed, 95% CI) | 1.38 [0.45, 4.25] |
| 33.2 48‐52 weeks | 2 | 835 | Risk Ratio (M‐H, Fixed, 95% CI) | 1.44 [0.68, 3.06] |
| 34 Cardiac event (Serious) Show forest plot | 2 | Risk Ratio (M‐H, Fixed, 95% CI) | Subtotals only | |
| 34.1 24 weeks | 1 | 337 | Risk Ratio (M‐H, Fixed, 95% CI) | 0.49 [0.04, 5.37] |
| 34.2 48‐52 weeks | 2 | 835 | Risk Ratio (M‐H, Fixed, 95% CI) | 0.99 [0.25, 3.94] |
| 35 Diarrhea Show forest plot | 1 | Risk Ratio (M‐H, Fixed, 95% CI) | Subtotals only | |
| 35.1 24 weeks | 1 | 316 | Risk Ratio (M‐H, Fixed, 95% CI) | 0.55 [0.19, 1.61] |
| 36 Exacerbation of RA Show forest plot | 2 | 814 | Risk Ratio (M‐H, Fixed, 95% CI) | 0.91 [0.55, 1.51] |
| 36.1 24 weeks | 1 | 316 | Risk Ratio (M‐H, Fixed, 95% CI) | 0.83 [0.49, 1.40] |
| 36.2 52 weeks | 1 | 498 | Risk Ratio (M‐H, Fixed, 95% CI) | 5.0 [0.24, 103.62] |
| 37 Fatigue Show forest plot | 1 | Risk Ratio (M‐H, Fixed, 95% CI) | Subtotals only | |
| 37.1 24 weeks | 1 | 316 | Risk Ratio (M‐H, Fixed, 95% CI) | 1.03 [0.35, 3.09] |
| 38 HACA Show forest plot | 2 | Risk Ratio (M‐H, Fixed, 95% CI) | Subtotals only | |
| 38.1 24 weeks | 2 | 543 | Risk Ratio (M‐H, Fixed, 95% CI) | 0.53 [0.20, 1.38] |
| 39 Hypertension Show forest plot | 1 | Risk Ratio (M‐H, Fixed, 95% CI) | Subtotals only | |
| 39.1 24 weeks | 1 | 316 | Risk Ratio (M‐H, Fixed, 95% CI) | 1.55 [0.56, 4.29] |
| 40 Infusion‐related reactions (1st course ‐1st infusion) Show forest plot | 4 | Risk Ratio (M‐H, Fixed, 95% CI) | Subtotals only | |
| 40.1 24 weeks | 2 | 653 | Risk Ratio (M‐H, Fixed, 95% CI) | 1.35 [1.02, 1.78] |
| 40.2 48‐56 weeks | 3 | 1062 | Risk Ratio (M‐H, Fixed, 95% CI) | 1.02 [0.79, 1.33] |
| 40.3 104 weeks | 1 | 499 | Risk Ratio (M‐H, Fixed, 95% CI) | 1.31 [0.87, 1.96] |
| 41 Infusion‐related reaction (1st course ‐2nd infusion) Show forest plot | 2 | Risk Ratio (M‐H, Fixed, 95% CI) | Subtotals only | |
| 41.1 24 weeks | 2 | 582 | Risk Ratio (M‐H, Fixed, 95% CI) | 1.04 [0.59, 1.85] |
| 42 Infusion‐related reaction (2nd course) Show forest plot | 3 | Risk Ratio (M‐H, Fixed, 95% CI) | Subtotals only | |
| 42.1 48‐52 weeks | 3 | 1062 | Risk Ratio (M‐H, Fixed, 95% CI) | 1.16 [0.79, 1.70] |
| 42.2 104 weeks | 1 | 499 | Risk Ratio (M‐H, Fixed, 95% CI) | 1.05 [0.58, 1.88] |
| 43 Infusion‐related reaction (3rd course) Show forest plot | 1 | Risk Ratio (M‐H, Fixed, 95% CI) | Subtotals only | |
| 43.1 52 weeks | 1 | 498 | Risk Ratio (M‐H, Fixed, 95% CI) | 4.5 [0.98, 20.62] |
| 43.2 104 weeks | 1 | 499 | Risk Ratio (M‐H, Fixed, 95% CI) | 1.09 [0.49, 2.42] |
| 44 Infusion‐related reaction (4th course) Show forest plot | 1 | Risk Ratio (M‐H, Fixed, 95% CI) | Subtotals only | |
| 44.1 104 weeks | 1 | 499 | Risk Ratio (M‐H, Fixed, 95% CI) | 0.80 [0.32, 1.99] |
| 45 Infusion‐related reaction (5th course) Show forest plot | 1 | Risk Ratio (M‐H, Fixed, 95% CI) | Subtotals only | |
| 45.1 104 weeks | 1 | 499 | Risk Ratio (M‐H, Fixed, 95% CI) | 2.99 [0.31, 28.53] |
| 46 Lower gastrointestinal events Show forest plot | 1 | Risk Ratio (M‐H, Fixed, 95% CI) | Subtotals only | |
| 46.1 24 weeks | 1 | 337 | Risk Ratio (M‐H, Fixed, 95% CI) | 0.98 [0.51, 1.90] |
| 46.2 48 weeks | 1 | 337 | Risk Ratio (M‐H, Fixed, 95% CI) | 1.12 [0.65, 1.94] |
| 47 Malignancy Show forest plot | 3 | Risk Ratio (M‐H, Fixed, 95% CI) | Subtotals only | |
| 47.1 24 weeks | 1 | 337 | Risk Ratio (M‐H, Fixed, 95% CI) | 1.96 [0.18, 21.46] |
| 47.2 48‐52 weeks | 3 | 1062 | Risk Ratio (M‐H, Fixed, 95% CI) | 1.09 [0.27, 4.31] |
| 47.3 104 weeks | 1 | 499 | Risk Ratio (M‐H, Fixed, 95% CI) | 0.50 [0.13, 1.97] |
| 48 Pneumonia Show forest plot | 1 | Risk Ratio (M‐H, Fixed, 95% CI) | Subtotals only | |
| 48.1 52 weeks | 1 | 498 | Risk Ratio (M‐H, Fixed, 95% CI) | 0.33 [0.01, 8.14] |
| 49 Urinary tract infection Show forest plot | 1 | Risk Ratio (M‐H, Fixed, 95% CI) | Subtotals only | |
| 49.1 52 weeks | 1 | 499 | Risk Ratio (M‐H, Fixed, 95% CI) | 0.20 [0.01, 4.16] |
| 50 Vascular disorders Show forest plot | 2 | Risk Ratio (M‐H, Fixed, 95% CI) | Subtotals only | |
| 50.1 24 weeks | 1 | 337 | Risk Ratio (M‐H, Fixed, 95% CI) | 1.15 [0.39, 3.34] |
| 50.2 48‐52 weeks | 2 | 835 | Risk Ratio (M‐H, Fixed, 95% CI) | 0.96 [0.59, 1.57] |
| Outcome or subgroup title | No. of studies | No. of participants | Statistical method | Effect size |
| 1 ACR 20 Show forest plot | 1 | Risk Ratio (M‐H, Fixed, 95% CI) | Subtotals only | |
| 1.1 24 weeks | 1 | 81 | Risk Ratio (M‐H, Fixed, 95% CI) | 1.04 [0.81, 1.35] |
| 1.2 48 weeks | 1 | 81 | Risk Ratio (M‐H, Fixed, 95% CI) | 0.72 [0.49, 1.06] |
| 1.3 104 weeks | 1 | 81 | Risk Ratio (M‐H, Fixed, 95% CI) | 0.38 [0.15, 0.96] |
| 2 ACR 50 Show forest plot | 1 | Risk Ratio (M‐H, Fixed, 95% CI) | Subtotals only | |
| 2.1 24 weeks | 1 | 81 | Risk Ratio (M‐H, Fixed, 95% CI) | 0.98 [0.58, 1.63] |
| 2.2 48 weeks | 1 | 81 | Risk Ratio (M‐H, Fixed, 95% CI) | 0.77 [0.40, 1.48] |
| 2.3 104 weeks | 1 | 81 | Risk Ratio (M‐H, Fixed, 95% CI) | 0.49 [0.16, 1.49] |
| 3 ACR 70 Show forest plot | 1 | Risk Ratio (M‐H, Fixed, 95% CI) | Subtotals only | |
| 3.1 24 weeks | 1 | 81 | Risk Ratio (M‐H, Fixed, 95% CI) | 0.65 [0.25, 1.66] |
| 3.2 48 weeks | 1 | 81 | Risk Ratio (M‐H, Fixed, 95% CI) | 0.65 [0.20, 2.13] |
| 3.3 104 weeks | 1 | 81 | Risk Ratio (M‐H, Fixed, 95% CI) | 0.73 [0.17, 3.06] |
| 4 DAS 28 Show forest plot | 1 | Mean Difference (IV, Fixed, 95% CI) | Subtotals only | |
| 4.1 24 weeks | 1 | 81 | Mean Difference (IV, Fixed, 95% CI) | 0.0 [‐0.61, 0.61] |
| 5 Moderate or good EULAR response Show forest plot | 1 | Risk Ratio (M‐H, Fixed, 95% CI) | Subtotals only | |
| 5.1 24 weeks | 1 | 81 | Risk Ratio (M‐H, Fixed, 95% CI) | 1.03 [0.85, 1.25] |
| 6 HAQ‐DI Show forest plot | 1 | Mean Difference (IV, Fixed, 95% CI) | Subtotals only | |
| 6.1 24 weeks | 1 | 76 | Mean Difference (IV, Fixed, 95% CI) | 0.0 [‐0.29, 0.29] |
| 6.2 48 weeks | 1 | 72 | Mean Difference (IV, Fixed, 95% CI) | 0.3 [0.01, 0.59] |
| 6.3 72 weeks | 1 | 50 | Mean Difference (IV, Fixed, 95% CI) | 0.5 [0.15, 0.85] |
| 7 HAQ‐DI MCID=‐0.22 Show forest plot | 1 | Risk Ratio (M‐H, Fixed, 95% CI) | Subtotals only | |
| 7.1 24 weeks | 1 | 76 | Risk Ratio (M‐H, Fixed, 95% CI) | 0.93 [0.65, 1.32] |
| 7.2 48 weeks | 1 | 72 | Risk Ratio (M‐H, Fixed, 95% CI) | 0.56 [0.35, 0.90] |
| 7.3 72 weeks | 1 | 50 | Risk Ratio (M‐H, Fixed, 95% CI) | 0.49 [0.21, 1.17] |
| 7.4 104 weeks | 1 | 27 | Risk Ratio (M‐H, Fixed, 95% CI) | 0.4 [0.05, 2.93] |
| 8 Total discontinuations Show forest plot | 1 | Risk Ratio (M‐H, Fixed, 95% CI) | Subtotals only | |
| 8.1 24 weeks | 1 | 81 | Risk Ratio (M‐H, Fixed, 95% CI) | 3.90 [0.46, 33.42] |
| 8.2 48 weeks | 1 | 81 | Risk Ratio (M‐H, Fixed, 95% CI) | 3.41 [0.75, 15.46] |
| 8.3 72 weeks | 1 | 81 | Risk Ratio (M‐H, Fixed, 95% CI) | 1.54 [0.87, 2.75] |
| 8.4 104 weeks | 1 | 81 | Risk Ratio (M‐H, Fixed, 95% CI) | 1.42 [1.03, 1.96] |
| 9 Withdrawals due to lack of efficacy Show forest plot | 1 | Risk Ratio (M‐H, Fixed, 95% CI) | Subtotals only | |
| 9.1 24 weeks | 1 | 81 | Risk Ratio (M‐H, Fixed, 95% CI) | 0.0 [0.0, 0.0] |
| 9.2 48 weeks | 1 | 81 | Risk Ratio (M‐H, Fixed, 95% CI) | 1.95 [0.18, 20.68] |
| 9.3 72 weeks | 1 | 81 | Risk Ratio (M‐H, Fixed, 95% CI) | 0.98 [0.26, 3.64] |
| 9.4 104 weeks | 1 | 81 | Risk Ratio (M‐H, Fixed, 95% CI) | 0.98 [0.26, 3.64] |
| 10 Withdrawals due to adverse events Show forest plot | 1 | Risk Ratio (M‐H, Fixed, 95% CI) | Subtotals only | |
| 10.1 24 weeks | 1 | 81 | Risk Ratio (M‐H, Fixed, 95% CI) | 1.95 [0.18, 20.68] |
| 10.2 48 weeks | 1 | 81 | Risk Ratio (M‐H, Fixed, 95% CI) | 1.95 [0.18, 20.68] |
| 10.3 72 weeks | 1 | 81 | Risk Ratio (M‐H, Fixed, 95% CI) | 3.90 [0.46, 33.42] |
| 10.4 104 weeks | 1 | 81 | Risk Ratio (M‐H, Fixed, 95% CI) | 3.90 [0.46, 33.42] |
| 11 Withdrawals due to other reasons Show forest plot | 1 | Risk Ratio (M‐H, Fixed, 95% CI) | Subtotals only | |
| 11.1 24 weeks | 1 | 81 | Risk Ratio (M‐H, Fixed, 95% CI) | 4.88 [0.24, 98.60] |
| 11.2 48 weeks | 1 | 81 | Risk Ratio (M‐H, Fixed, 95% CI) | 6.83 [0.36, 128.20] |
| 11.3 72 weeks | 1 | 81 | Risk Ratio (M‐H, Fixed, 95% CI) | 1.53 [0.66, 3.56] |
| 11.4 104 weeks | 1 | 81 | Risk Ratio (M‐H, Fixed, 95% CI) | 1.43 [0.93, 2.22] |
| 12 Any Adverse Event Show forest plot | 1 | Risk Ratio (M‐H, Fixed, 95% CI) | Subtotals only | |
| 12.1 24 weeks | 1 | 81 | Risk Ratio (M‐H, Fixed, 95% CI) | 0.86 [0.69, 1.08] |
| 12.2 48‐56 weeks | 1 | 81 | Risk Ratio (M‐H, Fixed, 95% CI) | 0.98 [0.82, 1.16] |
| 13 Serious Adverse Events Show forest plot | 1 | Risk Ratio (M‐H, Fixed, 95% CI) | Subtotals only | |
| 13.1 24 weeks | 1 | 81 | Risk Ratio (M‐H, Fixed, 95% CI) | 1.95 [0.52, 7.27] |
| 13.2 48‐56 weeks | 1 | 81 | Risk Ratio (M‐H, Fixed, 95% CI) | 1.71 [0.54, 5.38] |
| 14 Serious Infections Show forest plot | 1 | Risk Ratio (M‐H, Fixed, 95% CI) | Subtotals only | |
| 14.1 24 weeks | 1 | 81 | Risk Ratio (M‐H, Fixed, 95% CI) | 4.88 [0.24, 98.60] |
| 14.2 48‐56 weeks | 1 | 81 | Risk Ratio (M‐H, Fixed, 95% CI) | 0.33 [0.01, 7.76] |
| 15 Exacerbation of RA Show forest plot | 1 | Risk Ratio (M‐H, Fixed, 95% CI) | Subtotals only | |
| 15.1 24 weeks | 1 | 81 | Risk Ratio (M‐H, Fixed, 95% CI) | 2.93 [0.63, 13.65] |
| 15.2 48‐56 weeks | 1 | 81 | Risk Ratio (M‐H, Fixed, 95% CI) | 0.0 [0.0, 0.0] |
| 16 Death Show forest plot | 1 | Risk Difference (M‐H, Fixed, 95% CI) | Subtotals only | |
| 16.1 24 weeks | 1 | 81 | Risk Difference (M‐H, Fixed, 95% CI) | 0.0 [‐0.05, 0.05] |
| 17 Any Event Associated with 1st Infusion Show forest plot | 1 | Risk Ratio (M‐H, Fixed, 95% CI) | Subtotals only | |
| 17.1 24 weeks | 1 | 81 | Risk Ratio (M‐H, Fixed, 95% CI) | 0.98 [0.52, 1.84] |
| 18 Arthralgia Show forest plot | 1 | Risk Ratio (M‐H, Fixed, 95% CI) | Subtotals only | |
| 18.1 24 weeks | 1 | 81 | Risk Ratio (M‐H, Fixed, 95% CI) | 0.24 [0.03, 2.09] |
| 19 Back pain Show forest plot | 1 | Risk Ratio (M‐H, Fixed, 95% CI) | Subtotals only | |
| 19.1 24 weeks | 1 | 81 | Risk Ratio (M‐H, Fixed, 95% CI) | 6.83 [0.36, 128.20] |
| 20 Cough Show forest plot | 1 | Risk Ratio (M‐H, Fixed, 95% CI) | Subtotals only | |
| 20.1 24 weeks | 1 | 81 | Risk Ratio (M‐H, Fixed, 95% CI) | 0.49 [0.05, 5.17] |
| 21 Dyspnea Show forest plot | 1 | Risk Difference (M‐H, Fixed, 95% CI) | Subtotals only | |
| 21.1 24 weeks | 1 | 81 | Risk Difference (M‐H, Fixed, 95% CI) | 0.0 [‐0.05, 0.05] |
| 22 Hypertension Show forest plot | 1 | Risk Ratio (M‐H, Fixed, 95% CI) | Subtotals only | |
| 22.1 24 weeks | 1 | 81 | Risk Ratio (M‐H, Fixed, 95% CI) | 0.29 [0.09, 0.99] |
| 23 Hypotension Show forest plot | 1 | Risk Ratio (M‐H, Fixed, 95% CI) | Subtotals only | |
| 23.1 24 weeks | 1 | 82 | Risk Ratio (M‐H, Fixed, 95% CI) | 1.71 [0.75, 3.91] |
| 24 Nasopharyngitis Show forest plot | 1 | Risk Ratio (M‐H, Fixed, 95% CI) | Subtotals only | |
| 24.1 24 weeks | 1 | 81 | Risk Ratio (M‐H, Fixed, 95% CI) | 0.49 [0.09, 2.52] |
| 25 Nausea Show forest plot | 1 | Risk Ratio (M‐H, Fixed, 95% CI) | Subtotals only | |
| 25.1 24 weeks | 1 | 81 | Risk Ratio (M‐H, Fixed, 95% CI) | 8.79 [0.49, 158.07] |
| 26 Pruritus Show forest plot | 1 | Risk Ratio (M‐H, Fixed, 95% CI) | Subtotals only | |
| 26.1 24 weeks | 1 | 81 | Risk Ratio (M‐H, Fixed, 95% CI) | 8.79 [0.49, 158.07] |
| 27 Rash Show forest plot | 1 | Risk Ratio (M‐H, Fixed, 95% CI) | Subtotals only | |
| 27.1 24 weeks | 1 | 81 | Risk Ratio (M‐H, Fixed, 95% CI) | 3.90 [0.46, 33.42] |
| 27.2 48 weeks | 1 | 81 | Risk Ratio (M‐H, Fixed, 95% CI) | 0.0 [0.0, 0.0] |
| Outcome or subgroup title | No. of studies | No. of participants | Statistical method | Effect size |
| 1 ACR 20 Show forest plot | 1 | Risk Ratio (M‐H, Fixed, 95% CI) | Subtotals only | |
| 1.1 24 weeks | 1 | 80 | Risk Ratio (M‐H, Fixed, 95% CI) | 1.12 [0.83, 1.50] |
| 1.2 48 weeks | 1 | 80 | Risk Ratio (M‐H, Fixed, 95% CI) | 2.0 [1.21, 3.30] |
| 1.3 104 weeks | 1 | 80 | Risk Ratio (M‐H, Fixed, 95% CI) | 4.33 [1.34, 14.05] |
| 2 ACR 50 Show forest plot | 1 | Risk Ratio (M‐H, Fixed, 95% CI) | Subtotals only | |
| 2.1 24 weeks | 1 | 80 | Risk Ratio (M‐H, Fixed, 95% CI) | 1.31 [0.74, 2.32] |
| 2.2 48 weeks | 1 | 80 | Risk Ratio (M‐H, Fixed, 95% CI) | 2.33 [1.00, 5.46] |
| 2.3 104 weeks | 1 | 80 | Risk Ratio (M‐H, Fixed, 95% CI) | 2.67 [0.76, 9.33] |
| 3 ACR 70 Show forest plot | 1 | Risk Ratio (M‐H, Fixed, 95% CI) | Subtotals only | |
| 3.1 24 weeks | 1 | 80 | Risk Ratio (M‐H, Fixed, 95% CI) | 1.5 [0.59, 3.82] |
| 3.2 48 weeks | 1 | 80 | Risk Ratio (M‐H, Fixed, 95% CI) | 2.0 [0.54, 7.45] |
| 3.3 104 weeks | 1 | 80 | Risk Ratio (M‐H, Fixed, 95% CI) | 4.0 [0.47, 34.24] |
| 4 DAS 28 Show forest plot | 2 | Mean Difference (IV, Fixed, 95% CI) | Subtotals only | |
| 4.1 16‐24 weeks | 2 | 120 | Mean Difference (IV, Fixed, 95% CI) | ‐1.06 [‐1.76, ‐0.36] |
| 5 Moderate or good EULAR response Show forest plot | 2 | Risk Ratio (M‐H, Fixed, 95% CI) | Subtotals only | |
| 5.1 16‐24 weeks | 2 | 120 | Risk Ratio (M‐H, Fixed, 95% CI) | 1.04 [0.88, 1.23] |
| 5.2 104 weeks | 1 | 80 | Risk Ratio (M‐H, Fixed, 95% CI) | 3.25 [1.16, 9.12] |
| 6 HAQ‐DI Show forest plot | 1 | Mean Difference (IV, Fixed, 95% CI) | Subtotals only | |
| 6.1 24 weeks | 1 | 80 | Mean Difference (IV, Fixed, 95% CI) | 0.20 [‐0.06, 0.46] |
| 6.2 48 weeks | 1 | 80 | Mean Difference (IV, Fixed, 95% CI) | ‐0.10 [‐0.36, 0.16] |
| 6.3 72 weeks | 1 | 80 | Mean Difference (IV, Fixed, 95% CI) | 0.0 [‐0.26, 0.26] |
| 7 HAQ‐DI MCID=‐0.22 Show forest plot | 1 | Risk Ratio (M‐H, Fixed, 95% CI) | Subtotals only | |
| 7.1 24 weeks | 1 | 77 | Risk Ratio (M‐H, Fixed, 95% CI) | 0.94 [0.68, 1.29] |
| 7.2 48 weeks | 1 | 69 | Risk Ratio (M‐H, Fixed, 95% CI) | 1.63 [1.02, 2.60] |
| 7.3 72 weeks | 1 | 45 | Risk Ratio (M‐H, Fixed, 95% CI) | 2.63 [0.87, 7.91] |
| 7.4 104 weeks | 1 | 22 | Risk Ratio (M‐H, Fixed, 95% CI) | 1.11 [0.17, 7.09] |
| 8 Total discontinuations Show forest plot | 1 | Risk Ratio (M‐H, Fixed, 95% CI) | Subtotals only | |
| 8.1 24 weeks | 1 | 80 | Risk Ratio (M‐H, Fixed, 95% CI) | 0.5 [0.05, 5.30] |
| 8.2 48 weeks | 1 | 80 | Risk Ratio (M‐H, Fixed, 95% CI) | 0.22 [0.05, 0.96] |
| 8.3 72 weeks | 1 | 80 | Risk Ratio (M‐H, Fixed, 95% CI) | 0.52 [0.30, 0.90] |
| 8.4 104 weeks | 1 | 80 | Risk Ratio (M‐H, Fixed, 95% CI) | 0.61 [0.45, 0.82] |
| 9 Withdrawals due to lack of efficacy Show forest plot | 1 | Risk Ratio (M‐H, Fixed, 95% CI) | Subtotals only | |
| 9.1 24 weeks | 1 | 80 | Risk Ratio (M‐H, Fixed, 95% CI) | 0.0 [0.0, 0.0] |
| 9.2 48 weeks | 1 | 80 | Risk Ratio (M‐H, Fixed, 95% CI) | 0.5 [0.05, 5.30] |
| 9.3 72 weeks | 1 | 80 | Risk Ratio (M‐H, Fixed, 95% CI) | 1.33 [0.32, 5.58] |
| 9.4 104 weeks | 1 | 80 | Risk Ratio (M‐H, Fixed, 95% CI) | 0.8 [0.23, 2.76] |
| 10 Withdrawals due to adverse Events Show forest plot | 1 | Risk Ratio (M‐H, Fixed, 95% CI) | Subtotals only | |
| 10.1 24 weeks | 1 | 80 | Risk Ratio (M‐H, Fixed, 95% CI) | 0.5 [0.05, 5.30] |
| 10.2 48 weeks | 1 | 80 | Risk Ratio (M‐H, Fixed, 95% CI) | 0.25 [0.03, 2.14] |
| 10.3 72 weeks | 1 | 80 | Risk Ratio (M‐H, Fixed, 95% CI) | 0.2 [0.02, 1.64] |
| 10.4 104 weeks | 1 | 80 | Risk Ratio (M‐H, Fixed, 95% CI) | 0.2 [0.02, 1.64] |
| 11 Withdrawals due to other reasons Show forest plot | 1 | Risk Ratio (M‐H, Fixed, 95% CI) | Subtotals only | |
| 11.1 24 weeks | 1 | 80 | Risk Ratio (M‐H, Fixed, 95% CI) | 0.0 [0.0, 0.0] |
| 11.2 48 weeks | 1 | 80 | Risk Ratio (M‐H, Fixed, 95% CI) | 0.14 [0.01, 2.68] |
| 11.3 72 weeks | 1 | 80 | Risk Ratio (M‐H, Fixed, 95% CI) | 0.47 [0.21, 1.02] |
| 11.4 104 weeks | 1 | 80 | Risk Ratio (M‐H, Fixed, 95% CI) | 0.65 [0.43, 1.00] |
| 12 Any Adverse Event Show forest plot | 1 | Risk Ratio (M‐H, Fixed, 95% CI) | Subtotals only | |
| 12.1 24 weeks | 1 | 80 | Risk Ratio (M‐H, Fixed, 95% CI) | 1.06 [0.87, 1.30] |
| 12.2 48‐56 weeks | 1 | 80 | Risk Ratio (M‐H, Fixed, 95% CI) | 0.97 [0.83, 1.14] |
| 13 Serious Adverse Events Show forest plot | 1 | Risk Ratio (M‐H, Fixed, 95% CI) | Subtotals only | |
| 13.1 24 weeks | 1 | 80 | Risk Ratio (M‐H, Fixed, 95% CI) | 1.5 [0.26, 8.50] |
| 13.2 48‐56 weeks | 1 | 80 | Risk Ratio (M‐H, Fixed, 95% CI) | 1.0 [0.27, 3.72] |
| 14 Serious Infections Show forest plot | 2 | Risk Ratio (M‐H, Fixed, 95% CI) | Subtotals only | |
| 14.1 16‐24 weeks | 2 | 120 | Risk Ratio (M‐H, Fixed, 95% CI) | 0.33 [0.05, 2.03] |
| 14.2 48‐56 weeks | 1 | 80 | Risk Ratio (M‐H, Fixed, 95% CI) | 1.0 [0.06, 15.44] |
| 15 Death Show forest plot | 1 | Risk Ratio (M‐H, Fixed, 95% CI) | Subtotals only | |
| 15.1 24 weeks | 1 | 80 | Risk Ratio (M‐H, Fixed, 95% CI) | 0.33 [0.01, 7.95] |
| 16 Any Event Associated with 1st Infusion Show forest plot | 2 | Risk Ratio (M‐H, Fixed, 95% CI) | Subtotals only | |
| 16.1 16‐24 weeks | 2 | 120 | Risk Ratio (M‐H, Fixed, 95% CI) | 0.8 [0.47, 1.36] |
| 17 Arthralgia Show forest plot | 1 | Risk Ratio (M‐H, Fixed, 95% CI) | Subtotals only | |
| 17.1 24 weeks | 1 | 80 | Risk Ratio (M‐H, Fixed, 95% CI) | 1.33 [0.32, 5.58] |
| 18 Back pain Show forest plot | 1 | Risk Ratio (M‐H, Fixed, 95% CI) | Subtotals only | |
| 18.1 24 weeks | 1 | 80 | Risk Ratio (M‐H, Fixed, 95% CI) | 0.11 [0.01, 2.00] |
| 19 Cough Show forest plot | 1 | Risk Ratio (M‐H, Fixed, 95% CI) | Subtotals only | |
| 19.1 24 weeks | 1 | 80 | Risk Ratio (M‐H, Fixed, 95% CI) | 0.4 [0.08, 1.94] |
| 20 Dyspnea Show forest plot | 1 | Risk Ratio (M‐H, Fixed, 95% CI) | Subtotals only | |
| 20.1 24 weeks | 1 | 80 | Risk Ratio (M‐H, Fixed, 95% CI) | 0.11 [0.01, 2.00] |
| 21 Exacerbation of RA Show forest plot | 1 | Risk Ratio (M‐H, Fixed, 95% CI) | Subtotals only | |
| 21.1 24 weeks | 1 | 80 | Risk Ratio (M‐H, Fixed, 95% CI) | 0.33 [0.07, 1.55] |
| 21.2 48‐56 weeks | 1 | 80 | Risk Ratio (M‐H, Fixed, 95% CI) | 0.33 [0.01, 7.95] |
| 22 Hypertension Show forest plot | 1 | Risk Ratio (M‐H, Fixed, 95% CI) | Subtotals only | |
| 22.1 24 weeks | 1 | 80 | Risk Ratio (M‐H, Fixed, 95% CI) | 1.67 [0.67, 4.15] |
| 23 Hypotension Show forest plot | 1 | Risk Ratio (M‐H, Fixed, 95% CI) | Subtotals only | |
| 23.1 24 weeks | 1 | 80 | Risk Ratio (M‐H, Fixed, 95% CI) | 0.58 [0.26, 1.33] |
| 24 Nasopharyngitis Show forest plot | 1 | Risk Ratio (M‐H, Fixed, 95% CI) | Subtotals only | |
| 24.1 24 weeks | 1 | 80 | Risk Ratio (M‐H, Fixed, 95% CI) | 1.0 [0.27, 3.72] |
| 25 Nausea Show forest plot | 1 | Risk Ratio (M‐H, Fixed, 95% CI) | Subtotals only | |
| 25.1 24 weeks | 1 | 80 | Risk Ratio (M‐H, Fixed, 95% CI) | 0.2 [0.01, 4.04] |
| 26 Pruritus Show forest plot | 1 | Risk Ratio (M‐H, Fixed, 95% CI) | Subtotals only | |
| 26.1 24 weeks | 1 | 80 | Risk Ratio (M‐H, Fixed, 95% CI) | 0.11 [0.01, 2.00] |
| 27 Rash Show forest plot | 1 | Risk Ratio (M‐H, Fixed, 95% CI) | Subtotals only | |
| 27.1 24 weeks | 1 | 80 | Risk Ratio (M‐H, Fixed, 95% CI) | 0.25 [0.03, 2.14] |
| 27.2 48 weeks | 1 | 80 | Risk Ratio (M‐H, Fixed, 95% CI) | 0.33 [0.01, 7.95] |
| Outcome or subgroup title | No. of studies | No. of participants | Statistical method | Effect size |
| 1 ACR 20 Show forest plot | 1 | Risk Ratio (M‐H, Fixed, 95% CI) | Subtotals only | |
| 1.1 24 weeks | 1 | 81 | Risk Ratio (M‐H, Fixed, 95% CI) | 1.16 [0.87, 1.55] |
| 1.2 48 weeks | 1 | 81 | Risk Ratio (M‐H, Fixed, 95% CI) | 1.50 [0.87, 2.59] |
| 1.3 104 weeks | 1 | 81 | Risk Ratio (M‐H, Fixed, 95% CI) | 1.63 [0.42, 6.36] |
| 2 ACR 50 Show forest plot | 1 | Risk Ratio (M‐H, Fixed, 95% CI) | Subtotals only | |
| 2.1 24 weeks | 1 | 81 | Risk Ratio (M‐H, Fixed, 95% CI) | 1.28 [0.72, 2.27] |
| 2.2 48 weeks | 1 | 81 | Risk Ratio (M‐H, Fixed, 95% CI) | 1.79 [0.73, 4.37] |
| 2.3 104 weeks | 1 | 81 | Risk Ratio (M‐H, Fixed, 95% CI) | 1.30 [0.31, 5.45] |
| 3 ACR 70 Show forest plot | 1 | Risk Ratio (M‐H, Fixed, 95% CI) | Subtotals only | |
| 3.1 24 weeks | 1 | 81 | Risk Ratio (M‐H, Fixed, 95% CI) | 0.98 [0.34, 2.77] |
| 3.2 48 weeks | 1 | 81 | Risk Ratio (M‐H, Fixed, 95% CI) | 1.30 [0.31, 5.45] |
| 3.3 104 weeks | 1 | 81 | Risk Ratio (M‐H, Fixed, 95% CI) | 2.93 [0.32, 26.97] |
| 4 DAS 28 Show forest plot | 1 | Mean Difference (IV, Fixed, 95% CI) | Subtotals only | |
| 4.1 24 weeks | 1 | 81 | Mean Difference (IV, Fixed, 95% CI) | ‐0.40 [‐1.03, 0.23] |
| 5 Moderate or good EULAR response Show forest plot | 1 | Risk Ratio (M‐H, Fixed, 95% CI) | Subtotals only | |
| 5.1 24 weeks | 1 | 81 | Risk Ratio (M‐H, Fixed, 95% CI) | 1.00 [0.84, 1.20] |
| 6 HAQ‐DI Show forest plot | 1 | Mean Difference (IV, Fixed, 95% CI) | Subtotals only | |
| 6.1 24 weeks | 1 | 75 | Mean Difference (IV, Fixed, 95% CI) | 0.20 [‐0.08, 0.48] |
| 6.2 48 weeks | 1 | 65 | Mean Difference (IV, Fixed, 95% CI) | 0.2 [‐0.10, 0.50] |
| 6.3 72 weeks | 1 | 39 | Mean Difference (IV, Fixed, 95% CI) | 0.5 [0.12, 0.88] |
| 7 HAQ‐DI MCID=‐0.22 Show forest plot | 1 | Risk Ratio (M‐H, Fixed, 95% CI) | Subtotals only | |
| 7.1 24 weeks | 1 | 75 | Risk Ratio (M‐H, Fixed, 95% CI) | 0.87 [0.62, 1.22] |
| 7.2 48 weeks | 1 | 65 | Risk Ratio (M‐H, Fixed, 95% CI) | 0.91 [0.50, 1.65] |
| 7.3 72 weeks | 1 | 39 | Risk Ratio (M‐H, Fixed, 95% CI) | 1.29 [0.36, 4.65] |
| 7.4 104 weeks | 1 | 13 | Risk Ratio (M‐H, Fixed, 95% CI) | 0.44 [0.04, 5.46] |
| 8 Total discontinuations Show forest plot | 1 | Risk Ratio (M‐H, Fixed, 95% CI) | Subtotals only | |
| 8.1 24 weeks | 1 | 81 | Risk Ratio (M‐H, Fixed, 95% CI) | 1.95 [0.38, 10.06] |
| 8.2 48 weeks | 1 | 81 | Risk Ratio (M‐H, Fixed, 95% CI) | 0.76 [0.31, 1.84] |
| 8.3 72 weeks | 1 | 81 | Risk Ratio (M‐H, Fixed, 95% CI) | 0.81 [0.53, 1.23] |
| 8.4 104 weeks | 1 | 81 | Risk Ratio (M‐H, Fixed, 95% CI) | 0.87 [0.72, 1.05] |
| 9 Withdrawals due to lack of efficacy Show forest plot | 1 | Risk Ratio (M‐H, Fixed, 95% CI) | Subtotals only | |
| 9.1 24 weeks | 1 | 81 | Risk Ratio (M‐H, Fixed, 95% CI) | 0.0 [0.0, 0.0] |
| 9.2 48 weeks | 1 | 81 | Risk Ratio (M‐H, Fixed, 95% CI) | 0.98 [0.14, 6.59] |
| 9.3 72 weeks | 1 | 81 | Risk Ratio (M‐H, Fixed, 95% CI) | 1.30 [0.31, 5.45] |
| 9.4 104 weeks | 1 | 81 | Risk Ratio (M‐H, Fixed, 95% CI) | 0.78 [0.23, 2.70] |
| 10 Withdrawals due to adverse Events Show forest plot | 1 | Risk Ratio (M‐H, Fixed, 95% CI) | Subtotals only | |
| 10.1 24 weeks | 1 | 81 | Risk Ratio (M‐H, Fixed, 95% CI) | 0.98 [0.14, 6.59] |
| 10.2 48 weeks | 1 | 81 | Risk Ratio (M‐H, Fixed, 95% CI) | 0.49 [0.09, 2.52] |
| 10.3 72 weeks | 1 | 81 | Risk Ratio (M‐H, Fixed, 95% CI) | 0.78 [0.23, 2.70] |
| 10.4 104 weeks | 1 | 81 | Risk Ratio (M‐H, Fixed, 95% CI) | 0.78 [0.23, 2.70] |
| 11 Withdrawals due to other reasons Show forest plot | 1 | Risk Ratio (M‐H, Fixed, 95% CI) | Subtotals only | |
| 11.1 24 weeks | 1 | 81 | Risk Ratio (M‐H, Fixed, 95% CI) | 4.88 [0.24, 98.60] |
| 11.2 48 weeks | 1 | 81 | Risk Ratio (M‐H, Fixed, 95% CI) | 0.98 [0.21, 4.55] |
| 11.3 72 weeks | 1 | 81 | Risk Ratio (M‐H, Fixed, 95% CI) | 0.72 [0.38, 1.36] |
| 11.4 104 weeks | 1 | 81 | Risk Ratio (M‐H, Fixed, 95% CI) | 0.94 [0.67, 1.31] |
| 12 Any Adverse Event Show forest plot | 1 | Risk Ratio (M‐H, Fixed, 95% CI) | Subtotals only | |
| 12.1 24 weeks | 1 | 81 | Risk Ratio (M‐H, Fixed, 95% CI) | 0.91 [0.72, 1.16] |
| 12.2 48‐56 weeks | 1 | 81 | Risk Ratio (M‐H, Fixed, 95% CI) | 0.95 [0.81, 1.12] |
| 13 Serious Adverse Events Show forest plot | 1 | Risk Ratio (M‐H, Fixed, 95% CI) | Subtotals only | |
| 13.1 24 weeks | 1 | 81 | Risk Ratio (M‐H, Fixed, 95% CI) | 2.93 [0.63, 13.65] |
| 13.2 48‐56 weeks | 1 | 81 | Risk Ratio (M‐H, Fixed, 95% CI) | 1.71 [0.54, 5.38] |
| 14 Serious Infections Show forest plot | 1 | Risk Ratio (M‐H, Fixed, 95% CI) | Subtotals only | |
| 14.1 24 weeks | 1 | 81 | Risk Ratio (M‐H, Fixed, 95% CI) | 0.98 [0.14, 6.59] |
| 14.2 48‐56 weeks | 1 | 81 | Risk Ratio (M‐H, Fixed, 95% CI) | 0.33 [0.01, 7.76] |
| 15 Death Show forest plot | 1 | Risk Ratio (M‐H, Fixed, 95% CI) | Subtotals only | |
| 15.1 24 weeks | 1 | 81 | Risk Ratio (M‐H, Fixed, 95% CI) | 0.33 [0.01, 7.76] |
| 16 Any Event Associated with 1st Infusion Show forest plot | 1 | Risk Ratio (M‐H, Fixed, 95% CI) | Subtotals only | |
| 16.1 24 weeks | 1 | 81 | Risk Ratio (M‐H, Fixed, 95% CI) | 0.70 [0.40, 1.24] |
| 17 Arthralgia Show forest plot | 1 | Risk Ratio (M‐H, Fixed, 95% CI) | Subtotals only | |
| 17.1 24 weeks | 1 | 81 | Risk Ratio (M‐H, Fixed, 95% CI) | 0.33 [0.04, 3.00] |
| 18 Back pain Show forest plot | 1 | Risk Ratio (M‐H, Fixed, 95% CI) | Subtotals only | |
| 18.1 24 weeks | 1 | 81 | Risk Ratio (M‐H, Fixed, 95% CI) | 0.73 [0.17, 3.06] |
| 19 Cough Show forest plot | 1 | Risk Ratio (M‐H, Fixed, 95% CI) | Subtotals only | |
| 19.1 24 weeks | 1 | 81 | Risk Ratio (M‐H, Fixed, 95% CI) | 0.20 [0.02, 1.60] |
| 20 Dyspnea Show forest plot | 1 | Risk Ratio (M‐H, Fixed, 95% CI) | Subtotals only | |
| 20.1 24 weeks | 1 | 81 | Risk Ratio (M‐H, Fixed, 95% CI) | 0.11 [0.01, 1.95] |
| 21 Exacerbation of RA Show forest plot | 1 | Risk Ratio (M‐H, Fixed, 95% CI) | Subtotals only | |
| 21.1 24 weeks | 1 | 81 | Risk Ratio (M‐H, Fixed, 95% CI) | 0.98 [0.34, 2.77] |
| 21.2 48‐56 weeks | 1 | 81 | Risk Ratio (M‐H, Fixed, 95% CI) | 0.33 [0.01, 7.76] |
| 22 Hypertension Show forest plot | 1 | Risk Ratio (M‐H, Fixed, 95% CI) | Subtotals only | |
| 22.1 24 weeks | 1 | 81 | Risk Ratio (M‐H, Fixed, 95% CI) | 0.49 [0.13, 1.82] |
| 23 Hypotension Show forest plot | 1 | Risk Ratio (M‐H, Fixed, 95% CI) | Subtotals only | |
| 23.1 24 weeks | 1 | 81 | Risk Ratio (M‐H, Fixed, 95% CI) | 0.98 [0.50, 1.91] |
| 24 Nasopharyngitis Show forest plot | 1 | Risk Ratio (M‐H, Fixed, 95% CI) | Subtotals only | |
| 24.1 24 weeks | 1 | 81 | Risk Ratio (M‐H, Fixed, 95% CI) | 0.49 [0.09, 2.52] |
| 25 Nausea Show forest plot | 1 | Risk Ratio (M‐H, Fixed, 95% CI) | Subtotals only | |
| 25.1 24 weeks | 1 | 80 | Risk Ratio (M‐H, Fixed, 95% CI) | 2.0 [0.39, 10.31] |
| 26 Rash Show forest plot | 1 | Risk Ratio (M‐H, Fixed, 95% CI) | Subtotals only | |
| 26.1 24 weeks | 1 | 81 | Risk Ratio (M‐H, Fixed, 95% CI) | 0.98 [0.26, 3.64] |
| 26.2 48 weeks | 1 | 81 | Risk Ratio (M‐H, Fixed, 95% CI) | 0.33 [0.01, 7.76] |