Administración de suplementos con vitamina D para la fibrosis quística
Información
- DOI:
- https://doi.org/10.1002/14651858.CD007298.pub4Copiar DOI

- Base de datos:
-
- Cochrane Database of Systematic Reviews
- Versión publicada:
-
- 14 mayo 2014see what's new
- Tipo:
-
- Intervention
- Etapa:
-
- Review
- Grupo Editorial Cochrane:
-
Grupo Cochrane de Fibrosis quística y enfermedades genéticas
- Copyright:
-
- Copyright © 2014 The Cochrane Collaboration. Published by John Wiley & Sons, Ltd.
Cifras del artículo
Altmetric:
Citado por:
Autores
Contributions of authors
Both JF and AC extracted the data and wrote the protocol and review.
JF acts as guarantor of the review.
Sources of support
Internal sources
-
No sources of support supplied
External sources
-
National Health and Medical Research Council, Australia.
AC is supported by a NHMRC Practitioner Fellowship
Declarations of interest
JF has attended paediatric diabetes and endocrinology conferences and workshops sponsored by Novo Nordisk and Medica Pacifica, for continuing medical education purposes. Neither herself nor Canterbury District Health Board have received payment for her attendance of these conferences.
AC declares receipt of a grant provided by GSK is unrelated to this topic.
Acknowledgements
We thank Natalie Yates for performing the literature searches and obtaining the articles and Nikki Jahnke for review of the manuscript and advice on analysis. We also thank Kerry Dwan for help with the statistics and the Cochrane CFGD Group for their support during the development of the protocol and review. We also thank Professor Howarth for responding to our correspondence.
Version history
| Published | Title | Stage | Authors | Version |
| 2014 May 14 | Vitamin D supplementation for cystic fibrosis | Review | Janet H Ferguson, Anne B Chang | |
| 2012 Apr 18 | Vitamin D supplementation for cystic fibrosis | Review | Janet H Ferguson, Anne B Chang | |
| 2009 Oct 07 | Vitamin D supplementation for cystic fibrosis | Review | Janet H Ferguson, Anne B Chang | |
| 2009 Jul 08 | Vitamin D supplementation for cystic fibrosis | Protocol | Janet H Ferguson, Anne B Chang | |
Differences between protocol and review
We include a post‐hoc analysis of BMD outcomes (z scores: deviation from population mean matched for age and gender) which is different from the planned primary BMD outcome measures of the protocol. Values for BMD can be expressed as T‐scores or z scores, with different advantages and disadvantages, but equal validity in studies. As we could not use both as the primary outcome in the protocol, we elected to choose T‐score in the protocol. However the studies included provided only z scores and hence this was included as a post‐hoc analysis; we did request additional data but none were available. This is also now consistent with the primary outcomes in the Cochrane review on 'Bisphosphonates for adults and children with cystic fibrosis' (Brenckmann 2001).
Keywords
MeSH
Medical Subject Headings (MeSH) Keywords
- *Dietary Supplements;
- Bone Density Conservation Agents [*administration & dosage, adverse effects];
- Bone Diseases, Metabolic [*drug therapy, etiology];
- Calcifediol [blood];
- Calcitriol [administration & dosage, adverse effects];
- Calcium, Dietary [administration & dosage];
- Cystic Fibrosis [*complications, metabolism];
- Exocrine Pancreatic Insufficiency [complications];
- Randomized Controlled Trials as Topic;
- Vitamin D [*administration & dosage, adverse effects];
- Vitamin D Deficiency [complications, drug therapy];
Medical Subject Headings Check Words
Adult; Child; Humans;
PICO

Risk of bias summary: review authors' judgements about each risk of bias item for each included study.
![Forest plot of comparison: 1 Vitamin D versus placebo, outcome: 1.2 Serum calcium (absolute final) [mmol/L].](/es/cdsr/doi/10.1002/14651858.CD007298.pub4/media/CDSR/CD007298/image_n/nCD007298-AFig-FIG02.png)
Forest plot of comparison: 1 Vitamin D versus placebo, outcome: 1.2 Serum calcium (absolute final) [mmol/L].
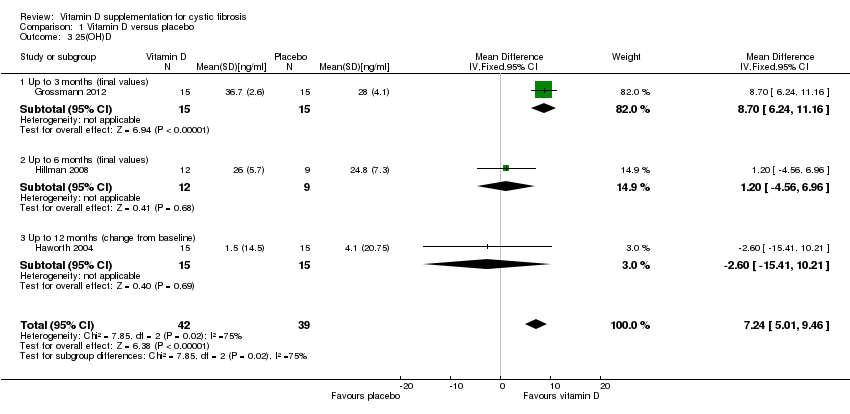
![Forest plot of comparison: 1 Vitamin D versus placebo, outcome: 1.3 25(OH)D [ng/ml].](/es/cdsr/doi/10.1002/14651858.CD007298.pub4/media/CDSR/CD007298/image_n/nCD007298-AFig-FIG03.png)
Forest plot of comparison: 1 Vitamin D versus placebo, outcome: 1.3 25(OH)D [ng/ml].
![Forest plot of comparison: 1 Vitamin D versus placebo, outcome: 1.5 PTH levels (absolute final) [pmol/L].](/es/cdsr/doi/10.1002/14651858.CD007298.pub4/media/CDSR/CD007298/image_n/nCD007298-AFig-FIG04.png)
Forest plot of comparison: 1 Vitamin D versus placebo, outcome: 1.5 PTH levels (absolute final) [pmol/L].

Comparison 1 Vitamin D versus placebo, Outcome 1 Serum calcium change (mmol/L).

Comparison 1 Vitamin D versus placebo, Outcome 2 Serum calcium (absolute final).
Comparison 1 Vitamin D versus placebo, Outcome 3 25(OH)D.
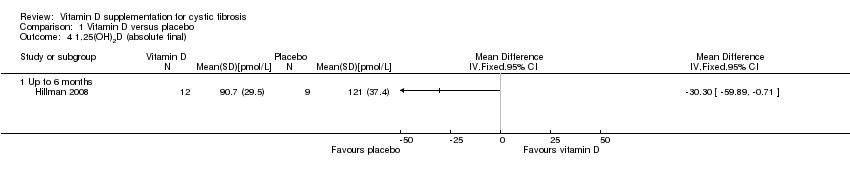
Comparison 1 Vitamin D versus placebo, Outcome 4 1,25(OH)2D (absolute final).

Comparison 1 Vitamin D versus placebo, Outcome 5 PTH levels (absolute final).

Comparison 1 Vitamin D versus placebo, Outcome 6 PTH levels (change from baseline).

Comparison 2 Post‐hoc analysis: Vitamin D versus placebo, Outcome 1 Whole body bone mineral content change (g).

Comparison 2 Post‐hoc analysis: Vitamin D versus placebo, Outcome 2 Lumbar spine z score.

Comparison 2 Post‐hoc analysis: Vitamin D versus placebo, Outcome 3 Lumbar spine bone mineral density (% change).

Comparison 2 Post‐hoc analysis: Vitamin D versus placebo, Outcome 4 Hip bone mineral density (% change).

Comparison 2 Post‐hoc analysis: Vitamin D versus placebo, Outcome 5 Distal forearm bone mineral density (% change).
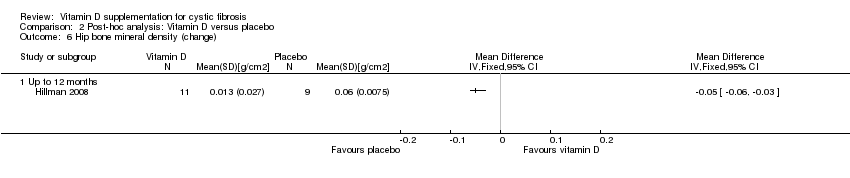
Comparison 2 Post‐hoc analysis: Vitamin D versus placebo, Outcome 6 Hip bone mineral density (change).
| Outcome or subgroup title | No. of studies | No. of participants | Statistical method | Effect size |
| 1 Serum calcium change (mmol/L) Show forest plot | 1 | Mean Difference (Fixed, 95% CI) | Totals not selected | |
| 1.1 Up to 12 months | 1 | Mean Difference (Fixed, 95% CI) | 0.0 [0.0, 0.0] | |
| 2 Serum calcium (absolute final) Show forest plot | 2 | 51 | Mean Difference (IV, Fixed, 95% CI) | 0.02 [‐0.02, 0.06] |
| 2.1 Up to 3 months | 1 | 30 | Mean Difference (IV, Fixed, 95% CI) | 0.02 [‐0.04, 0.08] |
| 2.2 Up to 6 months | 1 | 21 | Mean Difference (IV, Fixed, 95% CI) | 0.02 [‐0.03, 0.07] |
| 3 25(OH)D Show forest plot | 3 | 81 | Mean Difference (IV, Fixed, 95% CI) | 7.24 [5.01, 9.46] |
| 3.1 Up to 3 months (final values) | 1 | 30 | Mean Difference (IV, Fixed, 95% CI) | 8.70 [6.24, 11.16] |
| 3.2 Up to 6 months (final values) | 1 | 21 | Mean Difference (IV, Fixed, 95% CI) | 1.20 [‐4.56, 6.96] |
| 3.3 Up to 12 months (change from baseline) | 1 | 30 | Mean Difference (IV, Fixed, 95% CI) | ‐2.60 [‐15.41, 10.21] |
| 4 1,25(OH)2D (absolute final) Show forest plot | 1 | Mean Difference (IV, Fixed, 95% CI) | Totals not selected | |
| 4.1 Up to 6 months | 1 | Mean Difference (IV, Fixed, 95% CI) | 0.0 [0.0, 0.0] | |
| 5 PTH levels (absolute final) Show forest plot | 2 | 51 | Mean Difference (IV, Fixed, 95% CI) | ‐0.93 [‐5.22, 3.36] |
| 5.1 Up to 3 months | 1 | 21 | Mean Difference (IV, Fixed, 95% CI) | ‐7.60 [‐20.51, 5.31] |
| 5.2 Up to 6 months | 1 | 30 | Mean Difference (IV, Fixed, 95% CI) | ‐0.10 [‐4.65, 4.45] |
| 6 PTH levels (change from baseline) Show forest plot | 1 | Mean Difference (Fixed, 95% CI) | Totals not selected | |
| 6.1 Up to 12 months | 1 | Mean Difference (Fixed, 95% CI) | 0.0 [0.0, 0.0] | |
| Outcome or subgroup title | No. of studies | No. of participants | Statistical method | Effect size |
| 1 Whole body bone mineral content change (g) Show forest plot | 1 | Mean Difference (IV, Fixed, 95% CI) | Totals not selected | |
| 1.1 Up to 12 months | 1 | Mean Difference (IV, Fixed, 95% CI) | 0.0 [0.0, 0.0] | |
| 2 Lumbar spine z score Show forest plot | 1 | Mean Difference (IV, Fixed, 95% CI) | Totals not selected | |
| 2.1 Up to 12 months | 1 | Mean Difference (IV, Fixed, 95% CI) | 0.0 [0.0, 0.0] | |
| 3 Lumbar spine bone mineral density (% change) Show forest plot | 1 | Mean Difference (Fixed, 95% CI) | Totals not selected | |
| 3.1 Up to 12 months | 1 | Mean Difference (Fixed, 95% CI) | 0.0 [0.0, 0.0] | |
| 4 Hip bone mineral density (% change) Show forest plot | 1 | Mean Difference (Fixed, 95% CI) | Totals not selected | |
| 4.1 Up to 12 months | 1 | Mean Difference (Fixed, 95% CI) | 0.0 [0.0, 0.0] | |
| 5 Distal forearm bone mineral density (% change) Show forest plot | 1 | Mean Difference (Fixed, 95% CI) | Totals not selected | |
| 5.1 Up to 12 months | 1 | Mean Difference (Fixed, 95% CI) | 0.0 [0.0, 0.0] | |
| 6 Hip bone mineral density (change) Show forest plot | 1 | Mean Difference (IV, Fixed, 95% CI) | Totals not selected | |
| 6.1 Up to 12 months | 1 | Mean Difference (IV, Fixed, 95% CI) | 0.0 [0.0, 0.0] | |