Contenido relacionado
Revisiones y protocolos relacionados
Vanitha A Jagannath, Vidhu Thaker, Anne B Chang, Amy I Price | 4 junio 2020
Peter O Okebukola, Sonal Kansra, Joanne Barrett | 6 septiembre 2020
Htoo Htoo Kyaw Soe, Adinegara BL Abas, Nan Nitra Than, Han Ni, Jaspal Singh, Abdul Razzak Bin Mohd Said, Ifeyinwa Osunkwo | 28 mayo 2020
Katharine Cheng, Deborah Ashby, Rosalind L Smyth | 9 diciembre 2015
Helen Watson, Caroline Stackhouse | 10 abril 2020
Jorrit JV de Vries, Anne B Chang, Catherine M Bonifant, Elizabeth Shevill, Julie M Marchant | 9 agosto 2018
Tomas C Jeffery, Anne B Chang, Louise S Conwell | 10 enero 2023
Rosalind L Smyth, Oli Rayner | 4 mayo 2017
Ian M Balfour-Lynn, Karen Welch, Sherie Smith | 4 julio 2019
Gary M Onady, Adrienne Stolfi | 19 octubre 2020

![Forest plot of comparison: 1 Vitamin D versus placebo, outcome: 1.2 Serum calcium (absolute final) [mmol/L].](/es/cdsr/doi/10.1002/14651858.CD007298.pub4/media/CDSR/CD007298/image_n/nCD007298-AFig-FIG02.png)
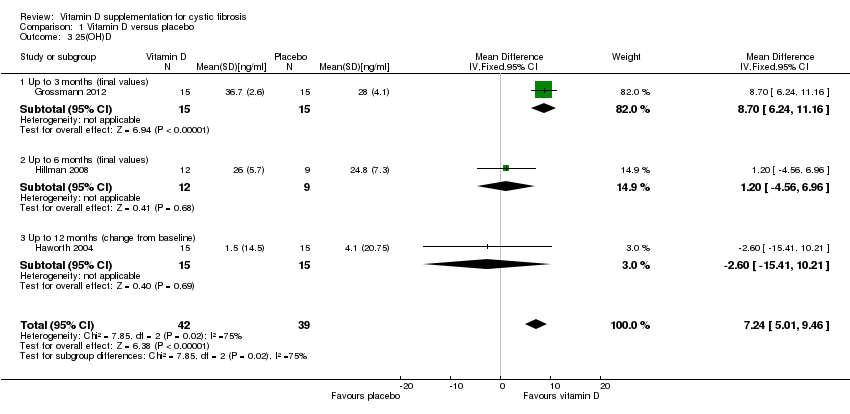
![Forest plot of comparison: 1 Vitamin D versus placebo, outcome: 1.3 25(OH)D [ng/ml].](/es/cdsr/doi/10.1002/14651858.CD007298.pub4/media/CDSR/CD007298/image_n/nCD007298-AFig-FIG03.png)
![Forest plot of comparison: 1 Vitamin D versus placebo, outcome: 1.5 PTH levels (absolute final) [pmol/L].](/es/cdsr/doi/10.1002/14651858.CD007298.pub4/media/CDSR/CD007298/image_n/nCD007298-AFig-FIG04.png)