Rehabilitación cardiaca domiciliaria versus rehabilitación en un centro de atención
Resumen
Antecedentes
Las enfermedades cardiovasculares son la causa principal de muerte en todo el mundo. Tradicionalmente, los programas de rehabilitación cardíaca en centros se ofrecen a las personas después de los eventos cardíacos para ayudar a la recuperación y prevenir nuevas enfermedades cardíacas. Los programas de rehabilitación cardíaca domiciliaria se han introducido con la intención de aumentar el acceso y la participación. Ésta es una actualización de una revisión publicada previamente en 2009 y 2015.
Objetivos
Comparar el efecto de la rehabilitación cardíaca en el hogar y en centros supervisados sobre la mortalidad y la morbilidad, la capacidad de ejercicio, la calidad de vida relacionada con la salud y los factores de riesgo cardíaco modificables en pacientes con enfermedades cardíacas.
Métodos de búsqueda
Se actualizaron las búsquedas de la revisión Cochrane anterior mediante la búsqueda en el Registro Cochrane Central de Ensayos Controlados (Cochrane Central Register of Controlled Trials, CENTRAL), MEDLINE (Ovidio), Embase (Ovidio), PsycINFO (Ovidio) y CINAHL (EBSCO) el 21 de septiembre de 2016. También se realizaron búsquedas en dos registros de ensayos clínicos, así como en revisiones sistemáticas previas y en las listas de referencias de los estudios incluidos. No se aplicaron restricciones de idioma.
Criterios de selección
Se incluyeron ensayos controlados aleatorizados (incluidos diseños de grupos paralelos, cruzados o cuasialeatorizados) que compararon la rehabilitación cardíaca en centros (p.ej. hospital, gimnasio, centro deportivo) con programas domiciliarios en adultos con infarto de miocardio, angina, insuficiencia cardíaca o que se habían sometido a una revascularización.
Obtención y análisis de los datos
Dos autores de la revisión examinaron de forma independiente todas las referencias identificadas para su inclusión en base a criterios de inclusión preespecificados. Los desacuerdos se resolvieron mediante discusión o mediante la inclusión de un tercer revisor. Dos autores extrajeron de forma independiente los datos de resultados y las características del estudio y evaluaron el riesgo de sesgo. La calidad de la evidencia se evaluó utilizando los principios de GRADE y se creó una tabla resumen de los resultados.
Resultados principales
Se incluyeron seis nuevos estudios (624 participantes) para esta actualización, que ahora incluye un total de 23 ensayos que asignaron al azar a un total de 2890 participantes que se someten a rehabilitación cardíaca. Los participantes tuvieron un infarto agudo de miocardio, revascularización o insuficiencia cardíaca. Varios estudios no proporcionaron detalles suficientes para permitir la evaluación del posible riesgo de sesgo, en particular, se informó de manera deficiente sobre los detalles de la generación y ocultación de la secuencia de asignación aleatoria y el cegamiento de la evaluación de resultados.
No se observó evidencia de una diferencia entre la rehabilitación cardíaca domiciliaria y en el centro en los resultados clínicos principales hasta 12 meses de seguimiento: mortalidad total (riesgo relativo (RR) = 1,19; IC del 95%: 0,65 a 2.16; participantes = 1505; estudios = 11/comparaciones = 13; evidencia de muy baja calidad), capacidad de ejercicio (diferencia de medias estandarizada (DME) = ‐0,13; IC del 95%: ‐0,28 a 0,02; participantes = 2255; estudios = 22/comparaciones = 26; evidencia de baja calidad), o calidad de vida relacionada con la salud hasta 24 meses (no estimable). Los ensayos fueron en general de corta duración, y sólo tres estudios informaron de resultados más allá de los 12 meses (capacidad de ejercicio: DME 0,11, IC del 95%: ‐0,01 a 0,23; participantes = 1074; estudios = 3; evidencia de calidad moderada). Sin embargo, hubo evidencia de niveles marginalmente más altos de finalización del programa (RR 1,04, IC del 95%: 1,00 a 1,08; participantes = 2615; estudios = 22/comparaciones = 26; evidencia de baja calidad) por parte de los participantes que realizaban la rehabilitación en domicilio.
Conclusiones de los autores
Esta actualización apoya las conclusiones anteriores de que las formas de rehabilitación cardíaca basadas domicilio y en el centro parecen ser igualmente eficaces para mejorar los resultados clínicos y de calidad de vida relacionados con la salud en los pacientes después de un infarto de miocardio o una revascularización, o con insuficiencia cardíaca. Esta conclusión apoya la continua expansión de los programas de rehabilitación cardíaca basados en evidencia y en el domicilio. La elección de participar en un programa más tradicional y supervisado en un centro o en un programa domiciliario puede reflejar la disponibilidad local y tener en cuenta la preferencia de cada paciente. Se necesitan más datos para determinar si los efectos de la rehabilitación cardíaca domiciliaria y en un centro, comunicados en los ensayos a corto plazo incluidos, pueden confirmarse a más largo plazo y es necesario considerar diseños de estudio de no inferioridad o equivalencia con un poder adecuado.
PICO
Resumen en términos sencillos
Rehabilitación cardiaca domiciliaria frente a la rehabilitación cardíaca en un centro de atención
Pregunta de la revisión
Se compararon los programas de rehabilitación cardíaca domiciliaria con la rehabilitación cardíaca supervisada en centros para adultos con infarto de miocardio (se ha detenido el flujo sanguíneo al corazón), angina (dolor de pecho), insuficiencia cardíaca o que se han sometido a una revascularización.
Antecedentes
La rehabilitación cardíaca tiene por objeto devolver la salud a las personas con enfermedades cardíacas, mediante una combinación de ejercicio, educación y apoyo psicológico. Tradicionalmente, los programas de rehabilitación cardíaca en centros (p.ej., en hospitales, gimnasios o centros deportivos) se ofrecen a las personas después de un evento cardíaco. Se han introducido los programas de rehabilitación cardíaca domiciliaria en un intento por ampliar el acceso y la participación.
Fecha de la búsqueda
Se hicieron búsquedas hasta septiembre de 2016.
Características de los estudios
Se buscaron ensayos controlados aleatorizados (ensayos que asignan al azar a los participantes a uno de dos o más grupos de tratamiento) que consideren la efectividad de los programas de rehabilitación cardíaca en el hogar frente a los programas de rehabilitación cardíaca en centros supervisados, en adultos con enfermedades cardíacas.
Se incluyeron 23 ensayos (2890 participantes). La mayoría de los ensayos fueron relativamente pequeños (mediana de 104 participantes, rango: 20 a 525). La edad promedio de los participantes en el ensayo oscilaba entre 51,6 y 69 años. Las mujeres representaron sólo el 19% de los participantes reclutados; cuatro ensayos no incluyeron mujeres.
La mezcla de personas reclutadas en los ensayos varió; 10 estudios incluyeron una población mixta de pacientes con cardiopatía coronaria, cinco estudios incluyeron personas que habían sufrido un ataque cardíaco y cuatro estudios reclutaron cada uno a personas después de la revascularización o que tenían insuficiencia cardíaca.
Fuentes de financiación de los estudios
Dieciséis estudios informaron sobre fuentes de financiación; siete no lo hicieron. Ningún estudio informó de la financiación de un organismo con interés comercial en los resultados.
Resultados clave
Se comprobó que los programas de rehabilitación cardíaca en domicilio y en los centros son similares en cuanto a los beneficios medidos en términos de número de muertes, capacidad de ejercicio y calidad de vida relacionada con la salud. Se necesitan más datos para confirmar si estos efectos a corto plazo de la rehabilitación cardíaca en el domicilio y en los centros pueden mantenerse a lo largo del tiempo.
Calidad de la evidencia
La deficiente presentación de informes dificultó la evaluación de la calidad metodológica de los estudios incluidos y su riesgo de sesgo. La calidad de la evidencia variaba de muy baja (mortalidad total) a moderada (capacidad de ejercicio durante 12 meses y calidad de vida relacionada con la salud). Las principales razones de la baja evaluación de la calidad fue la deficiente presentación de informes en los estudios incluidos.
Authors' conclusions
Summary of findings
| Home‐based versus supervised centre‐based cardiac rehabilitation for heart disease | ||||||
| Patient or population: Patients with heart disease | ||||||
| Outcomes | Anticipated absolute effects* (95% CI) | Relative effect | № of participants | Quality of the evidence | Comments | |
| Risk with centre‐based | Risk with home‐base | |||||
| Total mortality | Study population | RR 1.19 | 1505 | ⊕⊝⊝⊝ | ||
| 22 per 1,000 | 26 per 1,000 | |||||
| Exercise capacity ≤ 12 months | The mean exercise capacity ≤ 12 months ranged from ‐2 to 3,509.33 | SMD 0.13 lower | ‐ | 2255 | ⊕⊕⊝⊝ | Higher score indicates improved activity. A rule of thumb for interpreting SMD is that 0.2 represents a small effect, 0.5 a moderate effect and 0.8 a large effect (Cohen 1988) |
| Withdrawal from the intervention group | Study population | RR 1.04 | 2615 | ⊕⊕⊝⊝ | ||
| 816 per 1,000 | 848 per 1,000 | |||||
| HRQoL | HRQoL in home‐based cardiac rehabilitation = HRQoL in centre‐based cardiac rehabilitation, in 61/67 domains | Not estimable | 2079 | ⊕⊕⊕⊝ | ||
| *The risk in the intervention group (and its 95% confidence interval) is based on the assumed risk in the comparison group and the relative effect of the intervention (and its 95% CI). | ||||||
| GRADE Working Group grades of evidence | ||||||
| 1 Random sequence generation, allocation concealment or blinding of outcome assessors were poorly described in over 50% of included studies; bias likely, therefore quality of evidence downgraded by one level. 2 The 95% CIs includes both no effect, appreciate benefit and appreciable harm (i.e. CI < 0.75 and > 1.25), therefore quality of evidence downgraded by two levels. 3 I² > 50%; heterogeneity may be important and therefore quality of evidence downgraded by one level | ||||||
Background
Description of the condition
Cardiovascular disease (CVD) is the leading cause of death globally: in 2015 an estimated 17.7 million people died from CVD, representing 31% of all global deaths (WHO 2016). Of these deaths, an estimated 7.4 million were due to coronary heart disease (CHD) and 6.7 million were due to stroke (WHO 2016). Over three quarters of CVD deaths occur in low‐ and middle‐income countries (WHO 2016).
Coronary heart disease is caused by the build‐up of plaque inside the coronary arteries (atherosclerosis), causing arterial narrowing and reducing the flow of oxygen‐rich blood to the heart. The main manifestations of CHD are angina pectoris (chest pain), myocardial infarction (MI), and heart failure. Myocardial infarction occurs when blood flow to the heart muscle is abruptly cut off as the result of a blockage in one or more of the coronary arteries, causing tissue damage. Over time, CHD can weaken the heart muscle and lead to arrhythmias or heart failure. Coronary heart disease causes significant morbidity and mortality, and as a long term condition it contributes greatly to disability in developed countries, accounting for 19% of total disability adjusted life years lost in European countries (European Cardiovascular Disease Statistics 2017). Coronary heart disease can result in difficulties in functionality and performing everyday activities, and impairs sexual function (Racca 2010), all contributing to a reduction in health‐related quality of life (HRQoL) (Gravely‐Witte 2007).
In the United Kingdom (UK), an estimated 2.3 million people live with CHD and the condition accounts for one in five deaths in men and one in 10 deaths in women (Nicholls 2012; Townsend 2012). However, with more people surviving MI (WHO 2008) and heart failure (Kostis 1997), an increasing number of people are now living with CHD and may need support to manage their symptoms and improve their prognosis.
Description of the intervention
Although there are many definitions of cardiac rehabilitation, the following describes their combined key elements: “The coordinated sum of activities required to influence favourably the underlying cause of cardiovascular disease, as well as to provide the best possible physical, mental, and social conditions, so that the patients may, by their own efforts, preserve or resume optimal functioning in their community and through improved health behaviour, slow or reverse progression of disease” (BACPR 2012; Buckley 2013). A central component of cardiac rehabilitation is exercise training (Piepoli 1998; Piepoli 2010). However, in addition to exercise, it is recommended that programmes provide lifestyle education on CHD risk factor management plus counselling and psychological support ‐ so‐called ‘comprehensive cardiac rehabilitation’ (Corrà 2005).
Cardiac rehabilitation is a complex intervention that involves a variety of therapies, including exercise, risk factor education, behaviour change, psychological support, and strategies that are aimed at targeting traditional risk factors for cardiovascular disease. Cardiac rehabilitation should be considered an essential part of the contemporary treatment of heart disease and is considered a priority in countries with a high prevalence of CHD. Cardiac rehabilitation has been shown to improve health‐related quality of life and reduce future morbidity (Anderson 2016; Taylor 2014; Davies 2014). Based on evidence from previous meta‐analyses and systematic reviews, exercise‐based cardiac rehabilitation following a cardiac event, or for patients with heart failure, is a Class I recommendation from the American College of Cardiology/American Heart Association (Balady 2011; Kulik 2015; Smith 2011; Yancy 2013) and the European Society of Cardiology, (McMurray 2012; Roffi 2015; Steg 2012) and is recommended by the National Institute for Health and Care Excellence (NICE 2010; NICE 2013). Service provision, though predominantly centre‐based, varies markedly, and referral, enrolment and completion are sub‐optimal, especially among women and older people (Beswick 2004; Clark 2012). Home‐based cardiac rehabilitation programmes have been increasingly introduced to widen access and participation (Taylor 2009), and interventions aimed at improving patient uptake and adherence to cardiac rehabilitation programmes have been adopted (Karmali 2014).
How the intervention might work
There are a number of mechanisms by which exercise training benefits patients dependent on the cause of their heart disease. For people with CHD, approximately half of the 28% reduction in cardiac mortality achieved with exercise‐based cardiac rehabilitation has been attributed to reductions in major risk factors (e.g. lipids, smoking) (Taylor 2006). For patients with ischaemic causes of heart failure, exercise training appears to improve myocardial perfusion by alleviating endothelial dysfunction thereby dilating coronary vessels, and by stimulating new vessel formation by way of intermittent ischaemia (ExTraMatch 2004). Indeed, Haykowsky 2007 demonstrated that aerobic training in people with heart failure patients improves myocardial contractility and diastolic filling. In their meta‐analysis Haykowsky 2007 demonstrated the benefits of exercise training in people with heart failure in terms of cardiac remodelling as measured by ejection fraction, end‐diastolic volume, and end‐systolic volume. Skeletal muscle dysfunction and wasting may also respond to exercise training (Haykowsky 2007). Regular physical activity by people with heart failure also stimulates vasodilation in the skeletal muscle vasculature and improves oxidative capacity (Hambrecht 1998).The inclusion of psycho‐educational interventions may improve patients' knowledge and risk factor behaviour (Brown 2013; Dickens 2013) and psychological well‐being, including levels of depression and anxiety.
Why it is important to do this review
Although the beneficial effects of cardiac rehabilitation have been shown, participation remains sub‐optimal (Dalal 2012), particularly so by heart failure patients (Dalal 2012; Piepoli 2015). Two of the main reasons people give for not accepting the invitation to attend cardiac rehabilitation are difficulty with regularly attending sessions at their local hospital and reluctance to take part in group‐based classes (Beswick 2004). Home‐based cardiac rehabilitation programmes have therefore been introduced in an attempt to improve rates of participation. In the UK, home‐based cardiac rehabilitation with a self‐help manual ‐ the Heart Manual ‐ supported by a nurse facilitator is a programme of rehabilitation that has been available for over two decades (Lewin 1992). Home‐based cardiac rehabilitation programmes can include supervised and unsupervised elements and increasingly use technology or "telehealth" interventions to support or encourage exercise or behaviour change (Artinian 2007; Neubeck 2009) or to overcome barriers of time and distance (Huang 2015). Figures from the National Audit for Cardiac Rehabilitation (NACR) indicate that approximately 5% of UK sites are currently providing the Heart Manual (NACR 2013), with some 14,000 copies given to patients in UK and abroad each year (Heart Manual 2016). The Heart Manual has also been used in many countries across the world, including Singapore, Italy, Canada, China, Ireland and Cayman (Heart Manual 2016), yet facilitated home‐based options such as the Heart Manual have not increased their share of cardiac rehabilitation provision in the UK in recent years (NACR 2016).
In the previous version of this Cochrane Review, the authors identified five new head‐to‐head randomised controlled trials (345 participants) of home‐ versus centre‐based cardiac rehabilitation (Taylor 2015). Unlike most studies in the original version of the review (Dalal 2010; Taylor 2009), these new studies included patients with heart failure. The authors found the two methods of delivery to be equally effective for improving the clinical and health‐related quality of life outcomes in low risk patients after MI or revascularisation, or with heart failure (Buckingham 2016; Taylor 2015). On the basis of this evidence, together with the absence of evidence of important differences in healthcare costs between the two approaches, the authors concluded that the expansion of home‐based cardiac rehabilitation programmes should continue and that the choice of participating in a more traditional and supervised centre‐based programme or a home‐based programme should reflect the preference of the individual patient (Taylor 2015). More recently, a systematic review was conducted to assess the effectiveness of home‐based cardiac rehabilitation for heart failure compared to either usual medical care (i.e. no cardiac rehabilitation) or centre‐based cardiac rehabilitation on mortality, morbidity, exercise capacity, health‐related quality of life, drop out, adherence rates, and costs (Zwisler 2016). This review found that home‐based cardiac rehabilitation led to short‐term improvements in exercise capacity and health‐related quality of life of heart failure patients compared to usual care, and the magnitude of outcome improvements were similar to those achieved with centre‐based cardiac rehabilitation (Zwisler 2016).
Objectives
To compare the effect of home‐based and supervised centre‐based cardiac rehabilitation on mortality and morbidity, exercise‐capacity, health‐related quality of life, and modifiable cardiac risk factors in patients with heart disease.
Methods
Criteria for considering studies for this review
Types of studies
Randomised controlled trials (RCTs; individual or cluster level), including parallel group, cross‐over or quasi‐randomised designs, were eligible for inclusion. Systematic reviews and meta‐analyses were identified as a means to identify additional RCTs.
Types of participants
The study population included adults (≥18 years) who were post myocardial infarction (MI), have angina, or had undergone revascularisation (coronary artery bypass grafting (CABG), percutaneous transluminal coronary angioplasty or coronary artery stent) or who have had heart failure, who have taken part, or been invited to take part, in cardiac rehabilitation.
Studies were excluded if they included participants with heart transplants, those implanted with either cardiac resynchronisation therapy or implantable defibrillators, or those who had previously received cardiac rehabilitation.
Types of interventions
Home‐based cardiac rehabilitation is defined as a structured programme (that includes exercise training) with clear objectives for the participants, including monitoring, follow up visits, letters or telephone calls from staff or at least self‐monitoring diaries (Jolly 2006). The comparison group was centre‐based cardiac rehabilitation based in a variety of settings (e.g. hospital physiotherapy department, university gymnasium, community sports centre). We included cardiac rehabilitation programmes whether they were based solely on exercise or included other intervention elements (comprehensive cardiac rehabilitation).
Types of outcome measures
Primary outcomes
-
Total mortality.
-
Cardiac events:
-
Re‐infarction;
-
Total revascularisations (including CABG and percutaneous coronary intervention (PCI)); and
-
Cardiac associated hospitalisation.
-
-
Exercise capacity assessed by validated outcome measure (e.g. VO₂ peak, 6 minute walk test).
-
Validated measures of health‐related quality of life (HRQoL) (e.g. Short Form Health Survey (SF‐36), Sickness Impact Profile, Nottingham Health Profile).
-
Withdrawal from the exercise programme.
Secondary outcomes
-
Modifiable coronary risk factors (i.e. blood lipid levels, blood pressure, smoking behaviour).
-
Adherence to cardiac rehabilitation.
-
Costs and health service use (e.g. use of medication, primary care contacts).
Reporting of outcomes was not an inclusion or exclusion criterion for this update.
Search methods for identification of studies
Electronic searches
The search from the previously published Cochrane review (Taylor 2015) was updated by searching the following bibliographic databases on 21 September 2016:
-
CENTRAL Issue 8, 2016 in the Cochrane Library.
-
Epub Ahead of Print, In‐Process & Other Non‐Indexed Citations, MEDLINE Daily and MEDLINE (Ovid, 1946 to 21 September 2016).
-
Embase (Ovid, 1980 to 2016 Week 38).
-
PsycINFO (Ovid, 1806 to July Week 4 2016).
-
CINAHL Plus (EBSCO, 1937 to 21 September 2016).
The searches were run twice for this update; once in August 2016 using the search strategies from the last update and again in September 2016 with additional terms added to the strategies. Date limits were applied to the old terms to only retrieve results added since the last search, but not to the newly added terms.
The search strategies were designed with reference to those of the previous version of this review (Taylor 2015). We searched the databases using a strategy combining selected MeSH terms and free text terms relating to patient education and coronary heart disease (CHD), with filters applied to limit to RCTs. We used the Cochrane sensitivity‐maximising RCT filter for MEDLINE, and for Embase, terms recommended in the Cochrane Handbook for Systematic Reviews of Interventions were applied (Lefebvre 2011). Adaptations of this filter were applied to CINAHL and PsycINFO. We translated the MEDLINE search strategy into the other databases using the appropriate controlled vocabulary as applicable. We imposed no language or other limitations and gave consideration to variations in terms used and spellings of terms in different countries so that studies would not be missed by the search strategy because of such variations. See Appendix 1 for details of the search strategies used.
The reporting of search results was conducted in accordance with PRISMA (Moher 2009). Information about the number of studies identified, included and excluded, and the reasons for exclusion is summarised using a flow diagram (Figure 1).
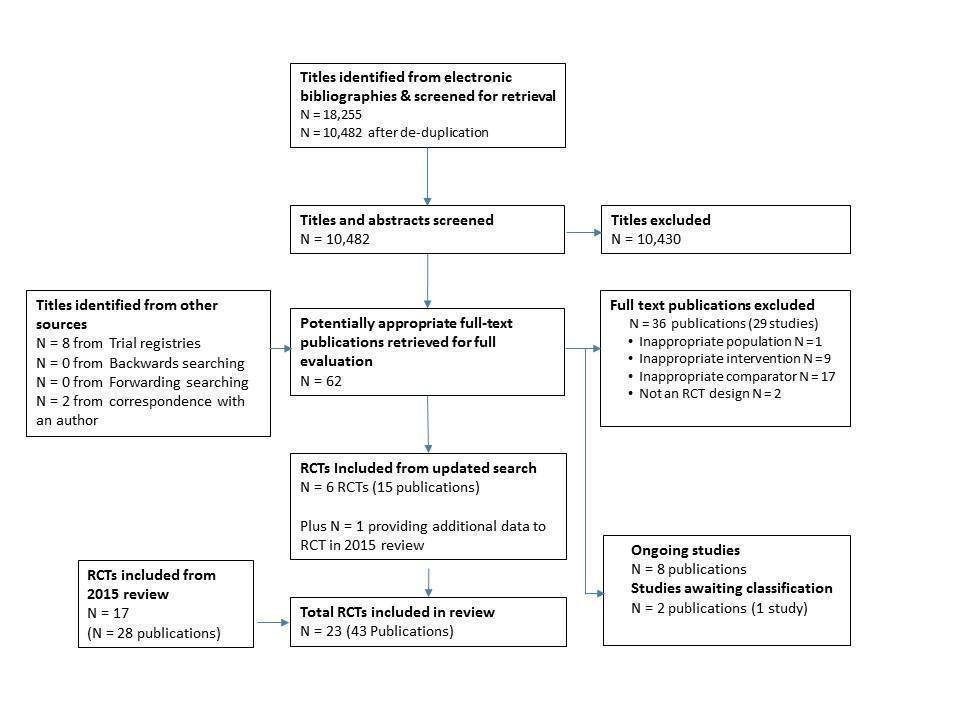
PRISMA Flow Diagram
Searching other resources
We handsearched reference lists of retrieved articles and systematic reviews for any studies not identified by the electronic searches. We also searched clinical trial registers on 7 November 2016; World Health Organization International Clinical Trials Registry Platform (WHO ICTRP; http://www.who.int/ictrp/en) and ClinicalTrials.gov (https://clinicaltrials.gov)) for ongoing clinical trials and sought expert advice. Attempts were made to contact all study authors to obtain relevant information not available in the published manuscript.
Data collection and analysis
Selection of studies
We screened (LA and GAS) the titles and abstracts of identified studies, and discarded clearly irrelevant ones. Two review authors (LA and GAS) then obtained and independently assessed the full‐text reports of all potentially relevant randomised trials for eligibility, based on the defined inclusion criteria. Any disagreement was resolved by discussion and where uncertainty remained, the opinion of a further author (RST) was taken. Excluded studies and reasons for exclusion are detailed in Characteristics of excluded studies. Where necessary, authors of included studies were contacted for missing information.
Data extraction and management
Two independent review authors (LA and GAS) extracted study characteristics of included RCTs using a standardised data collection form which had been piloted on two RCTs included in the review. Data on participant characteristics (e.g. age, sex, CHD diagnosis) details of the intervention (including duration, frequency and delivery), description of usual care and length of follow‐up were extracted. Two independent review authors (LA and GAS) extracted outcome data onto a standardised collection form. If data were presented numerically (in tables or text) and graphically (in figures), the numeric data were used because of possible measurement error when estimating from graphs. Any discrepancies were resolved by arbitration. One review author (LA) transferred extracted data into Review Manager 5.3 (RevMan 2014), and checked data for accuracy against the data collection forms.
If there were multiple reports of the same study, we assessed the duplicate publications for additional data. We extracted outcome results at all follow‐up points post‐randomisation. We contacted study authors where necessary to provide additional information.
Assessment of risk of bias in included studies
Factors considered included the reporting of random sequence generation and allocation concealment, the description of drop‐outs and withdrawals (high risk if >20% loss), consideration of blinding of outcome assessors, and degree of selective outcome reporting. In addition, evidence was sought that the groups were balanced at baseline and whether co‐interventions were delivered equally across the groups. The risk of bias in eligible trials was assessed by two reviewers independently (LA and GAS).
Measures of treatment effect
We extracted outcome results at follow‐up and the focus of this review was the between‐group difference in home‐ versus centre‐based groups. Primary outcomes relating to clinical event data were extracted as dichotomous outcomes for each study. Event data were expressed as risk ratios (RR) with associated 95% confidence intervals (CI), and study sample sizes were based on the number randomised to treatment conditions. For continuous variables, mean differences (MD) and 95% CI were calculated for each outcome, with sample sizes based on number completing assessments at each time‐point. When the results at follow‐up and differences between groups of the individual trials were not reported in the original publication, we calculated P values for the differences using the reported mean and standard deviation with the t‐test command in STATA (StataCorp 2013).
Given the variety of exercise capacity measures reported, results for this outcome were expressed as a standardised mean difference (SMD). Where a trial reported more than one exercise capacity endpoint we used the first one reported in the publication. Other continuous outcomes were pooled as weighted mean differences (WMD).
Unit of analysis issues
In accordance with Section 9.3.1 of the Cochrane Handbook for Systematic Reviews of Intervention (Higgins 2011), we ensured that the analysis was appropriate to the level at which randomisation occurred. All studies included in this review were simple parallel group RCTs, and so there were no issues relating to unit of analysis.
Dealing with missing data
We contacted investigators or study sponsors to verify key study characteristics and obtain missing numerical outcome data where possible (for example when a study was identified as abstract only). For this update, we contacted Grace to request absolute values for adherence data which were presented graphically in the publication (Grace 2016 Mixed). We also contacted Varnfield to obtain six month follow‐up data which were presented graphically (Varnfield 2014). Finally, we contacted Hadadzadeh for further details on study which had been identified as an abstract. This communication also led to the identification of a second study by the same authors which also met our inclusion criteria, but was not yet published (Hadadzadeh 2013; Hadadzadeh 2015).
Assessment of heterogeneity
Heterogeneity amongst included studies was explored qualitatively (by comparing the characteristics of included studies) and quantitatively (using the Chi² test of homogeneity and I² statistic). Where appropriate, the results from included studies were combined for each outcome to give an overall estimate of treatment effect. A fixed‐effect meta‐analysis was used except where statistical heterogeneity was indicated by a I² of ≥ 50%, in which case a random‐effects model was used.
Assessment of reporting biases
The funnel plot and the Egger test (Egger 1997) were used to examine small study bias for outcomes where there were 10 or more studies contributing data to the analysis.
Data synthesis
We processed data in accordance with the Cochrane Handbook for Systematic Reviews of Interventions (Higgins 2011). Where appropriate and possible, results from included studies were combined for each outcome to give an overall estimate of treatment effect, using either a fixed‐effect or random‐effects model.
Summary of findings table
Two independent review authors (LA and GS) employed the Grading of Recommendations Assessment, Development and Evaluation (GRADE) approach to interpret result findings and used GRADEpro GDT 2015 to import data from Review Manager to create a 'Summary of findings table'. We created a 'Summary of findings' table using the following outcomes: total mortality, exercise capacity, withdrawal and HRQoL. We used the five GRADE considerations (study limitations, consistency of effect, imprecision, indirectness, and publication bias) to assess the quality of a body of evidence as it relates to the studies that contribute data to the meta‐analyses for the prespecified outcomes. We used methods and recommendations described in Section 8.5 and Chapter 12 of the Cochrane Handbook for Systematic Reviews of Interventions using GRADEpro software (Higgins 2011). We have justified all decisions to downgrade the quality of studies using footnotes, and have made comments to aid readers' understanding of the review where necessary.
Subgroup analysis and investigation of heterogeneity
We undertook subgroup analysis using meta‐regression to examine potential treatment effect modifiers. We tested the following a priori hypotheses that there may be differences in the effect of home‐ and centre‐based cardiac rehabilitation programmes on total mortality, exercise capacity ≤ 12 months, withdrawal, total cholesterol and blood pressure, across the following subgroups:
-
case mix (% MI);
-
type of cardiac rehabilitation (exercise‐only cardiac rehabilitation versus comprehensive cardiac rehabilitation);
-
'dose' of exercise intervention (dose = number of weeks of exercise training x average number of sessions/week x average duration of session in minutes) (dose ≥ 1000 units versus dose < 1000 units);
-
follow‐up period;
-
year of publication;
-
sample size;
-
risk of bias (low risk in ≥ 4 items versus < 4 items); and
-
study location (continent).
Given the relatively small ratio of trials to covariates, multivariable meta‐regression was not appropriate, and instead, limited to a univariate analysis (Deeks 2011). The permute option in STATA was used to allow for multiple testing in meta‐regression (StataCorp 2013).
Results
Description of studies
No cluster RCTs were identified in our searches and therefore only individual RCTs were included in this review.
Results of the search
The original 2009 version of this Cochrane Review contributed 12 trials to this latest analysis (Arthur 2002; Bell 1998; Carlson 2000; Dalal 2007; Daskapan 2005; Gordon 2002 Community; Gordon 2002 Supervised; Jolly 2007; Kassaian 2000; Marchionni 2003; Miller 1984 Brief; Miller 1984 Expanded; Sparks 1993; Wu 2006). The 2015 update identified one previously included trial with longer follow up (Arthur 2002) and five new trials (Cowie 2012; Karapolat 2009; Moholdt 2012; Oerkild 2011; Piotrowicz 2010) and included a total of 17 trials (28 reports).
For this update, 18,255 records were identified through database searches and 10,482 records were screened following de‐duplication. An additional 10 records were identified from other sources. We assessed a total of 62 full text records. We identified one previously included trial with further health‐related quality of life (HRQoL) data (Piotrowicz 2010) and six new trials (Aamot 2014 Treadmill; Grace 2016 Mixed; Hadadzadeh 2013; Hadadzadeh 2015; Kraal 2014; Varnfield 2014). Two of these trials compared a home‐based programme with two supervised centre‐based exercise programmes (Aamot 2014 Treadmill; Grace 2016 Mixed) and this update therefore includes eight additional home‐ versus centre‐based cardiac rehabilitation comparisons.
Two of the studies identified in this update have not yet been published in peer‐reviewed journals (Hadadzadeh 2013; Hadadzadeh 2015). Study and outcome data have been provided by the author of these trials, but in the absence of full study details, it was not possible to assess methodological quality using all domains of the Cochrane risk of bias tool, for these studies.
The study selection process is summarised in the PRISMA flow diagram (Figure 1).
Included studies
The 23 trials (27 home‐ versus centre‐based comparisons) included a total of 2890 participants and all used an individual patient randomisation method (there were no quasi‐randomised studies). Most trials were relatively small in sample size (median 104 participants, range: 20 to 525). The average age of patients in the trials ranged from 51.6 to 69.0 years. With the exception of four trials (Kassaian 2000; Miller 1984 Brief; Sparks 1993; Wu 2006), all included women. However, women accounted for only 19% of all participants who were recruited in the included studies. The mix of participants recruited to included trials varied, with 10 studies including a mixed population of people with coronary heart disease (CHD) (Aamot 2014 Treadmill; Carlson 2000; Gordon 2002 Community; Grace 2016 Mixed; Hadadzadeh 2015; Jolly 2007; Kassaian 2000; Kraal 2014; Oerkild 2011; Piotrowicz 2010), five studies included patients post‐myocardial infarction (MI) (Bell 1998; Dalal 2007; Marchionni 2003; Miller 1984 Brief; Varnfield 2014), four recruited patients following revascularisation (Arthur 2002; Hadadzadeh 2013; Moholdt 2012; Wu 2006), and four studies included participants with heart failure (Cowie 2012; Daskapan 2005; Karapolat 2009; Piotrowicz 2010).
All trials used an individual patient level method for randomisation. Four studies were UK‐based (Bell 1998; Cowie 2012; Dalal 2007; Jolly 2007); four were based in the USA (Carlson 2000; Gordon 2002 Community; Miller 1984 Brief; Sparks 1993); two studies each were from Turkey (Daskapan 2005; Karapolat 2009), Norway (Aamot 2014 Treadmill; Moholdt 2012) and Canada (Arthur 2002; Grace 2016 Mixed); and one each from Denmark (Oerkild 2011), Italy (Marchionni 2003), Netherlands (Kraal 2014); Poland (Piotrowicz 2010), China (Wu 2006), Iran (Kassaian 2000), India (Hadadzadeh 2013), Australia (Varnfield 2014), India and Iran (Hadadzadeh 2015). Most studies reported outcomes up to six months post‐randomisation. Only three studies reported longer‐term follow‐up at 14 months (Marchionni 2003), 18 months (Arthur 2002) and 24 months (Jolly 2007). Sixteen studies compared comprehensive programmes (i.e. exercise plus education and/or psychological management) and the remainder reported only an exercise intervention (Aamot 2014 Treadmill; Daskapan 2005; Karapolat 2009; Kassaian 2000; Miller 1984 Brief; Wu 2006). Three studies compared a comprehensive home‐based programme with an exercise‐only centre‐based programme (Hadadzadeh 2013; Hadadzadeh 2015; Kraal 2014). The cardiac rehabilitation programmes differed considerably in duration (range: 1 to 6 months), frequency (1 to 5 sessions per week) and session length (20 minutes to 60 minutes per session). Most programmes used individually tailored exercise prescription which makes it difficult to precisely quantify the amount of exercise undertaken. Centre‐based programmes typically provided supervised cycle and treadmill exercise, while virtually all home programmes were based on walking, with some level of intermittent nurse or exercise specialist telephone support. Two studies used web‐based or smart phone applications to upload recorded exercise data (Kraal 2014) or to monitor health and exercise, and deliver motivational and educational materials (Varnfield 2014). Most studies recruited lower‐risk patients following an acute MI or revascularisation, and excluded those with significant arrhythmias, ischaemia, or heart failure. Four studies included individuals (315 participants) with New York Heart Association (NYHA) class II or III heart failure (Cowie 2012; Daskapan 2005; Karapolat 2009; Piotrowicz 2010).
Most studies reported sources of trial funding; seven did not (Bell 1998; Carlson 2000; Daskapan 2005; Gordon 2002 Community; Kassaian 2000; Sparks 1993; Wu 2006); and two studies are yet to be published (Hadadzadeh 2013; Hadadzadeh 2015). None of the studies reported that they were funded by an agency with a commercial interest in the results of the study.
Marchionni 2003 reported outcomes for home‐ versus centre‐based care according to three patient age subgroups (i.e. 45 to 65, 66 to 75, > 75 years). Given the data reporting, we pooled these data to obtain single overall outcome results for home‐ and centre‐based groups.
For three studies that report more than one comparator, we reported outcome results separately for each comparison. Gordon et al compared two home‐based exercise groups: a physician‐supervised nurse‐case‐managed programme and a community‐based programme (Gordon 2002 Supervised; Gordon 2002 Community, respectively), versus a centre‐based cardiac rehabilitation programme. The study by Miller et al compared home‐ versus centre‐based cardiac rehabilitation programmes that were either 11 weeks long or 26 weeks long (Miller 1984 Brief; Miller 1984 Expanded, respectively). Grace et al compared a home‐based programme with a supervised mixed‐sex and a supervised women‐only programme (Grace 2016 Mixed), and Aamot et al compared a home‐based programme with a supervised group exercise programme and a treadmill exercise programme (Aamot 2014 Treadmill). We used the method for splitting sample size of shared comparator studies in accordance with the Cochrane Handbook for Systematic Reviews of Interventions (chapter 16.5; Higgins 2011).
Details of included studies are listed in Characteristics of included studies.
Excluded studies
We excluded 36 reports (29 studies): 17 studies included a comparator group which did not receive exercise‐based cardiac rehabilitation or did not compare home‐ versus centre‐based cardiac rehabilitation; nine studies included an intervention which was not exercise‐based; two studies were not RCTs and one study included an inappropriate population. Details of excluded studies are listed in Characteristics of excluded studies.
Risk of bias in included studies
A number of study reports did not contain sufficient detail to assess their potential risk of bias (Figure 2; Figure 3).

Methodological quality summary: review authors' judgements about each methodological quality item for each included study
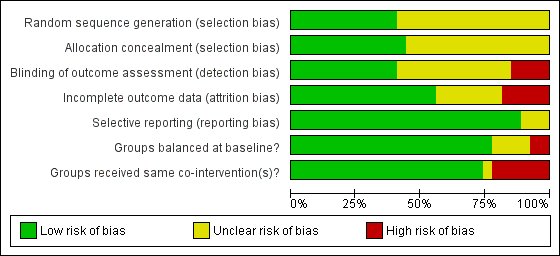
Methodological quality graph: review authors' judgements about each methodological quality item presented as percentages across all included studies
Allocation
Details of generation and concealment of random allocation sequence were particularly poorly reported, with only nine studies adequately describing random sequence generation (Aamot 2014 Treadmill; Aamot 2014 Group; Dalal 2007; Grace 2016 Mixed; Grace 2016 Women; Hadadzadeh 2013; Hadadzadeh 2015; Jolly 2007; Moholdt 2012; Oerkild 2011; Varnfield 2014) and 11 studies adequately reporting random sequence concealment (Arthur 2002; Bell 1998; Cowie 2012; Dalal 2007; Grace 2016 Mixed; Grace 2016 Women; Hadadzadeh 2013; Hadadzadeh 2015; Jolly 2007; Karapolat 2009; Moholdt 2012; Oerkild 2011).
Blinding
Given the nature of these trials, it is not possible to blind participants or carers to group allocation; in such situations, blinding outcome assessors to knowledge of allocation is probably of greater importance. However, only 10 studies stated that they took measures to blind outcome assessment (Arthur 2002; Bell 1998; Cowie 2012; Dalal 2007; Grace 2016 Mixed; Grace 2016 Women; Hadadzadeh 2013; Hadadzadeh 2015; Jolly 2007; Marchionni 2003; Wu 2006).
Incomplete outcome data
Loss to follow‐up varied considerably among studies and was often asymmetric across home‐ and centre‐based cardiac rehabilitation groups. Only a few trials examined the impact of losses to follow‐up or drop out. Five studies were judged to have an unclear risk of attrition bias (Bell 1998; Daskapan 2005; Kassaian 2000; Miller 1984 Brief; Miller 1984 Expanded; Piotrowicz 2010); a further four studies were judged as having a high risk of attrition bias (Carlson 2000; Grace 2016 Mixed; Grace 2016 Women; Kraal 2014; Varnfield 2014).
Selective reporting
We compared the reported outcomes in the results sections to the outcomes described in the methods of the published papers, Most of the included studies fully reported on all the specified outcomes listed in their methods sections; three studies were judged as having an unclear risk of reporting bias (Hadadzadeh 2013; Hadadzadeh 2015; Kassaian 2000). However, the two studies by Hadadzadeh et al have not yet been published and we do not have access to a published protocol or description of the methods, which made reporting bias impossible to assess.
Groups balanced at baseline?
There was generally good evidence of balance in baseline characteristics between groups. However, in two cases there was objective evidence of imbalances in baseline characteristics (Arthur 2002; Cowie 2012), in one study the baseline characteristics were not reported (Miller 1984 Brief) and two additional studies were judged as having unclear risk of bias because they have not yet been published in full and we did not have access to baseline data (Hadadzadeh 2013; Hadadzadeh 2015).
Groups received same co‐interventions?
Most trials were judged to be low risk of bias in terms of whether groups received the same co‐interventions. Because the rehabilitation intervention was usually tailored to the individual participant, it is difficult to quantify the precise level of intervention; however, the intensity of the rehabilitation programme often seemed to differ substantively between home‐ and centre‐based arms. For example, the studies by Bell 1998, Carlson 2000 and Jolly 2007 included hospital cardiac rehabilitation programmes which were fixed in terms of frequency and content over the period of the study. In contrast, the home‐based intervention in these studies consisted of use of the Heart Manual 2016 where the participants could self‐regulate the frequency and nature of rehabilitation sessions they undertook. Kraal 2014 was also judged as having high risk of bias in this domain, as while telephone coaching was offered to the home‐based cohort in this study, no coaching was offered to patients receiving centre‐based cardiac rehabilitation. The study by Kassaian 2000 was judged as having unclear risk of bias because the home‐based programme was not adequately reported, and the two studies by Hadadzadeh et al were judged as unclear risk of bias because the full text was not available (Hadadzadeh 2013; Hadadzadeh 2015).
Effects of interventions
Primary outcomes
Total mortality
Eleven trials (13 comparisons) reported total mortality up to one year following the intervention (Aamot 2014 Treadmill; Aamot 2014 Group; Bell 1998; Dalal 2007; Daskapan 2005; Hadadzadeh 2013; Jolly 2007; Kraal 2014; Miller 1984 Brief; Miller 1984 Expanded; Moholdt 2012; Oerkild 2011; Piotrowicz 2010). A pooled analysis found no evidence of a significant difference in mortality at three to 12 months of follow‐up between home‐ and centre‐based cardiac rehabilitation (RR 1.19, 95% CI 0.65 to 2.16; participants = 1505; studies = 11 (13 comparisons); I² = 0%; fixed‐effect; very low quality evidence; Analysis 1.1). Jolly 2007 reported there to be no between‐group difference in mortality at 24 months follow‐up (home group: 6/263; centre group: 3/262, P = 0.32).
Subgroup analyses
Predictors of treatment effect on total mortality were examined across the longest follow‐up period of each individual study, using univariate meta‐regression. We found no evidence that mortality risk is associated with case mix, type of cardiac rehabilitation, duration of follow‐up, year of publication, study location, study location (continent) or sample size (Table 1). Due to lack of data, we were unable to assess the impact of exercise dose.
| Explanatory variable (n trials) | Exp(slope)* | 95% CI univariate P value | Proportion of variation explained | Interpretation |
| Case mix (% MI patients) (n = 6) | RR = 0.997 | 0.970 to 1.024 P = 0.743 | Not calculable² | No evidence that RR is associated with case mix |
| Dose of exercise (number of weeks of exercise training x average number of sessions/week x average duration of session in min) (n = ) | Not calculable¹ | Not calculable¹ | Not calculable¹ | No evidence that RR is associated with increased dose of exercise |
| Type of cardiac rehabilitation (exercise only versus comprehensive cardiac rehabilitation) (n = 7) | RR = 2.464 | 0.038 to 160.487 P = 0.603 | Not calculable² | No evidence that RR is associated with type of cardiac rehabilitation |
| Duration of follow‐up (months) (n = 7) | RR = 1.022 | 0.872 to 1.198 P = 0.737 | Not calculable² | No evidence that RR is associated with duration of follow‐up |
| Year of publication (n = 7) | RR = 0.988 | 0.851 to 1.147 P = 0.842 | Not calculable² | No evidence that RR is associated with year of publication |
| Risk of bias (low risk in ≥ 4 items versus < 4 items) (n = 7) | RR = 0.902 | 0.197 to 4.127 P = 0.868 | Not calculable² | No evidence that RR is associated with risk of bias |
| Study location (n = 7) | RR = 0.846 | 0.398 to 1.822 P = 0.613 | Not calculable² | No evidence that RR is associated with study location |
| Sample size (n = 7) | RR = 1.001 | 0.995 to 1.006 P = 0.726 | Not calculable² | No evidence that RR is associated with sample size |
¹ Not calculable due to insufficient observations
² Not calculable; Tau² of all studies = 0
Abbreviations: MI, myocardial infarction; RR, risk ratio
Small study bias
There was no evidence of funnel plot asymmetry for total mortality (Egger test P = 0.304; Figure 4).
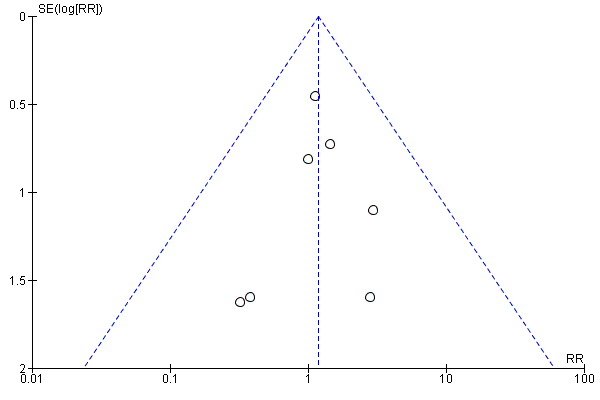
Funnel plot of comparison: 1 home‐base vs centre‐based, outcome: 1.1 Total mortality.
Cardiac events
Only five studies (Arthur 2002; Dalal 2007; Jolly 2007; Oerkild 2011; Piotrowicz 2010) reported cardiac events, including re‐infarction, revascularisation (coronary artery bypass grafting (CABG) and percutaneous coronary intervention (PCI)) or cardiac‐associated hospitalisation. While one study identified in this latest update (Aamot 2014 Treadmill; Aamot 2014 Group) reported that there were "no severe adverse events, defined as cardiac arrests or acute MI", none of the other new studies reported the occurrence of cardiac events. Given the differing nature of the events reported it was not possible to pool the data.
Dalal 2007 and Jolly 2007 reported no difference in revascularisation or recurrent myocardial infarction (MI) events between home‐ and centre‐based cardiac rehabilitation. Piotrowicz 2010 reported no heart failure‐related admissions in either group. Oerkild 2011 stated that “the number and length of acute and non‐acute admissions and adverse events (admission for MI, progressive angina, decompensated congestive heart failure, severe bleeding, new malignant disease and performance of (percutaneous coronary intervention)) to be equally distributed (across groups at 12 months follow‐up)” but did not report numbers of events. The six‐year follow‐up report of the Arthur 2002 study described that a total of 46/79 (62%) centre‐based cardiac rehabilitation patients experienced a hospitalisation compared to 35/70 (50%) in the home‐based group (P = 0.31). However, the total number of hospitalisations in centre‐based patients was greater than that in home‐based participants (79 versus 42, P < 0.0001).
Subgroup analyses
Due to the small number of studies reporting cardiac events, it was not possible to examine the effects of potential treatment effect modifiers on these outcomes.
Small study bias
Due to the small number of studies reporting cardiac events, it was not possible to examine small study bias.
Exercise capacity
With the exception of Hadadzadeh 2013, all included studies reported on exercise or functional capacity in the short‐term (8 weeks to 12 months follow‐up); three (Arthur 2002; Jolly 2007; Marchionni 2003) presented longer‐term data (> 12 months follow‐up) and one reported outcomes at six‐year follow‐up (Arthur 2002). All studies reported absolute exercise capacity at follow‐up, except two trials (3 comparisons; Gordon 2002 Supervised; Gordon 2002 Community; Oerkild 2011) which reported change in exercise capacity at follow‐up compared to baseline. Studies reported exercise capacity using a variety of metrics that included direct measures of oxygen uptake, walking distance and workload on a static cycle.
The pooled analysis showed no evidence of a difference in short‐term exercise capacity between home‐based and centre‐based cardiac rehabilitation (SMD ‐0.13, 95% CI ‐0.28 to 0.02; participants = 2255; studies = 22 (26 comparisons); I² = 63%; random‐effects; low quality evidence; Analysis 1.2).
In a pooled analysis of three studies reporting longer‐term data (> 12 months; Arthur 2002; Jolly 2007; Marchionni 2003), there was no evidence of a difference in exercise capacity following home‐based cardiac rehabilitation compared with centre‐based cardiac rehabilitation (SMD 0.11, 95% CI ‐0.01 to 0.23; participants = 1074; studies = 3; I² = 0%; fixed effect; moderate quality evidence; Analysis 1.3). Arthur 2002 reported that mean peak oxygen consumption (VO₂) at six‐year follow‐up was higher in the 96 participants who had undergone home‐based cardiac rehabilitation (1543 mL/min (SD 444)) compared to the 74 participants who had received centre‐based cardiac rehabilitation (1412 mL/min (SD 356); P = 0.01).
Subgroup analyses
Predictors of treatment effect on exercise capacity were examined across the longest follow‐up of each individual study, using univariate meta‐regression. We found no evidence that exercise capacity is associated with case mix, dose of exercise, type of cardiac rehabilitation, duration of follow‐up, year of publication, study location, study location (continent) or sample size (Table 2).
| Explanatory variable (n trials) | Exp(slope)* | 95% CI Univariate P value | Proportion of variation explained | Interpretation |
| Case mix (% MI patients) (n = 23) | RR = 0.003 | ‐0.001 to 0.008 P = 0.119 | 11.69% | No evidence that RR is associated with case mix |
| Dose of exercise (number of weeks of exercise training x average number of | RR = ‐0.001 | ‐0.003 to 0.001 P = 0.245 | Not calculable¹ | No evidence that RR is associated with increased dose of exercise |
| Type of cardiac rehabilitation (exercise only versus comprehensive | RR = 0.210 | ‐0.026 to 0.447 P = 0.079 | 18.73% | No evidence that RR is associated with type of cardiac rehabilitation |
| Duration of follow‐up (months) (n = 25) | RR = 0.003 | ‐0.007 to 0.013 P = 0.544 | ‐5.17% | No evidence that RR is associated with duration of follow‐up |
| Year of publication (n = 25) | RR = ‐0.002 | ‐0.024 to 0.020 P = 0.841 | ‐5.52% | No evidence that RR is associated with year of publication |
| Risk of bias (low risk in ≥ 4 items versus < 4 items) (n = 25) | RR = 0.097 | ‐0.118 to 0.311 P = 0.360 | 2.94% | No evidence that RR is associated with risk of bias |
| Study location (n = 26) | RR = 0.195 | ‐0.033 to 0.423 P = 0.090 | 15.80% | No evidence that risk ratio is associated with study location |
| Sample size (n = 25) | RR = 0.000 | ‐0.001 to 0.002 P = 0.837 | ‐7.78% | No evidence that RR is associated with sample size |
¹ Not calculable; Tau² of all studies = 0
Abbreviations: MI, myocardial infarction; RR, risk ratio
Small study bias
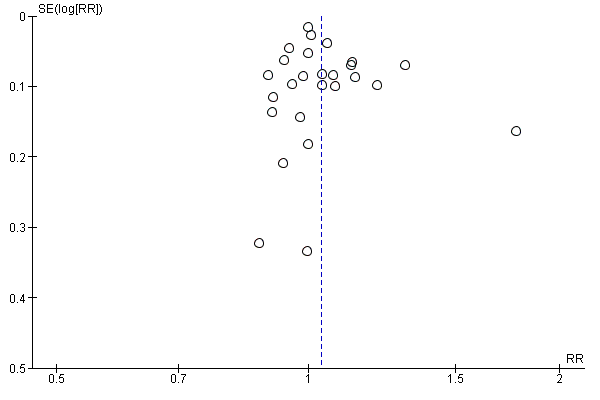
There was no evidence of funnel plot asymmetry for exercise capacity (Egger test P = 0.661; Figure 5).

Funnel plot of comparison: 1 home‐base vs centre‐based, outcome: 1.2 Exercise capacity ≤ 12 months.
Health‐related quality of life (HRQoL)
Fourteen of the trials reported validated measures of HRQoL (Table 3). These included four generic HRQoL instruments: EQ‐5D (EuroQoL 1990), Nottingham Health Profile (Hunt 1980), Short‐Form 36 (SF‐36; McHorney 1993), Sickness Impact Profile (Bergner 1976) and two disease‐specific instruments (MacNew; Höfer 2004) and the Minnesota Living With Heart Failure Questionnaire (MLWHF; Rector 1993). This wide variation in HRQoL outcomes meant that pooling across studies was inappropriate.
| Study ID | Follow up | HRQoL measure | Outcome values at follow up Mean (SD or range) Home‐ versus centre‐based, between group P value | Between‐group difference |
| Home versus treadmill group | 12 weeks | MacNew Emotional domain Social domain Physical domain Global | 6.1 (3.9–6.7) versus 6.0 (4.8–6.5) ns 6.8 (4.9–7.0) versus 6.7 (5.6–6.9) ns 6.4 (4.9–6.9) versus 6.6 (5.4–6.9) ns 6.4 (4.7–6.8) versus 6.3 (5.2–6.7) ns | Home = Centre Home = Centre Home = Centre Home = Centre |
| Home versus group exercise | 12 weeks | MacNew Emotional domain Social domain Physical domain Global | 6.1 (3.9–6.7) versus 6.2 (3.6–6.9) ns 6.8 (4.9–7.0) versus 6.5 (5.0–7.0) ns 6.4 (4.9–6.9) versus 6.4 (5.2–7.0) ns 6.4 (4.7–6.8) versus 6.3 (4.5–6.7) ns | Home = Centre Home = Centre Home = Centre Home = Centre |
| /Smith 2004 | 6 months 18 months | SF‐36 PCS MCS SF‐36 PCS MCS | 51.2 (6.4) versus 48.6 (7.1) P = 0.003* 53.5 (6.4 ) versus 52.0 (8.1) P = 0.13* 48.3 (11.7) versus 47.6 (11.7) P = 0.67* 53.0 (10.9) versus 50.2 (10.9) P = 0.07* | Home > Centre Home = Centre Home = Centre Home = Centre |
| 10.5 months | Nottingham Health Profile Energy Pain Emotional reactions Sleep Social isolation Physical mobility | 18.6 (28.4) versus 17.3 (30.7) P = 0.78* 6.6 (15.3) versus 7.4 (15.5) P = 0.74* 6.6 (15.3) versus 7.4 (15.5) P = 0.74* 6.6 (15.3) versus 16.9 (22.8) P = 0.0007* 3.7 (13.6) versus 6.7 (15.0) P = 0.18* 6.9 (13.5) versus 9.1 (15.9) P =0.33* | Home = Centre Home = Centre Home = Centre Home < Centre Home = Centre Home = Centre | |
| 3 months | SF‐36 PCS MCS MLWHF total Physical Emotional | 34.01 (11.04) versus 31.33 (7.97) P = 0.82 44.44 (12.23) versus 48.25 (11.21) P = 0.04 37 (NR) vs 32 (NR) P = 0.18 21 (NR) vs 19 (NR) P = 0.31 7 (NR) vs 7 (NR) P = 0.13 | Home = Centre Home < Centre Home = Centre Home = Centre | |
| 2 months 8 months 14 months | Sickness Impact Profile | 2.83 (14.5) versus 4.71 (11.1) P = 0.09* 2.83 (14.5) versus 3.40 (11.1) P = 0.61* 2.00 (8.3) versus 3.70 (11.8) P = 0.06* | Home = Centre Home = Centre Home = Centre | |
| Dalal 2007/Taylor 2007 | 9 months | MacNew Global score EQ‐5D | 5.61 (1.14) versus 5.54 (1.10) P = 0.71 0.74 (0.04) versus 0.78 (0.04) P = 0.57 | Home = Centre Home = Centre |
| 12 week | SF 36 Physical Composite Score Mental Composite Score | 51.6 (4.7) versus 52.2 (4.7) P = 0.94 46.4 (4.9) versus 47.6 (6.4) P = 0.10 | Home = Centre Home = Centre | |
| 6 months 12 months 24 months | EQ‐5D SF‐12 PCS MCS EQ‐5D | 0.74 (0.26) versus 0.76 (0.23) P = 0.37 42.28 (10.9) 42.56 (10.8) P = 0.8 49.19 (10.1) 50.33 (9.6) P = 0.3 0.74 (0.27) versus 0.76 (0.23) P = 0.52* 0.73 (0.29) versus 0.75 (0.26) P = 0.39* | Home = Centre Home = Centre Home = Centre Home = Centre Home = Centre | |
| 8 weeks | SF‐36 Physical function Physical role Bodily pain General health Social function Emotional role Mental health | 59.39 (25.35) versus 69.57 (20.94),P = 0.08* 39.81 (41.75) versus 48.21 (45.10) P = 0.43* 62.42 (30.45) versus 74.23 (19.66) P = 0.07* 47.25 (23.42) versus 53.98 (25.00) P =0.33* 66.67 (19.82) versus 69.81 (17.41) P = 0.49* 65.33 (25.60) versus 69.33 (25.14) P = 0.52* 44.74 (39.77) versus 37.16 (39.24) P =0.44* 64.67 (19.04) versus 70.52 (20.37) P = 0.22* | Home = Centre Home = Centre Home = Centre Home = Centre Home = Centre Home = Centre Home = Centre | |
| 12 weeks | MacNew (Dutch translation) Physical scale Emotional scale Social scale Total score | 6.1 (0.6) versus 5.7 (0.8) P = 0.16 5.9 (0.8) versus 5.6 (0.9) P = 0.88 6.4 (0.6) versus 6.1 (0.7) P = 0.26 6.1 (0.5) versus 5.8 (0.7) P = 0.50 | Home = Centre Home = Centre Home = Centre Home = Centre | |
| 6 months | MacNew Emotional domain Physical domain Social domain | 1.2 (0.2) versus 1.4 (0.2) P > 0.05 1.4 (0.7) versus 1.6 (1.1) P > 0.05 4.3 (0.7) versus 4.3 (1.0) P > 0.05 | Home = Centre Home = Centre Home = Centre | |
| 3 months 6 months | SF‐36 PCS SF‐36 MCS SF‐36 PCS SF‐36 MCS | 1.4 (‐1.5 to 4.3) versus 0.5 (‐2.4 to 3.4) P > 0.05 0.8 (‐2.6 to 4.3) versus ‐0.2 (‐3.6 to 3.4) P > 0.05 1.0 (‐1.6 to 3.6) versus 1.2 (‐1.4 to 3.8) P > 0.05 2.3 (‐1.1 to 5.7) versus 2.6 (‐0.9 to ‐6.0) P > 0.05 | Home = Centre Home = Centre Home = Centre Home = Centre | |
| Piotrowicz 2014 | 8 weeks | SF‐36 Physical function Role limitation caused by physical problems Bodily pain General health Physical component summary Social function Mental health Role limitation caused by physical problems Vitality Mental component summary Total quality of life index | 21.60 (9.65) versus 23.20 (10.71) ns 12.74 (7.17) versus 11.39 (8.43) ns 2.66 (2.22) versus 2.00 (2.07) ns 13.14 (3.80) versus 14.59 (4.03) P < 0.05 50.27 (17.06) versus 51.37 (19.60) ns 2.64 (2.84) versus 1.63 (1.54) P < 0.05 7.15 (4.00) versus 5.89 (3.58) ns 4.93 (6.15) versus 4.35 (6.07) ns 7.25 (3.78) versus 6.76 (3.17) ns 21.68 (12.46) versus 18.56 (9.18) ns 70.50 (25.40) versus 69.20 (26.40) ns | Home = Centre Home = Centre Home = Centre Home < Centre Home = Centre Home > Centre Home = Centre Home = Centre Home = Centre Home = Centre Home = Centre |
| 6 weeks 6 months | EQ5D‐Index | 0.92 (0.9–1.0) versus 0.82 (0.7–0.9) "The HRQoL (EQ5D‐Index) improved significantly in 0.85 (0.1) versus 0.86 (0.2) "Between‐group difference for changes in EQ5D‐Index was | Home > Centre Home = Centre |
*P value calculated by authors of this report based on independent 2‐group t‐test
Home = Centre: no statistically significant difference (P > 0.05) in HRQoL between home and centre‐based groups at follow up
Home > Centre: statistically significant (P ≤ 0.05) higher HRQoL in home versus centre‐based groups at follow up
Home < Centre: statistically significant (P ≤ 0.05) lower HRQoL in home versus centre‐based groups at follow up
Abbreviations: HRQoL = health related quality of life; MCS: mental component score; MLWHF: Minnesota Living With Heart Failure; PCS: physical component score; SF‐12: 12‐Item Short Form Health Survey; SF‐36: Short Form (36) Health Survey
Taking individual findings of all studies into account, there was no strong evidence of a difference in overall HRQoL outcomes or domain scores at follow‐up between home‐ and centre‐based cardiac rehabilitation.
Individual studies reported consistent improvements in HRQoL at follow‐up with both home‐ and centre‐based cardiac rehabilitation compared to baseline. The notable exception was in two of the three studies which used the EQ‐5D and failed to identify significant improvements with home‐ or centre‐based cardiac rehabilitation (Dalal 2007; Jolly 2007). The third study which used the EQ‐5D reported a significant improvement at six weeks follow‐up for home‐based cardiac rehabilitation, but not for centre‐based cardiac rehabilitation, and reported no improvements in HRQoL at six months follow‐up (Varnfield 2014).
Withdrawal from the intervention programme
Withdrawal from the intervention was inconsistently reported and the reasons were often unclear. Using the number of completers i.e. the number of participants with outcome data at follow‐up, we found some limited evidence of a small increase in the level of completion with home‐based compared with centre‐based programmes (RR 1.04, 95% CI 1.00 to 1.08; participants = 2615; studies = 22 (26 comparisons); I² = 53%; random‐effects; low quality evidence; Analysis 1.4).
Subgroup analyses
Predictors of withdrawal were examined across the longest follow‐up period of each individual study using univariate meta‐regression. We found no evidence that withdrawal risk is associated with case mix, dose of exercise, type of cardiac rehabilitation, duration of follow‐up, year of publication, study location, study location (continent), or sample size (Table 4).
| Explanatory variable (n trials) | Exp(slope)* | 95% CI univariate P value | Proportion of variation explained | Interpretation |
| Case mix (% MI patients) (n = 21) | RR = 1.000 | 0.999 to 1.002 P = 0.949 | ‐15.22% | No evidence that RR is associated with case mix |
| Dose of exercise (number of weeks of exercise training x average number of sessions/week x average duration of session in min) (n = 10) | RR = 0.999 | 0.998 to 1.000 P = 0.217 | 16.94% | No evidence that RR is associated with increased dose of exercise |
| Type of cardiac rehabilitation (exercise only versus comprehensive cardiac rehabilitation) (n = 24) | RR = 1.041 | 0.975 to 1.111 P = 0.219 | ‐1.56% | No evidence that RR is associated with type of cardiac rehabilitation |
| Duration of follow‐up (months) (n = 23) | RR = 1.000 | 0.997 to 1.003 P = 0.940 | ‐21.09% | No evidence that RR is associated with duration of follow‐up |
| Year of publication (n = 23) | RR = 1.000 | 0.992 to 1.007 P = 0.930 | ‐12.08% | No evidence that RR is associated with year of publication |
| Risk of bias (low risk in ≥ 4 items versus < 4 items) (n = 23) | RR = 0.949 | 0.880 to 1.023 P =0.160 | 32.50% | No evidence that RR is associated with risk of bias |
| Study location (n = 24) | RR = 0.988 | 0.912 to 1.069 P = 0.747 | ‐21.54% | No evidence that RR is associated with study location |
| Sample size (n = 23) | RR = 1.000 | 1.000 to 1.000 P = 0.880 | ‐20.04% | No evidence that RR is associated with sample size |
Abbreviations: MI: myocardial infarction; RR: risk ratio
Small study bias
There was no evidence of funnel plot asymmetry for withdrawal (Egger test P = 0.440; Figure 6).
Funnel plot of comparison: 1 home‐base vs centre‐based, outcome: 1.4 Completers.
Secondary outcomes
Modifiable coronary risk factors
Blood lipids
Nine of the included trials (10 comparisons) reported data on blood lipids (Bell 1998; Carlson 2000; Dalal 2007; Gordon 2002 Community; Gordon 2002 Supervised; Jolly 2007; Kassaian 2000; Moholdt 2012; Oerkild 2011; Varnfield 2014). All reported total cholesterol values, seven studies (8 comparisons) reported high density lipoprotein concentrations (Carlson 2000; Gordon 2002 Community; Gordon 2002 Supervised; Jolly 2007; Kassaian 2000; Moholdt 2012; Oerkild 2011; Varnfield 2014), and five studies (6 comparisons) reported low density lipoprotein and triglyceride concentrations (Carlson 2000; Gordon 2002 Community; Gordon 2002 Supervised; Kassaian 2000; Oerkild 2011; Varnfield 2014). All reported absolute follow‐up data except two studies (3 comparisons) where data were reported as the change at follow up from baseline (Gordon 2002 Community; Gordon 2002 Supervised; Oerkild 2011). Study results were expressed as millimols per litre (mmol/L; Bell 1998; Dalal 2007; Jolly 2007) or milligrams per decilitre (mg/dL; Carlson 2000; Gordon 2002 Community; Gordon 2002 Supervised; Kassaian 2000); in the latter case we converted values into mmol/L before pooling for meta‐analysis.
Total cholesterol
The pooled analysis of data at three to 12 months of follow‐up revealed no evidence of a difference in the total cholesterol between home‐ and centre‐based groups (MD 0.06, 95% CI ‐0.10 to 0.23; participants = 1151; studies = 9, comparisons = 10; I² = 57%; random‐effects; Analysis 1.5).
Jolly 2007 reported no significant difference between home‐ and centre‐based cardiac rehabilitation groups in total cholesterol concentration at 24 months follow up (MD = ‐0.11 mmol/L, 95% CI 0.06 to ‐0.28).
Subgroup analyses
Predictors of total cholesterol were examined across the longest follow‐up period of each individual study using univariate meta‐regression. We found no evidence that the cardiac rehabilitation effect on cholesterol is associated with type of cardiac rehabilitation, duration of follow‐up, year of publication, study location, study location (continent) or sample size (Table 5). However, we found evidence of a relationship between case mix and total cholesterol, with a greater reduction in total cholesterol reported in studies with a higher proportion of participants with MI (Table 5). Due to lack of data, we were unable to assess the impact of exercise dose.
| Explanatory variable (n trials) | Exp(slope)* | 95% CI univariate P value | Proportion of variation explained | Interpretation |
| Case mix (% MI patients) (n = 10) | RR = ‐0.007 | ‐0.011 to ‐0.002 P = 0.014 | 88.71% | Evidence that RR is associated with case mix |
| Dose of exercise (number of weeks of exercise training x average number of sessions/week x average duration of session in min) (n = ) | Not calculable¹ | Not calculable¹ | Not calculable¹ | No evidence that RR is associated with increased dose of exercise |
| Type of cardiac rehabilitation (exercise only vs comprehensive cardiac rehabilitation) (n = 10) | RR = ‐0.127 | ‐0.822 to 0.567 P = 0.684 | ‐17.11% | No evidence that RR is associated with type of cardiac rehabilitation |
| Duration of follow‐up (months) (n = 10) | RR = ‐0.007 | ‐0.038 to 0.024 P = 0.594 | ‐21.27% | No evidence that RR is associated with duration of follow‐up |
| Year of publication (n = 10) | RR = 0.027 | ‐0.012 to 0.066 P = 0.154 | 31.00% | No evidence that RR is associated with year of publication |
| Risk of bias (low risk in ≥ 4 items versus < 4 items) (n = 10) | RR = ‐0.077 | ‐0.404 to 0.249 P = 0.600 | ‐14.59% | No evidence that RR is associated with risk of bias |
| Study location (n = 10) | RR =0.015 | ‐0.304 to 0.333 P = 0.919 | ‐18.83% | No evidence that RR is associated with study location |
| Sample size (n = 10) | RR = ‐0.001 | ‐0.002 to 0.001 P = 0.347 | ‐7.77% | No evidence that RR is associated with sample size |
¹Not calculable due to insufficient observations
Abbreviations: MI: myocardial infarction; RR: risk ratio
Small study bias
There was no evidence of funnel plot asymmetry for total cholesterol (Egger test P = 0.913; Figure 7).
Funnel plot of comparison: 1 home‐base vs centre‐based, outcome: 1.5 Total cholesterol 3 to 12 months.
High density lipoprotein (HDL) cholesterol
The pooled analysis of data at 3 to 12 months of follow up revealed some evidence of a lower high density lipoprotein concentration after centre‐ compared to home‐based cardiac rehabilitation (MD ‐0.07, 95% CI ‐0.11 to ‐0.03; participants = 925; studies = 7; comparisons = 8; I² = 35%; fixed‐effects; Analysis 1.6).
Jolly 2007 reported no significant difference between home‐ and centre‐based cardiac rehabilitation groups in high density lipoprotein level at 24 months follow‐up (MD = 0.03 mmol/L, 95% CI ‐0.10 to 0.04).
Low density lipoprotein (LDL) cholesterol
In the pooled analysis of data at 3 to 12 months of follow up there was no evidence of a difference in low density lipoprotein concentration between home‐ and centre‐based cardiac rehabilitation (MD 0.04, 95% CI ‐0.14 to 0.22; participants = 430; studies = 5 comparisons = 6; I² = 54%; random‐effects; Analysis 1.7).
Triglycerides
In the pooled analysis of data at 3 to 12 months of follow up there was evidence of slightly lower triglyceride levels in centre‐based cardiac rehabilitation participants (MD 0.15, 95% CI 0.00 to 0.29; participants = 396; studies = 5, comparisons = 6 ; I² = 39%; fixed‐effect; Analysis 1.8).
Subgroup analyses
Due to the small number of studies reporting blood lipid levels, it was not possible to examine the effects of potential treatment effect modifiers on these outcomes.
Small study bias
Due to the small number of studies reporting blood lipid levels, it was not possible to examine small study bias in these outcomes.
Blood pressure
Ten and nine of the included trials (12 and 11 comparisons) reported on systolic and diastolic blood pressure respectively (Aamot 2014 Treadmill; Aamot 2014 Group; Carlson 2000; Dalal 2007; Daskapan 2005; Gordon 2002 Community; Gordon 2002 Supervised; Jolly 2007; Kassaian 2000; Oerkild 2011; Varnfield 2014) or systolic blood pressure alone (Bell 1998). Absolute values at follow‐up were reported in all but two studies (3 comparisons; Gordon 2002 Supervised; Gordon 2002 Community; Oerkild 2011) where the change from baseline was reported. We obtained unpublished data for the study by Dalal et al (Dalal 2007).
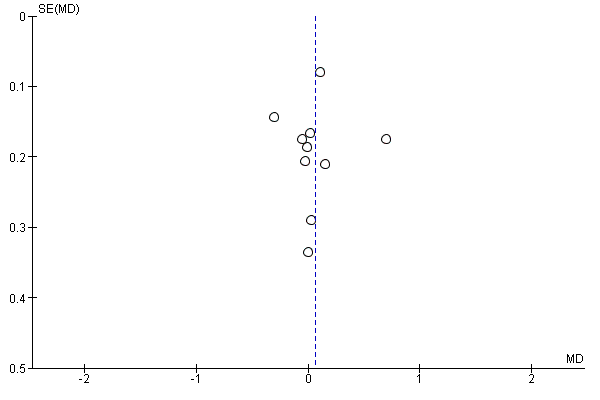
No evidence of a difference was found at follow‐up between groups in either pooled systolic blood pressure (MD ‐0.27, 95% CI ‐3.13 to 2.60; participants = 1292; studies = 10, comparisons = 12; I² = 55%; random‐effects; Analysis 1.9) or diastolic blood pressure (MD 0.74, 95% CI ‐1.04 to 2.53; participants = 1146; studies = 9, comparisons = 11; I² = 60%; random‐effects; Analysis 1.10) following home‐ or centre‐based cardiac rehabilitation. At 24 months follow up, Jolly 2007 reported no significant difference between home‐ and centre‐based cardiac rehabilitation groups in systolic blood pressure (MD = ‐0.85 mm Hg; 95% CI 2.48 to ‐4.18) or diastolic blood pressure (MD = ‐0.76 mm Hg, 95% CI 1.12 to ‐2.64).
Subgroup analyses
Predictors of blood pressure were examined across the longest follow‐up period of each individual study using univariate meta‐regression. No statistically significant associations were seen in any of the analyses for systolic blood pressure with the exception of study location (Table 6). No statistically significant associations were seen in any of the analyses for diastolic blood pressure (Table 7).
| Explanatory variable (n trials) | Exp(slope)* | 95% CI univariate P value | Proportion of variation explained | Interpretation |
| Case mix (% MI patients) (n = 11) | RR = 0.026 | ‐0.095 to 0.146 P = 0.642 | ‐8.81% | No evidence that RR is associated with case mix |
| Dose of exercise (number of weeks of exercise training x average number of sessions/week x average duration of session in min) (n = 4) | RR = 0.001 | ‐0.110 to 0.112 P = 0.971 | Not calculable¹ | No evidence that RR is associated with increased dose of exercise |
| Type of cardiac rehabilitation (exercise only versus comprehensive cardiac rehabilitation) (n = 12) | RR = 5.021 | ‐0.929 to 10.971 P =0.089 | 51.60% | No evidence that RR is associated with type of cardiac rehabilitation |
| Duration of follow‐up (months) (n = 12) | RR = ‐0.053 | ‐0.540 to 0.435 P = 0.815 | ‐22.77% | No evidence that RR is associated with duration of follow‐up |
| Year of publication (n = 12) | RR = ‐0.008 | ‐0.607 to 0.591 P =0.976 | ‐15.85% | No evidence that RR is associated with year of publication |
| Risk of bias (low risk in ≥ 4 items versus < 4 items) (n = 12) | RR = 2.325 | ‐1.376 to 6.026 P =0.192 | 37.06% | No evidence that RR is associated with risk of bias |
| Study location (n = 12) | RR = 4.053 | 0.696 to 7.410 P = 0.023 | 71.21% | Evidence that RR is associated with study location |
| Sample size (n = 12) | RR = ‐0.005 | ‐0.029 to 0.018 P = 0.623 | ‐18.75% | No evidence that RR is associated with sample size |
¹Not calculable; Tau² of all studies = 0
Abbreviations: MI: myocardial infarction; RR: risk ratio
| Explanatory variable (n trials) | Exp(slope)* | 95% CI univariate P value | Proportion of variation explained | Interpretation |
| Case mix (% MI patients) (n = 10) | RR = 0.025 | ‐0.069 to 0.119 P = 0.561 | ‐11.53% | No evidence that risk RR is associated with case mix |
| Dose of exercise (number of weeks of exercise training x average number of sessions/week x average duration of session in min) (n = 4) | RR = ‐0.017 | ‐0.085 to 0.051 P = 0.391 | Not calculable¹ | No evidence that RR is associated with increased dose of exercise |
| Type of cardiac rehabilitation (exercise only versus comprehensive cardiac rehabilitation) (n = 11) | RR = 0.125 | ‐4.719 to 4.970 P = 0.955 | ‐20.57% | No evidence that RR is associated with type of cardiac rehabilitation |
| Duration of follow‐up (months) (n = 11) | RR = ‐0.051 | ‐0.377 to 0.276 P = 0.734 | ‐32.23% | No evidence that RR is associated with duration of follow‐up |
| Year of publication (n = 11) | RR = 0.234 | ‐0.144 to 0.613 P = 0.195 | 40.22% | No evidence that RR is associated with year of publication |
| Risk of bias (low risk in ≥ 4 items versus < 4 items) (n = 11) | RR = 0.761 | ‐2.082 to 3.605 P = 0.560 | 0.88% | No evidence that RR is associated with risk of bias |
| Study location (n = 11) | RR = ‐0.034 | ‐3.196 to 3.128 P = 0.981 | ‐25.38% | No evidence that RR is associated with study location |
| Sample size (n = 11) | RR = ‐0.001 | ‐0.017 to 0.015 P = 0.907 | ‐30.17% | No evidence that risk ratio is associated with sample size |
¹Not calculable; Tau² of all studies = 0
Abbreviations: MI: myocardial infarction; RR: risk ratio
Small study bias
There was no evidence of funnel plot asymmetry for systolic blood pressure (Egger test P = 0.066; Figure 8) or diastolic blood pressure (Egger test P = 0.318; Figure 8).
Funnel plot of comparison: 1 home‐base vs centre‐based, outcome: 1.9 Systolic blood pressure 3 to 12 months.
Smoking behaviour
Five studies (6 comparisons) reported on participants' self‐reported smoking behaviour at three to 12 months of follow up (Bell 1998; Dalal 2007; Gordon 2002 Community; Gordon 2002 Supervised; Jolly 2007; Oerkild 2011). There was no evidence indicating a difference in the proportion of smokers at follow up between home‐ and centre‐based cardiac rehabilitation (RR 0.1.02, 95% CI 0.83 to 1.27; participants = 986; studies = 5, comparisons = 6; I² = 0%; fixed‐effect; Analysis 1.11). Jolly 2007 reported no difference in smoking between home‐ and centre‐based arms at 24 months (RR = 1.16, 95% CI 0.58 to 33.3).
There was evidence of a consistent reduction in self‐reported smoking behaviour following both home‐ and centre‐based cardiac rehabilitation. This finding was confirmed in the one study that used cotinine‐validated assessments of smoking (Jolly 2007).
Subgroup analyses
Due to the small number of studies reporting smoking, it was not possible to examine the effects of potential treatment effect modifiers on these outcomes.
Small study bias
Due to the small number of studies reporting smoking behaviour, it was not possible to examine small study bias.
Adherence
All but six studies (Bell 1998; Daskapan 2005; Hadadzadeh 2013; Hadadzadeh 2015; Kassaian 2000; Wu 2006) reported adherence to cardiac rehabilitation over the duration of the study (Table 8). There was substantial variation in the way in which adherence was defined and measured, and some studies reported more than one measure of adherence. Pooling across studies was therefore deemed to be inappropriate. Eight studies (11 comparisons: Carlson 2000; Cowie 2012; Dalal 2007; Gordon 2002 Community; Gordon 2002 Supervised; Grace 2016 Mixed; Grace 2016 Women; Jolly 2007; Karapolat 2009; Miller 1984 Brief; Miller 1984 Expanded) found no evidence of a significant difference in the level of adherence between groups, although there was evidence of superior adherence in home‐based cardiac rehabilitation in five studies (Arthur 2002; Kraal 2014; Marchionni 2003; Piotrowicz 2010; Varnfield 2014) and evidence of superior adherence in centre‐based cardiac rehabilitation in one study (Aamot 2014 Treadmill). Three other studies reported adherence (Daskapan 2005; Moholdt 2012; Sparks 1993) but it was not possible to assess if there was a statistically significant difference between home‐ and centre‐based cardiac rehabilitation.
| Trial | Follow‐up | Method/definition of adherence assessment | Findings | Between‐group difference |
| Home versus treadmill group | 12 weeks | Completion of 70% of the exercise sessions (considered to be training per protocol). Median (range) number of exercise sessions completed | Home: 24/28 (86%) versus centre: 34/34 (100%) P = 0.04 Home: 24 (10–24) versus centre: 24 (7–24) | Home < Centre |
| Home versus group exercise | 12 weeks | Completion of 70% of the exercise sessions (considered to be training per protocol). Median (range) number of exercise sessions completed | Home: 24/28 (86%) versus centre: 28/28 (100%) P = 0.04 Home: 24 (10–24) versus centre: 23 (17–24) | Home < Centre |
| /Smith 2004 | 6 months 18 months | Number of exercise session reported/week Percentage of patients seeking dietician consultation Percentage of patients seeking psychologist consultation Level of physical activity – Physical Activity Scale for the Elderly | Home: mean 6.5 (SD 4.6) Centre: mean 3.7 (SD 2.6) P < 0.0001† Home 50% (mean 3.5, SD 2.5 visits) Centre: 53% (mean 3.6, SD 2.3 visits) Home: 42% (mean 2.6, SD 2.4 visits) Centre: 51% (mean 2.5, SD 2.2 visits) Home: mean 232.6 (SD 99.4) Centre: mean 170.0 (SD 89.2) P < 0.0001† | Home > Centre ? Home = Centre** Home > Centre |
| 6 months | Attendance at all 3 nutrition/risk factor classes Total exercise over follow up – number of sessions ≥ 30 min | Home: 27/38 (71%) Centre: 33/42 (79%) P = 0.438* Home: mean 111.8 (SD 29.1) Centre: mean 98.1 (SD 33.4) P = 0.06† | Home = Centre Home = Centre | |
| 3 months | Percentage completion of 16 exercise sessions | Home: 77% Centre: 86% P = 0.32 | Home = Centre | |
| 9 months | Number who participated in intervention | Home: 40/60 (67%) Centre: 32/44 (72%) P = 0.51* | Home = Centre | |
| 3 months | Percentage of sessions attended | Home: 97% Centre: 81% P value not calculable | ? | |
| 3 months | Percentage of completed scheduled appointments (exercise sessions, office/on site visits, “telephone visits” in accordance with intervention protocol) | Home (MD supervised): 83% Home (community‐based): 86% Centre: 81% | Home = Centre** | |
| Grace 2016 Mixed Home versus mixed sex training | 6 months | Percentage of cardiac rehabilitation sessions attended | Home: 58.12% (SD 34.68) Centre: 51.33% (SD 35.75) P = 0.63 | Home = Centre |
| Grace 2016 Mixed Home versus women only training | 6 months | Percentage of cardiac rehabilitation sessions attended | Home: 58.12% (SD 34.68) Centre: 54.4% (SD 34.72) P = 0.63 | Home = Centre |
| 3 months 6 months 12 months 24 months | Hours of self‐reported activity weighted for intensity | Home: mean 23.2 (SD 22.1) Centre: mean 18.7 (SD 19.3) P = 0.06† Home: mean 16.4 (SD 17.0) Centre: mean 18.1 (SD 25.4) P = 0.4† Home: mean 19.2 (SD 20.8) Centre: mean 15.9 (SD 16.7) P = 0.06† Home: mean 18.9 (SD 18.4) Centre: mean 16.6 (SD 16.4) P = 0.16† | Home = Centre Home = Centre Home = Centre Home = Centre | |
| 8 weeks | Attendance at exercise sessions | Home: (32/37) 87.5% Centre: (33/37) 90% P = 0.72* | Home = Centre | |
| 12 weeks | Number of sessions attended | Home: Mean = 24 (100 %; SD 7.2; range: 13 to 41) Centre: Mean = 20.5 (86%; SD 4.5 range: 6 to 25) P = 0.049 | Home > Centre | |
| 4 months | Number of exercise sessions completed | Home: 37.3 (SD 3.4) Centre: 34.3 (SD 4.4) P < 0.0001† | Home > Centre | |
| DeBusk 1985/ Taylor 1986 | 6 months | Ratio of exercise sessions completed versus prescribed | Home: 50/70 (72%) Centre: 28/40 (71%) P value not calculable | Home = Centre** |
| 6 months | Training diaries (only reported for home group) | Home: 7/10 patients (with complete diary data) reported ≥2 weekly interval sessions over 6 months follow up | ? | |
| 8 weeks | Percentage of patients who carried out the prescribed exercise training (home group: daily telephone contacts with monitoring centre; centre group: attendance at supervised sessions) | Home: 77/77 (100%) Centre: 59/75 (79%) P < 0.0001† | Home > Centre | |
| 3 months | Percentage of cardiac rehabilitation sessions attended | Home: 93% Centre: 88% P value not calculable | ? | |
| 6 weeks | "Attended baseline assessment and at least 4 weeks (8 of 12 sessions) of centre‐based gym sessions/uploaded exercise data to web portal for a minimum of 4 weeks" | Home: 45/48 (94%) Centre: 25/37 (68%) P < 0.005 | Home > Centre |
*calculated by authors of this report based on Chi² test †calculated by authors of this report based on independent t‐test
Home = Centre: no statistically significant difference (P > 0.05) in health‐related quality of life (HRQoL) between home‐ and centre‐based groups at follow up
Home > Centre: statistically significant (P ≤ 0.05) higher HRQoL in home‐ versus centre‐based groups at follow up
Home < Centre: statistically significant (P ≤ 0.05) lower HRQoL in home‐ versus centre‐based groups at follow up
**Home‐ and centre‐based groups at follow up appear to be similar but P value not reported or calculable
? Home‐ and centre‐based groups at follow up appear different but P value not reported or calculable
Costs and health service use
Six studies reported costs (Carlson 2000; Cowie 2012; Dalal 2007; Jolly 2007; Marchionni 2003; Varnfield 2014; Table 9). Differences in currencies and timing of studies meant that it was not possible compare the costs directly across studies. In four of the five studies, healthcare costs associated with cardiac rehabilitation were lower for the home‐based than centre‐based programmes (Carlson 2000; Dalal 2007; Marchionni 2003; Varnfield 2014), although cost was significantly lower in only one study (Dalal 2007). Jolly 2007 found that home‐based cardiac rehabilitation was more expensive than centre‐based cardiac rehabilitation, although the costs of the two would have been the same if participant costs were included. One study (Cowie 2012) included the costs of a no cardiac rehabilitation control and showed that cardiac rehabilitation costs were offset by a reduction in hospital admissions over five years resulting in a substantive cost saving when compared with control, i.e. GBP ‐3304 per participant for home‐based cardiac rehabilitation and GBP ‐3784 per participant for hospital‐based cardiac rehabilitation. Eight studies reported different aspects of consumption of healthcare resources, including re‐admissions to hospital, primary care consultations and use of secondary care medication (Table 10; Table 11). No significant between‐group differences were seen.
| Study | CurrencyYear of costsFollow up | Cardiac rehabilitation programme cost(per patient) | Programme costs considered | Total healthcare cost(per patient) | Additional healthcare costs considered | Comments |
| USD Not reported 6 months | Home: mean USD 1519 Centre: mean USD 2349
| Staff, ECG monitoring | Not reported |
|
| |
| GBP 2013 to 2014 60 months | Home: GBP mean 197 Centre: GBP mean 221 | Staff, HR monitors, DVD | Home: mean: GBP 7932 Centre: mean: GBP 7452 | Hospitalisations, emergency admissions | ||
| USD 2000 14 months | Home: mean USD 1650 Centre: mean USD 8841 | Not reported | Home: USD 13,246 Centre: USD 21,298 | Not reported |
| |
| GBP 2002 to 2003 9 months | Home: mean GBP 170 (SD 8) Centre: mean GBP 200 (SD 3) Difference: mean GBP 30 (95% CI ‐45 to ‐12) P < 0.0001 | Staff, exercise, equipment, staff travel | Home: mean GBP 3279 (SD 374) Centre: mean GBP 3201 (SD 443) Difference: mean GBP 78(95% CI ‐1103 to 1191) P = 0.894 | Rehospitalisations, revascularisations, secondary preventive medication, investigations, primary care consultations |
| |
| GBP 2003 24 months | Home: mean GBP 198 (95% CI 189 to 209) Centre: mean GBP 157 (95% CI 139 to 175) P < 0.05 | Staff, telephone, consultations, staff travel | Not reported | With inclusion of patient costs (travel and time), the societal costs of home‐ and centre‐bas cardiac rehabilitation were not significantly different | ||
| Varnfield 2014/ Whittaker 2014 | AUD Not reported Based on a 6 week programme | Home: AUD 1633 Centre: AUD 1845 | Education, assessment, coaching and mentoring, gymnasium, communication, facility, technology, administration | Patient travel: Home: AUD 80 Centre: AUD 400 | Re‐admissions ‐ Estimated AUD 39,670 per re‐admission (Collins 2001) | Based on evidence suggesting that completing a formal rehabilitation programme significantly reduces the risk of a secondary event and readmission, the net‐present value was calculated at AUD 4008 per patient, equating to a saving in health care costs of AUD 2375 per patient |
Abbreviation: ECG = electrocardiogram
| Study | ||||||||
| Follow up | 9 months | 3 months | 0 to 6 months | 6 to 12 months | 6 months | 14 months | 12 month | 24 month |
| Rehospitalisations N patient (%)
Mean (SD) | Home 9/60 (15%) Centre 6/44 (14%) P = 0.845 Home 2.2 (0.9)† Centre 1.2 (0.6) P = 0.383 |
| Home 21/90 (23%) Centre 19/88 (22%) P = 0.78#
| 13/89 (15%) 12/84 (14%) P = 0.95# |
| Home 0.46 (SE 0.1) Centre 0.33 (SE 0.1) P = 0.49 | Home 0.08 (0.34) Centre 0.12 (0.41) P = 0.3 | Home 0.20 (0.45) Centre 0.26 (0.57) P = 0.3 |
| Primary care consultations Mean (SD) |
Home 6.3 (0.6) Centre 7.0 (0.9) P = 0.514 |
|
Home 6.6 (3.6)* Centre 6.6 (4.1) P = 1.00# |
5.4 (4.1) 4.6 (3.7) P = 0.19# |
|
| Home 0.65 (1.14) Centre 0.72 (1.54) P = 0.8 | Home 0.53 (1.14) Centre 0.66 (1.42) P = 0.7 |
| Secondary prevention medication N patients (%) beta‐blockers
ACE inhibitors
Statins
Antiplatelets |
Home 31/49 (63%) Centre 24/34 (71%) P = 0.49 Home 30/49 (61%) Centre 24/33 (73%) P = 0.28 Home 48/49 (98%)* Centre 30/35 (88%)* P = 0.18 Home 46/49 (94%) Centre 30/35 (86%) P = 0.21 |
Home 36/97 (37%) Centre 17/45 (38%) NS Home 25/97 (26%) Centre 8/45 (18%) NS Home 73/97 (75%) Centre 33/45 (73%) NS Home 94/97 (97%)* Centre 45/45 (100%)* NS |
|
|
Home 19/38 Centre 18/42 P = 0.52# Home 4/38 Centre 4/42 P = 0.88# Home 5/38 Centre 8/42 P = 0.47# Home 15/38 Centre 20/42 P = 0.54# |
|
Home 169 (72.2%) Centre 171 (73.4%) P = 0.8 Home 176 (75.2%)* Centre 161 (69.1%)* P = 0.1 Home 216 (92.3%)** Centre 221 (94.8%)** P = 0.3 Home 227 (97.0%)† Centre 226 (97.0%)† P = 1.0 |
Home 161 (71.6%) Centre 164 (72.2%) P = 0.9 Home 177 (78.7%)* Centre 156 (68.7%)* P = 0.02 Home 195 (86.7%)** Centre 206 (90.7%)** P = 0.2 Home 214 (95.1%)+ Centre 220 (96.9%)+ P = 0.3 |
| Comments
| †number of nights *lipid lowering drugs | *antiplatelets & anticoagulants | *GP consultations |
|
|
| *ACEi or Angiotensin II receptor antagonist **cholesterol‐lowering drugs †Aspirin or antiplatelet drugs | |
#P value calculated by authors of the present report
NS: not statistically significant
SE: standard error
| Study | ||
| Follow up | 6 months | 12 months |
| Rehospitalisations N patient (%) Number Mean (SD) | Not reported | Number and length of admissions same between groups |
| Primary care Consultations Mean (SD) | Not reported | Not reported |
| Secondary prevention medication N patients (%) beta‐blockers ACE inhibitors Antihypertensives Statins Antiplatelets | Home: 8/14 (57%) Centre: 15/16 (94%) P = 0.02* Home: 1/14 (7%) Centre: 0/16 (0%) P = 0.28* Home: 6/14 (43%) Centre: 2/16 (13%) P = 0.07* Home: 14/14 (100%) Centre: 14/16 (100%) P = 0.18* | Not reported |
| Comments |
*P value calculated by review authors
ACE: angiotensin‐converting‐enzyme
Discussion
Summary of main results
The mainstay approach to cardiac rehabilitation delivery in many countries is an inpatient and outpatient hospital‐based provision, which often takes place in a supervised university, hospital or community setting. The availability of home‐based programmes may provide an opportunity to widen access and increase participation in cardiac rehabilitation and, may therefore, improve uptake and adherence. Figures from the UK suggest that the dominant mode of delivery in the UK is group‐based, with just 10% cardiac rehabilitation programmes currently offering home‐based cardiac rehabilitation provision (NACR 2016).
This updated review included 23 trials which randomised 2890 participants following an acute myocardial infarction (MI) or revascularisation, or with heart failure, to either home‐ or centre‐based cardiac rehabilitation. The model of home‐based provision in the largest three included trials was the Heart Manual 2016 (Bell 1998; Dalal 2007; Jolly 2007), a cardiac rehabilitation programme that consists of a self‐help manual supported by a nurse facilitator (Lewin 1992). We found no evidence supporting important differences in outcomes for patients receiving home‐based or centre‐based cardiac rehabilitation either in the short‐term (3 to 12 months) or longer‐term (up to 24 months) for mortality, cardiac events, exercise capacity, modifiable risk factors (total cholesterol; low density lipoprotein cholesterol; systolic blood pressure; diastolic blood pressure; proportion of smokers at follow up) or health‐related quality of life. Small outcome differences in favour of centre‐based participants were seen in high density lipoprotein cholesterol and triglycerides. In contrast, in home‐based participants, there was evidence of marginally higher levels of programme completion and adherence to the programme. Healthcare costs seem to depend on the healthcare economy in which cardiac rehabilitation provision is made. However, this review found no consistent evidence to support an important difference in the cost of providing home‐ versus centre‐based programmes. Home‐based programmes often require support from healthcare staff which can be the major cost driver.
Overall completeness and applicability of evidence
The inclusion criteria for this review are broad, in order to reflect current practice where an increasingly diverse patient population is accessing cardiac rehabilitation services (NACR 2016). While the original version of this review was primarily limited to trials in participants with stable coronary heart disease (CHD) either following an acute myocardial infarction (MI) or revascularisation (Taylor 2009), the 2015 update included an additional five trials, which included 345 participants with heart failure (Taylor 2015). However, while this latest update added a further six trials in mixed populations of participants with CHD, none included people with heart failure. Similarly, only 19% of all participants included in this review were women and most participants were from studies that took place in high‐income nations (Europe and North America). It is therefore not clear whether or not our findings generalise to women, or to the wider population in general. However, while ethnicity was poorly reported by most studies, this review included several studies with a substantive proportion of ethnic groups, and in studies that reported ethnicity, fewer than 50% of participants were described as Caucasian. The applicability of our findings to low‐ and middle‐income countries is uncertain.
Interventions varied substantially in content, mode of delivery, level of support or supervision and dose. It could be argued that a benefit of this heterogeneity is that the results are more likely to be applicable to the wider population of people with CHD and clinical practice. However, we must also acknowledge this heterogeneity when interpreting the effect of these interventions on outcomes. This review also included studies which followed participants for as little as eight weeks post‐randomisation, which limits the clinical relevance of the findings. Similarly, fidelity (whether the intervention was delivered as intended) and dose (the quantity of intervention implemented) are important aspects of the delivery of a complex intervention, such as cardiac rehabilitation, and were generally poorly reported by studies included in this review.
Quality of the evidence
The general lack of reporting of methods in the included randomised controlled trial (RCT) reports made it difficult to assess their methodological quality and thereby judge their risk of bias, although there was some evidence of an improvement in the quality of reporting in more recent trials. It was also not possible to consistently judge whether the rehabilitation programmes included in the studies fulfilled recommended quality criteria for delivery of cardiac rehabilitation programmes, such as the BACPR guidelines (BACPR 2012).
Due to this poor reporting, the quality of the evidence for outcomes was assessed as moderate at best. Other reasons for downgrading the quality of evidence included inconsistency (exercise capacity ≤ 12 months and withdrawal) and imprecision (mortality).
Potential biases in the review process
Our review has limitations. Given the inconsistent reporting of outcomes, we were unable to judge the degree of publication bias for all outcomes, although there was no evidence of funnel plot asymmetry or statistically significant Egger tests for any outcome where this was tested (total mortality, exercise capacity, withdrawal, total cholesterol or blood pressure).
Although most participants represented in this review who received home‐based cardiac rehabilitation were exposed to the Heart Manual model, there was evidence of considerable statistical heterogeneity across a number of outcomes among trials. This heterogeneity may well reflect the variety of centre‐based cardiac rehabilitation interventions. Most studies were of relatively short duration, with only three trials reporting outcomes beyond 12 months of follow‐up (Arthur 2002; Jolly 2007; Marchionni 2003). The number of deaths and cardiac events reported by most trials was therefore correspondingly small. Details of interventions were often poorly reported and it was therefore difficult to assess whether the cardiac rehabilitation programmes used would meet current recommendations of good practice (BACPR 2012; Piepoli 2010).
It has been hypothesised that patient preference may have an impact on uptake and adherence to home‐based cardiac rehabilitation and there is evidence that white patients who work full‐ or part‐time and who perceive time constraints as a barrier to adherence are more likely to have a preference for home‐based provision (Grace 2005). However, such a hypothesis is difficult to test in a traditional RCT and therefore our finding of similar adherence between home‐ and centre‐based cardiac rehabilitation needs to be interpreted with caution. Dalal 2007 employed a comprehensive cohort design in addition to the randomised element of home‐ and centre‐based allocation in which there was also a patient preference element (participants could choose between home‐ and hospital‐based cardiac rehabilitation). The study authors reported that outcome differences between the home and hospital arms in the preference (non‐randomised) sample were very similar to those in the randomised comparison. Adherence to home‐based cardiac rehabilitation was also comparable between the randomised (75%) and preference arms (73%). This finding does not support the hypothesis that patients who can choose a programme to suit their lifestyle and preferences will have a higher adherence rate and improved outcomes. However, as with the randomised comparison, the number of participants in the preference arms was small (N = 126).
Agreements and disagreements with other studies or reviews
The findings of this update are consistent with the previous versions of this Cochrane Review (Taylor 2009; Taylor 2015) and another systematic review which reported that home‐based cardiac rehabilitation programmes are as effective as centre‐based programmes in terms of mortality, morbidity, short‐term exercise capacity, blood pressure, smoking cessation and health‐related quality of life (HRQoL) (Crawford‐Faucher 2010).
Our findings are also consistent with a recent systematic review which compared the effectiveness of "telehealth intervention‐delivered cardiac rehabilitation" with centre‐based supervised cardiac rehabilitation (Huang 2015) in nine trials, eight of which are included in this current review. The authors of the review concluded that telehealth intervention‐delivered cardiac rehabilitation does not have significantly inferior outcomes compared to centre‐based supervised programmes in low‐to‐moderate risk patients with CHD (Huang 2015). Similarly, another review which narratively synthesised 11 studies comparing "telerehabilitation" with other delivery models of cardiac rehabilitation in patients with cardiopulmonary diseases (Hwang 2015) found no differences between telerehabilitation and other delivery models, in terms of exercise capacity, quality of life or adverse events, while higher adherence rates were found for patients participating in the telerehabilitation programmes compared with centre‐based exercise.
Finally, our results also concur with a recent systematic review which assessed the effectiveness of home‐based cardiac rehabilitation for heart failure compared to either usual medical care (i.e. no cardiac rehabilitation) or centre‐based cardiac rehabilitation on mortality, morbidity, exercise capacity, HRQoL, adherence and costs (Zwisler 2016). This review found that outcomes and costs were similar between home‐ and centre‐based cardiac rehabilitation with the exception of higher levels of trial completion in the home‐based group.

PRISMA Flow Diagram
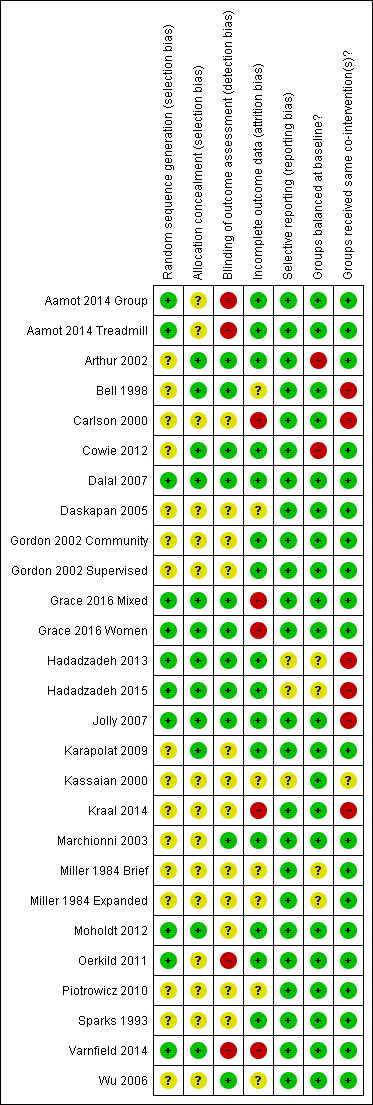
Methodological quality summary: review authors' judgements about each methodological quality item for each included study

Methodological quality graph: review authors' judgements about each methodological quality item presented as percentages across all included studies

Funnel plot of comparison: 1 home‐base vs centre‐based, outcome: 1.1 Total mortality.
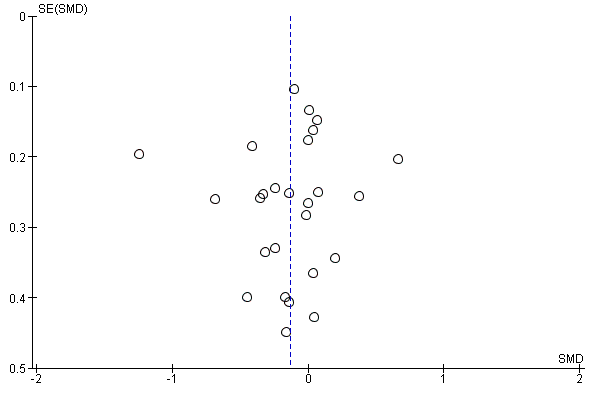
Funnel plot of comparison: 1 home‐base vs centre‐based, outcome: 1.2 Exercise capacity ≤ 12 months.

Funnel plot of comparison: 1 home‐base vs centre‐based, outcome: 1.4 Completers.

Funnel plot of comparison: 1 home‐base vs centre‐based, outcome: 1.5 Total cholesterol 3 to 12 months.

Funnel plot of comparison: 1 home‐base vs centre‐based, outcome: 1.9 Systolic blood pressure 3 to 12 months.

Comparison 1 home‐base vs centre‐based, Outcome 1 Total mortality.
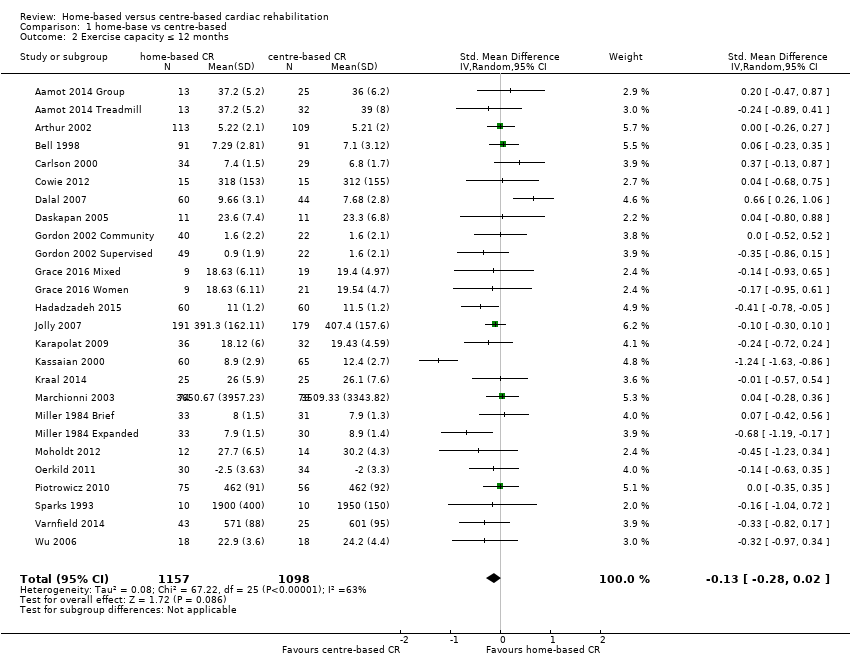
Comparison 1 home‐base vs centre‐based, Outcome 2 Exercise capacity ≤ 12 months.

Comparison 1 home‐base vs centre‐based, Outcome 3 Exercise capacity 12 to 24 months.

Comparison 1 home‐base vs centre‐based, Outcome 4 Completers.

Comparison 1 home‐base vs centre‐based, Outcome 5 Total cholesterol 3 to 12 months.
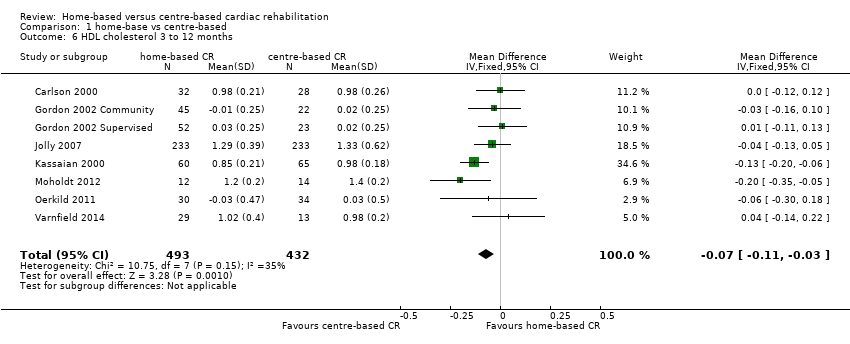
Comparison 1 home‐base vs centre‐based, Outcome 6 HDL cholesterol 3 to 12 months.

Comparison 1 home‐base vs centre‐based, Outcome 7 LDL cholesterol 3 to 12 months.

Comparison 1 home‐base vs centre‐based, Outcome 8 Triglycerides 3 to 12 months.

Comparison 1 home‐base vs centre‐based, Outcome 9 Systolic blood pressure 3 to 12 months.

Comparison 1 home‐base vs centre‐based, Outcome 10 Diastolic blood pressure 3 to 12 months.

Comparison 1 home‐base vs centre‐based, Outcome 11 Smoking 3 to 12 months.
| Home‐based versus supervised centre‐based cardiac rehabilitation for heart disease | ||||||
| Patient or population: Patients with heart disease | ||||||
| Outcomes | Anticipated absolute effects* (95% CI) | Relative effect | № of participants | Quality of the evidence | Comments | |
| Risk with centre‐based | Risk with home‐base | |||||
| Total mortality | Study population | RR 1.19 | 1505 | ⊕⊝⊝⊝ | ||
| 22 per 1,000 | 26 per 1,000 | |||||
| Exercise capacity ≤ 12 months | The mean exercise capacity ≤ 12 months ranged from ‐2 to 3,509.33 | SMD 0.13 lower | ‐ | 2255 | ⊕⊕⊝⊝ | Higher score indicates improved activity. A rule of thumb for interpreting SMD is that 0.2 represents a small effect, 0.5 a moderate effect and 0.8 a large effect (Cohen 1988) |
| Withdrawal from the intervention group | Study population | RR 1.04 | 2615 | ⊕⊕⊝⊝ | ||
| 816 per 1,000 | 848 per 1,000 | |||||
| HRQoL | HRQoL in home‐based cardiac rehabilitation = HRQoL in centre‐based cardiac rehabilitation, in 61/67 domains | Not estimable | 2079 | ⊕⊕⊕⊝ | ||
| *The risk in the intervention group (and its 95% confidence interval) is based on the assumed risk in the comparison group and the relative effect of the intervention (and its 95% CI). | ||||||
| GRADE Working Group grades of evidence | ||||||
| 1 Random sequence generation, allocation concealment or blinding of outcome assessors were poorly described in over 50% of included studies; bias likely, therefore quality of evidence downgraded by one level. 2 The 95% CIs includes both no effect, appreciate benefit and appreciable harm (i.e. CI < 0.75 and > 1.25), therefore quality of evidence downgraded by two levels. 3 I² > 50%; heterogeneity may be important and therefore quality of evidence downgraded by one level | ||||||
| Explanatory variable (n trials) | Exp(slope)* | 95% CI univariate P value | Proportion of variation explained | Interpretation |
| Case mix (% MI patients) (n = 6) | RR = 0.997 | 0.970 to 1.024 P = 0.743 | Not calculable² | No evidence that RR is associated with case mix |
| Dose of exercise (number of weeks of exercise training x average number of sessions/week x average duration of session in min) (n = ) | Not calculable¹ | Not calculable¹ | Not calculable¹ | No evidence that RR is associated with increased dose of exercise |
| Type of cardiac rehabilitation (exercise only versus comprehensive cardiac rehabilitation) (n = 7) | RR = 2.464 | 0.038 to 160.487 P = 0.603 | Not calculable² | No evidence that RR is associated with type of cardiac rehabilitation |
| Duration of follow‐up (months) (n = 7) | RR = 1.022 | 0.872 to 1.198 P = 0.737 | Not calculable² | No evidence that RR is associated with duration of follow‐up |
| Year of publication (n = 7) | RR = 0.988 | 0.851 to 1.147 P = 0.842 | Not calculable² | No evidence that RR is associated with year of publication |
| Risk of bias (low risk in ≥ 4 items versus < 4 items) (n = 7) | RR = 0.902 | 0.197 to 4.127 P = 0.868 | Not calculable² | No evidence that RR is associated with risk of bias |
| Study location (n = 7) | RR = 0.846 | 0.398 to 1.822 P = 0.613 | Not calculable² | No evidence that RR is associated with study location |
| Sample size (n = 7) | RR = 1.001 | 0.995 to 1.006 P = 0.726 | Not calculable² | No evidence that RR is associated with sample size |
| ¹ Not calculable due to insufficient observations | ||||
| Explanatory variable (n trials) | Exp(slope)* | 95% CI Univariate P value | Proportion of variation explained | Interpretation |
| Case mix (% MI patients) (n = 23) | RR = 0.003 | ‐0.001 to 0.008 P = 0.119 | 11.69% | No evidence that RR is associated with case mix |
| Dose of exercise (number of weeks of exercise training x average number of | RR = ‐0.001 | ‐0.003 to 0.001 P = 0.245 | Not calculable¹ | No evidence that RR is associated with increased dose of exercise |
| Type of cardiac rehabilitation (exercise only versus comprehensive | RR = 0.210 | ‐0.026 to 0.447 P = 0.079 | 18.73% | No evidence that RR is associated with type of cardiac rehabilitation |
| Duration of follow‐up (months) (n = 25) | RR = 0.003 | ‐0.007 to 0.013 P = 0.544 | ‐5.17% | No evidence that RR is associated with duration of follow‐up |
| Year of publication (n = 25) | RR = ‐0.002 | ‐0.024 to 0.020 P = 0.841 | ‐5.52% | No evidence that RR is associated with year of publication |
| Risk of bias (low risk in ≥ 4 items versus < 4 items) (n = 25) | RR = 0.097 | ‐0.118 to 0.311 P = 0.360 | 2.94% | No evidence that RR is associated with risk of bias |
| Study location (n = 26) | RR = 0.195 | ‐0.033 to 0.423 P = 0.090 | 15.80% | No evidence that risk ratio is associated with study location |
| Sample size (n = 25) | RR = 0.000 | ‐0.001 to 0.002 P = 0.837 | ‐7.78% | No evidence that RR is associated with sample size |
| ¹ Not calculable; Tau² of all studies = 0 | ||||
| Study ID | Follow up | HRQoL measure | Outcome values at follow up Mean (SD or range) Home‐ versus centre‐based, between group P value | Between‐group difference |
| Home versus treadmill group | 12 weeks | MacNew Emotional domain Social domain Physical domain Global | 6.1 (3.9–6.7) versus 6.0 (4.8–6.5) ns 6.8 (4.9–7.0) versus 6.7 (5.6–6.9) ns 6.4 (4.9–6.9) versus 6.6 (5.4–6.9) ns 6.4 (4.7–6.8) versus 6.3 (5.2–6.7) ns | Home = Centre Home = Centre Home = Centre Home = Centre |
| Home versus group exercise | 12 weeks | MacNew Emotional domain Social domain Physical domain Global | 6.1 (3.9–6.7) versus 6.2 (3.6–6.9) ns 6.8 (4.9–7.0) versus 6.5 (5.0–7.0) ns 6.4 (4.9–6.9) versus 6.4 (5.2–7.0) ns 6.4 (4.7–6.8) versus 6.3 (4.5–6.7) ns | Home = Centre Home = Centre Home = Centre Home = Centre |
| /Smith 2004 | 6 months 18 months | SF‐36 PCS MCS SF‐36 PCS MCS | 51.2 (6.4) versus 48.6 (7.1) P = 0.003* 53.5 (6.4 ) versus 52.0 (8.1) P = 0.13* 48.3 (11.7) versus 47.6 (11.7) P = 0.67* 53.0 (10.9) versus 50.2 (10.9) P = 0.07* | Home > Centre Home = Centre Home = Centre Home = Centre |
| 10.5 months | Nottingham Health Profile Energy Pain Emotional reactions Sleep Social isolation Physical mobility | 18.6 (28.4) versus 17.3 (30.7) P = 0.78* 6.6 (15.3) versus 7.4 (15.5) P = 0.74* 6.6 (15.3) versus 7.4 (15.5) P = 0.74* 6.6 (15.3) versus 16.9 (22.8) P = 0.0007* 3.7 (13.6) versus 6.7 (15.0) P = 0.18* 6.9 (13.5) versus 9.1 (15.9) P =0.33* | Home = Centre Home = Centre Home = Centre Home < Centre Home = Centre Home = Centre | |
| 3 months | SF‐36 PCS MCS MLWHF total Physical Emotional | 34.01 (11.04) versus 31.33 (7.97) P = 0.82 44.44 (12.23) versus 48.25 (11.21) P = 0.04 37 (NR) vs 32 (NR) P = 0.18 21 (NR) vs 19 (NR) P = 0.31 7 (NR) vs 7 (NR) P = 0.13 | Home = Centre Home < Centre Home = Centre Home = Centre | |
| 2 months 8 months 14 months | Sickness Impact Profile | 2.83 (14.5) versus 4.71 (11.1) P = 0.09* 2.83 (14.5) versus 3.40 (11.1) P = 0.61* 2.00 (8.3) versus 3.70 (11.8) P = 0.06* | Home = Centre Home = Centre Home = Centre | |
| Dalal 2007/Taylor 2007 | 9 months | MacNew Global score EQ‐5D | 5.61 (1.14) versus 5.54 (1.10) P = 0.71 0.74 (0.04) versus 0.78 (0.04) P = 0.57 | Home = Centre Home = Centre |
| 12 week | SF 36 Physical Composite Score Mental Composite Score | 51.6 (4.7) versus 52.2 (4.7) P = 0.94 46.4 (4.9) versus 47.6 (6.4) P = 0.10 | Home = Centre Home = Centre | |
| 6 months 12 months 24 months | EQ‐5D SF‐12 PCS MCS EQ‐5D | 0.74 (0.26) versus 0.76 (0.23) P = 0.37 42.28 (10.9) 42.56 (10.8) P = 0.8 49.19 (10.1) 50.33 (9.6) P = 0.3 0.74 (0.27) versus 0.76 (0.23) P = 0.52* 0.73 (0.29) versus 0.75 (0.26) P = 0.39* | Home = Centre Home = Centre Home = Centre Home = Centre Home = Centre | |
| 8 weeks | SF‐36 Physical function Physical role Bodily pain General health Social function Emotional role Mental health | 59.39 (25.35) versus 69.57 (20.94),P = 0.08* 39.81 (41.75) versus 48.21 (45.10) P = 0.43* 62.42 (30.45) versus 74.23 (19.66) P = 0.07* 47.25 (23.42) versus 53.98 (25.00) P =0.33* 66.67 (19.82) versus 69.81 (17.41) P = 0.49* 65.33 (25.60) versus 69.33 (25.14) P = 0.52* 44.74 (39.77) versus 37.16 (39.24) P =0.44* 64.67 (19.04) versus 70.52 (20.37) P = 0.22* | Home = Centre Home = Centre Home = Centre Home = Centre Home = Centre Home = Centre Home = Centre | |
| 12 weeks | MacNew (Dutch translation) Physical scale Emotional scale Social scale Total score | 6.1 (0.6) versus 5.7 (0.8) P = 0.16 5.9 (0.8) versus 5.6 (0.9) P = 0.88 6.4 (0.6) versus 6.1 (0.7) P = 0.26 6.1 (0.5) versus 5.8 (0.7) P = 0.50 | Home = Centre Home = Centre Home = Centre Home = Centre | |
| 6 months | MacNew Emotional domain Physical domain Social domain | 1.2 (0.2) versus 1.4 (0.2) P > 0.05 1.4 (0.7) versus 1.6 (1.1) P > 0.05 4.3 (0.7) versus 4.3 (1.0) P > 0.05 | Home = Centre Home = Centre Home = Centre | |
| 3 months 6 months | SF‐36 PCS SF‐36 MCS SF‐36 PCS SF‐36 MCS | 1.4 (‐1.5 to 4.3) versus 0.5 (‐2.4 to 3.4) P > 0.05 0.8 (‐2.6 to 4.3) versus ‐0.2 (‐3.6 to 3.4) P > 0.05 1.0 (‐1.6 to 3.6) versus 1.2 (‐1.4 to 3.8) P > 0.05 2.3 (‐1.1 to 5.7) versus 2.6 (‐0.9 to ‐6.0) P > 0.05 | Home = Centre Home = Centre Home = Centre Home = Centre | |
| Piotrowicz 2014 | 8 weeks | SF‐36 Physical function Role limitation caused by physical problems Bodily pain General health Physical component summary Social function Mental health Role limitation caused by physical problems Vitality Mental component summary Total quality of life index | 21.60 (9.65) versus 23.20 (10.71) ns 12.74 (7.17) versus 11.39 (8.43) ns 2.66 (2.22) versus 2.00 (2.07) ns 13.14 (3.80) versus 14.59 (4.03) P < 0.05 50.27 (17.06) versus 51.37 (19.60) ns 2.64 (2.84) versus 1.63 (1.54) P < 0.05 7.15 (4.00) versus 5.89 (3.58) ns 4.93 (6.15) versus 4.35 (6.07) ns 7.25 (3.78) versus 6.76 (3.17) ns 21.68 (12.46) versus 18.56 (9.18) ns 70.50 (25.40) versus 69.20 (26.40) ns | Home = Centre Home = Centre Home = Centre Home < Centre Home = Centre Home > Centre Home = Centre Home = Centre Home = Centre Home = Centre Home = Centre |
| 6 weeks 6 months | EQ5D‐Index | 0.92 (0.9–1.0) versus 0.82 (0.7–0.9) "The HRQoL (EQ5D‐Index) improved significantly in 0.85 (0.1) versus 0.86 (0.2) "Between‐group difference for changes in EQ5D‐Index was | Home > Centre Home = Centre | |
| *P value calculated by authors of this report based on independent 2‐group t‐test | ||||
| Explanatory variable (n trials) | Exp(slope)* | 95% CI univariate P value | Proportion of variation explained | Interpretation |
| Case mix (% MI patients) (n = 21) | RR = 1.000 | 0.999 to 1.002 P = 0.949 | ‐15.22% | No evidence that RR is associated with case mix |
| Dose of exercise (number of weeks of exercise training x average number of sessions/week x average duration of session in min) (n = 10) | RR = 0.999 | 0.998 to 1.000 P = 0.217 | 16.94% | No evidence that RR is associated with increased dose of exercise |
| Type of cardiac rehabilitation (exercise only versus comprehensive cardiac rehabilitation) (n = 24) | RR = 1.041 | 0.975 to 1.111 P = 0.219 | ‐1.56% | No evidence that RR is associated with type of cardiac rehabilitation |
| Duration of follow‐up (months) (n = 23) | RR = 1.000 | 0.997 to 1.003 P = 0.940 | ‐21.09% | No evidence that RR is associated with duration of follow‐up |
| Year of publication (n = 23) | RR = 1.000 | 0.992 to 1.007 P = 0.930 | ‐12.08% | No evidence that RR is associated with year of publication |
| Risk of bias (low risk in ≥ 4 items versus < 4 items) (n = 23) | RR = 0.949 | 0.880 to 1.023 P =0.160 | 32.50% | No evidence that RR is associated with risk of bias |
| Study location (n = 24) | RR = 0.988 | 0.912 to 1.069 P = 0.747 | ‐21.54% | No evidence that RR is associated with study location |
| Sample size (n = 23) | RR = 1.000 | 1.000 to 1.000 P = 0.880 | ‐20.04% | No evidence that RR is associated with sample size |
| Abbreviations: MI: myocardial infarction; RR: risk ratio | ||||
| Explanatory variable (n trials) | Exp(slope)* | 95% CI univariate P value | Proportion of variation explained | Interpretation |
| Case mix (% MI patients) (n = 10) | RR = ‐0.007 | ‐0.011 to ‐0.002 P = 0.014 | 88.71% | Evidence that RR is associated with case mix |
| Dose of exercise (number of weeks of exercise training x average number of sessions/week x average duration of session in min) (n = ) | Not calculable¹ | Not calculable¹ | Not calculable¹ | No evidence that RR is associated with increased dose of exercise |
| Type of cardiac rehabilitation (exercise only vs comprehensive cardiac rehabilitation) (n = 10) | RR = ‐0.127 | ‐0.822 to 0.567 P = 0.684 | ‐17.11% | No evidence that RR is associated with type of cardiac rehabilitation |
| Duration of follow‐up (months) (n = 10) | RR = ‐0.007 | ‐0.038 to 0.024 P = 0.594 | ‐21.27% | No evidence that RR is associated with duration of follow‐up |
| Year of publication (n = 10) | RR = 0.027 | ‐0.012 to 0.066 P = 0.154 | 31.00% | No evidence that RR is associated with year of publication |
| Risk of bias (low risk in ≥ 4 items versus < 4 items) (n = 10) | RR = ‐0.077 | ‐0.404 to 0.249 P = 0.600 | ‐14.59% | No evidence that RR is associated with risk of bias |
| Study location (n = 10) | RR =0.015 | ‐0.304 to 0.333 P = 0.919 | ‐18.83% | No evidence that RR is associated with study location |
| Sample size (n = 10) | RR = ‐0.001 | ‐0.002 to 0.001 P = 0.347 | ‐7.77% | No evidence that RR is associated with sample size |
| ¹Not calculable due to insufficient observations | ||||
| Explanatory variable (n trials) | Exp(slope)* | 95% CI univariate P value | Proportion of variation explained | Interpretation |
| Case mix (% MI patients) (n = 11) | RR = 0.026 | ‐0.095 to 0.146 P = 0.642 | ‐8.81% | No evidence that RR is associated with case mix |
| Dose of exercise (number of weeks of exercise training x average number of sessions/week x average duration of session in min) (n = 4) | RR = 0.001 | ‐0.110 to 0.112 P = 0.971 | Not calculable¹ | No evidence that RR is associated with increased dose of exercise |
| Type of cardiac rehabilitation (exercise only versus comprehensive cardiac rehabilitation) (n = 12) | RR = 5.021 | ‐0.929 to 10.971 P =0.089 | 51.60% | No evidence that RR is associated with type of cardiac rehabilitation |
| Duration of follow‐up (months) (n = 12) | RR = ‐0.053 | ‐0.540 to 0.435 P = 0.815 | ‐22.77% | No evidence that RR is associated with duration of follow‐up |
| Year of publication (n = 12) | RR = ‐0.008 | ‐0.607 to 0.591 P =0.976 | ‐15.85% | No evidence that RR is associated with year of publication |
| Risk of bias (low risk in ≥ 4 items versus < 4 items) (n = 12) | RR = 2.325 | ‐1.376 to 6.026 P =0.192 | 37.06% | No evidence that RR is associated with risk of bias |
| Study location (n = 12) | RR = 4.053 | 0.696 to 7.410 P = 0.023 | 71.21% | Evidence that RR is associated with study location |
| Sample size (n = 12) | RR = ‐0.005 | ‐0.029 to 0.018 P = 0.623 | ‐18.75% | No evidence that RR is associated with sample size |
| ¹Not calculable; Tau² of all studies = 0 | ||||
| Explanatory variable (n trials) | Exp(slope)* | 95% CI univariate P value | Proportion of variation explained | Interpretation |
| Case mix (% MI patients) (n = 10) | RR = 0.025 | ‐0.069 to 0.119 P = 0.561 | ‐11.53% | No evidence that risk RR is associated with case mix |
| Dose of exercise (number of weeks of exercise training x average number of sessions/week x average duration of session in min) (n = 4) | RR = ‐0.017 | ‐0.085 to 0.051 P = 0.391 | Not calculable¹ | No evidence that RR is associated with increased dose of exercise |
| Type of cardiac rehabilitation (exercise only versus comprehensive cardiac rehabilitation) (n = 11) | RR = 0.125 | ‐4.719 to 4.970 P = 0.955 | ‐20.57% | No evidence that RR is associated with type of cardiac rehabilitation |
| Duration of follow‐up (months) (n = 11) | RR = ‐0.051 | ‐0.377 to 0.276 P = 0.734 | ‐32.23% | No evidence that RR is associated with duration of follow‐up |
| Year of publication (n = 11) | RR = 0.234 | ‐0.144 to 0.613 P = 0.195 | 40.22% | No evidence that RR is associated with year of publication |
| Risk of bias (low risk in ≥ 4 items versus < 4 items) (n = 11) | RR = 0.761 | ‐2.082 to 3.605 P = 0.560 | 0.88% | No evidence that RR is associated with risk of bias |
| Study location (n = 11) | RR = ‐0.034 | ‐3.196 to 3.128 P = 0.981 | ‐25.38% | No evidence that RR is associated with study location |
| Sample size (n = 11) | RR = ‐0.001 | ‐0.017 to 0.015 P = 0.907 | ‐30.17% | No evidence that risk ratio is associated with sample size |
| ¹Not calculable; Tau² of all studies = 0 | ||||
| Trial | Follow‐up | Method/definition of adherence assessment | Findings | Between‐group difference |
| Home versus treadmill group | 12 weeks | Completion of 70% of the exercise sessions (considered to be training per protocol). Median (range) number of exercise sessions completed | Home: 24/28 (86%) versus centre: 34/34 (100%) P = 0.04 Home: 24 (10–24) versus centre: 24 (7–24) | Home < Centre |
| Home versus group exercise | 12 weeks | Completion of 70% of the exercise sessions (considered to be training per protocol). Median (range) number of exercise sessions completed | Home: 24/28 (86%) versus centre: 28/28 (100%) P = 0.04 Home: 24 (10–24) versus centre: 23 (17–24) | Home < Centre |
| /Smith 2004 | 6 months 18 months | Number of exercise session reported/week Percentage of patients seeking dietician consultation Percentage of patients seeking psychologist consultation Level of physical activity – Physical Activity Scale for the Elderly | Home: mean 6.5 (SD 4.6) Centre: mean 3.7 (SD 2.6) P < 0.0001† Home 50% (mean 3.5, SD 2.5 visits) Centre: 53% (mean 3.6, SD 2.3 visits) Home: 42% (mean 2.6, SD 2.4 visits) Centre: 51% (mean 2.5, SD 2.2 visits) Home: mean 232.6 (SD 99.4) Centre: mean 170.0 (SD 89.2) P < 0.0001† | Home > Centre ? Home = Centre** Home > Centre |
| 6 months | Attendance at all 3 nutrition/risk factor classes Total exercise over follow up – number of sessions ≥ 30 min | Home: 27/38 (71%) Centre: 33/42 (79%) P = 0.438* Home: mean 111.8 (SD 29.1) Centre: mean 98.1 (SD 33.4) P = 0.06† | Home = Centre Home = Centre | |
| 3 months | Percentage completion of 16 exercise sessions | Home: 77% Centre: 86% P = 0.32 | Home = Centre | |
| 9 months | Number who participated in intervention | Home: 40/60 (67%) Centre: 32/44 (72%) P = 0.51* | Home = Centre | |
| 3 months | Percentage of sessions attended | Home: 97% Centre: 81% P value not calculable | ? | |
| 3 months | Percentage of completed scheduled appointments (exercise sessions, office/on site visits, “telephone visits” in accordance with intervention protocol) | Home (MD supervised): 83% Home (community‐based): 86% Centre: 81% | Home = Centre** | |
| Grace 2016 Mixed Home versus mixed sex training | 6 months | Percentage of cardiac rehabilitation sessions attended | Home: 58.12% (SD 34.68) Centre: 51.33% (SD 35.75) P = 0.63 | Home = Centre |
| Grace 2016 Mixed Home versus women only training | 6 months | Percentage of cardiac rehabilitation sessions attended | Home: 58.12% (SD 34.68) Centre: 54.4% (SD 34.72) P = 0.63 | Home = Centre |
| 3 months 6 months 12 months 24 months | Hours of self‐reported activity weighted for intensity | Home: mean 23.2 (SD 22.1) Centre: mean 18.7 (SD 19.3) P = 0.06† Home: mean 16.4 (SD 17.0) Centre: mean 18.1 (SD 25.4) P = 0.4† Home: mean 19.2 (SD 20.8) Centre: mean 15.9 (SD 16.7) P = 0.06† Home: mean 18.9 (SD 18.4) Centre: mean 16.6 (SD 16.4) P = 0.16† | Home = Centre Home = Centre Home = Centre Home = Centre | |
| 8 weeks | Attendance at exercise sessions | Home: (32/37) 87.5% Centre: (33/37) 90% P = 0.72* | Home = Centre | |
| 12 weeks | Number of sessions attended | Home: Mean = 24 (100 %; SD 7.2; range: 13 to 41) Centre: Mean = 20.5 (86%; SD 4.5 range: 6 to 25) P = 0.049 | Home > Centre | |
| 4 months | Number of exercise sessions completed | Home: 37.3 (SD 3.4) Centre: 34.3 (SD 4.4) P < 0.0001† | Home > Centre | |
| DeBusk 1985/ Taylor 1986 | 6 months | Ratio of exercise sessions completed versus prescribed | Home: 50/70 (72%) Centre: 28/40 (71%) P value not calculable | Home = Centre** |
| 6 months | Training diaries (only reported for home group) | Home: 7/10 patients (with complete diary data) reported ≥2 weekly interval sessions over 6 months follow up | ? | |
| 8 weeks | Percentage of patients who carried out the prescribed exercise training (home group: daily telephone contacts with monitoring centre; centre group: attendance at supervised sessions) | Home: 77/77 (100%) Centre: 59/75 (79%) P < 0.0001† | Home > Centre | |
| 3 months | Percentage of cardiac rehabilitation sessions attended | Home: 93% Centre: 88% P value not calculable | ? | |
| 6 weeks | "Attended baseline assessment and at least 4 weeks (8 of 12 sessions) of centre‐based gym sessions/uploaded exercise data to web portal for a minimum of 4 weeks" | Home: 45/48 (94%) Centre: 25/37 (68%) P < 0.005 | Home > Centre | |
| *calculated by authors of this report based on Chi² test †calculated by authors of this report based on independent t‐test | ||||
| Study | CurrencyYear of costsFollow up | Cardiac rehabilitation programme cost(per patient) | Programme costs considered | Total healthcare cost(per patient) | Additional healthcare costs considered | Comments |
| USD Not reported 6 months | Home: mean USD 1519 Centre: mean USD 2349
| Staff, ECG monitoring | Not reported |
|
| |
| GBP 2013 to 2014 60 months | Home: GBP mean 197 Centre: GBP mean 221 | Staff, HR monitors, DVD | Home: mean: GBP 7932 Centre: mean: GBP 7452 | Hospitalisations, emergency admissions | ||
| USD 2000 14 months | Home: mean USD 1650 Centre: mean USD 8841 | Not reported | Home: USD 13,246 Centre: USD 21,298 | Not reported |
| |
| GBP 2002 to 2003 9 months | Home: mean GBP 170 (SD 8) Centre: mean GBP 200 (SD 3) Difference: mean GBP 30 (95% CI ‐45 to ‐12) P < 0.0001 | Staff, exercise, equipment, staff travel | Home: mean GBP 3279 (SD 374) Centre: mean GBP 3201 (SD 443) Difference: mean GBP 78(95% CI ‐1103 to 1191) P = 0.894 | Rehospitalisations, revascularisations, secondary preventive medication, investigations, primary care consultations |
| |
| GBP 2003 24 months | Home: mean GBP 198 (95% CI 189 to 209) Centre: mean GBP 157 (95% CI 139 to 175) P < 0.05 | Staff, telephone, consultations, staff travel | Not reported | With inclusion of patient costs (travel and time), the societal costs of home‐ and centre‐bas cardiac rehabilitation were not significantly different | ||
| Varnfield 2014/ Whittaker 2014 | AUD Not reported Based on a 6 week programme | Home: AUD 1633 Centre: AUD 1845 | Education, assessment, coaching and mentoring, gymnasium, communication, facility, technology, administration | Patient travel: Home: AUD 80 Centre: AUD 400 | Re‐admissions ‐ Estimated AUD 39,670 per re‐admission (Collins 2001) | Based on evidence suggesting that completing a formal rehabilitation programme significantly reduces the risk of a secondary event and readmission, the net‐present value was calculated at AUD 4008 per patient, equating to a saving in health care costs of AUD 2375 per patient |
| Abbreviation: ECG = electrocardiogram | ||||||
| Study | ||||||||
| Follow up | 9 months | 3 months | 0 to 6 months | 6 to 12 months | 6 months | 14 months | 12 month | 24 month |
| Rehospitalisations N patient (%)
Mean (SD) | Home 9/60 (15%) Centre 6/44 (14%) P = 0.845 Home 2.2 (0.9)† Centre 1.2 (0.6) P = 0.383 |
| Home 21/90 (23%) Centre 19/88 (22%) P = 0.78#
| 13/89 (15%) 12/84 (14%) P = 0.95# |
| Home 0.46 (SE 0.1) Centre 0.33 (SE 0.1) P = 0.49 | Home 0.08 (0.34) Centre 0.12 (0.41) P = 0.3 | Home 0.20 (0.45) Centre 0.26 (0.57) P = 0.3 |
| Primary care consultations Mean (SD) |
Home 6.3 (0.6) Centre 7.0 (0.9) P = 0.514 |
|
Home 6.6 (3.6)* Centre 6.6 (4.1) P = 1.00# |
5.4 (4.1) 4.6 (3.7) P = 0.19# |
|
| Home 0.65 (1.14) Centre 0.72 (1.54) P = 0.8 | Home 0.53 (1.14) Centre 0.66 (1.42) P = 0.7 |
| Secondary prevention medication N patients (%) beta‐blockers
ACE inhibitors
Statins
Antiplatelets |
Home 31/49 (63%) Centre 24/34 (71%) P = 0.49 Home 30/49 (61%) Centre 24/33 (73%) P = 0.28 Home 48/49 (98%)* Centre 30/35 (88%)* P = 0.18 Home 46/49 (94%) Centre 30/35 (86%) P = 0.21 |
Home 36/97 (37%) Centre 17/45 (38%) NS Home 25/97 (26%) Centre 8/45 (18%) NS Home 73/97 (75%) Centre 33/45 (73%) NS Home 94/97 (97%)* Centre 45/45 (100%)* NS |
|
|
Home 19/38 Centre 18/42 P = 0.52# Home 4/38 Centre 4/42 P = 0.88# Home 5/38 Centre 8/42 P = 0.47# Home 15/38 Centre 20/42 P = 0.54# |
|
Home 169 (72.2%) Centre 171 (73.4%) P = 0.8 Home 176 (75.2%)* Centre 161 (69.1%)* P = 0.1 Home 216 (92.3%)** Centre 221 (94.8%)** P = 0.3 Home 227 (97.0%)† Centre 226 (97.0%)† P = 1.0 |
Home 161 (71.6%) Centre 164 (72.2%) P = 0.9 Home 177 (78.7%)* Centre 156 (68.7%)* P = 0.02 Home 195 (86.7%)** Centre 206 (90.7%)** P = 0.2 Home 214 (95.1%)+ Centre 220 (96.9%)+ P = 0.3 |
| Comments
| †number of nights *lipid lowering drugs | *antiplatelets & anticoagulants | *GP consultations |
|
|
| *ACEi or Angiotensin II receptor antagonist **cholesterol‐lowering drugs †Aspirin or antiplatelet drugs | |
| #P value calculated by authors of the present report | ||||||||
| Study | ||
| Follow up | 6 months | 12 months |
| Rehospitalisations N patient (%) Number Mean (SD) | Not reported | Number and length of admissions same between groups |
| Primary care Consultations Mean (SD) | Not reported | Not reported |
| Secondary prevention medication N patients (%) beta‐blockers ACE inhibitors Antihypertensives Statins Antiplatelets | Home: 8/14 (57%) Centre: 15/16 (94%) P = 0.02* Home: 1/14 (7%) Centre: 0/16 (0%) P = 0.28* Home: 6/14 (43%) Centre: 2/16 (13%) P = 0.07* Home: 14/14 (100%) Centre: 14/16 (100%) P = 0.18* | Not reported |
| Comments | ||
| *P value calculated by review authors | ||
| Outcome or subgroup title | No. of studies | No. of participants | Statistical method | Effect size |
| 1 Total mortality Show forest plot | 13 | 1505 | Risk Ratio (M‐H, Fixed, 95% CI) | 1.19 [0.65, 2.16] |
| 2 Exercise capacity ≤ 12 months Show forest plot | 26 | 2255 | Std. Mean Difference (IV, Random, 95% CI) | ‐0.13 [‐0.28, 0.02] |
| 3 Exercise capacity 12 to 24 months Show forest plot | 3 | 1074 | Std. Mean Difference (IV, Fixed, 95% CI) | 0.11 [‐0.01, 0.23] |
| 4 Completers Show forest plot | 26 | 2615 | Risk Ratio (M‐H, Random, 95% CI) | 1.04 [1.00, 1.08] |
| 5 Total cholesterol 3 to 12 months Show forest plot | 10 | 1151 | Mean Difference (IV, Random, 95% CI) | 0.06 [‐0.10, 0.23] |
| 6 HDL cholesterol 3 to 12 months Show forest plot | 8 | 925 | Mean Difference (IV, Fixed, 95% CI) | ‐0.07 [‐0.11, ‐0.03] |
| 7 LDL cholesterol 3 to 12 months Show forest plot | 6 | 430 | Mean Difference (IV, Random, 95% CI) | 0.04 [‐0.14, 0.22] |
| 8 Triglycerides 3 to 12 months Show forest plot | 6 | 396 | Mean Difference (IV, Fixed, 95% CI) | 0.15 [0.00, 0.29] |
| 9 Systolic blood pressure 3 to 12 months Show forest plot | 12 | 1292 | Mean Difference (IV, Random, 95% CI) | ‐0.27 [‐3.13, 2.60] |
| 10 Diastolic blood pressure 3 to 12 months Show forest plot | 11 | 1146 | Mean Difference (IV, Random, 95% CI) | 0.74 [‐1.04, 2.53] |
| 11 Smoking 3 to 12 months Show forest plot | 6 | 986 | Risk Ratio (M‐H, Fixed, 95% CI) | 1.02 [0.83, 1.27] |