Rehabilitación cardiaca domiciliaria versus rehabilitación en un centro de atención
Información
- DOI:
- https://doi.org/10.1002/14651858.CD007130.pub4Copiar DOI

- Base de datos:
-
- Cochrane Database of Systematic Reviews
- Versión publicada:
-
- 30 junio 2017see what's new
- Tipo:
-
- Intervention
- Etapa:
-
- Review
- Grupo Editorial Cochrane:
-
Grupo Cochrane de Corazón
- Copyright:
-
- Copyright © 2017 The Cochrane Collaboration. Published by John Wiley & Sons, Ltd.
Cifras del artículo
Altmetric:
Citado por:
Autores
Contributions of authors
LA undertook the study selection, data extraction and risk of bias assessment, and led the writing of the updated review.
HD, KJ, AZ, SGD and RJN contributed to a previous version of the review and contributed to the editing of this updated review.
GAS undertook data extraction and risk of bias assessment and contributed to the editing of this updated review.
RST contributed to the original and previous versions of the review, led the analysis of this review and contributed to the editing of the updated review.
The final manuscript was approved by all authors.
Sources of support
Internal sources
-
No sources of support supplied
External sources
-
NIHR Cochrane Heart Programme grant, UK.
-
Transparency of the National Health System Drug Reimbursement Decisions, Poland.
co‐financed by EU
Declarations of interest
LA is an author on number of other Cochrane cardiac rehabilitation reviews.
RST, HD, KJ and AC are investigators on randomised controlled trials included in this review. RST, HD and KJ are chief investigators/co‐applicants on an ongoing National Institute for Health Research (NIHR) Programme Grants for Applied Research funded study ‐ Rehabilitation Enablement in Chronic Heart Failure (REACH‐HF) ‐ to develop and evaluate the costs and outcomes of a home‐based self help heart failure rehabilitation manual (RP‐PG‐1210‐12004) http://medicine.exeter.ac.uk/research/healthserv/primarycare/projects/reach‐hf/.
SJD's position at the University of Exeter Medical School is partially supported by the National Institute for Health Research (NIHR) Collaboration for Leadership in Applied Health Research and Care (CLAHRC) for the South West Peninsula. The views expressed in this publication are those of the authors and not necessarily those of the NHS, the NIHR or the Department of Health in England. The textbook 'Interprofessional Rehabilitation: a person‐centred approach' has a section on adherence in rehabilitation, drawing upon earlier work than this Cochrane Review.
KJ is part funded by NIHR CLAHRC‐WM.
RJN, AZ and GAS declare that they have no conflicts of interest.
Acknowledgements
We are grateful to all authors of the original and previous versions of this Cochrane Review (Dalal 2010; Taylor 2015) for their contributions. We would also like to thank all the study authors who provided additional information about their trials.
Version history
| Published | Title | Stage | Authors | Version |
| 2023 Oct 27 | Home‐based versus centre‐based cardiac rehabilitation | Review | Sinead TJ McDonagh, Hasnain Dalal, Sarah Moore, Christopher E Clark, Sarah G Dean, Kate Jolly, Aynsley Cowie, Jannat Afzal, Rod S Taylor | |
| 2017 Jun 30 | Home‐based versus centre‐based cardiac rehabilitation | Review | Lindsey Anderson, Georgina A Sharp, Rebecca J Norton, Hasnain Dalal, Sarah G Dean, Kate Jolly, Aynsley Cowie, Anna Zawada, Rod S Taylor | |
| 2015 Aug 18 | Home‐based versus centre‐based cardiac rehabilitation | Review | Rod S Taylor, Hayes Dalal, Kate Jolly, Anna Zawada, Sarah G Dean, Aynsley Cowie, Rebecca J Norton | |
| 2010 Jan 19 | Home‐based versus centre‐based cardiac rehabilitation | Review | Rod S Taylor, Hayes Dalal, Kate Jolly, Tiffany Moxham, Anna Zawada | |
| 2008 Apr 23 | Home‐based versus centre‐based cardiac rehabilitation | Protocol | Rod S Taylor, Hayes Dalal, Kate Jolly, Tiffany Moxham, Anna Zawada | |
Differences between protocol and review
To reflect current practice and terminology, “percutaneous transluminal coronary angioplasty” (PTCA) was replaced by “percutaneous coronary intervention” (PCI), a term which encompasses the use of balloons, stents and atherectomy.
The order of primary and secondary outcomes has been updated, for clarity.
Due to the increase in the number of studies included in this review, we undertook meta‐regression analysis to examine potential treatment effect modifiers and the text has been updated to reflect this change.
Finally, we created a 'Summary of findings' table using the following outcomes: total mortality, exercise capacity, withdrawal and health‐related quality of life.
Keywords
MeSH
Medical Subject Headings (MeSH) Keywords
- *Home Care Services;
- *Rehabilitation Centers;
- Cardiac Rehabilitation [*methods];
- Exercise Tolerance;
- Heart Failure [mortality, *rehabilitation];
- Myocardial Infarction [mortality, *rehabilitation];
- Myocardial Revascularization [mortality, *rehabilitation];
- Patient Dropouts;
- Quality of Life;
- Randomized Controlled Trials as Topic;
- Risk Factors;
Medical Subject Headings Check Words
Adult; Aged; Female; Humans; Male; Middle Aged;
PICO

PRISMA Flow Diagram
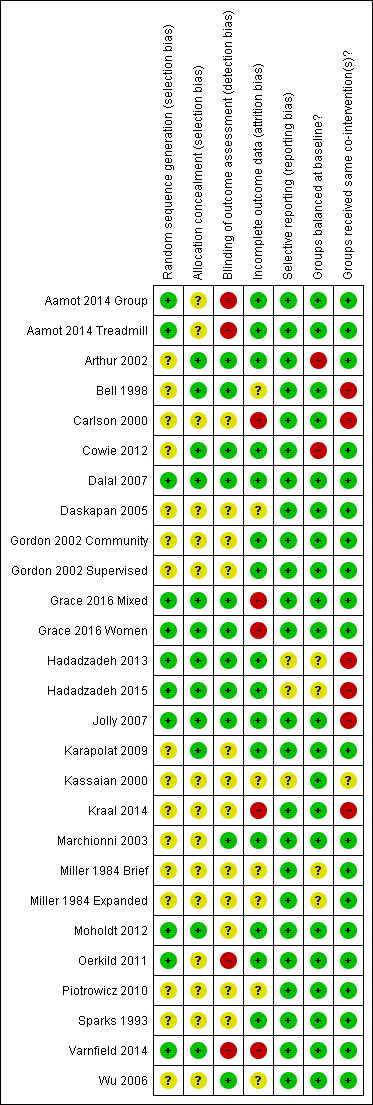
Methodological quality summary: review authors' judgements about each methodological quality item for each included study

Methodological quality graph: review authors' judgements about each methodological quality item presented as percentages across all included studies

Funnel plot of comparison: 1 home‐base vs centre‐based, outcome: 1.1 Total mortality.
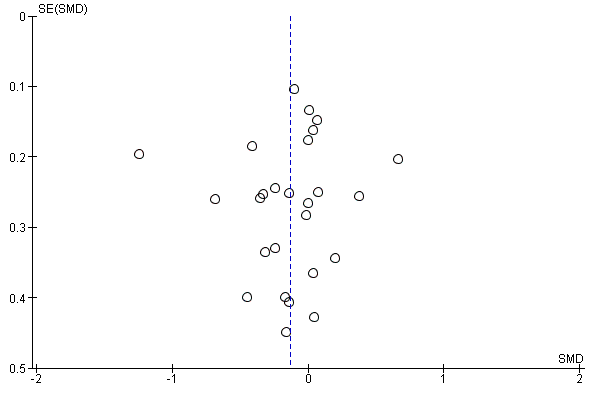
Funnel plot of comparison: 1 home‐base vs centre‐based, outcome: 1.2 Exercise capacity ≤ 12 months.

Funnel plot of comparison: 1 home‐base vs centre‐based, outcome: 1.4 Completers.

Funnel plot of comparison: 1 home‐base vs centre‐based, outcome: 1.5 Total cholesterol 3 to 12 months.

Funnel plot of comparison: 1 home‐base vs centre‐based, outcome: 1.9 Systolic blood pressure 3 to 12 months.

Comparison 1 home‐base vs centre‐based, Outcome 1 Total mortality.
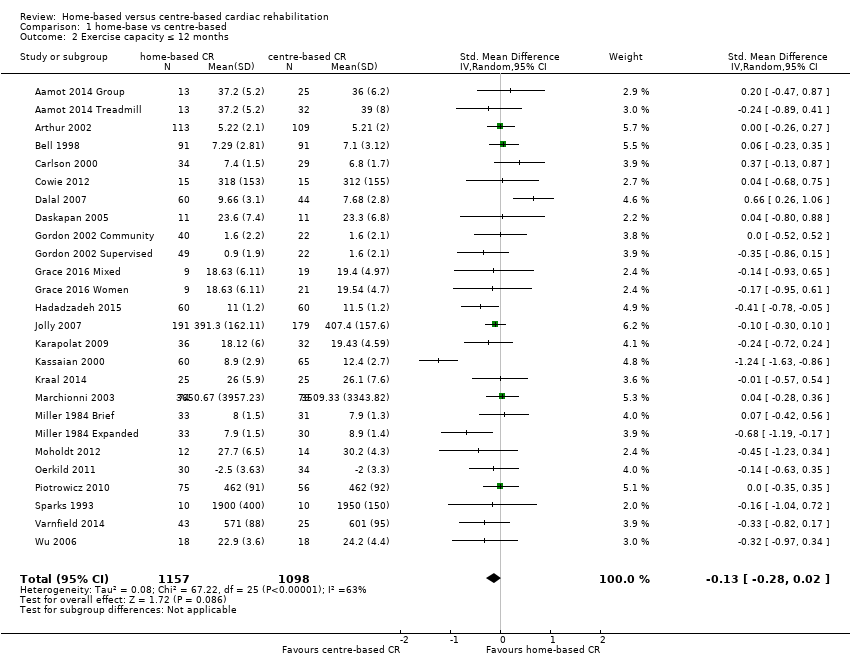
Comparison 1 home‐base vs centre‐based, Outcome 2 Exercise capacity ≤ 12 months.

Comparison 1 home‐base vs centre‐based, Outcome 3 Exercise capacity 12 to 24 months.

Comparison 1 home‐base vs centre‐based, Outcome 4 Completers.

Comparison 1 home‐base vs centre‐based, Outcome 5 Total cholesterol 3 to 12 months.
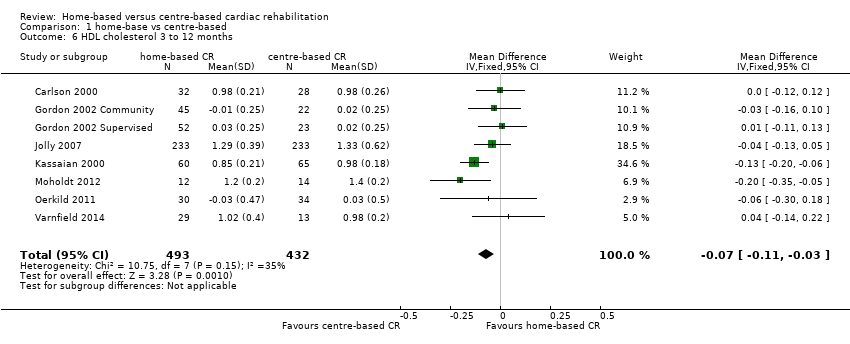
Comparison 1 home‐base vs centre‐based, Outcome 6 HDL cholesterol 3 to 12 months.

Comparison 1 home‐base vs centre‐based, Outcome 7 LDL cholesterol 3 to 12 months.

Comparison 1 home‐base vs centre‐based, Outcome 8 Triglycerides 3 to 12 months.

Comparison 1 home‐base vs centre‐based, Outcome 9 Systolic blood pressure 3 to 12 months.

Comparison 1 home‐base vs centre‐based, Outcome 10 Diastolic blood pressure 3 to 12 months.

Comparison 1 home‐base vs centre‐based, Outcome 11 Smoking 3 to 12 months.
| Home‐based versus supervised centre‐based cardiac rehabilitation for heart disease | ||||||
| Patient or population: Patients with heart disease | ||||||
| Outcomes | Anticipated absolute effects* (95% CI) | Relative effect | № of participants | Quality of the evidence | Comments | |
| Risk with centre‐based | Risk with home‐base | |||||
| Total mortality | Study population | RR 1.19 | 1505 | ⊕⊝⊝⊝ | ||
| 22 per 1,000 | 26 per 1,000 | |||||
| Exercise capacity ≤ 12 months | The mean exercise capacity ≤ 12 months ranged from ‐2 to 3,509.33 | SMD 0.13 lower | ‐ | 2255 | ⊕⊕⊝⊝ | Higher score indicates improved activity. A rule of thumb for interpreting SMD is that 0.2 represents a small effect, 0.5 a moderate effect and 0.8 a large effect (Cohen 1988) |
| Withdrawal from the intervention group | Study population | RR 1.04 | 2615 | ⊕⊕⊝⊝ | ||
| 816 per 1,000 | 848 per 1,000 | |||||
| HRQoL | HRQoL in home‐based cardiac rehabilitation = HRQoL in centre‐based cardiac rehabilitation, in 61/67 domains | Not estimable | 2079 | ⊕⊕⊕⊝ | ||
| *The risk in the intervention group (and its 95% confidence interval) is based on the assumed risk in the comparison group and the relative effect of the intervention (and its 95% CI). | ||||||
| GRADE Working Group grades of evidence | ||||||
| 1 Random sequence generation, allocation concealment or blinding of outcome assessors were poorly described in over 50% of included studies; bias likely, therefore quality of evidence downgraded by one level. 2 The 95% CIs includes both no effect, appreciate benefit and appreciable harm (i.e. CI < 0.75 and > 1.25), therefore quality of evidence downgraded by two levels. 3 I² > 50%; heterogeneity may be important and therefore quality of evidence downgraded by one level | ||||||
| Explanatory variable (n trials) | Exp(slope)* | 95% CI univariate P value | Proportion of variation explained | Interpretation |
| Case mix (% MI patients) (n = 6) | RR = 0.997 | 0.970 to 1.024 P = 0.743 | Not calculable² | No evidence that RR is associated with case mix |
| Dose of exercise (number of weeks of exercise training x average number of sessions/week x average duration of session in min) (n = ) | Not calculable¹ | Not calculable¹ | Not calculable¹ | No evidence that RR is associated with increased dose of exercise |
| Type of cardiac rehabilitation (exercise only versus comprehensive cardiac rehabilitation) (n = 7) | RR = 2.464 | 0.038 to 160.487 P = 0.603 | Not calculable² | No evidence that RR is associated with type of cardiac rehabilitation |
| Duration of follow‐up (months) (n = 7) | RR = 1.022 | 0.872 to 1.198 P = 0.737 | Not calculable² | No evidence that RR is associated with duration of follow‐up |
| Year of publication (n = 7) | RR = 0.988 | 0.851 to 1.147 P = 0.842 | Not calculable² | No evidence that RR is associated with year of publication |
| Risk of bias (low risk in ≥ 4 items versus < 4 items) (n = 7) | RR = 0.902 | 0.197 to 4.127 P = 0.868 | Not calculable² | No evidence that RR is associated with risk of bias |
| Study location (n = 7) | RR = 0.846 | 0.398 to 1.822 P = 0.613 | Not calculable² | No evidence that RR is associated with study location |
| Sample size (n = 7) | RR = 1.001 | 0.995 to 1.006 P = 0.726 | Not calculable² | No evidence that RR is associated with sample size |
| ¹ Not calculable due to insufficient observations | ||||
| Explanatory variable (n trials) | Exp(slope)* | 95% CI Univariate P value | Proportion of variation explained | Interpretation |
| Case mix (% MI patients) (n = 23) | RR = 0.003 | ‐0.001 to 0.008 P = 0.119 | 11.69% | No evidence that RR is associated with case mix |
| Dose of exercise (number of weeks of exercise training x average number of | RR = ‐0.001 | ‐0.003 to 0.001 P = 0.245 | Not calculable¹ | No evidence that RR is associated with increased dose of exercise |
| Type of cardiac rehabilitation (exercise only versus comprehensive | RR = 0.210 | ‐0.026 to 0.447 P = 0.079 | 18.73% | No evidence that RR is associated with type of cardiac rehabilitation |
| Duration of follow‐up (months) (n = 25) | RR = 0.003 | ‐0.007 to 0.013 P = 0.544 | ‐5.17% | No evidence that RR is associated with duration of follow‐up |
| Year of publication (n = 25) | RR = ‐0.002 | ‐0.024 to 0.020 P = 0.841 | ‐5.52% | No evidence that RR is associated with year of publication |
| Risk of bias (low risk in ≥ 4 items versus < 4 items) (n = 25) | RR = 0.097 | ‐0.118 to 0.311 P = 0.360 | 2.94% | No evidence that RR is associated with risk of bias |
| Study location (n = 26) | RR = 0.195 | ‐0.033 to 0.423 P = 0.090 | 15.80% | No evidence that risk ratio is associated with study location |
| Sample size (n = 25) | RR = 0.000 | ‐0.001 to 0.002 P = 0.837 | ‐7.78% | No evidence that RR is associated with sample size |
| ¹ Not calculable; Tau² of all studies = 0 | ||||
| Study ID | Follow up | HRQoL measure | Outcome values at follow up Mean (SD or range) Home‐ versus centre‐based, between group P value | Between‐group difference |
| Home versus treadmill group | 12 weeks | MacNew Emotional domain Social domain Physical domain Global | 6.1 (3.9–6.7) versus 6.0 (4.8–6.5) ns 6.8 (4.9–7.0) versus 6.7 (5.6–6.9) ns 6.4 (4.9–6.9) versus 6.6 (5.4–6.9) ns 6.4 (4.7–6.8) versus 6.3 (5.2–6.7) ns | Home = Centre Home = Centre Home = Centre Home = Centre |
| Home versus group exercise | 12 weeks | MacNew Emotional domain Social domain Physical domain Global | 6.1 (3.9–6.7) versus 6.2 (3.6–6.9) ns 6.8 (4.9–7.0) versus 6.5 (5.0–7.0) ns 6.4 (4.9–6.9) versus 6.4 (5.2–7.0) ns 6.4 (4.7–6.8) versus 6.3 (4.5–6.7) ns | Home = Centre Home = Centre Home = Centre Home = Centre |
| /Smith 2004 | 6 months 18 months | SF‐36 PCS MCS SF‐36 PCS MCS | 51.2 (6.4) versus 48.6 (7.1) P = 0.003* 53.5 (6.4 ) versus 52.0 (8.1) P = 0.13* 48.3 (11.7) versus 47.6 (11.7) P = 0.67* 53.0 (10.9) versus 50.2 (10.9) P = 0.07* | Home > Centre Home = Centre Home = Centre Home = Centre |
| 10.5 months | Nottingham Health Profile Energy Pain Emotional reactions Sleep Social isolation Physical mobility | 18.6 (28.4) versus 17.3 (30.7) P = 0.78* 6.6 (15.3) versus 7.4 (15.5) P = 0.74* 6.6 (15.3) versus 7.4 (15.5) P = 0.74* 6.6 (15.3) versus 16.9 (22.8) P = 0.0007* 3.7 (13.6) versus 6.7 (15.0) P = 0.18* 6.9 (13.5) versus 9.1 (15.9) P =0.33* | Home = Centre Home = Centre Home = Centre Home < Centre Home = Centre Home = Centre | |
| 3 months | SF‐36 PCS MCS MLWHF total Physical Emotional | 34.01 (11.04) versus 31.33 (7.97) P = 0.82 44.44 (12.23) versus 48.25 (11.21) P = 0.04 37 (NR) vs 32 (NR) P = 0.18 21 (NR) vs 19 (NR) P = 0.31 7 (NR) vs 7 (NR) P = 0.13 | Home = Centre Home < Centre Home = Centre Home = Centre | |
| 2 months 8 months 14 months | Sickness Impact Profile | 2.83 (14.5) versus 4.71 (11.1) P = 0.09* 2.83 (14.5) versus 3.40 (11.1) P = 0.61* 2.00 (8.3) versus 3.70 (11.8) P = 0.06* | Home = Centre Home = Centre Home = Centre | |
| Dalal 2007/Taylor 2007 | 9 months | MacNew Global score EQ‐5D | 5.61 (1.14) versus 5.54 (1.10) P = 0.71 0.74 (0.04) versus 0.78 (0.04) P = 0.57 | Home = Centre Home = Centre |
| 12 week | SF 36 Physical Composite Score Mental Composite Score | 51.6 (4.7) versus 52.2 (4.7) P = 0.94 46.4 (4.9) versus 47.6 (6.4) P = 0.10 | Home = Centre Home = Centre | |
| 6 months 12 months 24 months | EQ‐5D SF‐12 PCS MCS EQ‐5D | 0.74 (0.26) versus 0.76 (0.23) P = 0.37 42.28 (10.9) 42.56 (10.8) P = 0.8 49.19 (10.1) 50.33 (9.6) P = 0.3 0.74 (0.27) versus 0.76 (0.23) P = 0.52* 0.73 (0.29) versus 0.75 (0.26) P = 0.39* | Home = Centre Home = Centre Home = Centre Home = Centre Home = Centre | |
| 8 weeks | SF‐36 Physical function Physical role Bodily pain General health Social function Emotional role Mental health | 59.39 (25.35) versus 69.57 (20.94),P = 0.08* 39.81 (41.75) versus 48.21 (45.10) P = 0.43* 62.42 (30.45) versus 74.23 (19.66) P = 0.07* 47.25 (23.42) versus 53.98 (25.00) P =0.33* 66.67 (19.82) versus 69.81 (17.41) P = 0.49* 65.33 (25.60) versus 69.33 (25.14) P = 0.52* 44.74 (39.77) versus 37.16 (39.24) P =0.44* 64.67 (19.04) versus 70.52 (20.37) P = 0.22* | Home = Centre Home = Centre Home = Centre Home = Centre Home = Centre Home = Centre Home = Centre | |
| 12 weeks | MacNew (Dutch translation) Physical scale Emotional scale Social scale Total score | 6.1 (0.6) versus 5.7 (0.8) P = 0.16 5.9 (0.8) versus 5.6 (0.9) P = 0.88 6.4 (0.6) versus 6.1 (0.7) P = 0.26 6.1 (0.5) versus 5.8 (0.7) P = 0.50 | Home = Centre Home = Centre Home = Centre Home = Centre | |
| 6 months | MacNew Emotional domain Physical domain Social domain | 1.2 (0.2) versus 1.4 (0.2) P > 0.05 1.4 (0.7) versus 1.6 (1.1) P > 0.05 4.3 (0.7) versus 4.3 (1.0) P > 0.05 | Home = Centre Home = Centre Home = Centre | |
| 3 months 6 months | SF‐36 PCS SF‐36 MCS SF‐36 PCS SF‐36 MCS | 1.4 (‐1.5 to 4.3) versus 0.5 (‐2.4 to 3.4) P > 0.05 0.8 (‐2.6 to 4.3) versus ‐0.2 (‐3.6 to 3.4) P > 0.05 1.0 (‐1.6 to 3.6) versus 1.2 (‐1.4 to 3.8) P > 0.05 2.3 (‐1.1 to 5.7) versus 2.6 (‐0.9 to ‐6.0) P > 0.05 | Home = Centre Home = Centre Home = Centre Home = Centre | |
| Piotrowicz 2014 | 8 weeks | SF‐36 Physical function Role limitation caused by physical problems Bodily pain General health Physical component summary Social function Mental health Role limitation caused by physical problems Vitality Mental component summary Total quality of life index | 21.60 (9.65) versus 23.20 (10.71) ns 12.74 (7.17) versus 11.39 (8.43) ns 2.66 (2.22) versus 2.00 (2.07) ns 13.14 (3.80) versus 14.59 (4.03) P < 0.05 50.27 (17.06) versus 51.37 (19.60) ns 2.64 (2.84) versus 1.63 (1.54) P < 0.05 7.15 (4.00) versus 5.89 (3.58) ns 4.93 (6.15) versus 4.35 (6.07) ns 7.25 (3.78) versus 6.76 (3.17) ns 21.68 (12.46) versus 18.56 (9.18) ns 70.50 (25.40) versus 69.20 (26.40) ns | Home = Centre Home = Centre Home = Centre Home < Centre Home = Centre Home > Centre Home = Centre Home = Centre Home = Centre Home = Centre Home = Centre |
| 6 weeks 6 months | EQ5D‐Index | 0.92 (0.9–1.0) versus 0.82 (0.7–0.9) "The HRQoL (EQ5D‐Index) improved significantly in 0.85 (0.1) versus 0.86 (0.2) "Between‐group difference for changes in EQ5D‐Index was | Home > Centre Home = Centre | |
| *P value calculated by authors of this report based on independent 2‐group t‐test | ||||
| Explanatory variable (n trials) | Exp(slope)* | 95% CI univariate P value | Proportion of variation explained | Interpretation |
| Case mix (% MI patients) (n = 21) | RR = 1.000 | 0.999 to 1.002 P = 0.949 | ‐15.22% | No evidence that RR is associated with case mix |
| Dose of exercise (number of weeks of exercise training x average number of sessions/week x average duration of session in min) (n = 10) | RR = 0.999 | 0.998 to 1.000 P = 0.217 | 16.94% | No evidence that RR is associated with increased dose of exercise |
| Type of cardiac rehabilitation (exercise only versus comprehensive cardiac rehabilitation) (n = 24) | RR = 1.041 | 0.975 to 1.111 P = 0.219 | ‐1.56% | No evidence that RR is associated with type of cardiac rehabilitation |
| Duration of follow‐up (months) (n = 23) | RR = 1.000 | 0.997 to 1.003 P = 0.940 | ‐21.09% | No evidence that RR is associated with duration of follow‐up |
| Year of publication (n = 23) | RR = 1.000 | 0.992 to 1.007 P = 0.930 | ‐12.08% | No evidence that RR is associated with year of publication |
| Risk of bias (low risk in ≥ 4 items versus < 4 items) (n = 23) | RR = 0.949 | 0.880 to 1.023 P =0.160 | 32.50% | No evidence that RR is associated with risk of bias |
| Study location (n = 24) | RR = 0.988 | 0.912 to 1.069 P = 0.747 | ‐21.54% | No evidence that RR is associated with study location |
| Sample size (n = 23) | RR = 1.000 | 1.000 to 1.000 P = 0.880 | ‐20.04% | No evidence that RR is associated with sample size |
| Abbreviations: MI: myocardial infarction; RR: risk ratio | ||||
| Explanatory variable (n trials) | Exp(slope)* | 95% CI univariate P value | Proportion of variation explained | Interpretation |
| Case mix (% MI patients) (n = 10) | RR = ‐0.007 | ‐0.011 to ‐0.002 P = 0.014 | 88.71% | Evidence that RR is associated with case mix |
| Dose of exercise (number of weeks of exercise training x average number of sessions/week x average duration of session in min) (n = ) | Not calculable¹ | Not calculable¹ | Not calculable¹ | No evidence that RR is associated with increased dose of exercise |
| Type of cardiac rehabilitation (exercise only vs comprehensive cardiac rehabilitation) (n = 10) | RR = ‐0.127 | ‐0.822 to 0.567 P = 0.684 | ‐17.11% | No evidence that RR is associated with type of cardiac rehabilitation |
| Duration of follow‐up (months) (n = 10) | RR = ‐0.007 | ‐0.038 to 0.024 P = 0.594 | ‐21.27% | No evidence that RR is associated with duration of follow‐up |
| Year of publication (n = 10) | RR = 0.027 | ‐0.012 to 0.066 P = 0.154 | 31.00% | No evidence that RR is associated with year of publication |
| Risk of bias (low risk in ≥ 4 items versus < 4 items) (n = 10) | RR = ‐0.077 | ‐0.404 to 0.249 P = 0.600 | ‐14.59% | No evidence that RR is associated with risk of bias |
| Study location (n = 10) | RR =0.015 | ‐0.304 to 0.333 P = 0.919 | ‐18.83% | No evidence that RR is associated with study location |
| Sample size (n = 10) | RR = ‐0.001 | ‐0.002 to 0.001 P = 0.347 | ‐7.77% | No evidence that RR is associated with sample size |
| ¹Not calculable due to insufficient observations | ||||
| Explanatory variable (n trials) | Exp(slope)* | 95% CI univariate P value | Proportion of variation explained | Interpretation |
| Case mix (% MI patients) (n = 11) | RR = 0.026 | ‐0.095 to 0.146 P = 0.642 | ‐8.81% | No evidence that RR is associated with case mix |
| Dose of exercise (number of weeks of exercise training x average number of sessions/week x average duration of session in min) (n = 4) | RR = 0.001 | ‐0.110 to 0.112 P = 0.971 | Not calculable¹ | No evidence that RR is associated with increased dose of exercise |
| Type of cardiac rehabilitation (exercise only versus comprehensive cardiac rehabilitation) (n = 12) | RR = 5.021 | ‐0.929 to 10.971 P =0.089 | 51.60% | No evidence that RR is associated with type of cardiac rehabilitation |
| Duration of follow‐up (months) (n = 12) | RR = ‐0.053 | ‐0.540 to 0.435 P = 0.815 | ‐22.77% | No evidence that RR is associated with duration of follow‐up |
| Year of publication (n = 12) | RR = ‐0.008 | ‐0.607 to 0.591 P =0.976 | ‐15.85% | No evidence that RR is associated with year of publication |
| Risk of bias (low risk in ≥ 4 items versus < 4 items) (n = 12) | RR = 2.325 | ‐1.376 to 6.026 P =0.192 | 37.06% | No evidence that RR is associated with risk of bias |
| Study location (n = 12) | RR = 4.053 | 0.696 to 7.410 P = 0.023 | 71.21% | Evidence that RR is associated with study location |
| Sample size (n = 12) | RR = ‐0.005 | ‐0.029 to 0.018 P = 0.623 | ‐18.75% | No evidence that RR is associated with sample size |
| ¹Not calculable; Tau² of all studies = 0 | ||||
| Explanatory variable (n trials) | Exp(slope)* | 95% CI univariate P value | Proportion of variation explained | Interpretation |
| Case mix (% MI patients) (n = 10) | RR = 0.025 | ‐0.069 to 0.119 P = 0.561 | ‐11.53% | No evidence that risk RR is associated with case mix |
| Dose of exercise (number of weeks of exercise training x average number of sessions/week x average duration of session in min) (n = 4) | RR = ‐0.017 | ‐0.085 to 0.051 P = 0.391 | Not calculable¹ | No evidence that RR is associated with increased dose of exercise |
| Type of cardiac rehabilitation (exercise only versus comprehensive cardiac rehabilitation) (n = 11) | RR = 0.125 | ‐4.719 to 4.970 P = 0.955 | ‐20.57% | No evidence that RR is associated with type of cardiac rehabilitation |
| Duration of follow‐up (months) (n = 11) | RR = ‐0.051 | ‐0.377 to 0.276 P = 0.734 | ‐32.23% | No evidence that RR is associated with duration of follow‐up |
| Year of publication (n = 11) | RR = 0.234 | ‐0.144 to 0.613 P = 0.195 | 40.22% | No evidence that RR is associated with year of publication |
| Risk of bias (low risk in ≥ 4 items versus < 4 items) (n = 11) | RR = 0.761 | ‐2.082 to 3.605 P = 0.560 | 0.88% | No evidence that RR is associated with risk of bias |
| Study location (n = 11) | RR = ‐0.034 | ‐3.196 to 3.128 P = 0.981 | ‐25.38% | No evidence that RR is associated with study location |
| Sample size (n = 11) | RR = ‐0.001 | ‐0.017 to 0.015 P = 0.907 | ‐30.17% | No evidence that risk ratio is associated with sample size |
| ¹Not calculable; Tau² of all studies = 0 | ||||
| Trial | Follow‐up | Method/definition of adherence assessment | Findings | Between‐group difference |
| Home versus treadmill group | 12 weeks | Completion of 70% of the exercise sessions (considered to be training per protocol). Median (range) number of exercise sessions completed | Home: 24/28 (86%) versus centre: 34/34 (100%) P = 0.04 Home: 24 (10–24) versus centre: 24 (7–24) | Home < Centre |
| Home versus group exercise | 12 weeks | Completion of 70% of the exercise sessions (considered to be training per protocol). Median (range) number of exercise sessions completed | Home: 24/28 (86%) versus centre: 28/28 (100%) P = 0.04 Home: 24 (10–24) versus centre: 23 (17–24) | Home < Centre |
| /Smith 2004 | 6 months 18 months | Number of exercise session reported/week Percentage of patients seeking dietician consultation Percentage of patients seeking psychologist consultation Level of physical activity – Physical Activity Scale for the Elderly | Home: mean 6.5 (SD 4.6) Centre: mean 3.7 (SD 2.6) P < 0.0001† Home 50% (mean 3.5, SD 2.5 visits) Centre: 53% (mean 3.6, SD 2.3 visits) Home: 42% (mean 2.6, SD 2.4 visits) Centre: 51% (mean 2.5, SD 2.2 visits) Home: mean 232.6 (SD 99.4) Centre: mean 170.0 (SD 89.2) P < 0.0001† | Home > Centre ? Home = Centre** Home > Centre |
| 6 months | Attendance at all 3 nutrition/risk factor classes Total exercise over follow up – number of sessions ≥ 30 min | Home: 27/38 (71%) Centre: 33/42 (79%) P = 0.438* Home: mean 111.8 (SD 29.1) Centre: mean 98.1 (SD 33.4) P = 0.06† | Home = Centre Home = Centre | |
| 3 months | Percentage completion of 16 exercise sessions | Home: 77% Centre: 86% P = 0.32 | Home = Centre | |
| 9 months | Number who participated in intervention | Home: 40/60 (67%) Centre: 32/44 (72%) P = 0.51* | Home = Centre | |
| 3 months | Percentage of sessions attended | Home: 97% Centre: 81% P value not calculable | ? | |
| 3 months | Percentage of completed scheduled appointments (exercise sessions, office/on site visits, “telephone visits” in accordance with intervention protocol) | Home (MD supervised): 83% Home (community‐based): 86% Centre: 81% | Home = Centre** | |
| Grace 2016 Mixed Home versus mixed sex training | 6 months | Percentage of cardiac rehabilitation sessions attended | Home: 58.12% (SD 34.68) Centre: 51.33% (SD 35.75) P = 0.63 | Home = Centre |
| Grace 2016 Mixed Home versus women only training | 6 months | Percentage of cardiac rehabilitation sessions attended | Home: 58.12% (SD 34.68) Centre: 54.4% (SD 34.72) P = 0.63 | Home = Centre |
| 3 months 6 months 12 months 24 months | Hours of self‐reported activity weighted for intensity | Home: mean 23.2 (SD 22.1) Centre: mean 18.7 (SD 19.3) P = 0.06† Home: mean 16.4 (SD 17.0) Centre: mean 18.1 (SD 25.4) P = 0.4† Home: mean 19.2 (SD 20.8) Centre: mean 15.9 (SD 16.7) P = 0.06† Home: mean 18.9 (SD 18.4) Centre: mean 16.6 (SD 16.4) P = 0.16† | Home = Centre Home = Centre Home = Centre Home = Centre | |
| 8 weeks | Attendance at exercise sessions | Home: (32/37) 87.5% Centre: (33/37) 90% P = 0.72* | Home = Centre | |
| 12 weeks | Number of sessions attended | Home: Mean = 24 (100 %; SD 7.2; range: 13 to 41) Centre: Mean = 20.5 (86%; SD 4.5 range: 6 to 25) P = 0.049 | Home > Centre | |
| 4 months | Number of exercise sessions completed | Home: 37.3 (SD 3.4) Centre: 34.3 (SD 4.4) P < 0.0001† | Home > Centre | |
| DeBusk 1985/ Taylor 1986 | 6 months | Ratio of exercise sessions completed versus prescribed | Home: 50/70 (72%) Centre: 28/40 (71%) P value not calculable | Home = Centre** |
| 6 months | Training diaries (only reported for home group) | Home: 7/10 patients (with complete diary data) reported ≥2 weekly interval sessions over 6 months follow up | ? | |
| 8 weeks | Percentage of patients who carried out the prescribed exercise training (home group: daily telephone contacts with monitoring centre; centre group: attendance at supervised sessions) | Home: 77/77 (100%) Centre: 59/75 (79%) P < 0.0001† | Home > Centre | |
| 3 months | Percentage of cardiac rehabilitation sessions attended | Home: 93% Centre: 88% P value not calculable | ? | |
| 6 weeks | "Attended baseline assessment and at least 4 weeks (8 of 12 sessions) of centre‐based gym sessions/uploaded exercise data to web portal for a minimum of 4 weeks" | Home: 45/48 (94%) Centre: 25/37 (68%) P < 0.005 | Home > Centre | |
| *calculated by authors of this report based on Chi² test †calculated by authors of this report based on independent t‐test | ||||
| Study | CurrencyYear of costsFollow up | Cardiac rehabilitation programme cost(per patient) | Programme costs considered | Total healthcare cost(per patient) | Additional healthcare costs considered | Comments |
| USD Not reported 6 months | Home: mean USD 1519 Centre: mean USD 2349
| Staff, ECG monitoring | Not reported |
|
| |
| GBP 2013 to 2014 60 months | Home: GBP mean 197 Centre: GBP mean 221 | Staff, HR monitors, DVD | Home: mean: GBP 7932 Centre: mean: GBP 7452 | Hospitalisations, emergency admissions | ||
| USD 2000 14 months | Home: mean USD 1650 Centre: mean USD 8841 | Not reported | Home: USD 13,246 Centre: USD 21,298 | Not reported |
| |
| GBP 2002 to 2003 9 months | Home: mean GBP 170 (SD 8) Centre: mean GBP 200 (SD 3) Difference: mean GBP 30 (95% CI ‐45 to ‐12) P < 0.0001 | Staff, exercise, equipment, staff travel | Home: mean GBP 3279 (SD 374) Centre: mean GBP 3201 (SD 443) Difference: mean GBP 78(95% CI ‐1103 to 1191) P = 0.894 | Rehospitalisations, revascularisations, secondary preventive medication, investigations, primary care consultations |
| |
| GBP 2003 24 months | Home: mean GBP 198 (95% CI 189 to 209) Centre: mean GBP 157 (95% CI 139 to 175) P < 0.05 | Staff, telephone, consultations, staff travel | Not reported | With inclusion of patient costs (travel and time), the societal costs of home‐ and centre‐bas cardiac rehabilitation were not significantly different | ||
| Varnfield 2014/ Whittaker 2014 | AUD Not reported Based on a 6 week programme | Home: AUD 1633 Centre: AUD 1845 | Education, assessment, coaching and mentoring, gymnasium, communication, facility, technology, administration | Patient travel: Home: AUD 80 Centre: AUD 400 | Re‐admissions ‐ Estimated AUD 39,670 per re‐admission (Collins 2001) | Based on evidence suggesting that completing a formal rehabilitation programme significantly reduces the risk of a secondary event and readmission, the net‐present value was calculated at AUD 4008 per patient, equating to a saving in health care costs of AUD 2375 per patient |
| Abbreviation: ECG = electrocardiogram | ||||||
| Study | ||||||||
| Follow up | 9 months | 3 months | 0 to 6 months | 6 to 12 months | 6 months | 14 months | 12 month | 24 month |
| Rehospitalisations N patient (%)
Mean (SD) | Home 9/60 (15%) Centre 6/44 (14%) P = 0.845 Home 2.2 (0.9)† Centre 1.2 (0.6) P = 0.383 |
| Home 21/90 (23%) Centre 19/88 (22%) P = 0.78#
| 13/89 (15%) 12/84 (14%) P = 0.95# |
| Home 0.46 (SE 0.1) Centre 0.33 (SE 0.1) P = 0.49 | Home 0.08 (0.34) Centre 0.12 (0.41) P = 0.3 | Home 0.20 (0.45) Centre 0.26 (0.57) P = 0.3 |
| Primary care consultations Mean (SD) |
Home 6.3 (0.6) Centre 7.0 (0.9) P = 0.514 |
|
Home 6.6 (3.6)* Centre 6.6 (4.1) P = 1.00# |
5.4 (4.1) 4.6 (3.7) P = 0.19# |
|
| Home 0.65 (1.14) Centre 0.72 (1.54) P = 0.8 | Home 0.53 (1.14) Centre 0.66 (1.42) P = 0.7 |
| Secondary prevention medication N patients (%) beta‐blockers
ACE inhibitors
Statins
Antiplatelets |
Home 31/49 (63%) Centre 24/34 (71%) P = 0.49 Home 30/49 (61%) Centre 24/33 (73%) P = 0.28 Home 48/49 (98%)* Centre 30/35 (88%)* P = 0.18 Home 46/49 (94%) Centre 30/35 (86%) P = 0.21 |
Home 36/97 (37%) Centre 17/45 (38%) NS Home 25/97 (26%) Centre 8/45 (18%) NS Home 73/97 (75%) Centre 33/45 (73%) NS Home 94/97 (97%)* Centre 45/45 (100%)* NS |
|
|
Home 19/38 Centre 18/42 P = 0.52# Home 4/38 Centre 4/42 P = 0.88# Home 5/38 Centre 8/42 P = 0.47# Home 15/38 Centre 20/42 P = 0.54# |
|
Home 169 (72.2%) Centre 171 (73.4%) P = 0.8 Home 176 (75.2%)* Centre 161 (69.1%)* P = 0.1 Home 216 (92.3%)** Centre 221 (94.8%)** P = 0.3 Home 227 (97.0%)† Centre 226 (97.0%)† P = 1.0 |
Home 161 (71.6%) Centre 164 (72.2%) P = 0.9 Home 177 (78.7%)* Centre 156 (68.7%)* P = 0.02 Home 195 (86.7%)** Centre 206 (90.7%)** P = 0.2 Home 214 (95.1%)+ Centre 220 (96.9%)+ P = 0.3 |
| Comments
| †number of nights *lipid lowering drugs | *antiplatelets & anticoagulants | *GP consultations |
|
|
| *ACEi or Angiotensin II receptor antagonist **cholesterol‐lowering drugs †Aspirin or antiplatelet drugs | |
| #P value calculated by authors of the present report | ||||||||
| Study | ||
| Follow up | 6 months | 12 months |
| Rehospitalisations N patient (%) Number Mean (SD) | Not reported | Number and length of admissions same between groups |
| Primary care Consultations Mean (SD) | Not reported | Not reported |
| Secondary prevention medication N patients (%) beta‐blockers ACE inhibitors Antihypertensives Statins Antiplatelets | Home: 8/14 (57%) Centre: 15/16 (94%) P = 0.02* Home: 1/14 (7%) Centre: 0/16 (0%) P = 0.28* Home: 6/14 (43%) Centre: 2/16 (13%) P = 0.07* Home: 14/14 (100%) Centre: 14/16 (100%) P = 0.18* | Not reported |
| Comments | ||
| *P value calculated by review authors | ||
| Outcome or subgroup title | No. of studies | No. of participants | Statistical method | Effect size |
| 1 Total mortality Show forest plot | 13 | 1505 | Risk Ratio (M‐H, Fixed, 95% CI) | 1.19 [0.65, 2.16] |
| 2 Exercise capacity ≤ 12 months Show forest plot | 26 | 2255 | Std. Mean Difference (IV, Random, 95% CI) | ‐0.13 [‐0.28, 0.02] |
| 3 Exercise capacity 12 to 24 months Show forest plot | 3 | 1074 | Std. Mean Difference (IV, Fixed, 95% CI) | 0.11 [‐0.01, 0.23] |
| 4 Completers Show forest plot | 26 | 2615 | Risk Ratio (M‐H, Random, 95% CI) | 1.04 [1.00, 1.08] |
| 5 Total cholesterol 3 to 12 months Show forest plot | 10 | 1151 | Mean Difference (IV, Random, 95% CI) | 0.06 [‐0.10, 0.23] |
| 6 HDL cholesterol 3 to 12 months Show forest plot | 8 | 925 | Mean Difference (IV, Fixed, 95% CI) | ‐0.07 [‐0.11, ‐0.03] |
| 7 LDL cholesterol 3 to 12 months Show forest plot | 6 | 430 | Mean Difference (IV, Random, 95% CI) | 0.04 [‐0.14, 0.22] |
| 8 Triglycerides 3 to 12 months Show forest plot | 6 | 396 | Mean Difference (IV, Fixed, 95% CI) | 0.15 [0.00, 0.29] |
| 9 Systolic blood pressure 3 to 12 months Show forest plot | 12 | 1292 | Mean Difference (IV, Random, 95% CI) | ‐0.27 [‐3.13, 2.60] |
| 10 Diastolic blood pressure 3 to 12 months Show forest plot | 11 | 1146 | Mean Difference (IV, Random, 95% CI) | 0.74 [‐1.04, 2.53] |
| 11 Smoking 3 to 12 months Show forest plot | 6 | 986 | Risk Ratio (M‐H, Fixed, 95% CI) | 1.02 [0.83, 1.27] |