| 1 Number of patients with >50% improvement of pain at 12 weeks or less Show forest plot | 3 | | Risk Ratio (M‐H, Fixed, 95% CI) | Subtotals only |
|
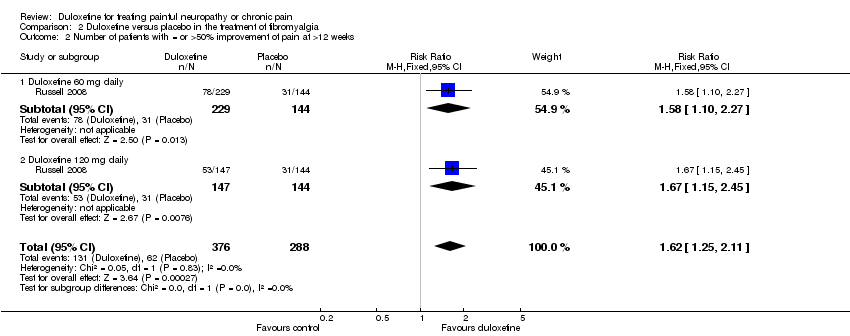
| 1.1 Duloxetine 20 mg daily | 1 | 213 | Risk Ratio (M‐H, Fixed, 95% CI) | 1.43 [0.98, 2.09] |
| 1.2 Duloxetine 60 mg daily | 3 | 655 | Risk Ratio (M‐H, Fixed, 95% CI) | 1.65 [1.34, 2.03] |
| 1.3 Duloxetine 120 mg daily | 3 | 655 | Risk Ratio (M‐H, Fixed, 95% CI) | 1.66 [1.35, 2.04] |
| 1.4 All doses | 3 | 1102 | Risk Ratio (M‐H, Fixed, 95% CI) | 1.63 [1.35, 1.97] |
| 2 Mean improvement in pain at 12 weeks or less Show forest plot | 3 | | Mean Difference (IV, Fixed, 95% CI) | Subtotals only |
|
| 2.1 Duloxetine 20 mg daily | 1 | 179 | Mean Difference (IV, Fixed, 95% CI) | ‐0.45 [‐1.05, 0.15] |
| 2.2 Duloxetine 60 mg daily | 3 | 618 | Mean Difference (IV, Fixed, 95% CI) | ‐1.04 [‐1.37, ‐0.71] |
| 2.3 Duloxetine 120 mg daily | 3 | 612 | Mean Difference (IV, Fixed, 95% CI) | ‐1.16 [‐1.49, ‐0.83] |
| 3 Number of patients with >30% improvement in pain at 12 weeks or less Show forest plot | 2 | | Risk Ratio (M‐H, Fixed, 95% CI) | Subtotals only |
|
| 3.1 Duloxetine 60 mg daily | 2 | 442 | Risk Ratio (M‐H, Fixed, 95% CI) | 1.53 [1.27, 1.83] |
| 3.2 Duloxetine 120 mg daily | 2 | 444 | Risk Ratio (M‐H, Fixed, 95% CI) | 1.55 [1.30, 1.86] |
| 3.3 All doses | 2 | 667 | Risk Ratio (M‐H, Fixed, 95% CI) | 1.54 [1.30, 1.82] |
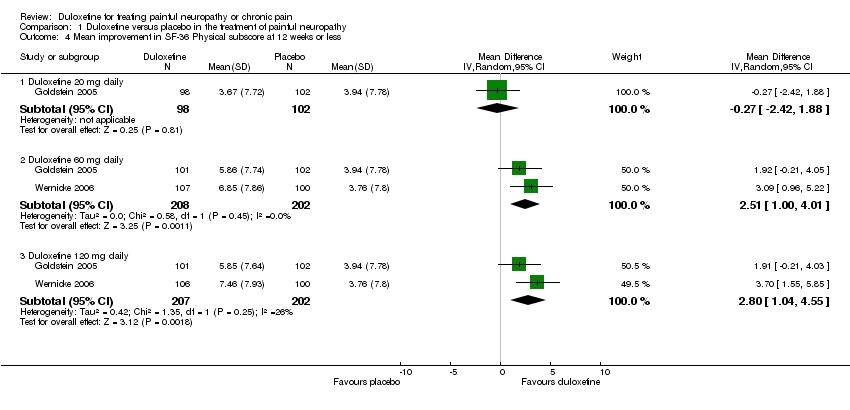
| 4 Mean improvement in SF‐36 Physical subscore at 12 weeks or less Show forest plot | 2 | | Mean Difference (IV, Random, 95% CI) | Subtotals only |
|
| 4.1 Duloxetine 20 mg daily | 1 | 200 | Mean Difference (IV, Random, 95% CI) | ‐0.27 [‐2.42, 1.88] |
| 4.2 Duloxetine 60 mg daily | 2 | 410 | Mean Difference (IV, Random, 95% CI) | 2.51 [1.00, 4.01] |
| 4.3 Duloxetine 120 mg daily | 2 | 409 | Mean Difference (IV, Random, 95% CI) | 2.80 [1.04, 4.55] |
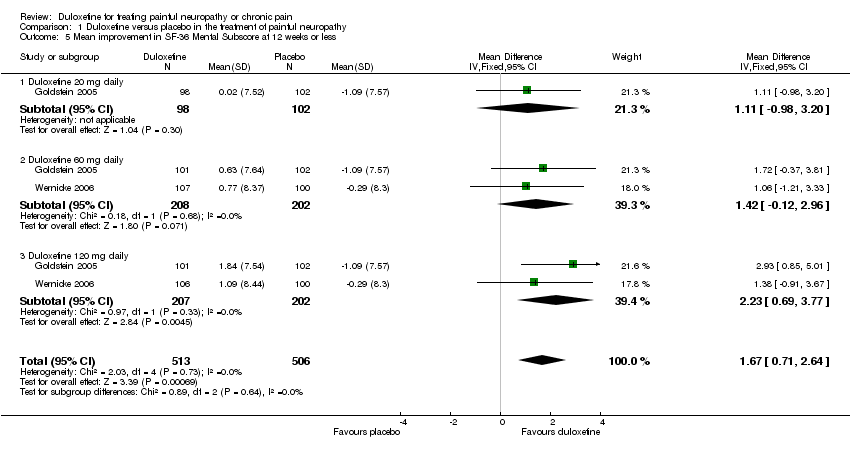
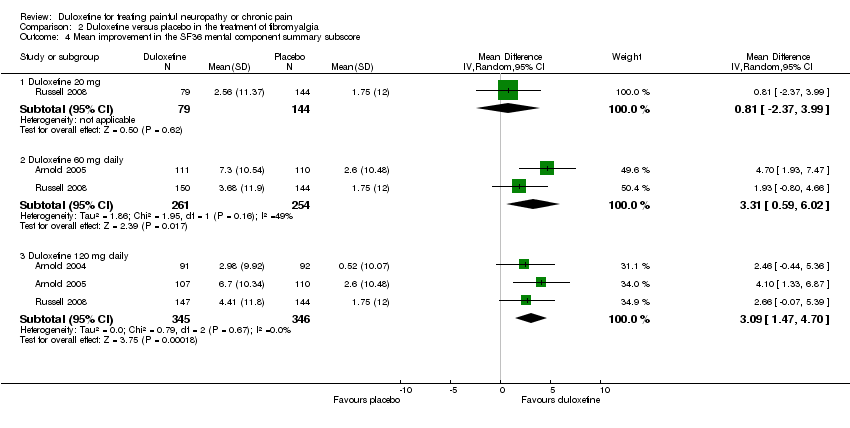
| 5 Mean improvement in SF‐36 Mental Subscore at 12 weeks or less Show forest plot | 2 | 1019 | Mean Difference (IV, Fixed, 95% CI) | 1.67 [0.71, 2.64] |
|
| 5.1 Duloxetine 20 mg daily | 1 | 200 | Mean Difference (IV, Fixed, 95% CI) | 1.11 [‐0.98, 3.20] |
| 5.2 Duloxetine 60 mg daily | 2 | 410 | Mean Difference (IV, Fixed, 95% CI) | 1.42 [‐0.12, 2.96] |
| 5.3 Duloxetine 120 mg daily | 2 | 409 | Mean Difference (IV, Fixed, 95% CI) | 2.23 [0.69, 3.77] |
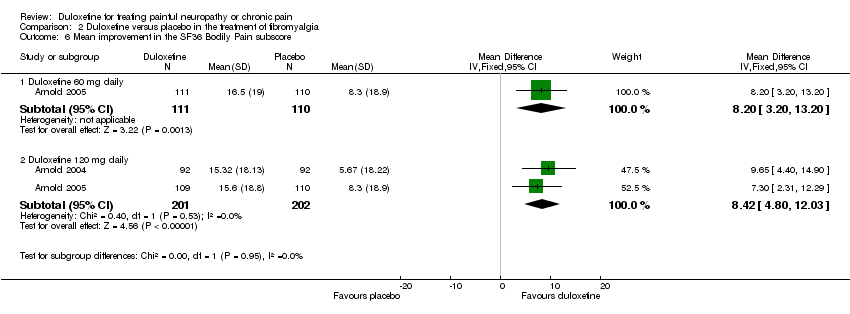
| 6 Mean improvement in SF‐36 Bodily Pain Subscore at 12 weeks or less Show forest plot | 2 | | Mean Difference (IV, Fixed, 95% CI) | Subtotals only |
|
| 6.1 Duloxetine 20 mg daily | 1 | 209 | Mean Difference (IV, Fixed, 95% CI) | 2.90 [‐2.37, 8.17] |
| 6.2 Duloxetine 60 mg daily | 2 | 421 | Mean Difference (IV, Fixed, 95% CI) | 5.58 [1.74, 9.42] |
| 6.3 Duloxetine 120 mg daily | 2 | 420 | Mean Difference (IV, Fixed, 95% CI) | 8.19 [4.33, 12.05] |
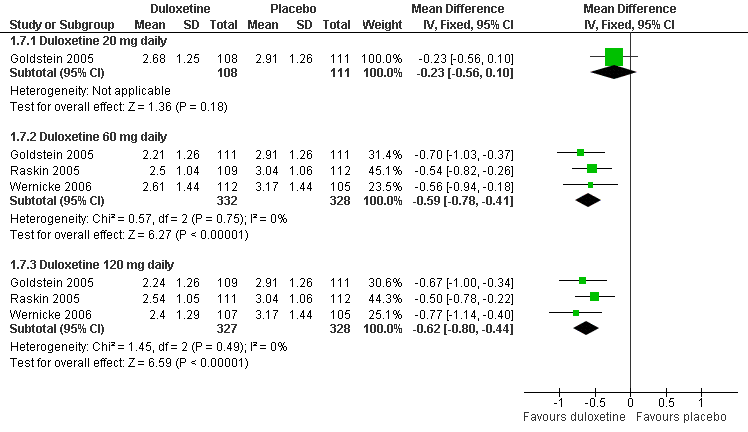
| 7 Mean improvement in Patient Reported Global Impression of Change at 12 weeks or less Show forest plot | 3 | | Mean Difference (IV, Fixed, 95% CI) | Subtotals only |
|
| 7.1 Duloxetine 20 mg daily | 1 | 219 | Mean Difference (IV, Fixed, 95% CI) | ‐0.23 [‐0.56, 0.10] |
| 7.2 Duloxetine 60 mg daily | 3 | 660 | Mean Difference (IV, Fixed, 95% CI) | ‐0.59 [‐0.78, ‐0.41] |
| 7.3 Duloxetine 120 mg daily | 3 | 655 | Mean Difference (IV, Fixed, 95% CI) | ‐0.62 [‐0.80, ‐0.44] |
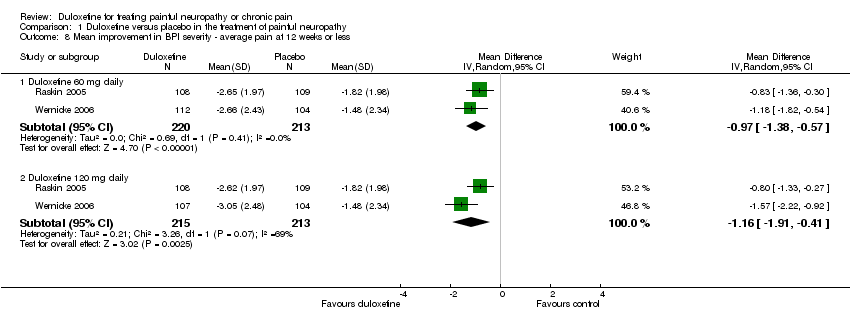
| 8 Mean improvement in BPI severity ‐ average pain at 12 weeks or less Show forest plot | 2 | | Mean Difference (IV, Random, 95% CI) | Subtotals only |
|
| 8.1 Duloxetine 60 mg daily | 2 | 433 | Mean Difference (IV, Random, 95% CI) | ‐0.97 [‐1.38, ‐0.57] |
| 8.2 Duloxetine 120 mg daily | 2 | 428 | Mean Difference (IV, Random, 95% CI) | ‐1.16 [‐1.91, ‐0.41] |
| 9 Mean improvement in pain at rest (night pain) at 12 weeks or less Show forest plot | 3 | | Mean Difference (IV, Random, 95% CI) | Subtotals only |
|
| 9.1 Duloxetine 20 mg daily | 1 | 222 | Mean Difference (IV, Random, 95% CI) | ‐0.28 [‐0.90, 0.34] |
| 9.2 Duloxetine 60 mg daily | 3 | 664 | Mean Difference (IV, Random, 95% CI) | ‐0.92 [‐1.27, ‐0.57] |
| 9.3 Duloxetine 120 mg daily | 3 | 664 | Mean Difference (IV, Random, 95% CI) | ‐1.10 [‐1.45, ‐0.75] |