Honey for acute cough in children
Información
- DOI:
- https://doi.org/10.1002/14651858.CD007094.pub4Copiar DOI

- Base de datos:
-
- Cochrane Database of Systematic Reviews
- Versión publicada:
-
- 23 diciembre 2014see what's new
- Tipo:
-
- Intervention
- Etapa:
-
- Review
- Grupo Editorial Cochrane:
-
Grupo Cochrane de Infecciones respiratorias agudas
- Copyright:
-
- Copyright © 2014 The Cochrane Collaboration. Published by John Wiley & Sons, Ltd.
Cifras del artículo
Altmetric:
Citado por:
Autores
Contributions of authors
Mrs Olabisi Oduwole (OO) prepared the main text of this update.
Dr Angela Oyo‐ita (AO) and OO wrote the methods section of the update.
Prof. Martin Meremikwu (MM), OO, AO and EU revised the text. Selection of studies was carried out by OO and Dr. Ekong Udoh (EU).
Data extraction was carried out by OO and AO.
All the review authors contributed to this update, and read and agreed to the final version.
Sources of support
Internal sources
-
No sources of support supplied
External sources
-
New Source of support, Other.
Declarations of interest
Olabisi Oduwole: none known.
Martin M Meremikwu: none known.
Angela Oyo‐Ita: none known.
Ekong E Udoh: none known.
Acknowledgements
The review authors wish to thank Liz Dooley and Sarah Thorning from the Cochrane ARI Group for their contributions. Also we would like to acknowledge the comments of the following referees: Matthew Thompson, Clare Jeffrey, Peter Molan, Jenny Wilkinson, David Gregory, Teresa Neeman, Mark Jones and Lisa Baniran. Finally, we wish to thank IM Paul, J Beiler, A McMonagle, ML Shaffer, L Duda and CM Berlin, authors of one of the included studies, for their prompt responses to our requests.
Version history
| Published | Title | Stage | Authors | Version |
| 2018 Apr 10 | Honey for acute cough in children | Review | Olabisi Oduwole, Ekong E Udoh, Angela Oyo‐Ita, Martin M Meremikwu | |
| 2014 Dec 23 | Honey for acute cough in children | Review | Olabisi Oduwole, Martin M Meremikwu, Angela Oyo‐Ita, Ekong E Udoh | |
| 2012 Mar 14 | Honey for acute cough in children | Review | Olabisi Oduwole, Martin M Meremikwu, Angela Oyo‐Ita, Ekong E Udoh | |
| 2010 Jan 20 | Honey for acute cough in children | Review | Olabisi Oduwole, Martin M Meremikwu, Angela Oyo‐Ita, Ekong E Udoh | |
| 2008 Apr 23 | Honey for acute cough in children | Protocol | Olabisi Oduwole, Martin M Meremikwu, Angela Oyo‐Ita, Ekong E Udoh | |
Differences between protocol and review
The age of participants in Cohen 2012 was one to five years (median 29 months; range 12 to 71 months). We decided to include this study because very few clinical trials are available on honey for acute cough in children. We also think that it is best for physicians to decide whether or not to prescribe honey to children of one year of age based on the available evidence.
Keywords
MeSH
Medical Subject Headings (MeSH) Keywords
- Albuterol [therapeutic use];
- Antitussive Agents [adverse effects, *therapeutic use];
- Apitherapy [adverse effects, *methods];
- Bromelains [therapeutic use];
- Bronchodilator Agents [therapeutic use];
- Cough [*therapy];
- Dextromethorphan [adverse effects, *therapeutic use];
- Diphenhydramine [adverse effects, *therapeutic use];
- Honey [adverse effects];
- Placebos [therapeutic use];
- Randomized Controlled Trials as Topic;
Medical Subject Headings Check Words
Adolescent; Child; Child, Preschool; Humans; Infant;
PICO

'Risk of bias' graph for included studies

'Risk of bias' summary: review authors' judgements about each risk of bias item for each included study.

Comparison 1 Pre‐ and postintervention comparison, Outcome 1 Cough frequency (mean improvement).
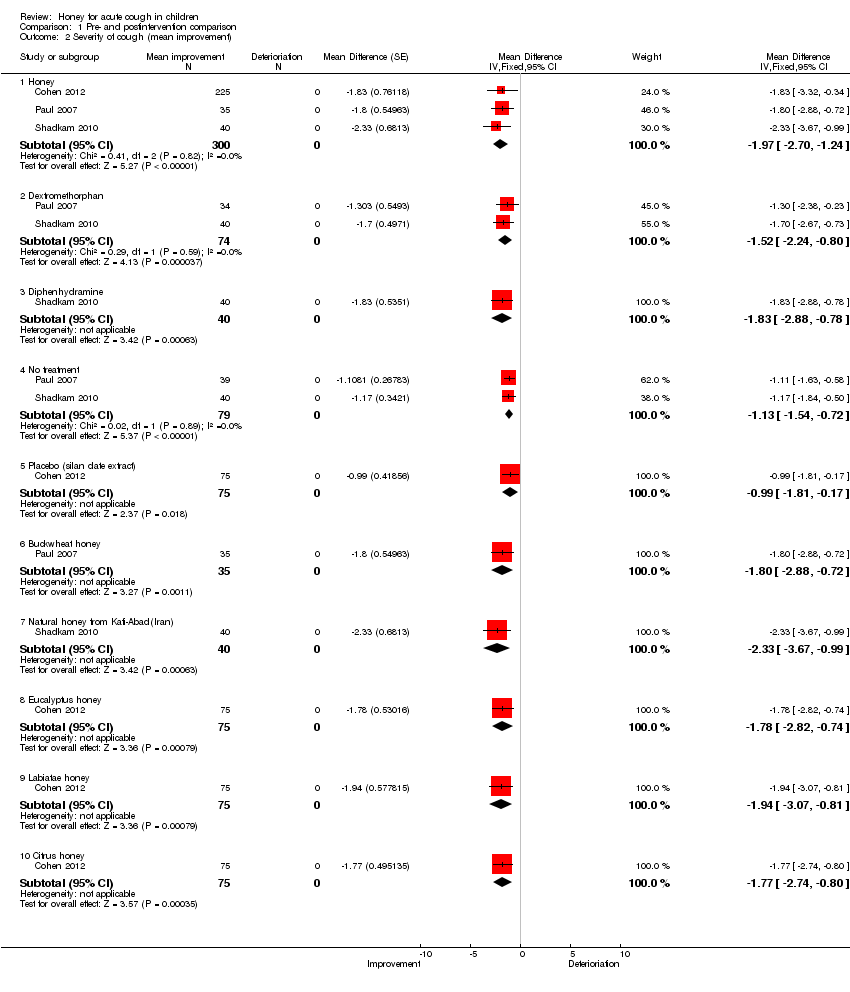
Comparison 1 Pre‐ and postintervention comparison, Outcome 2 Severity of cough (mean improvement).

Comparison 1 Pre‐ and postintervention comparison, Outcome 3 Bothersome cough (mean improvement) reduction.

Comparison 1 Pre‐ and postintervention comparison, Outcome 4 Children's sleep (cough impact on children's sleep score).
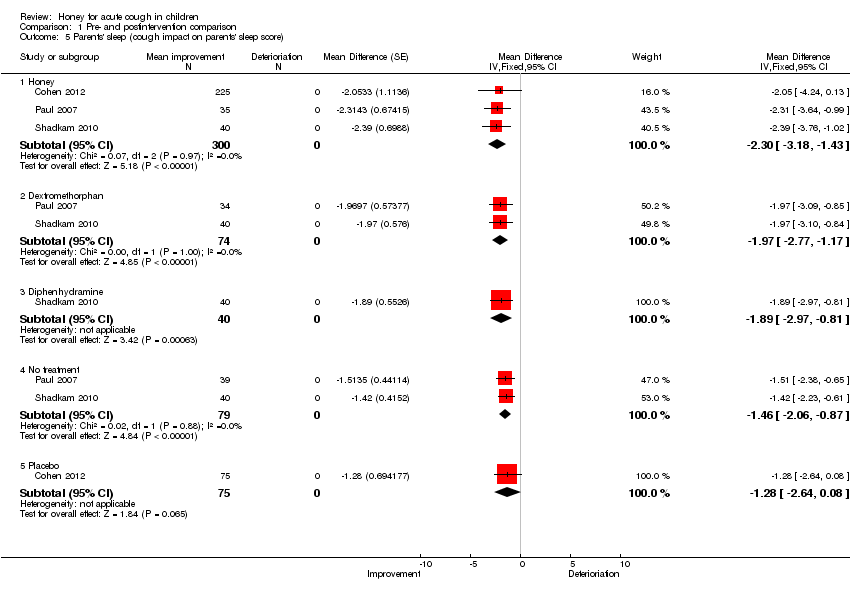
Comparison 1 Pre‐ and postintervention comparison, Outcome 5 Parents' sleep (cough impact on parents' sleep score).

Comparison 1 Pre‐ and postintervention comparison, Outcome 6 Combined improvement.

Comparison 2 Pair‐wise comparison, Outcome 1 Honey versus dextromethorphan.

Comparison 2 Pair‐wise comparison, Outcome 2 Honey versus diphenhydramine.

Comparison 2 Pair‐wise comparison, Outcome 3 Honey versus 'no treatment'.
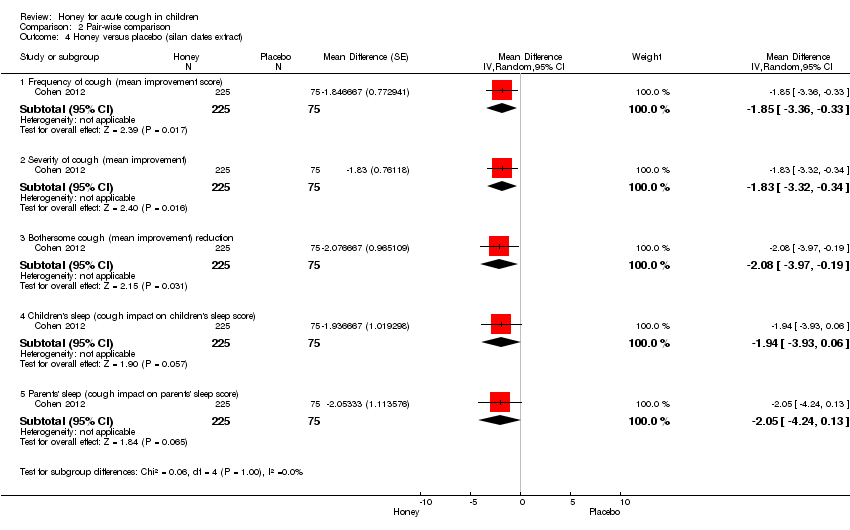
Comparison 2 Pair‐wise comparison, Outcome 4 Honey versus placebo (silan dates extract).
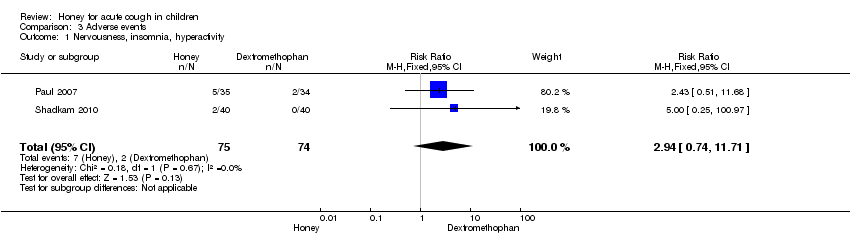
Comparison 3 Adverse events, Outcome 1 Nervousness, insomnia, hyperactivity.

Comparison 3 Adverse events, Outcome 2 Stomach ache, nausea and vomiting.
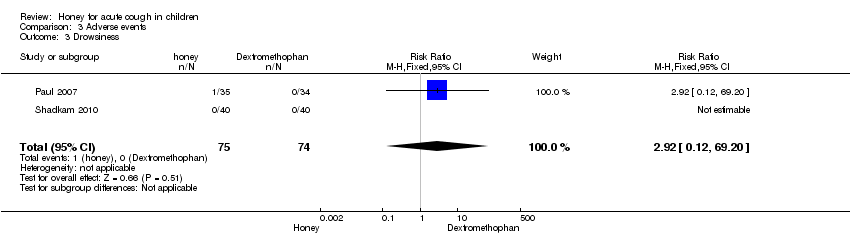
Comparison 3 Adverse events, Outcome 3 Drowsiness.
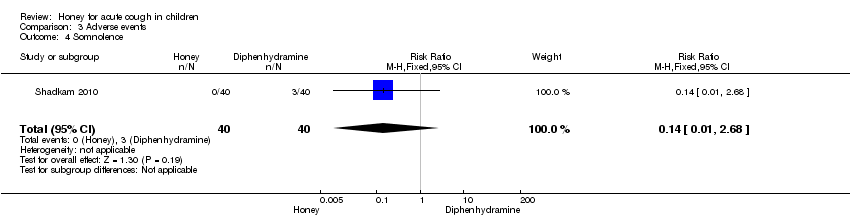
Comparison 3 Adverse events, Outcome 4 Somnolence.

Comparison 3 Adverse events, Outcome 5 Stomach ache, nausea and vomiting.
| Honey versus dextromethorphan | ||||||
| Patient or population: children with acute cough | ||||||
| Outcomes | Illustrative comparative risks* (95% CI) | Relative effect | No of participants | Quality of the evidence | Comments | |
| Assumed risk | Corresponding risk | |||||
| Dextromethorphan | Honey | |||||
| Cough frequency (mean improvement in symptom score) | The mean cough frequency (mean improvement in symptom score) in the control groups was | The mean cough frequency (mean improvement in symptom score) in the intervention groups was | 137 | ⊕⊕⊕⊝ | ||
| Cough severity (mean improvement in symptom score) | The mean cough severity (mean improvement in symptom score) in the control groups was | The mean cough severity (mean improvement in symptom score) in the intervention groups was | 137 | ⊕⊕⊕⊝ | ||
| Child's sleep (mean improvement score) | The mean child's sleep (mean improvement score) in the control groups was | The mean child's sleep (mean improvement score) in the intervention groups was | 137 | ⊕⊕⊕⊝ | ||
| Parents' sleep (mean improvement score) | The mean parents' sleep (mean improvement score) in the control groups was | The mean parents' sleep (mean improvement score) in the intervention groups was | 137 | ⊕⊕⊕⊝ | ||
| Improvement in quality of life: combined effect (mean improvement in symptom score) | The mean improvement in quality of life: combined effect (mean improvement in symptom score) in the control groups was | The mean improvement in quality of life: combined effect (mean improvement in symptom score) in the intervention groups was | 68 | ⊕⊕⊕⊕ | ||
| *The basis for the assumed risk (e.g. the median control group risk across studies) is provided in footnotes. The corresponding risk (and its 95% confidence interval) is based on the assumed risk in the comparison group and the relative effect of the intervention (and its 95% CI). | ||||||
| GRADE Working Group grades of evidence | ||||||
| 1It was unclear if Shadkam 2010 had allocation concealment and there was no blinding in the study, which could increase the risk of bias in the study outcomes, although there was allocation concealment and partial double‐blinding in Paul 2007. | ||||||
| Honey compared to diphenhydramine for acute cough in children | ||||||
| Patient or population: children with acute cough | ||||||
| Outcomes | Illustrative comparative risks* (95% CI) | Relative effect | No. of participants | Quality of the evidence | Comments | |
| Assumed risk | Corresponding risk | |||||
| Diphenhydramine | Honey | |||||
| Frequency of cough (mean improvement score) Scale from: 0 to 6 Follow‐up: mean 1 day | The mean frequency of cough (mean improvement) in the control groups was | The mean frequency of cough (mean improvement) in the intervention groups was 0.57 lower | 80 | ⊕⊕⊝⊝ | ||
| Severity of cough (mean improvement score) Scale from: 0 to 6 Follow‐up: mean 1 day | The mean severity of cough (mean improvement) in the control groups was | The mean severity of cough (mean improvement) in the intervention groups was 0.6 lower | 80 | ⊕⊕⊝⊝ | ||
| Children's sleep (cough impact on children's sleep score) Scale from: 0 to 6 Follow‐up: mean 1 day | The mean children's sleep quality (cough impact on children's sleep score) in the control groups was | The mean children's sleep quality (cough impact on children's sleep score) in the intervention groups was | 80 | ⊕⊕⊝⊝ | ||
| Parents' sleep (cough impact on parents' sleep score) Scale from: 0 to 6 Follow‐up: mean 1 day | The mean parents' sleep quality (cough impact on parents' sleep score) in the control groups was | The mean parents' sleep quality (cough impact on parents' sleep score) in the intervention groups was | 80 | ⊕⊕⊝⊝ | ||
| *The basis for the assumed risk (e.g. the median control group risk across studies) is provided in footnotes. The corresponding risk (and its 95%) is based on the assumed risk in the comparison group and the relative effect of the intervention (and its 95% CI). | ||||||
| GRADE Working Group grades of evidence | ||||||
| 1None of the treatment arms were blinded by Shadkam 2010 and allocation concealment was unclear. It was the same for the other outcomes. | ||||||
| Honey compared to 'no treatment' for acute cough in children | ||||||
| Patient or population: children with acute cough | ||||||
| Outcomes | Illustrative comparative risks* (95% CI) | Relative effect | No. of participants | Quality of the evidence | Comments | |
| Assumed risk | Corresponding risk | |||||
| 'No treatment' | Honey | |||||
| Frequency of cough (mean improvement score) Scale from: 0 to 6 Follow‐up: mean 1 day | The mean frequency of cough (mean improvement) in the control groups was | The mean frequency of cough (mean improvement score) in the intervention groups was | 154 | ⊕⊕⊕⊝ | ||
| Severity of cough (mean improvement score) Scale from: 0 to 6 Follow‐up: mean 1 day | The mean severity of cough (mean improvement) in the control groups was | The mean severity of cough (mean improvement) in the intervention groups was | 154 | ⊕⊕⊕⊝ | ||
| Bothersome cough (mean improvement score) Scale from: 0 to 6 Follow‐up: mean 1 day | The mean bothersome cough (mean improvement) in the control groups was | The mean bothersome cough (mean improvement) in the intervention groups was | 74 | ⊕⊕⊕⊝ | ||
| Childrens' sleep (cough impact on children's sleep score) Scale from: 0 to 6 Follow‐up: mean 1 day | The mean children's sleep quality (cough impact on children's sleep quality score) in the control groups was | The mean children's sleep quality (cough impact on children's sleep quality score) in the intervention groups was | 154 | ⊕⊕⊕⊝ | ||
| Parents' sleep (cough impact on parents' sleep score) Scale from: 0 to 6 Follow‐up: mean 1 day | The mean parents' sleep quality (cough impact on parents' sleep score) in the control groups was | The mean parents' sleep quality (cough impact on parents' sleep score) in the intervention groups was | 154 | ⊕⊕⊕⊝ | ||
| *The basis for the assumed risk (e.g. the median control group risk across studies) is provided in footnotes. The corresponding risk (and its 95% CI) is based on the assumed risk in the comparison group and the relative effect of the intervention (and its 95% CI). | ||||||
| GRADE Working Group grades of evidence | ||||||
| 1The 'no treatment' group were not blinded in either of the studies; allocation concealment was unclear in the Shadkam 2010 study. | ||||||
| Honey compared to placebo for acute cough in children | ||||||
| Patient or population: children with acute cough | ||||||
| Outcomes | Illustrative comparative risks* (95% CI) | Relative effect | No. of participants | Quality of the evidence | Comments | |
| Assumed risk | Corresponding risk | |||||
| Placebo | Honey | |||||
| Frequency of cough (mean improvement score) | The mean frequency of cough (mean improvement score) in the control groups was | The mean frequency of cough (mean improvement score) in the intervention groups was | 300 | ⊕⊕⊕⊕ | We downgraded quality of evidence to moderate because only 1 high quality RCT compared honey to placebo | |
| Severity of cough (mean improvement score) | The mean severity of cough (mean improvement score) in the control groups was | The mean severity of cough (mean improvement score) in the intervention groups was | 300 | ⊕⊕⊕⊕ | Downgraded (same reason as above) | |
| Bothersome cough | The mean bothersome cough in the control groups was | The mean bothersome cough in the intervention groups was | 300 | ⊕⊕⊕⊕ | Downgraded (same reason as above) | |
| Child's sleep (cough impact on child's sleep | The mean child's sleep (cough impact on child's sleep in the control groups was | The mean child's sleep (cough impact on child's sleep in the intervention groups was | 300 | ⊕⊕⊕⊕ | Downgraded (same reason as above) | |
| Parents' sleep (cough impact on parents' sleep score) | The mean parents' sleep (cough impact on parents' sleep score) in the control groups was | The mean parents' sleep (cough impact on parents' sleep score) in the intervention groups was | 300 | ⊕⊕⊕⊕ | Downgraded (same reason as above) | |
| *The basis for the assumed risk (e.g. the median control group risk across studies) is provided in footnotes. The corresponding risk (and its 95% confidence interval) is based on the assumed risk in the comparison group and the relative effect of the intervention (and its 95% CI). | ||||||
| GRADE Working Group grades of evidence | ||||||
| Adverse events | ||||||
| Patient or population: children with acute cough | ||||||
| Outcomes | Illustrative comparative risks* (95% CI) | Relative effect | No. of participants | Quality of the evidence | Comments | |
| Assumed risk | Corresponding risk | |||||
| Control | Honey | |||||
| Nervousness, insomnia, hyperactivity (honey versus dextromethorphan) | Study population | RR 2.94 | 149 | ⊕⊕⊕⊝ | ||
| 27 per 1000 | 79 per 1000 | |||||
| Moderate | ||||||
| 29 per 1000 | 85 per 1000 | |||||
| Stomach ache, nausea and vomiting (honey versus dextromethorphan) | Study population | RR 4.86 | 149 | ⊕⊕⊕⊝ | ||
| 0 per 1000 | 0 per 1000 | |||||
| Moderate | ||||||
| 0 per 1000 | 0 per 1000 | |||||
| Drowsiness (honey versus dextromethorphan) | Study population | RR 2.92 | 149 | ⊕⊕⊕⊝ | ||
| 0 per 1000 | 0 per 1000 | |||||
| Moderate | ||||||
| 0 per 1000 | 0 per 1000 | |||||
| Somnolence (honey versus diphenhydramine) | Study population | RR 0.14 | 80 | ⊕⊕⊕⊝ | ||
| 75 per 1000 | 10 per 1000 | |||||
| Moderate | ||||||
| 75 per 1000 | 10 per 1000 | |||||
| Stomach ache, nausea and vomiting (honey versus placebo) | Study population | RR 1.34 | 300 | ⊕⊕⊕⊕ | We downgraded the evidence because only 1 high quality RCT compared honey versus placebo | |
| 13 per 1000 | 18 per 1000 | |||||
| Moderate | ||||||
| *The basis for the assumed risk (e.g. the median control group risk across studies) is provided in footnotes. The corresponding risk (and its 95% confidence interval) is based on the assumed risk in the comparison group and the relative effect of the intervention (and its 95% CI). | ||||||
| GRADE Working Group grades of evidence | ||||||
| 1No explanation was provided. | ||||||
| Outcome or subgroup title | No. of studies | No. of participants | Statistical method | Effect size |
| 1 Cough frequency (mean improvement) Show forest plot | 3 | Mean Difference (Fixed, 95% CI) | Subtotals only | |
| 1.1 Honey | 3 | 300 | Mean Difference (Fixed, 95% CI) | ‐1.97 [‐2.68, ‐1.25] |
| 1.2 Dextromethorphan | 2 | 74 | Mean Difference (Fixed, 95% CI) | ‐1.49 [‐2.09, ‐0.88] |
| 1.3 Diphenhydramine | 1 | 40 | Mean Difference (Fixed, 95% CI) | ‐1.73 [‐2.72, ‐0.74] |
| 1.4 Placebo (silan dates extract) | 1 | 75 | Mean Difference (Fixed, 95% CI) | ‐1.0 [‐1.82, ‐0.18] |
| 1.5 No treatment | 2 | 79 | Mean Difference (Fixed, 95% CI) | ‐0.98 [‐1.38, ‐0.59] |
| 1.6 Buckwheat honey | 1 | 35 | Mean Difference (Fixed, 95% CI) | ‐1.89 [‐2.96, ‐0.81] |
| 1.7 Natural honey from Kafi‐Abad (Iran) | 1 | 40 | Mean Difference (Fixed, 95% CI) | ‐2.16 [‐3.40, ‐0.92] |
| 1.8 Eucalyptus honey | 1 | 75 | Mean Difference (Fixed, 95% CI) | ‐1.77 [‐3.22, ‐0.32] |
| 1.9 Labiatae honey | 1 | 75 | Mean Difference (Fixed, 95% CI) | ‐1.82 [‐3.30, ‐0.34] |
| 1.10 Citrus honey | 1 | 75 | Mean Difference (Fixed, 95% CI) | ‐1.95 [‐3.55, ‐0.35] |
| 2 Severity of cough (mean improvement) Show forest plot | 3 | Mean Difference (Fixed, 95% CI) | Subtotals only | |
| 2.1 Honey | 3 | 300 | Mean Difference (Fixed, 95% CI) | ‐1.97 [‐2.70, ‐1.24] |
| 2.2 Dextromethorphan | 2 | 74 | Mean Difference (Fixed, 95% CI) | ‐1.52 [‐2.24, ‐0.80] |
| 2.3 Diphenhydramine | 1 | 40 | Mean Difference (Fixed, 95% CI) | ‐1.83 [‐2.88, ‐0.78] |
| 2.4 No treatment | 2 | 79 | Mean Difference (Fixed, 95% CI) | ‐1.13 [‐1.54, ‐0.72] |
| 2.5 Placebo (silan date extract) | 1 | 75 | Mean Difference (Fixed, 95% CI) | ‐0.99 [‐1.81, ‐0.17] |
| 2.6 Buckwheat honey | 1 | 35 | Mean Difference (Fixed, 95% CI) | ‐1.80 [‐2.88, ‐0.72] |
| 2.7 Natural honey from Kafi‐Abad(Iran) | 1 | 40 | Mean Difference (Fixed, 95% CI) | ‐2.33 [‐3.67, ‐0.99] |
| 2.8 Eucalyptus honey | 1 | 75 | Mean Difference (Fixed, 95% CI) | ‐1.78 [‐2.82, ‐0.74] |
| 2.9 Labiatae honey | 1 | 75 | Mean Difference (Fixed, 95% CI) | ‐1.94 [‐3.07, ‐0.81] |
| 2.10 Citrus honey | 1 | 75 | Mean Difference (Fixed, 95% CI) | ‐1.77 [‐2.74, ‐0.80] |
| 3 Bothersome cough (mean improvement) reduction Show forest plot | 2 | Mean Difference (Fixed, 95% CI) | Subtotals only | |
| 3.1 Honey | 2 | 260 | Mean Difference (Fixed, 95% CI) | ‐2.18 [‐3.24, ‐1.13] |
| 3.2 Dextromethorphan | 1 | 34 | Mean Difference (Fixed, 95% CI) | ‐1.94 [‐3.05, ‐0.83] |
| 3.3 No treatment | 1 | 39 | Mean Difference (Fixed, 95% CI) | ‐1.30 [‐2.07, ‐0.53] |
| 3.4 Placebo | 1 | 75 | Mean Difference (Fixed, 95% CI) | ‐1.25 [‐2.39, ‐0.11] |
| 3.5 Buckwheat honey | 1 | 35 | Mean Difference (Fixed, 95% CI) | ‐2.23 [‐3.50, ‐0.96] |
| 3.6 Eucalyptus honey | 1 | 75 | Mean Difference (Fixed, 95% CI) | ‐2.0 [‐3.82, ‐0.18] |
| 3.7 Labiatae honey | 1 | 75 | Mean Difference (Fixed, 95% CI) | ‐2.07 [‐4.03, ‐0.11] |
| 3.8 Citrus honey | 1 | 75 | Mean Difference (Fixed, 95% CI) | ‐2.16 [‐4.20, ‐0.12] |
| 4 Children's sleep (cough impact on children's sleep score) Show forest plot | 3 | Mean Difference (Random, 95% CI) | Subtotals only | |
| 4.1 Honey | 3 | 300 | Mean Difference (Random, 95% CI) | ‐2.27 [‐3.13, ‐1.41] |
| 4.2 Dextromethorphan | 2 | 74 | Mean Difference (Random, 95% CI) | ‐1.75 [‐2.46, ‐1.04] |
| 4.3 Diphenhydramine | 1 | 40 | Mean Difference (Random, 95% CI) | ‐1.64 [‐2.58, ‐0.70] |
| 4.4 No treatment | 2 | 79 | Mean Difference (Random, 95% CI) | ‐1.28 [‐1.81, ‐0.76] |
| 4.5 Placebo | 1 | 75 | Mean Difference (Random, 95% CI) | ‐1.21 [‐2.46, 0.04] |
| 5 Parents' sleep (cough impact on parents' sleep score) Show forest plot | 3 | Mean Difference (Fixed, 95% CI) | Subtotals only | |
| 5.1 Honey | 3 | 300 | Mean Difference (Fixed, 95% CI) | ‐2.30 [‐3.18, ‐1.43] |
| 5.2 Dextromethorphan | 2 | 74 | Mean Difference (Fixed, 95% CI) | ‐1.97 [‐2.77, ‐1.17] |
| 5.3 Diphenhydramine | 1 | 40 | Mean Difference (Fixed, 95% CI) | ‐1.89 [‐2.97, ‐0.81] |
| 5.4 No treatment | 2 | 79 | Mean Difference (Fixed, 95% CI) | ‐1.46 [‐2.06, ‐0.87] |
| 5.5 Placebo | 1 | 75 | Mean Difference (Fixed, 95% CI) | ‐1.28 [‐2.64, 0.08] |
| 6 Combined improvement Show forest plot | 2 | Mean Difference (Fixed, 95% CI) | Subtotals only | |
| 6.1 Honey | 2 | 260 | Mean Difference (Fixed, 95% CI) | ‐9.11 [‐11.31, ‐6.90] |
| 6.2 Dextromethorphan | 1 | 34 | Mean Difference (Fixed, 95% CI) | ‐8.39 [‐10.95, ‐5.84] |
| 6.3 No treatment | 1 | 39 | Mean Difference (Fixed, 95% CI) | ‐6.41 [‐8.82, ‐3.99] |
| 6.4 Placebo | 1 | 75 | Mean Difference (Fixed, 95% CI) | ‐5.82 [‐10.76, ‐0.88] |
| Outcome or subgroup title | No. of studies | No. of participants | Statistical method | Effect size |
| 1 Honey versus dextromethorphan Show forest plot | 2 | Mean Difference (Random, 95% CI) | Subtotals only | |
| 1.1 Frequency of cough (mean improvement) | 2 | 149 | Mean Difference (Random, 95% CI) | ‐0.07 [‐1.07, 0.94] |
| 1.2 Severity of cough (mean improvement) | 2 | 149 | Mean Difference (Random, 95% CI) | ‐0.13 [‐1.25, 0.99] |
| 1.3 Bothersome cough (mean improvement) | 1 | 69 | Mean Difference (Random, 95% CI) | 0.29 [‐0.56, 1.14] |
| 1.4 Children's sleep (cough impact on children's sleep score) | 2 | 149 | Mean Difference (Random, 95% CI) | 0.03 [‐1.12, 1.19] |
| 1.5 Parents' sleep (cough impact on parents' sleep score) | 2 | 149 | Mean Difference (Random, 95% CI) | ‐0.16 [‐0.84, 0.53] |
| 1.6 Combined mean improvement | 1 | 69 | Mean Difference (Random, 95% CI) | 2.32 [‐1.24, 5.88] |
| 2 Honey versus diphenhydramine Show forest plot | 1 | Mean Difference (Random, 95% CI) | Subtotals only | |
| 2.1 Frequency of cough (mean improvement) | 1 | 80 | Mean Difference (Random, 95% CI) | ‐0.57 [‐0.90, ‐0.24] |
| 2.2 Severity of cough (mean improvement) | 1 | 80 | Mean Difference (Random, 95% CI) | ‐0.6 [‐0.94, ‐0.26] |
| 2.3 Children's sleep (cough impact on children's sleep score) | 1 | 80 | Mean Difference (Random, 95% CI) | ‐0.55 [‐0.87, ‐0.23] |
| 2.4 Parents' sleep (cough impact on parents' sleep score) | 1 | 80 | Mean Difference (Random, 95% CI) | ‐0.48 [‐0.76, ‐0.20] |
| 3 Honey versus 'no treatment' Show forest plot | 2 | Mean Difference (Random, 95% CI) | Subtotals only | |
| 3.1 Frequency of cough (mean improvement score) | 2 | 154 | Mean Difference (Random, 95% CI) | ‐1.05 [‐1.48, ‐0.62] |
| 3.2 Severity of cough (mean improvement) | 2 | 154 | Mean Difference (Random, 95% CI) | ‐1.03 [‐1.59, ‐0.47] |
| 3.3 Bothersome cough (mean improvement) | 1 | 74 | Mean Difference (Random, 95% CI) | ‐0.93 [‐1.98, 0.12] |
| 3.4 Children's sleep (cough impact on children's sleep score) | 2 | 154 | Mean Difference (Random, 95% CI) | ‐1.04 [‐1.57, ‐0.51] |
| 3.5 Parents' sleep (cough impact on parents' sleep score) | 2 | 154 | Mean Difference (Random, 95% CI) | ‐0.88 [‐1.23, ‐0.52] |
| 3.6 Combined mean improvement | 1 | 74 | Mean Difference (Random, 95% CI) | ‐4.31 [‐6.77, ‐1.85] |
| 4 Honey versus placebo (silan dates extract) Show forest plot | 1 | Mean Difference (Random, 95% CI) | Subtotals only | |
| 4.1 Frequency of cough (mean improvement score) | 1 | 300 | Mean Difference (Random, 95% CI) | ‐1.85 [‐3.36, ‐0.33] |
| 4.2 Severity of cough (mean improvement) | 1 | 300 | Mean Difference (Random, 95% CI) | ‐1.83 [‐3.32, ‐0.34] |
| 4.3 Bothersome cough (mean improvement) reduction | 1 | 300 | Mean Difference (Random, 95% CI) | ‐2.08 [‐3.97, ‐0.19] |
| 4.4 Children's sleep (cough impact on children's sleep score) | 1 | 300 | Mean Difference (Random, 95% CI) | ‐1.94 [‐3.93, 0.06] |
| 4.5 Parents' sleep (cough impact on parents' sleep score) | 1 | 300 | Mean Difference (Random, 95% CI) | ‐2.05 [‐4.24, 0.13] |
| Outcome or subgroup title | No. of studies | No. of participants | Statistical method | Effect size |
| 1 Nervousness, insomnia, hyperactivity Show forest plot | 2 | 149 | Risk Ratio (M‐H, Fixed, 95% CI) | 2.94 [0.74, 11.71] |
| 2 Stomach ache, nausea and vomiting Show forest plot | 2 | 149 | Risk Ratio (M‐H, Fixed, 95% CI) | 4.86 [0.24, 97.69] |
| 3 Drowsiness Show forest plot | 2 | 149 | Risk Ratio (M‐H, Fixed, 95% CI) | 2.92 [0.12, 69.20] |
| 4 Somnolence Show forest plot | 1 | 80 | Risk Ratio (M‐H, Fixed, 95% CI) | 0.14 [0.01, 2.68] |
| 5 Stomach ache, nausea and vomiting Show forest plot | 1 | 300 | Risk Ratio (M‐H, Fixed, 95% CI) | 1.33 [0.15, 11.74] |
| 5.1 Honey | 1 | 300 | Risk Ratio (M‐H, Fixed, 95% CI) | 1.33 [0.15, 11.74] |