| 1 Cough frequency (mean improvement) Show forest plot | 3 | | Mean Difference (Fixed, 95% CI) | Subtotals only |
|
| 1.1 Honey | 3 | 300 | Mean Difference (Fixed, 95% CI) | ‐1.97 [‐2.68, ‐1.25] |
| 1.2 Dextromethorphan | 2 | 74 | Mean Difference (Fixed, 95% CI) | ‐1.49 [‐2.09, ‐0.88] |
| 1.3 Diphenhydramine | 1 | 40 | Mean Difference (Fixed, 95% CI) | ‐1.73 [‐2.72, ‐0.74] |
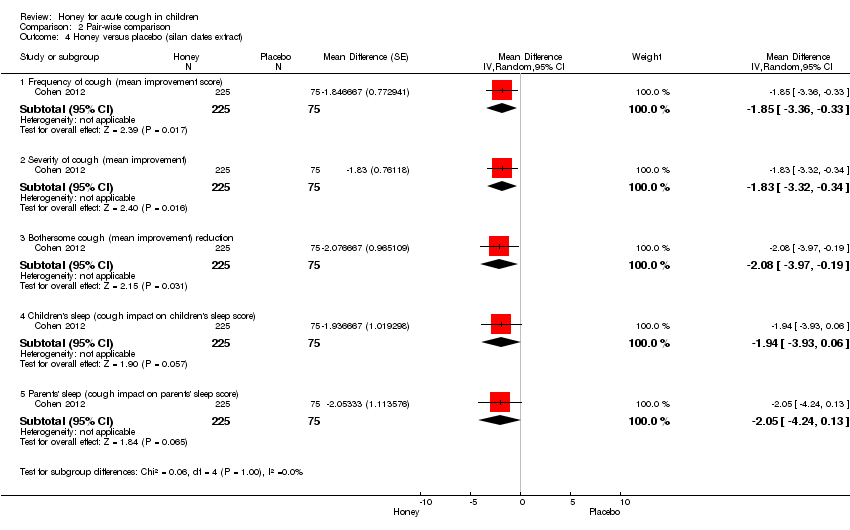
| 1.4 Placebo (silan dates extract) | 1 | 75 | Mean Difference (Fixed, 95% CI) | ‐1.0 [‐1.82, ‐0.18] |
| 1.5 No treatment | 2 | 79 | Mean Difference (Fixed, 95% CI) | ‐0.98 [‐1.38, ‐0.59] |
| 1.6 Buckwheat honey | 1 | 35 | Mean Difference (Fixed, 95% CI) | ‐1.89 [‐2.96, ‐0.81] |
| 1.7 Natural honey from Kafi‐Abad (Iran) | 1 | 40 | Mean Difference (Fixed, 95% CI) | ‐2.16 [‐3.40, ‐0.92] |
| 1.8 Eucalyptus honey | 1 | 75 | Mean Difference (Fixed, 95% CI) | ‐1.77 [‐3.22, ‐0.32] |
| 1.9 Labiatae honey | 1 | 75 | Mean Difference (Fixed, 95% CI) | ‐1.82 [‐3.30, ‐0.34] |
| 1.10 Citrus honey | 1 | 75 | Mean Difference (Fixed, 95% CI) | ‐1.95 [‐3.55, ‐0.35] |
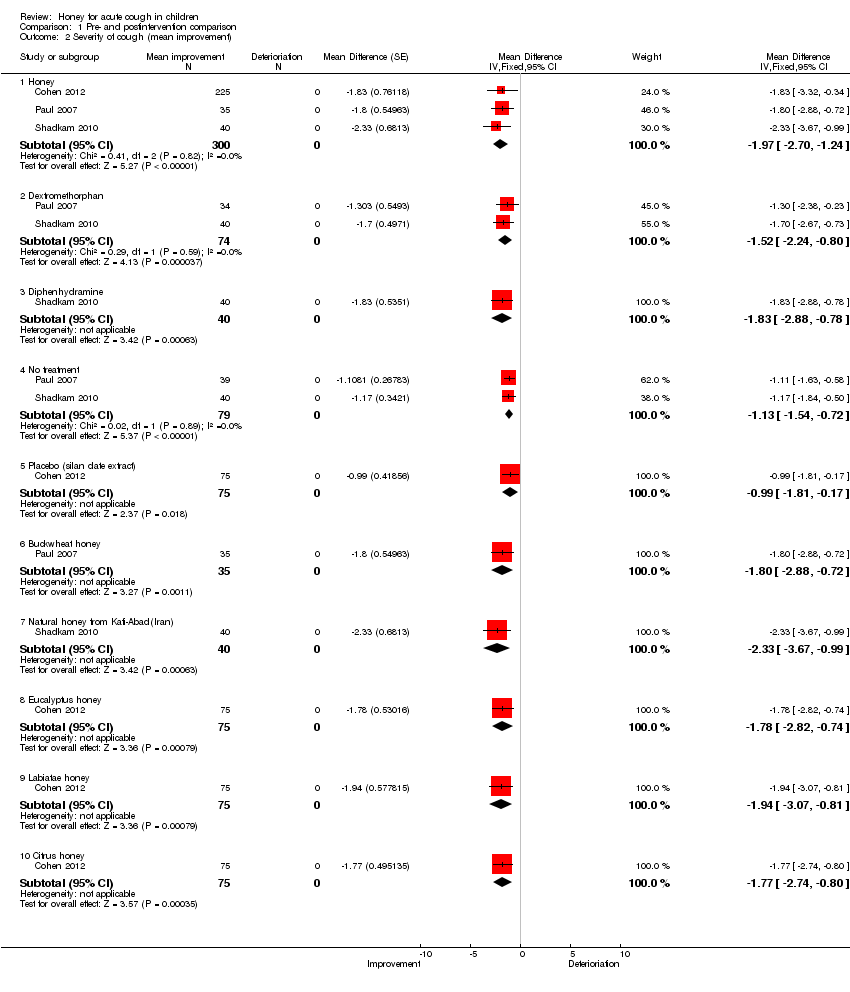
| 2 Severity of cough (mean improvement) Show forest plot | 3 | | Mean Difference (Fixed, 95% CI) | Subtotals only |
|
| 2.1 Honey | 3 | 300 | Mean Difference (Fixed, 95% CI) | ‐1.97 [‐2.70, ‐1.24] |
| 2.2 Dextromethorphan | 2 | 74 | Mean Difference (Fixed, 95% CI) | ‐1.52 [‐2.24, ‐0.80] |
| 2.3 Diphenhydramine | 1 | 40 | Mean Difference (Fixed, 95% CI) | ‐1.83 [‐2.88, ‐0.78] |
| 2.4 No treatment | 2 | 79 | Mean Difference (Fixed, 95% CI) | ‐1.13 [‐1.54, ‐0.72] |
| 2.5 Placebo (silan date extract) | 1 | 75 | Mean Difference (Fixed, 95% CI) | ‐0.99 [‐1.81, ‐0.17] |
| 2.6 Buckwheat honey | 1 | 35 | Mean Difference (Fixed, 95% CI) | ‐1.80 [‐2.88, ‐0.72] |
| 2.7 Natural honey from Kafi‐Abad(Iran) | 1 | 40 | Mean Difference (Fixed, 95% CI) | ‐2.33 [‐3.67, ‐0.99] |
| 2.8 Eucalyptus honey | 1 | 75 | Mean Difference (Fixed, 95% CI) | ‐1.78 [‐2.82, ‐0.74] |
| 2.9 Labiatae honey | 1 | 75 | Mean Difference (Fixed, 95% CI) | ‐1.94 [‐3.07, ‐0.81] |
| 2.10 Citrus honey | 1 | 75 | Mean Difference (Fixed, 95% CI) | ‐1.77 [‐2.74, ‐0.80] |
| 3 Bothersome cough (mean improvement) reduction Show forest plot | 2 | | Mean Difference (Fixed, 95% CI) | Subtotals only |
|
| 3.1 Honey | 2 | 260 | Mean Difference (Fixed, 95% CI) | ‐2.18 [‐3.24, ‐1.13] |
| 3.2 Dextromethorphan | 1 | 34 | Mean Difference (Fixed, 95% CI) | ‐1.94 [‐3.05, ‐0.83] |
| 3.3 No treatment | 1 | 39 | Mean Difference (Fixed, 95% CI) | ‐1.30 [‐2.07, ‐0.53] |
| 3.4 Placebo | 1 | 75 | Mean Difference (Fixed, 95% CI) | ‐1.25 [‐2.39, ‐0.11] |
| 3.5 Buckwheat honey | 1 | 35 | Mean Difference (Fixed, 95% CI) | ‐2.23 [‐3.50, ‐0.96] |
| 3.6 Eucalyptus honey | 1 | 75 | Mean Difference (Fixed, 95% CI) | ‐2.0 [‐3.82, ‐0.18] |
| 3.7 Labiatae honey | 1 | 75 | Mean Difference (Fixed, 95% CI) | ‐2.07 [‐4.03, ‐0.11] |
| 3.8 Citrus honey | 1 | 75 | Mean Difference (Fixed, 95% CI) | ‐2.16 [‐4.20, ‐0.12] |
| 4 Children's sleep (cough impact on children's sleep score) Show forest plot | 3 | | Mean Difference (Random, 95% CI) | Subtotals only |
|
| 4.1 Honey | 3 | 300 | Mean Difference (Random, 95% CI) | ‐2.27 [‐3.13, ‐1.41] |
| 4.2 Dextromethorphan | 2 | 74 | Mean Difference (Random, 95% CI) | ‐1.75 [‐2.46, ‐1.04] |
| 4.3 Diphenhydramine | 1 | 40 | Mean Difference (Random, 95% CI) | ‐1.64 [‐2.58, ‐0.70] |
| 4.4 No treatment | 2 | 79 | Mean Difference (Random, 95% CI) | ‐1.28 [‐1.81, ‐0.76] |
| 4.5 Placebo | 1 | 75 | Mean Difference (Random, 95% CI) | ‐1.21 [‐2.46, 0.04] |
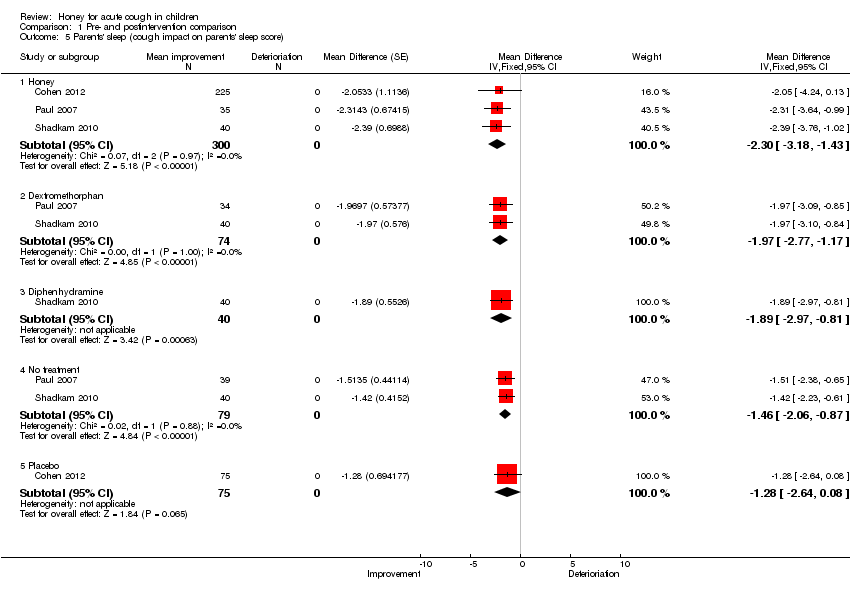
| 5 Parents' sleep (cough impact on parents' sleep score) Show forest plot | 3 | | Mean Difference (Fixed, 95% CI) | Subtotals only |
|
| 5.1 Honey | 3 | 300 | Mean Difference (Fixed, 95% CI) | ‐2.30 [‐3.18, ‐1.43] |
| 5.2 Dextromethorphan | 2 | 74 | Mean Difference (Fixed, 95% CI) | ‐1.97 [‐2.77, ‐1.17] |
| 5.3 Diphenhydramine | 1 | 40 | Mean Difference (Fixed, 95% CI) | ‐1.89 [‐2.97, ‐0.81] |
| 5.4 No treatment | 2 | 79 | Mean Difference (Fixed, 95% CI) | ‐1.46 [‐2.06, ‐0.87] |
| 5.5 Placebo | 1 | 75 | Mean Difference (Fixed, 95% CI) | ‐1.28 [‐2.64, 0.08] |
| 6 Combined improvement Show forest plot | 2 | | Mean Difference (Fixed, 95% CI) | Subtotals only |
|
| 6.1 Honey | 2 | 260 | Mean Difference (Fixed, 95% CI) | ‐9.11 [‐11.31, ‐6.90] |
| 6.2 Dextromethorphan | 1 | 34 | Mean Difference (Fixed, 95% CI) | ‐8.39 [‐10.95, ‐5.84] |
| 6.3 No treatment | 1 | 39 | Mean Difference (Fixed, 95% CI) | ‐6.41 [‐8.82, ‐3.99] |
| 6.4 Placebo | 1 | 75 | Mean Difference (Fixed, 95% CI) | ‐5.82 [‐10.76, ‐0.88] |