| 1 Success of surgery Show forest plot | 3 | 141 | Risk Ratio (M‐H, Random, 95% CI) | 0.99 [0.93, 1.06] |
|
| 2 Aesthetics Show forest plot | 1 | | Mean Difference (IV, Random, 95% CI) | Subtotals only |
|
| 2.1 Correctly identified treated tooth ‐ orthodontists | 1 | 67 | Mean Difference (IV, Random, 95% CI) | 2.70 [‐11.22, 16.62] |
| 2.2 Correctly identified treated tooth ‐ laypeople | 1 | 67 | Mean Difference (IV, Random, 95% CI) | 0.10 [‐8.42, 8.62] |
| 2.3 Unoperated canine looks best ‐ orthodontists | 1 | 67 | Mean Difference (IV, Random, 95% CI) | ‐0.30 [‐14.88, 14.28] |
| 2.4 Unoperated canine looks best ‐ lay people | 1 | 67 | Mean Difference (IV, Random, 95% CI) | ‐1.70 [‐15.69, 12.29] |
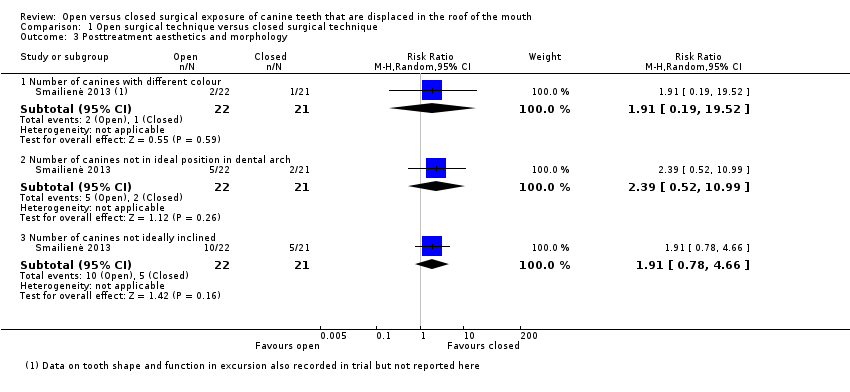
| 3 Posttreatment aesthetics and morphology Show forest plot | 1 | | Risk Ratio (M‐H, Random, 95% CI) | Subtotals only |
|
| 3.1 Number of canines with different colour | 1 | 43 | Risk Ratio (M‐H, Random, 95% CI) | 1.91 [0.19, 19.52] |
| 3.2 Number of canines not in ideal position in dental arch | 1 | 43 | Risk Ratio (M‐H, Random, 95% CI) | 2.39 [0.52, 10.99] |
| 3.3 Number of canines not ideally inclined | 1 | 43 | Risk Ratio (M‐H, Random, 95% CI) | 1.91 [0.78, 4.66] |
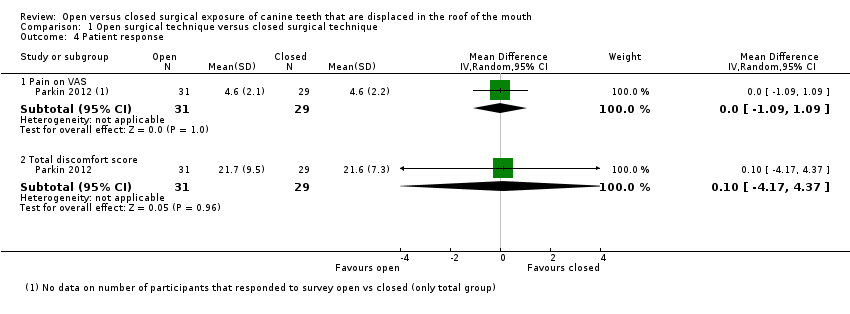
| 4 Patient response Show forest plot | 1 | | Mean Difference (IV, Random, 95% CI) | Subtotals only |
|
| 4.1 Pain on VAS | 1 | 60 | Mean Difference (IV, Random, 95% CI) | 0.0 [‐1.09, 1.09] |
| 4.2 Total discomfort score | 1 | 60 | Mean Difference (IV, Random, 95% CI) | 0.10 [‐4.17, 4.37] |
| 5 Pain (dichotomous) Show forest plot | 1 | | Risk Ratio (M‐H, Random, 95% CI) | Subtotals only |
|
| 5.1 Pain day 1 | 1 | 32 | Risk Ratio (M‐H, Random, 95% CI) | 0.86 [0.61, 1.20] |
| 5.2 Pain day 7 | 1 | 32 | Risk Ratio (M‐H, Random, 95% CI) | 0.0 [0.0, 0.0] |
| 6 Gum health Show forest plot | 2 | | Mean Difference (IV, Fixed, 95% CI) | Subtotals only |
|
| 6.1 Probing depths (mm) | 1 | 43 | Mean Difference (IV, Fixed, 95% CI) | ‐0.14 [‐0.48, 0.20] |
| 6.2 Bleeding on probing (PBI index) | 1 | 43 | Mean Difference (IV, Fixed, 95% CI) | 0.21 [‐0.14, 0.56] |
| 6.3 Clinical attachment loss (mm) | 1 | 62 | Mean Difference (IV, Fixed, 95% CI) | ‐0.10 [‐0.45, 0.25] |
| 6.4 Crestal bone levels mesial (%) | 1 | 43 | Mean Difference (IV, Fixed, 95% CI) | 3.21 [‐0.33, 6.75] |
| 6.5 Crestal bone levels distal (%) | 1 | 43 | Mean Difference (IV, Fixed, 95% CI) | ‐0.18 [‐3.09, 2.73] |
| 6.6 Gingival recession ‐ midbuccal | 2 | 105 | Mean Difference (IV, Fixed, 95% CI) | ‐0.02 [‐0.21, 0.16] |
| 6.7 Gingival recession ‐ midpalatal | 1 | 43 | Mean Difference (IV, Fixed, 95% CI) | 0.0 [0.0, 0.0] |
| 7 Gingival recession (dichotomous) Show forest plot | 1 | | Risk Ratio (M‐H, Random, 95% CI) | Subtotals only |
|
| 7.1 Midpalatal recession | 1 | 62 | Risk Ratio (M‐H, Random, 95% CI) | 1.32 [0.63, 2.77] |
| 8 Treatment time Show forest plot | 3 | | Mean Difference (IV, Random, 95% CI) | Subtotals only |
|
| 8.1 Length of time in surgery | 2 | 89 | Mean Difference (IV, Random, 95% CI) | ‐3.30 [‐9.97, 3.36] |
| 8.2 Time taken for eruption | 1 | 43 | Mean Difference (IV, Random, 95% CI) | ‐3.81 [‐5.80, ‐1.82] |
| 8.3 Length of fixed appliance phase | 1 | 43 | Mean Difference (IV, Random, 95% CI) | ‐3.77 [‐9.20, 1.66] |
| 9 Patient response (satisfaction) Show forest plot | 1 | | Risk Ratio (M‐H, Fixed, 95% CI) | Subtotals only |
|