Scolaris Content Display Scolaris Content Display

Study flow diagram for 2009 to 2013 literature searches.
Figuras y tablas -
Figure 1

Study flow diagram for 2009 to 2013 literature searches.

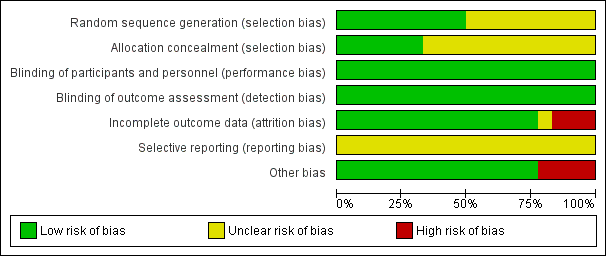
Methodological quality graph: review authors' judgements about each methodological quality item presented as percentages across all included studies.
Figuras y tablas -
Figure 2

Methodological quality graph: review authors' judgements about each methodological quality item presented as percentages across all included studies.

Methodological quality summary: review authors' judgements about each methodological quality item for each included study.
Figuras y tablas -
Figure 3

Methodological quality summary: review authors' judgements about each methodological quality item for each included study.

Forest plot of comparison: 1 hCG versus LH surge, outcome: 1.2 pregnancy rate per couple.
Figuras y tablas -
Figure 4

Forest plot of comparison: 1 hCG versus LH surge, outcome: 1.2 pregnancy rate per couple.

Forest plot of comparison: 2 u‐hCG versus r‐hCG, outcome: 2.2 pregnancy rate per couple.
Figuras y tablas -
Figure 5

Forest plot of comparison: 2 u‐hCG versus r‐hCG, outcome: 2.2 pregnancy rate per couple.

Forest plot of comparison: 2 u‐hCG versus r‐hCG, outcome: 2.4 miscarriage rate per pregnancy.
Figuras y tablas -
Figure 6

Forest plot of comparison: 2 u‐hCG versus r‐hCG, outcome: 2.4 miscarriage rate per pregnancy.

Forest plot of comparison: 3 short versus long interval, outcome: 3.2 pregnancy rate per couple.
Figuras y tablas -
Figure 7

Forest plot of comparison: 3 short versus long interval, outcome: 3.2 pregnancy rate per couple.

Forest plot of comparison: 3 short versus long interval, outcome: 3.3 miscarriage rate per pregnancy.
Figuras y tablas -
Figure 8

Forest plot of comparison: 3 short versus long interval, outcome: 3.3 miscarriage rate per pregnancy.

Forest plot of comparison: 4 hCG versus GnRH‐a, outcome: 4.1 live birth rate per couple.
Figuras y tablas -
Figure 9

Forest plot of comparison: 4 hCG versus GnRH‐a, outcome: 4.1 live birth rate per couple.

Forest plot of comparison: 4 hCG versus GnRH‐a, outcome: 4.2 pregnancy rate per couple.
Figuras y tablas -
Figure 10

Forest plot of comparison: 4 hCG versus GnRH‐a, outcome: 4.2 pregnancy rate per couple.

Forest plot of comparison: 4 hCG versus GnRH‐a, outcome: 4.3 multiple pregnancy rate per pregnancy.
Figuras y tablas -
Figure 11

Forest plot of comparison: 4 hCG versus GnRH‐a, outcome: 4.3 multiple pregnancy rate per pregnancy.

Forest plot of comparison: 4 hCG versus GnRH‐a, outcome: 4.4 miscarriage rate per pregnancy.
Figuras y tablas -
Figure 12

Forest plot of comparison: 4 hCG versus GnRH‐a, outcome: 4.4 miscarriage rate per pregnancy.

Comparison 1 hCG versus LH surge, Outcome 1 live birth rate per couple.
Figuras y tablas -
Analysis 1.1

Comparison 1 hCG versus LH surge, Outcome 1 live birth rate per couple.

Comparison 1 hCG versus LH surge, Outcome 2 pregnancy rate per couple.
Figuras y tablas -
Analysis 1.2

Comparison 1 hCG versus LH surge, Outcome 2 pregnancy rate per couple.

Comparison 1 hCG versus LH surge, Outcome 3 multiple pregnancy rate per pregnancy.
Figuras y tablas -
Analysis 1.3

Comparison 1 hCG versus LH surge, Outcome 3 multiple pregnancy rate per pregnancy.

Comparison 2 u‐hCG versus r‐hCG, Outcome 1 live birth rate per couple.
Figuras y tablas -
Analysis 2.1

Comparison 2 u‐hCG versus r‐hCG, Outcome 1 live birth rate per couple.

Comparison 2 u‐hCG versus r‐hCG, Outcome 2 pregnancy rate per couple.
Figuras y tablas -
Analysis 2.2

Comparison 2 u‐hCG versus r‐hCG, Outcome 2 pregnancy rate per couple.

Comparison 2 u‐hCG versus r‐hCG, Outcome 3 multiple pregnancy rate per pregnancy.
Figuras y tablas -
Analysis 2.3

Comparison 2 u‐hCG versus r‐hCG, Outcome 3 multiple pregnancy rate per pregnancy.

Comparison 2 u‐hCG versus r‐hCG, Outcome 4 miscarriage rate per pregnancy.
Figuras y tablas -
Analysis 2.4

Comparison 2 u‐hCG versus r‐hCG, Outcome 4 miscarriage rate per pregnancy.

Comparison 2 u‐hCG versus r‐hCG, Outcome 5 OHSS rate per cycle.
Figuras y tablas -
Analysis 2.5

Comparison 2 u‐hCG versus r‐hCG, Outcome 5 OHSS rate per cycle.

Comparison 3 Short versus long interval, Outcome 1 live birth rate per couple.
Figuras y tablas -
Analysis 3.1

Comparison 3 Short versus long interval, Outcome 1 live birth rate per couple.

Comparison 3 Short versus long interval, Outcome 2 pregnancy rate per couple.
Figuras y tablas -
Analysis 3.2

Comparison 3 Short versus long interval, Outcome 2 pregnancy rate per couple.

Comparison 3 Short versus long interval, Outcome 3 miscarriage rate per pregnancy.
Figuras y tablas -
Analysis 3.3

Comparison 3 Short versus long interval, Outcome 3 miscarriage rate per pregnancy.

Comparison 4 hCG versus GnRH‐a, Outcome 1 live birth rate per couple.
Figuras y tablas -
Analysis 4.1

Comparison 4 hCG versus GnRH‐a, Outcome 1 live birth rate per couple.

Comparison 4 hCG versus GnRH‐a, Outcome 2 pregnancy rate per couple.
Figuras y tablas -
Analysis 4.2

Comparison 4 hCG versus GnRH‐a, Outcome 2 pregnancy rate per couple.

Comparison 4 hCG versus GnRH‐a, Outcome 3 multiple pregnancy rate per pregnancy.
Figuras y tablas -
Analysis 4.3

Comparison 4 hCG versus GnRH‐a, Outcome 3 multiple pregnancy rate per pregnancy.

Comparison 4 hCG versus GnRH‐a, Outcome 4 miscarriage rate per pregnancy.
Figuras y tablas -
Analysis 4.4

Comparison 4 hCG versus GnRH‐a, Outcome 4 miscarriage rate per pregnancy.

Comparison 4 hCG versus GnRH‐a, Outcome 5 OHSS per cycle.
Figuras y tablas -
Analysis 4.5

Comparison 4 hCG versus GnRH‐a, Outcome 5 OHSS per cycle.

Comparison 5 Early hCG versus late hCG, Outcome 1 pregnancy rate per couple.
Figuras y tablas -
Analysis 5.1

Comparison 5 Early hCG versus late hCG, Outcome 1 pregnancy rate per couple.

Comparison 5 Early hCG versus late hCG, Outcome 2 miscarriage rate.
Figuras y tablas -
Analysis 5.2

Comparison 5 Early hCG versus late hCG, Outcome 2 miscarriage rate.

Comparison 6 Different dosages of hCG, Outcome 1 pregnancy rate per couple.
Figuras y tablas -
Analysis 6.1

Comparison 6 Different dosages of hCG, Outcome 1 pregnancy rate per couple.

Summary of findings for the main comparison. hCG compared to LH surge for intrauterine insemination in subfertile couples

hCG compared to LH surge for intrauterine insemination in subfertile couples

Population: women undergoing intrauterine insemination
Intervention: hCG
Comparison: LH surge

Outcomes

Illustrative comparative risks* (95% CI)

Relative effect
(95% CI)

No of participants
(studies)

Quality of the evidence
(GRADE)

Comments

Assumed risk

Corresponding risk

LH surge

HCG

Live birth rate per couple

83 per 1000

83 per 1000
(5 to 621)

OR 1
(0.06 to 18.08)

24
(1 study)

⊕⊝⊝⊝
very low1,2

Pregnancy rate per couple

146 per 1000

185 per 1000
(110 to 295)

OR 1.33
(0.72 to 2.45)

275
(4 studies)

⊕⊕⊝⊝
low1,3

Multiple pregnancy rate per pregnancy

59 per 1000

66 per 1000
(11 to 323)

OR 1.12
(0.17 to 7.6)

42
(2 studies)

⊕⊝⊝⊝
very low1,2

*The basis for the assumed risk was the median control group risk across studies. The corresponding risk (and its 95% confidence interval) is based on the assumed risk in the comparison group and the relative effect of the intervention (and its 95% CI).
CI: Confidence interval; OR: Odds ratio

GRADE Working Group grades of evidence
High quality: Further research is very unlikely to change our confidence in the estimate of effect.
Moderate quality: Further research is likely to have an important impact on our confidence in the estimate of effect and may change the estimate.
Low quality: Further research is very likely to have an important impact on our confidence in the estimate of effect and is likely to change the estimate.
Very low quality: We are very uncertain about the estimate.

1Methods used for random sequence generation and/or allocation concealment were unclear.

2There was very serious imprecision, with small sample sizes and very few events.

3There was serious imprecision: findings were compatible with substantial benefit in either group, or with no effect.

Figuras y tablas -
Summary of findings for the main comparison. hCG compared to LH surge for intrauterine insemination in subfertile couples
Summary of findings 2. u‐hCG compared to r‐hCG for intrauterine insemination in subfertile couples

u‐hCG compared to r‐hCG for intrauterine insemination in subfertile couples

Population: women undergoing intrauterine insemination
Intervention: u‐hCG
Comparison: r‐hCG

Outcomes

Illustrative comparative risks* (95% CI)

Relative effect
(95% CI)

No of participants
(studies)

Quality of the evidence
(GRADE)

Comments

Assumed risk

Corresponding risk

R‐hCG

U‐hCG

Live birth rate per couple

221 per 1000

249 per 1000
(162 to 365)

OR 1.17
(0.68 to 2.03)

284
(1 study)

⊕⊕⊝⊝
low1,2

Pregnancy rate per couple

261 per 1000

265 per 1000
(187 to 357)

OR 1.02
(0.65 to 1.57)

409
(2 studies)

⊕⊕⊝⊝
low2,3

Multiple pregnancy rate per pregnancy

184 per 1000

182 per 1000
(83 to 358)

OR 0.99
(0.4 to 2.47)

109
(2 studies)

⊕⊕⊝⊝
low2,3

Miscarriage rate per pregnancy

84 per 1000

50 per 1000
(12 to 185)

OR 0.57
(0.13 to 2.47)

109
(2 studies)

⊕⊝⊝⊝
very low2,3,4

OHSS rate per cycle

See comment

See comment

Not estimable

468
(2 studies)

⊕⊕⊕⊝
moderate3

There were no events in either study

*The basis for the assumed risk was the median control group risk across studies. The corresponding risk (and its 95% confidence interval) is based on the assumed risk in the comparison group and the relative effect of the intervention (and its 95% CI).
CI: Confidence interval; OR: Odds ratio

GRADE Working Group grades of evidence
High quality: Further research is very unlikely to change our confidence in the estimate of effect.
Moderate quality: Further research is likely to have an important impact on our confidence in the estimate of effect and may change the estimate.
Low quality: Further research is very likely to have an important impact on our confidence in the estimate of effect and is likely to change the estimate.
Very low quality: We are very uncertain about the estimate.

1Methods used for random sequence generation and/or allocation concealment were unclear.

2There was serious imprecision: findings were compatible with substantial benefit in either group, or with no effect.

3One study did not report the method of allocation concealment used.

4There was very serious imprecision, with very few events and wide confidence intervals.

Figuras y tablas -
Summary of findings 2. u‐hCG compared to r‐hCG for intrauterine insemination in subfertile couples
Summary of findings 3. Short interval compared to long interval for intrauterine insemination in subfertile couples

Short interval compared to long interval for intrauterine insemination in subfertile couples

Population: women undergoing intrauterine insemination
Intervention: short interval
Comparison: long interval

Outcomes

Illustrative comparative risks* (95% CI)

Relative effect
(95% CI)

No of participants
(studies)

Quality of the evidence
(GRADE)

Comments

Assumed risk

Corresponding risk

Long interval

Short interval

Live birth rate per couple ‐ 24 hours versus 34 to 36 hours

298 per 1000

181 per 1000 (103 to 298)

OR 0.52
(0.27 to 1)

204
(1 study)

⊕⊕⊝⊝
low1,2

Pregnancy rate per couple ‐ 24 hours versus 34 to 36 hours

397 per 1000

266 per 1000
(170 to 392)

OR 0.55
(0.31 to 0.98)

234
(2 studies)

⊕⊕⊝⊝
low1,2

Pregnancy rate per couple ‐ 24 hours versus 48 hours

600 per 1000

398 per 1000
(130 to 742)

OR 0.44
(0.1 to 1.92)

30
(1 study)

⊕⊕⊝⊝
low1,2

Pregnancy rate per couple ‐ 34 to 36 hours versus 48 hours

600 per 1000

465 per 1000
(174 to 788)

OR 0.58
(0.14 to 2.48)

30
(1 study)

⊕⊕⊝⊝
low1,2

Miscarriage rate per pregnancy ‐ 24 hours versus 34 to 36 hours

116 per 1000

172 per 1000
(44 to 484)

OR 1.58
(0.35 to 7.16)

67
(2 studies)

⊕⊝⊝⊝
very low1,3

Miscarriage rate per pregnancy ‐ 24 hours versus 48 hours

111 per 1000

333 per 1000
(33 to 880)

OR 4
(0.27 to 58.56)

15
(1 study)

⊕⊝⊝⊝
very low1,3

Miscarriage rate per pregnancy ‐ 34 to 36 hours versus 48 hours

111 per 1000

142 per 1000
(9 to 764)

OR 1.33
(0.07 to 25.91)

16
(1 study)

⊕⊝⊝⊝
very low1,2

*The basis for the assumed risk was the median control group risk across studies. The corresponding risk (and its 95% confidence interval) is based on the assumed risk in the comparison group and the relative effect of the intervention (and its 95% CI).
CI: Confidence interval; OR: Odds ratio

GRADE Working Group grades of evidence
High quality: Further research is very unlikely to change our confidence in the estimate of effect.
Moderate quality: Further research is likely to have an important impact on our confidence in the estimate of effect and may change the estimate.
Low quality: Further research is very likely to have an important impact on our confidence in the estimate of effect and is likely to change the estimate.
Very low quality: We are very uncertain about the estimate.

1Methods used for random sequence generation or allocation concealment were unclear.

2There was serious imprecision: findings were compatible with substantial benefit in the long interval group, or with no effect. (See comment)
3There was very serious imprecision, with very few events and wide confidence intervals

Figuras y tablas -
Summary of findings 3. Short interval compared to long interval for intrauterine insemination in subfertile couples
Summary of findings 4. hCG compared to GnRH‐a for intrauterine insemination in subfertile couples

hCG compared to GnRH‐a for intrauterine insemination in subfertile couples

Population: women undergoing intrauterine insemination
Intervention: hCG
Comparison: GnRH‐a

Outcomes

Illustrative comparative risks* (95% CI)

Relative effect
(95% CI)

No of participants
(studies)

Quality of the evidence
(GRADE)

Comments

Assumed risk

Corresponding risk

GnRH‐a

HCG

Live birth rate per couple

200 per 1000

206 per 1000
(95 to 390)

OR 1.04
(0.42 to 2.56)

104
(3 studies)

⊕⊕⊝⊝
low1,2

Pregnancy rate per couple

315 per 1000

344 per 1000
(225 to 489)

OR 1.14
(0.63 to 2.08)

206
(4 studies)

⊕⊕⊝⊝
low1,2

Multiple pregnancy rate per pregnancy

33 per 1000

5 per 1000
(1 to 45)

OR 0.15
(0.02 to 1.38)

74
(4 studies)

⊕⊝⊝⊝
very low1,3

Miscarriage rate per pregnancy

124 per 1000

196 per 1000
(64 to 467)

OR 1.72
(0.48 to 6.2)

74
(4 studies)

⊕⊝⊝⊝
very low1,3

OHSS per cycle

0 per 1000

0 per 1000
(0 to 0)

OR 2.27
(0.65 to 7.91)

456
(3 studies)

⊕⊕⊝⊝
low1,2

*The basis for the assumed risk was the median control group risk across studies. The corresponding risk (and its 95% confidence interval) is based on the assumed risk in the comparison group and the relative effect of the intervention (and its 95% CI).
CI: Confidence interval; OR: Odds ratio

GRADE Working Group grades of evidence
High quality: Further research is very unlikely to change our confidence in the estimate of effect.
Moderate quality: Further research is likely to have an important impact on our confidence in the estimate of effect and may change the estimate.
Low quality: Further research is very likely to have an important impact on our confidence in the estimate of effect and is likely to change the estimate.
Very low quality: We are very uncertain about the estimate.

1Methods used for random sequence generation and allocation concealment were unclear.
2There was serious imprecision: findings were compatible with substantial benefit in either group, or with no effect.

3There was very serious imprecision, with very few events and wide confidence intervals.

Figuras y tablas -
Summary of findings 4. hCG compared to GnRH‐a for intrauterine insemination in subfertile couples
Summary of findings 5. Early hCG compared to late hCG for intrauterine insemination in subfertile couples

Early hCG compared to late hCG for intrauterine insemination in subfertile couples

Population: women undergoing intrauterine insemination
Intervention: Early hCG
Comparison: Late hCG

Outcomes

Illustrative comparative risks* (95% CI)

Relative effect
(95% CI)

No of participants
(studies)

Quality of the evidence
(GRADE)

Comments

Assumed risk

Corresponding risk

Late hCG

Early hCG

Pregnancy rate per couple

86 per 1000

110 per 1000
(68 to 175)

OR 1.32
(0.77 to 2.25)

612
(1 study)

⊕⊕⊝⊝
low1,2

Miscarriage rate

103 per 1000

55 per 1000
(9 to 274)

OR 0.51
(0.08 to 3.28)

65
(1 study)

⊕⊝⊝⊝
very low1,3

*The basis for the assumed risk (e.g. the median control group risk across studies) is provided in footnotes. The corresponding risk (and its 95% confidence interval) is based on the assumed risk in the comparison group and the relative effect of the intervention (and its 95% CI).
CI: Confidence interval; OR: Odds ratio

GRADE Working Group grades of evidence
High quality: Further research is very unlikely to change our confidence in the estimate of effect.
Moderate quality: Further research is likely to have an important impact on our confidence in the estimate of effect and may change the estimate.
Low quality: Further research is very likely to have an important impact on our confidence in the estimate of effect and is likely to change the estimate.
Very low quality: We are very uncertain about the estimate.

1Unclear risk of attrition bias.

2There was serious imprecision: findings were compatible with substantial benefit in the early hCG group, or with no effect.

3There was very serious imprecision, with very few events and wide confidence intervals.

Figuras y tablas -
Summary of findings 5. Early hCG compared to late hCG for intrauterine insemination in subfertile couples
Summary of findings 6. Differing dosages of hCG for intrauterine insemination in subfertile couples

Differing dosages of hCG for intrauterine insemination in subfertile couples

Population: women undergoing intrauterine insemination
Intervention: differing dosages of hCG: 500 µg hCG versus 250 µg hCG

Outcomes

Illustrative comparative risks* (95% CI)

Relative effect
(95% CI)

No of participants
(studies)

Quality of the evidence
(GRADE)

Comments

Assumed risk

Corresponding risk

250 µg hCG

500 µg hCG

Pregnancy rate per couple

91 per 1000

121 per 1000
(27 to 402)

OR 1.38
(0.28 to 6.71)

66
(1 study)

⊕⊝⊝⊝
very low1,2

*The basis for the assumed risk was the median control group risk across studies. The corresponding risk (and its 95% confidence interval) is based on the assumed risk in the comparison group and the relative effect of the intervention (and its 95% CI).
CI: Confidence interval; OR: Odds ratio

GRADE Working Group grades of evidence
High quality: Further research is very unlikely to change our confidence in the estimate of effect.
Moderate quality: Further research is likely to have an important impact on our confidence in the estimate of effect and may change the estimate.
Low quality: Further research is very likely to have an important impact on our confidence in the estimate of effect and is likely to change the estimate.
Very low quality: We are very uncertain about the estimate.

1Methods of random sequence generation and allocation concealment were unclear, high risk of attrition bias.

2There was very serious imprecision, with very few events and wide confidence intervals.

Figuras y tablas -
Summary of findings 6. Differing dosages of hCG for intrauterine insemination in subfertile couples
Comparison 1. hCG versus LH surge

Outcome or subgroup title

No. of studies

No. of participants

Statistical method

Effect size

1 live birth rate per couple Show forest plot

1

24

Odds Ratio (M‐H, Fixed, 95% CI)

1.0 [0.06, 18.08]

2 pregnancy rate per couple Show forest plot

4

275

Odds Ratio (M‐H, Fixed, 95% CI)

1.33 [0.72, 2.45]

3 multiple pregnancy rate per pregnancy Show forest plot

2

42

Odds Ratio (M‐H, Fixed, 95% CI)

1.13 [0.17, 7.60]

Figuras y tablas -
Comparison 1. hCG versus LH surge
Comparison 2. u‐hCG versus r‐hCG

Outcome or subgroup title

No. of studies

No. of participants

Statistical method

Effect size

1 live birth rate per couple Show forest plot

1

Odds Ratio (M‐H, Fixed, 95% CI)

Totals not selected

2 pregnancy rate per couple Show forest plot

2

409

Odds Ratio (M‐H, Fixed, 95% CI)

1.02 [0.65, 1.57]

3 multiple pregnancy rate per pregnancy Show forest plot

2

109

Odds Ratio (M‐H, Fixed, 95% CI)

0.99 [0.40, 2.47]

4 miscarriage rate per pregnancy Show forest plot

2

109

Odds Ratio (M‐H, Fixed, 95% CI)

0.57 [0.13, 2.47]

5 OHSS rate per cycle Show forest plot

2

468

Odds Ratio (M‐H, Fixed, 95% CI)

0.0 [0.0, 0.0]

Figuras y tablas -
Comparison 2. u‐hCG versus r‐hCG
Comparison 3. Short versus long interval

Outcome or subgroup title

No. of studies

No. of participants

Statistical method

Effect size

1 live birth rate per couple Show forest plot

1

Odds Ratio (M‐H, Fixed, 95% CI)

Totals not selected

1.1 24 hours versus 34‐36 hours

1

Odds Ratio (M‐H, Fixed, 95% CI)

0.0 [0.0, 0.0]

2 pregnancy rate per couple Show forest plot

2

Odds Ratio (M‐H, Fixed, 95% CI)

Subtotals only

2.1 24 hours versus 34‐36 hours

2

234

Odds Ratio (M‐H, Fixed, 95% CI)

0.55 [0.31, 0.98]

2.2 24 hours versus 48 hours

1

30

Odds Ratio (M‐H, Fixed, 95% CI)

0.44 [0.10, 1.92]

2.3 34‐36 hours versus 48 hours

1

30

Odds Ratio (M‐H, Fixed, 95% CI)

0.58 [0.14, 2.48]

3 miscarriage rate per pregnancy Show forest plot

2

Odds Ratio (M‐H, Fixed, 95% CI)

Subtotals only

3.1 24 hours versus 34‐36 hours

2

67

Odds Ratio (M‐H, Fixed, 95% CI)

1.58 [0.35, 7.16]

3.2 24 hours versus 48 hours

1

15

Odds Ratio (M‐H, Fixed, 95% CI)

4.0 [0.27, 58.56]

3.3 34‐36 hours versus 48 hours

1

16

Odds Ratio (M‐H, Fixed, 95% CI)

1.33 [0.07, 25.91]

Figuras y tablas -
Comparison 3. Short versus long interval
Comparison 4. hCG versus GnRH‐a

Outcome or subgroup title

No. of studies

No. of participants

Statistical method

Effect size

1 live birth rate per couple Show forest plot

3

104

Odds Ratio (M‐H, Fixed, 95% CI)

1.04 [0.42, 2.56]

2 pregnancy rate per couple Show forest plot

4

206

Odds Ratio (M‐H, Fixed, 95% CI)

1.14 [0.63, 2.08]

3 multiple pregnancy rate per pregnancy Show forest plot

4

74

Odds Ratio (M‐H, Fixed, 95% CI)

0.15 [0.02, 1.38]

4 miscarriage rate per pregnancy Show forest plot

4

74

Odds Ratio (M‐H, Fixed, 95% CI)

1.72 [0.48, 6.20]

5 OHSS per cycle Show forest plot

3

456

Odds Ratio (M‐H, Fixed, 95% CI)

2.27 [0.65, 7.91]

Figuras y tablas -
Comparison 4. hCG versus GnRH‐a
Comparison 5. Early hCG versus late hCG

Outcome or subgroup title

No. of studies

No. of participants

Statistical method

Effect size

1 pregnancy rate per couple Show forest plot

1

612

Odds Ratio (M‐H, Fixed, 95% CI)

1.32 [0.77, 2.25]

2 miscarriage rate Show forest plot

1

65

Odds Ratio (M‐H, Fixed, 95% CI)

0.51 [0.08, 3.28]

Figuras y tablas -
Comparison 5. Early hCG versus late hCG
Comparison 6. Different dosages of hCG

Outcome or subgroup title

No. of studies

No. of participants

Statistical method

Effect size

1 pregnancy rate per couple Show forest plot

1

66

Odds Ratio (M‐H, Fixed, 95% CI)

1.38 [0.28, 6.71]

Figuras y tablas -
Comparison 6. Different dosages of hCG