| Table 2. Description of interventions and quality of included studies |
| Trial setting | Trial | Study duration from baseline | Intervention duration | Follow‐up assessments | Details of intervention sessions & format | Intervention type, aims and components | Delivered by | Intervention dosage¹ Minimal 1‐2 sessions Moderate 3‐5 Medium High 6‐10 High > 10 Behaviour Management² = BM | Intervention Information to enable replication of trial. 1. Procedural clarity 2. Manual /protocol 3. Treatment fidelity assessments 4. Follow‐up |
| Family Care | Teri 2003 | 24 months | 3 months | Post intervention = 3 months. Follow‐up data for: Problem Behaviour (PB) Frequency & Caregiver (CG) Reaction = 6 months; Patient Depression = 6, 12, 18 & 24. | 12 x 1 hour sessions, 2 per week for 3 weeks, Weekly for 4 weeks and biweekly for 4 weeks, plus 3 follow‐up sessions | CG Skills Training Intervention Aims: CGs taught to identify and modify patient behaviours that impaired day‐to‐day function and adversely affected CR/CG interactions. Taught how to reduce the occurrences of PB, learn skills to identify and modify precipitants of patient distress. Exercise and Education | Health care professionals delivered sessions (doesn't state how many) Trainers supervised by clinical geropsychologist (received weekly supervision). | High | 1. Reported what components were included in the intervention; but detail on which components were addressed in each hour long session is absent. 2. Treatment protocol/manual 3. Treatment adherence was monitored by weekly supervision of each trainer by a clinical geropsychologist. Protocol sessions videotaped and reviewed by independent raters 4. Followed up to 24 months. |
| Zarit 1987 | 24 months | 2 months | Post‐intervention = 2 months Follow‐up = 12 months (data not available) | 8 sessions, the last used for Post‐intervention assessment | CG Support Intervention Aims: Stress‐ Coping Model. Training teach CG to modify situations linked to stress, increase understanding of patient disease, improve management of PBs and identify useful formal and informal supports | 2 Therapists for each group. | Medium High | 1. The paper reports what usually occurred in the second session of the intervention, but does not state each session’s agenda. 2. Conceived from a stress‐management approach treatment model, but no mention of a manual. 3. Interventions monitored using audiotapes and supervision sessions to ensure therapists implemented treatment approach. 4. 2 Year longitudinal study but only post‐intervention (2 month) data available. |
| Gitlin 2003 | 12 months | 6 months | Post‐intervention = 6 months Follow‐up = 12 months (data not extractable) | Active phase: First 6 months, 5 (90 min) home contacts, 1 (30 min) telephone contact. Maintenance Phase: Subsequent 6 months | CG Skills Training Intervention Problem solving Intervention Includes: modifying home environments and simplifying daily tasks to address CG concerns; Education, Problem solving, Use of environmental strategies | Occupational therapist (does not state how many) | Moderate | 1. The paper reports what happens in each intervention session as run by the OT. 2. Protocol 3. Interventions monitored using case review, feedback, checklist & telephone interviews to evaluate satisfaction 4. The paper reports 6 month post‐intervention assessment, but not the results of the 12 month follow‐up. |
| Farran 2004 | 18 months | 3 months | Post‐intervention = 3 months Follow‐up = 6, 9, 12 & 18 months | 12 x weekly sessions (5 group, 7 individual) 2 group booster sessions at 6 & 12 months + as needed telephone contacts | CG Skills Training Intervention Aims: Improve CG skill in dealing with PB. Content included: Potential causes/contributors to behavioural symptoms, prevention & management of BPSD, building self efficacy. | Trained professionals (nurses, social workers) trained for 40 hours. 4 people functioned as intervention staff at any one time. | High | 1. Paper reports contents of intervention but not each session in detail. 2. Detailed manual of prescribed material for each session 3. Project director and principal investigator supervised implementation & provided corrective feedback on a weekly basis. Group sessions were taped and randomly selected for review. 4. All follow‐up data up to 18 months available. |
| Moniz‐Cook 2008a | 18 months | 18 months | Post‐intervention = 6 Follow‐up = 12 & 18 months | 4 consecutive weekly in home visits + clinical judgement for future contact & attend in‐service clinical supervision for the 18 month duration. (Interventions were taught prior to the study over 5 half days) | CG Support Intervention Aims: To train community mental health nurses (CMHNs) to help family carers manage behavioural changes. Includes: Problem solving approaches, Stress‐coping interventions and Functional analysis. | 9 CMHNs (usual group 20 CMHNs) ‐ 20 hrs training initially plus supervision 2 hrs per week for 1st 6 months, 1 per fortnight for next 6 months, 1 per month for last 5 months. | High | 1. The total number of sessions or content of the sessions is not reported. 2. Protocol for CMHNs to conduct 4 in‐home visits & attend supervision. No manual. 3. Only two CMHNs with dementia specific caseloads completed the ongoing supervision and adhered to the four consecutive family treatment sessions. 4. Follow‐up data for 6, 12 & 18 months |
| Burgio 2003 | 18 months | 12 months | Post‐intervention = 6 months Follow‐up data not available | 16 in‐home treatment sessions (over 12 month period). Skill Training condition vs. Minimal Support Condition. 3 hour workshop, 4 weekly in home visits for 1 month & 2 in the second month. In the following 10 months home visits were alternated. | CG Skills Training Aims: To establish a knowledge base for CGs in behaviour management, problem solving, & cognitive restructuring. Basic information in behaviour management techniques (BMT) & support on the application of behavioural and environmental treatments. Individual behaviour prescriptions. | 11 REACH interventionists. | High | 1. Reports the intervention procedure & components covered. 2. Manual guided intervention based on common needs and cultural preferences of American family caregivers. Manual available from authors. 3. Research personnel functioned as both interventionists and assessors. Feedback on accuracy was provided in weekly clinical case review meetings. All therapeutic contacts were audio taped to check accuracy of delivery. 4. Only 6 month data reported. |
| Teri 2000/ Weiner 2002 | 12 months | 4 months | Post‐intervention = 4 months Follow‐up = 12 months (Weiner 2002) | BMT 8 weekly and 3 biweekly sessions. 16 week parallel design requiring 11 clinical visits. Randomisation to medication, BMT or placebo. | Behaviour Management Aims: Compare Behaviour Management Techniques – BMT‐ with pharmacological treatments for agitation. BMT included: information about AD, strategies for decreasing agitated behaviours. | Therapists with a master’s degree and 1 year clinical experience (doesn't state how many therapists) | High BM | 1. BMT intervention sessions not reported in detail. Paper only reports number and components of sessions. 2. Protocol 3. Raters participated in ongoing training to assure standardisation. All were trained prior to starting the trial. 4. Post‐treatment data only reported; Weiner 2002 reports 12 month follow‐up. |
| Gitlin 2010 | 6 months | 4 months | Post‐intervention = 4 months Follow‐up = 6 months | Up to 11 home & telephone contacts over 16 weeks. Up to 9 occupational therapy (OT) sessions, two nursing home (one home and one telephone) and a maintenance phase of 3 brief OT telephone contacts. | CG Support Intervention Aims: To help eliminate, reduce or prevent problem behaviours within 3 interacting domains: ‐ Patient based (unmet need, discomfort, pain), Caregiver based (stress & communication style) & Environment based (clutter, hazards). | 10 OTs & 2 practice nurses received 35 hours training | High | 1. Reports what took place during the intervention but not a specific outline for each session. 2. No mention of a manual. 3. Treatment fidelity maintained through twice monthly meetings & audiotapes of 10% of home sessions. Each home session was documented in terms of time spent & content covered. 4. Four and six month follow‐up. |
| Teri 2005a | 6 months | 2 months | Post‐intervention = 2 months Follow‐up = 6 months | 8 weekly sessions followed by 4 monthly phone calls | CG Support Intervention Aims: To teach family CGs a systematic behavioural approach for reducing mood and behaviour problems in persons with AD. Teaching ABC rationale and use Improving CG communication Increasing pleasant events, enhancing CG support. | 5 community consultants – trained by clinical gero‐psychologist. ‐ 2 hour orientation, 2nd training session & pilot case. | High | 1. Paper reports on the contents of each treatment session 2.Treatment manual 3. Protocol, Audio taped treatment sessions and rated quality 4. Post‐test and 6 month follow‐up. |
| Huang 2003 | 12 Weeks | 3 Weeks (main phase) | Post‐intervention = 3 weeks Follow‐up = 12 weeks | 2 in home sessions over 3 weeks, plus telephone calls every 2 weeks. | CG Skills Training Intervention Aims: Conceptually built around the Progressively Lowered Stress Threshold (PLST) model. Helping CGs identify the timing & frequency of behavioural problems & explore the causative stressors. Plan environmental and daily schedule modifications. Nurse caregiver collaboration with individualised training to develop individual plans of care. | Investigator – Experienced Gerontological nurse | Minimal | 1. The paper reports what was conducted by the investigator on each visit. 2. Manual developed by research team as a guide for the training program 3. It is not reported whether there were any checks to insure adherence to the manual, however the principal investigator wrote the manual and conducted the intervention. 4. Followed 12 weeks from baseline. |
| Gormley 2001 | 10 Weeks | 8 Weeks | Post‐intervention = 10 weeks No follow‐up | 4 sessions conducted over 8 weeks. | Behaviour Management Training Aims: To train CGs in: Dementia education & the development of behavioural interventions by behavioural analysis. CGs taught to identify the precipitating & maintaining factors of behaviour. | Conducted by author. | Moderate BM | 1. The paper reports what the 1st, 2nd and subsequent sessions focused on. 2. No mention of manual, the program was developed following a review of guidelines and descriptive studies 3. The paper does not report information on treatment fidelity checks. 4. No follow‐up |
| Losada‐Baltar 2004 | 5 months | 2months | Post‐intervention = 2 months Follow‐up = 5 months | 8 Sessions, 2 hours per week (16 hour in total) | CG Skills Training Intervention Aims: To train CGs in modifying behavioural problems of their relative through: Managing challenging behaviours, defining & identifying the problems, possible causes (ABC) and develop strategies and solutions. | Two psychologists | Medium High | 1. States the components of the intervention but not which components were implemented in each session. 2. Due to difficulty translating the paper we are unsure if a manual was used. 3. Unsure regarding treatment fidelity checks 4. Followed up 5 months from Baseline. |
| Gonyea 2006 | 6 Weeks | 5 Weeks | Post‐intervention = 6 weeks No follow‐up | 5 weekly group sessions (90 mins) including 15 minutes of individual time. | CG Support Intervention Aims: CG multi‐component behavioural intervention to reduce CG distress through: Behavioural management (identifying ABC), Pleasant events & Relaxation. | Therapists (16‐20 hours training). | Moderate | 1. Session topics outlined 2. Highly structured groups with 5 main themes documented in the paper. 3. To monitor treatment fidelity the principle investigator consulted with therapists on a regular basis to review the group session experience and assess group progress. 4. No follow‐up |
| Assisted Living | Teri 2005b | 2 months | 2 months | Post‐intervention = 2 months No follow‐up | 2 half day group workshops and 4 individualised sessions | CG Skills Training Intervention Aims: To reinforce values of dignity and respect for residents, improve staff responsiveness to resident needs, build specific staff skills to enhance resident care, improve job skill and satisfaction. | Clinical psychologist & graduate student in nursing. | Medium High | 1. The paper reports all the essential components and features of the intervention. 2. Manual detailing all specific aspects of training. 3. Three separate meetings were held to discuss site specific issues that might hinder implementation or sustainability. 4. No follow‐up. |
| Residential Care | Fossey 2006 | 12 months | 10 months | Post‐intervention = 12 months No follow‐up | Trial clinician worked with homes 2 days a week over 10 months | CG Skills Training Intervention Aims: Training in the delivery of Person‐centred care and Skills development training. Included: skills training, behavioural management techniques (ABC) and ongoing training and support | Psychologist, occupational therapist or nurse – supervised weekly by authors. | High | 1. Reports the components of the intervention but detail of each session. 2. No mention of a manual just reference to a specific ‘package’ of components. 3. Staff offered supervision but no report assessing treatment fidelity. Reports the intervention took a consultation approach. 4. 10 month intervention with 12 month follow‐up (for the purposes of this review classed as post‐intervention assessment). No other follow‐ups. |
| Chenoweth 2009 | 8 months | 4 months | Post‐intervention = 4 months Follow‐up = 8 months | Training was delivered to 2 care staff selected by managers for 6 hours per day over 2 days, trained staff then helped their colleagues to implement care plans over the 4 month intervention period | Dementia Care Mapping and Caregiver Skills Training Aims: Person centred care Need‐driven behaviour model. where staff are educated to Included: Understand behaviour as a form of communication; recognise that feelings persist despite cognitive impairment; behaviour is a way of expressing needs; understand the impact of staff actions and use of ABC | 3 authors trained by Bradford University led training. | High | 1. Details of the interventions components are reported, but additional information was required from the author to clarify the intervention content before this trial could be included into the review. 2. Bradford University training manual 3. No detail on checking adherence to the manual or treatment fidelity. 4. Follow‐up at 8 months from baseline. |
| Proctor 1999 | 6 months | 6 months | Post‐intervention = 6 months No follow‐up | 7 x 1 hour seminars delivered by hospital outreach team. An experienced psychiatric nurse visited every week to give advice and support individual workers in care planning. | Behaviour Management Aims: Staff training and psychosocial management of residents PB. Includes: Formulation of detailed and specific care plans & increasing the interval between non‐contingent interactions (not in response to need) | Hospital outreach team & psychiatric nurse | Medium High BM | 1. The paper reports only the components of each of the seminars 2.No report of a manual 3. No reports of checking treatment fidelity or adherence. 4. No follow‐up. |
| Hospital Care | Mador 2004 | 9 Days | 9 Days | Post‐intervention = 9 days No follow‐up | Extended Practice Nurse (EPN) saw patients within 24 hours of randomisation and formulation of a non‐pharmacological management plan of strategies to manage challenging behaviour. Assumption that Control condition Geriatric assessment was also | Behaviour Management Aims: Specialist support and education to the ward nursing staff to enable them to facilitate behaviour strategies. Included: Understanding patients needs, patient safety, minimising restraint usage, communication, nursing care & targeted behavioural strategies. | ? Geriatrician review as in Control Group + Extended practice nurse and ward staff. | High BM | 1. The paper reports the components of the intervention only. 2. No mention of a manual 3. No reporting of assessments of treatment fidelity and adherence 4. No long‐term follow‐up |
| ¹ = Intervention dosage is based on the number of contact sessions, not the amount of functional analysis |
| ² = Intervention focused on Behaviour Management with relatively few other components |

![Forest plot of comparison: 1 Functional analysis versus usual care ‐ primary outcomes at post‐intervention, outcome: 1.1 Incidence of problem behaviours ‐ family care only. [Instruments used: RMPBC]](/es/cdsr/doi/10.1002/14651858.CD006929.pub2/media/CDSR/CD006929/image_n/nCD006929-AFig-FIG02.png)
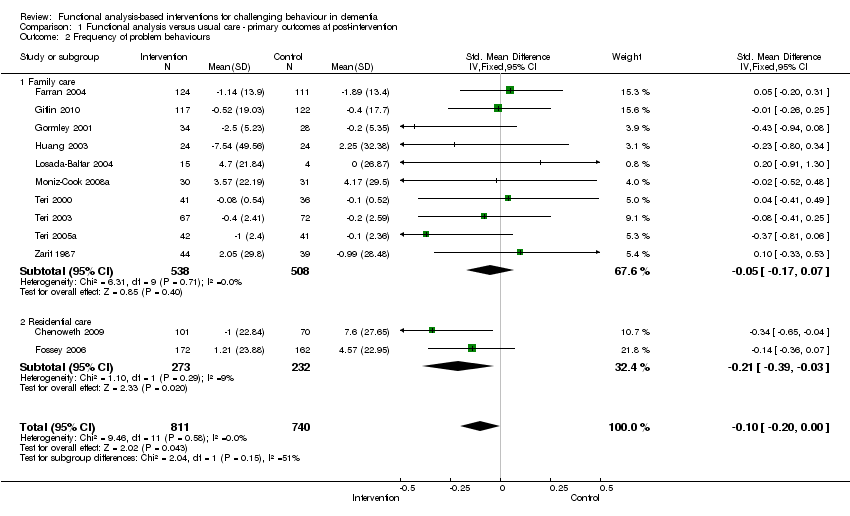
![Forest plot of comparison: 1 Functional analysis versus usual care ‐ primary outcomes at post‐intervention, outcome: 1.2 Frequency of problem behaviours. [Instruments used: PC, RAGE, RMBPC, CMAI and MBCL]](/es/cdsr/doi/10.1002/14651858.CD006929.pub2/media/CDSR/CD006929/image_n/nCD006929-AFig-FIG03.png)
![Forest plot of comparison: 1 Functional analysis versus usual care ‐ primary outcomes at post‐intervention, outcome: 1.3 Severity of problem behaviours. [Instruments used: PAS, NPI, Behave‐AD and Crichton Royal Behavioural Scale].](/es/cdsr/doi/10.1002/14651858.CD006929.pub2/media/CDSR/CD006929/image_n/nCD006929-AFig-FIG04.png)
![Forest plot of comparison: 1 Functional analysis versus usual care ‐ primary outcomes at post‐intervention, outcome: 1.4 Patient depression. [Instruments used: RMPBC Depression sub scale, AGECAT and CDDS]](/es/cdsr/doi/10.1002/14651858.CD006929.pub2/media/CDSR/CD006929/image_n/nCD006929-AFig-FIG05.png)
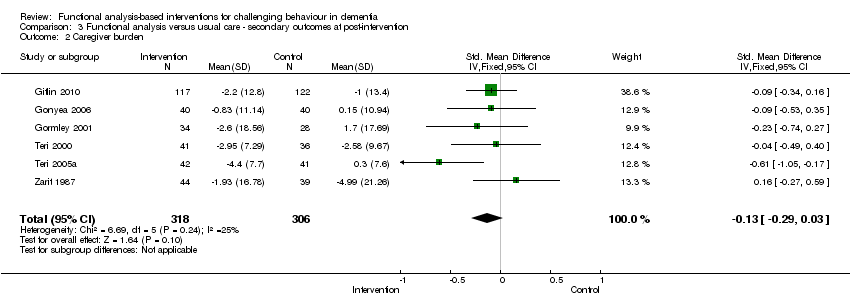
![Forest plot of comparison: 3 Functional analysis versus usual care ‐ secondary outcomes at post‐intervention, outcome: 3.1 Caregiver reaction. [Instruments used: PC, RMBPC ‐reaction, NPI ‐distress and ABID ‐reaction].](/es/cdsr/doi/10.1002/14651858.CD006929.pub2/media/CDSR/CD006929/image_n/nCD006929-AFig-FIG06.png)