Intervenciones con música para mejorar los resultados psicológicos y físicos en pacientes con cáncer
Información
- DOI:
- https://doi.org/10.1002/14651858.CD006911.pub3Copiar DOI

- Base de datos:
-
- Cochrane Database of Systematic Reviews
- Versión publicada:
-
- 15 agosto 2016see what's new
- Tipo:
-
- Intervention
- Etapa:
-
- Review
- Grupo Editorial Cochrane:
-
Grupo Cochrane de Cáncer ginecológico, neurooncología y otros cánceres
- Copyright:
-
- Copyright © 2016 The Cochrane Collaboration. Published by John Wiley & Sons, Ltd.
Cifras del artículo
Altmetric:
Citado por:
Autores
Contributions of authors
Background, objectives, criteria for considering studies: Bradt, Dileo, Grocke and Magill
Search strategies, methods: Bradt (reviewed and approved by Dileo, Grocke and Magill)
Database searches and handsearches: Bradt, Dileo, Grocke, Magill and Teague
Screening search results: Bradt, Teague and graduate assistants
Organising retrieval of papers: Bradt
Screening retrieved papers against inclusion criteria: Bradt and Teague
Appraising quality of papers: Bradt, Dileo and Magill
Abstracting data from papers: Bradt,Teague and graduate assistants
Writing to authors of papers for additional information: Bradt, Teague and graduate assistant
Providing additional data about papers: Bradt
Obtaining and screening data on unpublished studies: Bradt
Data management for the review: Bradt
Entering data into Review Manager (Review Manager 2014): Bradt, Teague and research assistant
RevMan statistical data: Bradt
Other statistical analysis not using RevMan: Bradt
Interpretation of data: Bradt, Dileo, Grocke and Magill
Statistical inferences: Bradt
Writing the review: Bradt (reviewed and approved by Dileo, Grocke and Magill)
Securing funding for the review: Dileo (for original review)
Guarantor for the review (one author): Bradt
Person responsible for reading and checking review before submission: Bradt
Sources of support
Internal sources
-
Drexel University, USA.
Drexel University provided financial support for a research assistant to assist with the update of this review
External sources
-
State of Pennsylvania Formula Fund, USA.
Declarations of interest
All authors are music therapists.
Acknowledgements
We would like to thank and acknowledge Clare Jess (Managing Editor), Chris Williams and Jo Morrison (Co‐ordinating Editors), Barbara Wheeler, Claudia Lazado‐Can, Megan Prictor, Andy Bryant, Lars Ole Bonde (peer reviewers) and Kathie Godfrey (consumer reviewer) for their help and editorial advice during the preparation of the protocol and the review. We would also like to acknowledge Patricia Gonzalez and Andi McGraw Hunt, graduate assistants at Temple University, for their help in the handsearching of journals and retrieval of articles; Patricia Winter, graduate assistant at Temple University, for her help with data extraction; Minjung Shim, research assistant at Drexel University, for her help with data input; and Denise Grocke for her contribution as an author on the original review. For the review update we would like to thank Kelly L By and Johanna Dwinells, graduate students at Drexel University, for their help with screening of database outputs and Karola Bryl, doctoral student at Drexel University, for her help with data extraction.
We'd like to thank the Cystic Fibrosis Group for permission to modify their data extraction form.
This project was supported by the National Institute for Health Research, via Cochrane Infrastructure funding to the Cochrane Gynaecological, Neuro‐oncology and Orphan Cancer Group. The views and opinions expressed therein are those of the authors and do not necessarily reflect those of the Systematic Reviews Programme, NIHR, NHS or the Department of Health.
Version history
| Published | Title | Stage | Authors | Version |
| 2021 Oct 12 | Music interventions for improving psychological and physical outcomes in people with cancer | Review | Joke Bradt, Cheryl Dileo, Katherine Myers-Coffman, Jacelyn Biondo | |
| 2016 Aug 15 | Music interventions for improving psychological and physical outcomes in cancer patients | Review | Joke Bradt, Cheryl Dileo, Lucanne Magill, Aaron Teague | |
| 2011 Aug 10 | Music interventions for improving psychological and physical outcomes in cancer patients | Review | Joke Bradt, Cheryl Dileo, Denise Grocke, Lucanne Magill | |
| 2008 Jan 23 | Music interventions for improving psychological and physical outcomes in cancer patients | Protocol | Cheryl Dileo, Joke Bradt, Denise Grocke, Lucanne Magill | |
Differences between protocol and review
Disease free survival was listed in the protocol as a secondary outcome but was excluded in the review as per recommendation of the peer review.
We slightly altered the MEDLINE search strategy, removing the words 'compose' and 'composing' as text words because they resulted in hundreds of irrelevant returns.
We added the RILM Abstracts of Music Literature database to the search strategy as per recommendation of the peer review.
Keywords
MeSH
Medical Subject Headings (MeSH) Keywords
Medical Subject Headings Check Words
Adult; Child; Humans;
PICO

Study flow diagram.
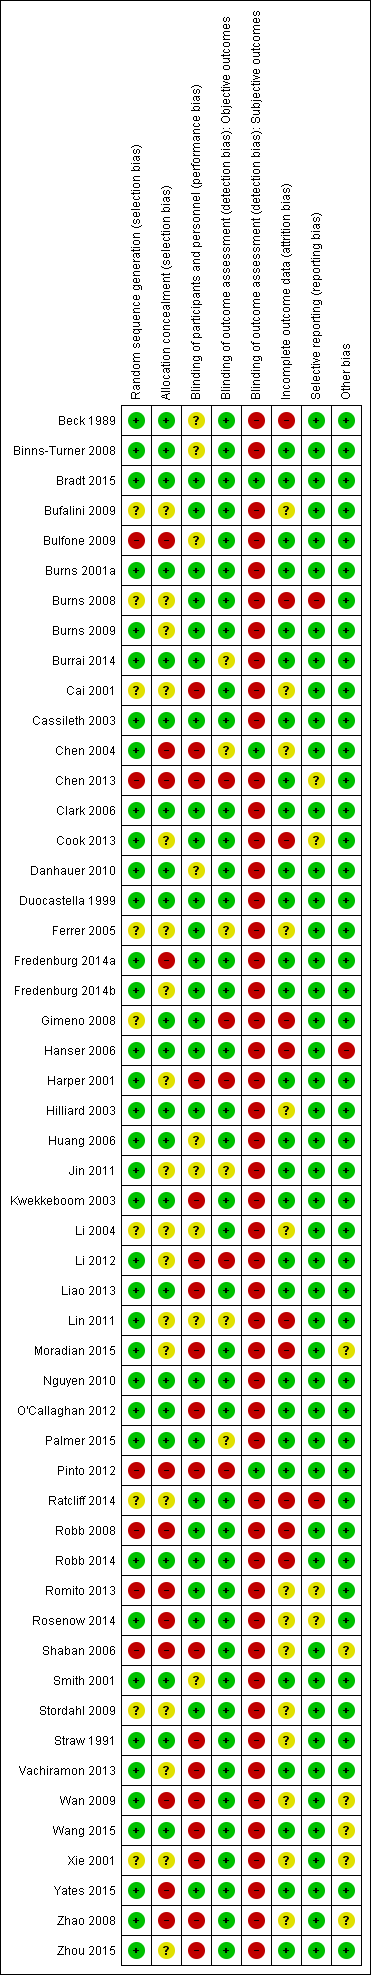
Risk of bias summary: review authors' judgements about each risk of bias item for each included study.

Risk of bias graph: review authors' judgements about each risk of bias item presented as percentages across all included studies.
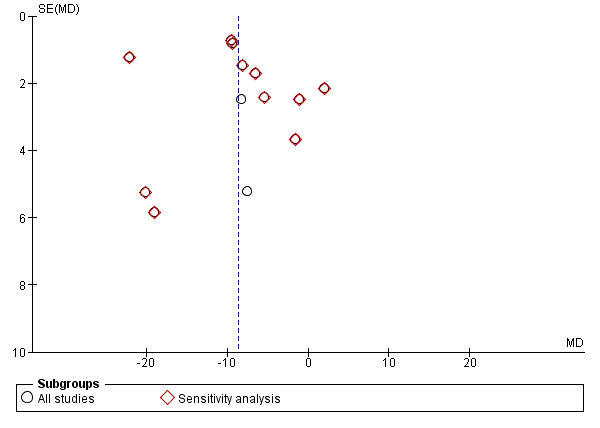
Funnel plot of comparison: 1 Music intervention plus standard care versus standard care alone, outcome: 1.1 Anxiety (STAI).

Funnel plot of comparison: 1 Music intervention plus standard care versus standard care alone, outcome: 1.6 Depression.

Funnel plot of comparison: 1 Music intervention plus standard care versus standard care alone, outcome: 1.11 Pain.

Funnel plot of comparison: 1 Music intervention plus standard care versus standard care alone, outcome: 1.15 Heart rate.

Funnel plot of comparison: 1 Music intervention plus standard care versus standard care alone, outcome: 1.13 Fatigue.
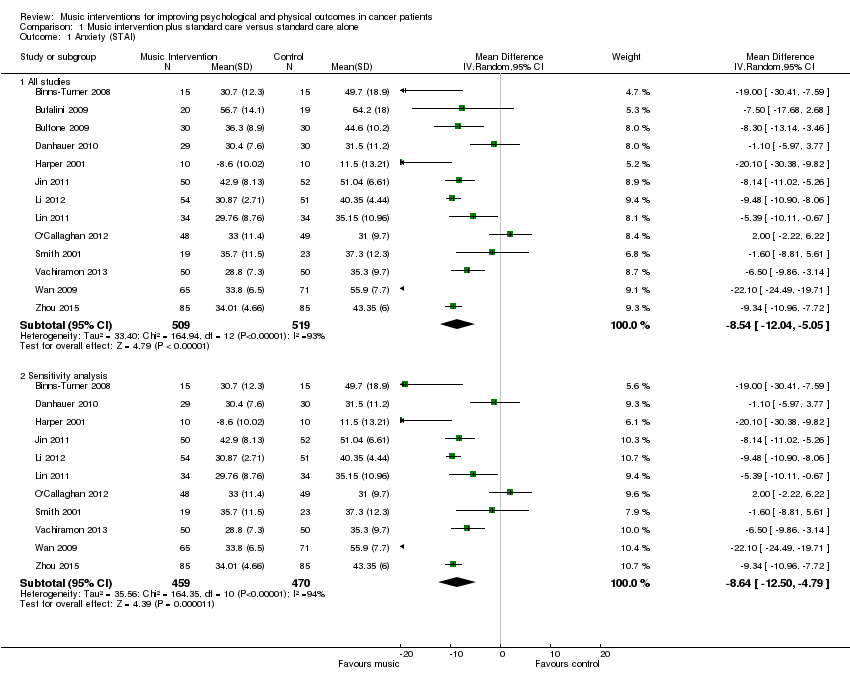
Comparison 1 Music intervention plus standard care versus standard care alone, Outcome 1 Anxiety (STAI).
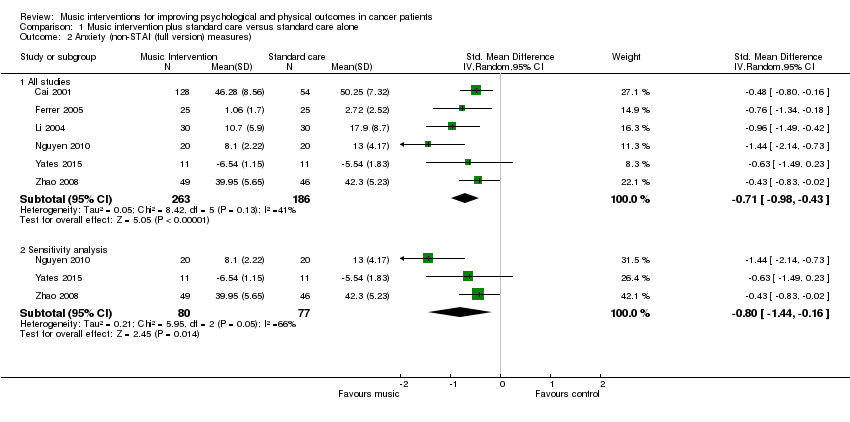
Comparison 1 Music intervention plus standard care versus standard care alone, Outcome 2 Anxiety (non‐STAI (full version) measures).

Comparison 1 Music intervention plus standard care versus standard care alone, Outcome 3 Anxiety (intervention subgroup).

Comparison 1 Music intervention plus standard care versus standard care alone, Outcome 4 Anxiety (music preference).

Comparison 1 Music intervention plus standard care versus standard care alone, Outcome 5 Anxiety (music‐guided relaxation).
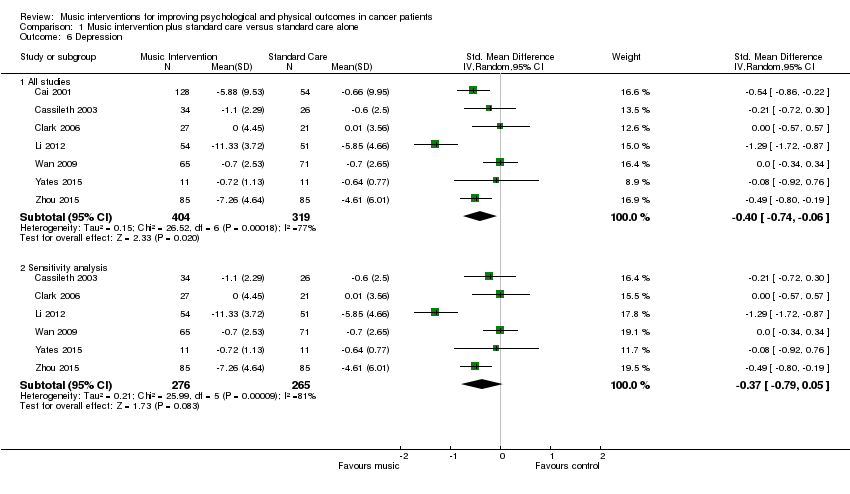
Comparison 1 Music intervention plus standard care versus standard care alone, Outcome 6 Depression.

Comparison 1 Music intervention plus standard care versus standard care alone, Outcome 7 Depression (intervention subgroup).

Comparison 1 Music intervention plus standard care versus standard care alone, Outcome 8 Depression (music preference).

Comparison 1 Music intervention plus standard care versus standard care alone, Outcome 9 Mood.

Comparison 1 Music intervention plus standard care versus standard care alone, Outcome 10 Mood (intervention subgroup).

Comparison 1 Music intervention plus standard care versus standard care alone, Outcome 11 Pain.

Comparison 1 Music intervention plus standard care versus standard care alone, Outcome 12 Pain (music preference).

Comparison 1 Music intervention plus standard care versus standard care alone, Outcome 13 Fatigue.

Comparison 1 Music intervention plus standard care versus standard care alone, Outcome 14 Physical functioning.

Comparison 1 Music intervention plus standard care versus standard care alone, Outcome 15 Heart rate.

Comparison 1 Music intervention plus standard care versus standard care alone, Outcome 16 Heart rate (music preference).

Comparison 1 Music intervention plus standard care versus standard care alone, Outcome 17 Respiratory rate.
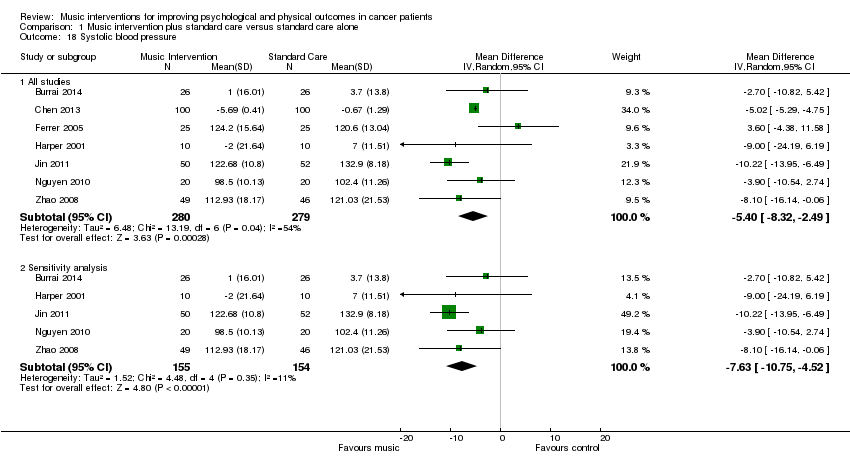
Comparison 1 Music intervention plus standard care versus standard care alone, Outcome 18 Systolic blood pressure.
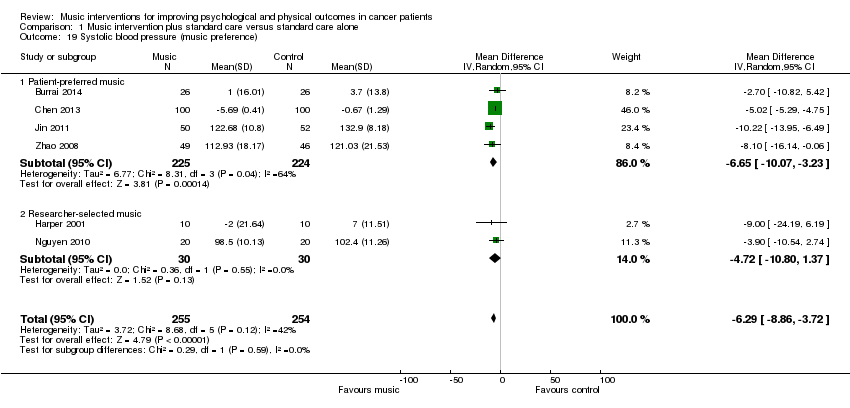
Comparison 1 Music intervention plus standard care versus standard care alone, Outcome 19 Systolic blood pressure (music preference).

Comparison 1 Music intervention plus standard care versus standard care alone, Outcome 20 Diastolic blood pressure.
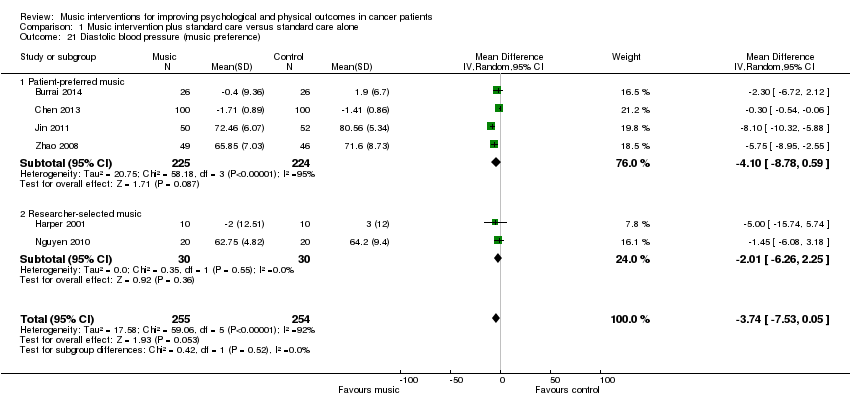
Comparison 1 Music intervention plus standard care versus standard care alone, Outcome 21 Diastolic blood pressure (music preference).

Comparison 1 Music intervention plus standard care versus standard care alone, Outcome 22 Oxygen Saturation.

Comparison 1 Music intervention plus standard care versus standard care alone, Outcome 23 Quality of Life.

Comparison 1 Music intervention plus standard care versus standard care alone, Outcome 24 Quality of life (intervention subgroup).

Comparison 2 Music therapy plus standard care versus music medicine plus standard care, Outcome 1 Anxiety.
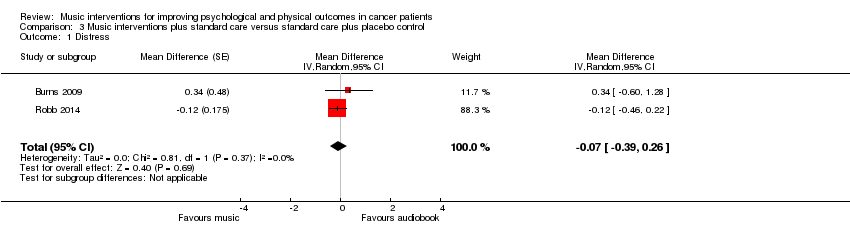
Comparison 3 Music interventions plus standard care versus standard care plus placebo control, Outcome 1 Distress.

Comparison 3 Music interventions plus standard care versus standard care plus placebo control, Outcome 2 Spiritual well‐being.
| Music interventions versus standard care for psychological and physical outcomes in cancer patients | ||||
| Patient or population: cancer patients | ||||
| Outcomes | Relative effect (95% CI) | No of participants | Quality of the evidence | Comments |
| Anxiety | The mean anxiety in the music intervention group was 8.54 units less (12.04 less to 5.05 less) than in the standard care group | 1028 | ⊕⊕⊝⊝ | — |
| Depression | The mean depression in the music intervention group was 0.40 standard deviations less (0.74 less to 0.06 less) than in the standard care group | 723 | ⊕⊝⊝⊝ | An SMD of 0.40 is considered a low to moderate effect size |
| Mood | The mean mood in the music intervention group was 0.47 standard deviations better (0.02 worse to 0.97 better) than in the standard care group | 236 | ⊕⊕⊝⊝ | An SMD of 0.47 is considered a moderate effect size |
| Pain | The mean pain in the intervention group was 0.91 standard deviations less (1.46 less to 0.36 less) than in the standard care group | 528 | ⊕⊕⊝⊝ | An SMD of 0.91 is considered a large effect size |
| Fatigue | The mean fatigue in the music intervention group was 0.38 standard deviations less (0.72 less to 0.04 less) than in the standard care group | 253 | ⊕⊕⊝⊝ | An SMD of 0.38 is considered a small to moderate effect size |
| Quality of life | The mean quality of life in the music intervention group was 0.98 standard deviations more (0.36 less to 2.33 more) than in the standard care group | 545 | ⊕⊕⊝⊝ | An SMD of 0.98 is considered a large effect size |
| *The risk in the intervention group (and its 95% confidence interval) is based on the assumed risk in the comparison group and the relative effect of the intervention (and its 95% CI). | ||||
| GRADE Working Group grades of evidence | ||||
| a The majority of the trials were at high risk of bias. | ||||
| Outcome or subgroup title | No. of studies | No. of participants | Statistical method | Effect size |
| 1 Anxiety (STAI) Show forest plot | 13 | Mean Difference (IV, Random, 95% CI) | Subtotals only | |
| 1.1 All studies | 13 | 1028 | Mean Difference (IV, Random, 95% CI) | ‐8.54 [‐12.04, ‐5.05] |
| 1.2 Sensitivity analysis | 11 | 929 | Mean Difference (IV, Random, 95% CI) | ‐8.64 [‐12.50, ‐4.79] |
| 2 Anxiety (non‐STAI (full version) measures) Show forest plot | 6 | Std. Mean Difference (IV, Random, 95% CI) | Subtotals only | |
| 2.1 All studies | 6 | 449 | Std. Mean Difference (IV, Random, 95% CI) | ‐0.71 [‐0.98, ‐0.43] |
| 2.2 Sensitivity analysis | 3 | 157 | Std. Mean Difference (IV, Random, 95% CI) | ‐0.80 [‐1.44, ‐0.16] |
| 3 Anxiety (intervention subgroup) Show forest plot | 18 | 1457 | Std. Mean Difference (IV, Random, 95% CI) | ‐0.94 [‐1.34, ‐0.55] |
| 3.1 Music therapy studies | 3 | 111 | Std. Mean Difference (IV, Random, 95% CI) | ‐0.62 [‐1.01, ‐0.24] |
| 3.2 Music medicine studies | 15 | 1346 | Std. Mean Difference (IV, Random, 95% CI) | ‐1.00 [‐1.45, ‐0.55] |
| 4 Anxiety (music preference) Show forest plot | 13 | 1142 | Std. Mean Difference (IV, Random, 95% CI) | ‐0.88 [‐1.28, ‐0.47] |
| 4.1 Patient‐preferred music | 10 | 860 | Std. Mean Difference (IV, Random, 95% CI) | ‐0.86 [‐1.38, ‐0.34] |
| 4.2 Researcher‐selected music | 3 | 282 | Std. Mean Difference (IV, Random, 95% CI) | ‐0.89 [‐1.43, ‐0.35] |
| 5 Anxiety (music‐guided relaxation) Show forest plot | 14 | 1306 | Std. Mean Difference (IV, Random, 95% CI) | ‐0.98 [‐1.44, ‐0.51] |
| 5.1 Music‐guided relaxation studies | 4 | 476 | Std. Mean Difference (IV, Random, 95% CI) | ‐1.61 [‐2.56, ‐0.65] |
| 5.2 Listening to music only | 10 | 830 | Std. Mean Difference (IV, Random, 95% CI) | ‐0.71 [‐1.16, ‐0.26] |
| 6 Depression Show forest plot | 7 | Std. Mean Difference (IV, Random, 95% CI) | Subtotals only | |
| 6.1 All studies | 7 | 723 | Std. Mean Difference (IV, Random, 95% CI) | ‐0.40 [‐0.74, ‐0.06] |
| 6.2 Sensitivity analysis | 6 | 541 | Std. Mean Difference (IV, Random, 95% CI) | ‐0.37 [‐0.79, 0.05] |
| 7 Depression (intervention subgroup) Show forest plot | 7 | 723 | Std. Mean Difference (IV, Random, 95% CI) | ‐0.40 [‐0.74, ‐0.06] |
| 7.1 Music therapy studies | 3 | 130 | Std. Mean Difference (IV, Random, 95% CI) | ‐0.11 [‐0.46, 0.24] |
| 7.2 Music medicine studies | 4 | 593 | Std. Mean Difference (IV, Random, 95% CI) | ‐0.57 [‐1.03, ‐0.10] |
| 8 Depression (music preference) Show forest plot | 4 | 505 | Std. Mean Difference (IV, Random, 95% CI) | ‐0.60 [‐1.04, ‐0.16] |
| 8.1 Patient‐preferred music | 2 | 275 | Std. Mean Difference (IV, Random, 95% CI) | ‐0.88 [‐1.67, ‐0.09] |
| 8.2 Researcher‐selected music | 2 | 230 | Std. Mean Difference (IV, Random, 95% CI) | ‐0.32 [‐0.84, 0.19] |
| 9 Mood Show forest plot | 5 | Std. Mean Difference (IV, Random, 95% CI) | Subtotals only | |
| 9.1 All studies | 5 | 236 | Std. Mean Difference (IV, Random, 95% CI) | 0.47 [‐0.02, 0.97] |
| 9.2 Sensitivity analysis | 4 | 192 | Std. Mean Difference (IV, Random, 95% CI) | 0.57 [‐0.03, 1.18] |
| 10 Mood (intervention subgroup) Show forest plot | 5 | 236 | Std. Mean Difference (IV, Random, 95% CI) | 0.47 [‐0.02, 0.97] |
| 10.1 Music therapy studies | 2 | 104 | Std. Mean Difference (IV, Random, 95% CI) | 0.37 [‐0.13, 0.87] |
| 10.2 Music medicine studies | 3 | 132 | Std. Mean Difference (IV, Random, 95% CI) | 0.55 [‐0.37, 1.47] |
| 11 Pain Show forest plot | 7 | 528 | Std. Mean Difference (IV, Random, 95% CI) | ‐0.91 [‐1.46, ‐0.36] |
| 12 Pain (music preference) Show forest plot | 6 | 496 | Std. Mean Difference (IV, Random, 95% CI) | ‐0.92 [‐1.53, ‐0.30] |
| 12.1 Patient‐preferred music | 4 | 320 | Std. Mean Difference (IV, Random, 95% CI) | ‐1.06 [‐1.93, ‐0.20] |
| 12.2 Researcher‐selected music | 2 | 176 | Std. Mean Difference (IV, Random, 95% CI) | ‐0.59 [‐1.34, 0.15] |
| 13 Fatigue Show forest plot | 6 | Std. Mean Difference (IV, Random, 95% CI) | Subtotals only | |
| 13.1 All studies | 6 | 253 | Std. Mean Difference (IV, Random, 95% CI) | ‐0.38 [‐0.72, ‐0.04] |
| 13.2 Sensitivity analysis | 5 | 203 | Std. Mean Difference (IV, Random, 95% CI) | ‐0.20 [‐0.48, 0.08] |
| 14 Physical functioning Show forest plot | 4 | Std. Mean Difference (IV, Random, 95% CI) | Subtotals only | |
| 14.1 All studies | 4 | 493 | Std. Mean Difference (IV, Random, 95% CI) | 0.78 [‐0.74, 2.31] |
| 14.2 Sensitivity analysis | 3 | 233 | Std. Mean Difference (IV, Random, 95% CI) | 0.08 [‐0.18, 0.34] |
| 15 Heart rate Show forest plot | 8 | Mean Difference (IV, Random, 95% CI) | Subtotals only | |
| 15.1 All studies | 8 | 589 | Mean Difference (IV, Random, 95% CI) | ‐3.32 [‐6.21, ‐0.44] |
| 15.2 Sensitivity analysis | 6 | 339 | Mean Difference (IV, Random, 95% CI) | ‐4.63 [‐8.18, ‐1.09] |
| 16 Heart rate (music preference) Show forest plot | 7 | 539 | Mean Difference (IV, Random, 95% CI) | ‐3.77 [‐6.97, ‐0.58] |
| 16.1 Patient‐preferred music | 5 | 479 | Mean Difference (IV, Random, 95% CI) | ‐3.13 [‐6.54, 0.27] |
| 16.2 Researcher‐selected music | 2 | 60 | Mean Difference (IV, Random, 95% CI) | ‐7.94 [‐15.10, ‐0.78] |
| 17 Respiratory rate Show forest plot | 4 | Mean Difference (IV, Random, 95% CI) | Subtotals only | |
| 17.1 All studies | 4 | 437 | Mean Difference (IV, Random, 95% CI) | ‐1.24 [‐2.54, 0.06] |
| 17.2 Sensitivity analysis | 3 | 237 | Mean Difference (IV, Random, 95% CI) | ‐1.83 [‐3.36, ‐0.30] |
| 18 Systolic blood pressure Show forest plot | 7 | Mean Difference (IV, Random, 95% CI) | Subtotals only | |
| 18.1 All studies | 7 | 559 | Mean Difference (IV, Random, 95% CI) | ‐5.40 [‐8.32, ‐2.49] |
| 18.2 Sensitivity analysis | 5 | 309 | Mean Difference (IV, Random, 95% CI) | ‐7.63 [‐10.75, ‐4.52] |
| 19 Systolic blood pressure (music preference) Show forest plot | 6 | 509 | Mean Difference (IV, Random, 95% CI) | ‐6.29 [‐8.86, ‐3.72] |
| 19.1 Patient‐preferred music | 4 | 449 | Mean Difference (IV, Random, 95% CI) | ‐6.65 [‐10.07, ‐3.23] |
| 19.2 Researcher‐selected music | 2 | 60 | Mean Difference (IV, Random, 95% CI) | ‐4.72 [‐10.80, 1.37] |
| 20 Diastolic blood pressure Show forest plot | 7 | Mean Difference (IV, Random, 95% CI) | Subtotals only | |
| 20.1 All studies | 7 | 559 | Mean Difference (IV, Random, 95% CI) | ‐2.35 [‐5.88, 1.18] |
| 20.2 Sensitivity analysis | 5 | 309 | Mean Difference (IV, Random, 95% CI) | ‐4.94 [‐7.78, ‐2.09] |
| 21 Diastolic blood pressure (music preference) Show forest plot | 6 | 509 | Mean Difference (IV, Random, 95% CI) | ‐3.74 [‐7.53, 0.05] |
| 21.1 Patient‐preferred music | 4 | 449 | Mean Difference (IV, Random, 95% CI) | ‐4.10 [‐8.78, 0.59] |
| 21.2 Researcher‐selected music | 2 | 60 | Mean Difference (IV, Random, 95% CI) | ‐2.01 [‐6.26, 2.25] |
| 22 Oxygen Saturation Show forest plot | 3 | 292 | Mean Difference (IV, Random, 95% CI) | 0.50 [‐0.18, 1.18] |
| 23 Quality of Life Show forest plot | 6 | Std. Mean Difference (IV, Random, 95% CI) | Subtotals only | |
| 23.1 All studies | 6 | 545 | Std. Mean Difference (IV, Random, 95% CI) | 0.98 [‐0.36, 2.33] |
| 23.2 Sensitivity analysis | 4 | 241 | Std. Mean Difference (IV, Random, 95% CI) | 0.52 [0.01, 1.02] |
| 24 Quality of life (intervention subgroup) Show forest plot | 5 | 568 | Std. Mean Difference (IV, Random, 95% CI) | 0.99 [‐0.34, 2.31] |
| 24.1 Music therapy studies | 3 | 132 | Std. Mean Difference (IV, Random, 95% CI) | 0.42 [0.06, 0.78] |
| 24.2 Music medicine studies | 2 | 436 | Std. Mean Difference (IV, Random, 95% CI) | 1.33 [‐0.96, 3.63] |
| Outcome or subgroup title | No. of studies | No. of participants | Statistical method | Effect size |
| 1 Anxiety Show forest plot | 2 | 166 | Mean Difference (IV, Fixed, 95% CI) | ‐3.67 [‐11.68, 4.35] |
| Outcome or subgroup title | No. of studies | No. of participants | Statistical method | Effect size |
| 1 Distress Show forest plot | 2 | Mean Difference (Random, 95% CI) | ‐0.07 [‐0.39, 0.26] | |
| 2 Spiritual well‐being Show forest plot | 2 | Std. Mean Difference (Fixed, 95% CI) | 0.31 [‐0.11, 0.73] | |