Protokollgestütztes Weaning im Vergleich zu Weaning ohne Protokoll zur Verkürzung der Dauer mechanischer Beatmung bei schwerkranken erwachsenen Patienten
Referencias
References to studies included in this review
References to studies excluded from this review
Additional references
References to other published versions of this review
Characteristics of studies
Characteristics of included studies [ordered by study ID]
Ir a:
| Methods | Randomized controlled trial | |
| Participants | Setting: Bangkok, Thailand; academic hospital; surgical ICU 14 beds; physician staffing included one senior attending certified for critical care medicine or anaesthesia board; one junior attending. Additionally, 5‐6 trainees working 24 hours in ICU. Nurse staffing not reported, but stated they were under staffed Participants: 100 adults (51 intervention group, 49 control group) Conditions: general, urological, gynaecological or obstetric intra‐abdominal surgery Inclusion: Intra‐abdominal surgical patients; intubated and receiving MV > 24 hours; ASA class I ‐ III. Exclusion: < 18 years; brain death; inability to obtain informed consent; mental retardation; perioperative myocardial infarction; morbid obesity | |
| Interventions | Intervention: daily screen for readiness; SBT on PS 7 cmH2O and 5 cmH2O PEEP for 120 minutes; if successful ask attending for approval to extubate Control: Weaning at the discretion of the managing physician | |
| Outcomes | 1. Duration of MV (primary) from tracheal intubation to discontinuation of MV or continued need for MV at day 21 after randomization 2. Reintubation within 72 hours after extubation 3. Need for MV > 21 days | |
| Notes | Protocol registration not reported. ITT not reported. Sample size calculation based on 80% power to detect a mean (SD) difference in duration of MV between the two groups of 36 (120) hours, α 0.05, 176 patients per group. Four interim analyses planned at 4, 6, 8 months and end of study. Study terminated after the 6 month interim analysis (100 patients recruited) Informed consent obtained | |
| Risk of bias | ||
| Bias | Authors' judgement | Support for judgement |
| Random sequence generation (selection bias) | Low risk | "Block randomization, size 4 and 6. Each assignment of weaning method was indicated on a data form, folded & sealed in opaque envelope, opened only after informed consent obtained" |
| Allocation concealment (selection bias) | Low risk | Sealed in opaque envelopes |
| Blinding of participants and personnel (performance bias) | High risk | Not reported, but impossible to blind personnel to the intervention groups |
| Blinding of outcome assessment (detection bias) | Unclear risk | Not reported |
| Incomplete outcome data (attrition bias) | Low risk | 472 patients screened and 372 excluded due to exclusion criteria or not obtaining informed consent (no details reported) |
| Selective reporting (reporting bias) | Unclear risk | There was no protocol and ICU length of stay and mortality were not reported which would be usual in these studies |
| Other bias | Unclear risk | The paper reported that a priori interim analyses were planned and the study was terminated at 6 months by an independent committee. However the discussion states “The authors did the 1st and 2nd analyses of 100 patients & found significant outcomes so the authors decided to stop the present study earlier” P 934. For this reason we assessed the risk as unclear |
| Methods | Randomized controlled trial | |
| Participants | Setting: Sao Paulo, Brazil; single combined medical/surgical unit. Physician and nurse staffing not reported Participants: 40 adults (20 intervention group, 20 control group) Conditions: Not reported Inclusion: medically fit ‐ decision of multidisciplinary team; receiving MV > 24 hours; APACHE II < 25. Exclusion: < 18 years; tracheostomy | |
| Interventions | Intervention: algorithm that included readiness to wean criteria and a SBT on PS 7 cmH2O with PEEP 5 cmH2O for 120 minutes; if successful, extubated Control: "Weaning without obeying strict procedures or criteria" | |
| Outcomes | 1. Weaning success (primary), no requirement for reintubation within 48 hours after extubation 2. Use of NIV postextubation 3. Total duration of MV 4. Weaning duration 5. Death | |
| Notes | Protocol registration not reported. ITT not reported. Sample size calculation and ethical approval not reported | |
| Risk of bias | ||
| Bias | Authors' judgement | Support for judgement |
| Random sequence generation (selection bias) | Unclear risk | Not reported |
| Allocation concealment (selection bias) | Unclear risk | Not reported |
| Blinding of participants and personnel (performance bias) | High risk | Impossible to blind personnel to the intervention groups |
| Blinding of outcome assessment (detection bias) | Unclear risk | Not reported |
| Incomplete outcome data (attrition bias) | Unclear risk | Not reported |
| Selective reporting (reporting bias) | Unclear risk | There was no protocol, although usual outcomes for weaning studies reported |
| Other bias | Unclear risk | Appears to be free of other sources of bias |
| Methods | Randomized controlled trial | |
| Participants | Setting: USA; 806‐bed university medical centre. One medical and one coronary ICU. "Closed units staffed by intensivists". Staffing ‐ 3.5 physician hours/bed/day (Krishnan 2004). NURSE/RT staffing not reported Participants: 300 adults (149 intervention, 151 control) Conditions: CHF; heart disease; COPD/asthma; pneumonia; ARDS/MSOF; GI and liver disease; cancer/leukaemia; overdose/ketoacidosis; neurologic emergency Inclusion:18 years and older; intubated and mechanically ventilated. Exclusions: 18 years; lack of informed consent; extubation order at time of evaluation; dependence on MV 2 weeks before recruitment | |
| Interventions | Intervention: protocol delivered by RNs and RTs consisting of daily screening of readiness to wean using 5 criteria; a 2‐hour SBT; and notification of the physician of successful SBT Control: usual practice consisting of weaning according to physician judgement | |
| Outcomes | 1. Total duration of mechanical ventilation (primary) 2. Weaning duration (time from successful screening test to discontinuation of MV) (primary) 3. ICU length of stay (primary) 4. Adverse events (reintubation; self‐extubation; tracheostomy; MV > 21 days) 5. Cost of respiratory care, intensive care and hospitalisation 6. Hospital length of stay 7. Mortality | |
| Notes | ITT analysis performed. Sample size calculation not reported. Study approved by hospital Institutional Review Board and informed consent required. The primary author supplied additional data | |
| Risk of bias | ||
| Bias | Authors' judgement | Support for judgement |
| Random sequence generation (selection bias) | Low risk | Computerized randomization |
| Allocation concealment (selection bias) | Low risk | Opaque sealed envelopes |
| Blinding of participants and personnel (performance bias) | High risk | Impossible to blind personnel to the intervention groups |
| Blinding of outcome assessment (detection bias) | Low risk | "All of the data were collected by research personnel not involved in the patients' care" |
| Incomplete outcome data (attrition bias) | Low risk | No missing outcome data. Recruitment and attrition data presented. Analyses performed using ITT principle |
| Selective reporting (reporting bias) | Low risk | All prespecified outcomes reported |
| Other bias | Low risk | Appears to be free of other sources of bias |
| Methods | Randomized controlled trial | |
| Participants | Setting; China, neurosurgical ICU in an academic hospital Participants: 65 enrolled (intervention 32; control 33). 5 withdrawn following randomization, group attrition numbers not reported Inclusion: Respiratory or pulmonary failure; age 18‐85 years; mechanically ventilated >/= 24 hours Exclusion: motor neuron disease of other nervous system disease; mechanically ventilated > 2 weeks; patients who gave up ventilation; patients not expected to survive > 6 months | |
| Interventions | Intervention: Patients were assessed by screening test once per day. The patients who did not pass the test were treated with mechanical ventilation and continued screening test. The patients who passed the test were assessed by 30 minute spontaneous breathing trial. The patients who passed the SBT would withdraw from mechanical ventilation. The patients who did not pass the SBT would be ventilated by SIMV + PSV, and ventilator parameters were gradually reduced every 4 hours; the respiratory frequency was decreased 2/breaths every 4 hours, until 4/breaths; the pressure support was decreased 2 cmH2O every 4 hours, until 7 cmH2O. SBT was conducted once per day. The patients who passed the SBT or when the respiratory frequency was maintained as 4/breaths and pressure support was maintained as 7 cmH2O would withdraw from mechanical ventilation Control: usual practice by physicians, not described | |
| Outcomes | 1. Total duration of mechanical ventilation 2. Weaning duration 3. ICU length of stay 4. Cost 5. ICU mortality 6. VAP incidence 7. Weaning success | |
| Notes | Paper was translated from Chinese to English. Authors were contacted (in Chinese) to supply standard deviations, but we received no response | |
| Risk of bias | ||
| Bias | Authors' judgement | Support for judgement |
| Random sequence generation (selection bias) | Low risk | Random numbers table used |
| Allocation concealment (selection bias) | Unclear risk | Not reported |
| Blinding of participants and personnel (performance bias) | High risk | Not reported, but not possible |
| Blinding of outcome assessment (detection bias) | Unclear risk | Not reported |
| Incomplete outcome data (attrition bias) | Low risk | Attrition numbers reported in both groups |
| Selective reporting (reporting bias) | Unclear risk | Insufficient information |
| Other bias | Unclear risk | Insufficient information |
| Methods | Randomized controlled trial | |
| Participants | Setting: USA, 2 medical and 2 surgical ICUs in 2 university affiliated teaching hospitals (900 and 450‐beds). Nurse to patient ratio 1:2 and 4.0 physician hours/bed/day (Krishnan 2004) Participants: 357 adults (intervention 179, control 178) Conditions: postoperative; trauma; pneumonia; COPD/asthma; pulmonary oedema; respiratory failure; drug overdose; cardiac arrest/cardiogenic shock Inclusion: mechanically ventilated. Exclusions: head/facial burns or trauma; transfer from other hospital with prior MV; brain death | |
| Interventions | Intervention: protocol entry criteria assessed, then protocol delivered by RNs and RTs consisting of: a) ICUs 1 and 4 ‐ daily SBTs through ventilator circuit with CPAP ≤ 5 cmH2O and PS ≤ 6 cmH20 for 30‐60 minutes then extubation b) ICU 2 ‐ stepwise reductions of 2 cmH20 in PSV until 6 cmH20 then extubation c) ICU 3 ‐ on PEEP ≤ 5 cmH20, PS ≤ 6 cmH20, stepwise IMV reductions of 2 breaths/min until ≤4 breaths/min, then 0 breaths for 30‐60 minutes, then extubation Control: usual practice consisting of weaning according to physician judgement | |
| Outcomes | 1. Total duration of mechanical ventilation from intubation until discontinuation of MV 2. Reintubation 3. Length of hospital stay 4. Hospital mortality rate 5. Hospital costs 6. MV time prior to weaning 7. Requiring MV for > 7 days | |
| Notes | Protocol registration not reported. Sample size calculation based on 80% power to detect a difference in weaning time of 1 (SD 3) days, α 0.05, 145 patients needed per group. Study approved by University Human Studies Committee and hospital Institutional Review Board ‐ both waived requirement for informed consent | |
| Risk of bias | ||
| Bias | Authors' judgement | Support for judgement |
| Random sequence generation (selection bias) | Low risk | Seperate blocked randomization schedules |
| Allocation concealment (selection bias) | Low risk | Opaque sealed envelopes |
| Blinding of participants and personnel (performance bias) | High risk | Impossible to blind personnel to the intervention groups |
| Blinding of outcome assessment (detection bias) | Low risk | Outcome assessors were independent from the individuals administering/supervising the intervention |
| Incomplete outcome data (attrition bias) | Low risk | No missing outcome data.Recruitment & attrition data presented. Analyses performed using ITT principle |
| Selective reporting (reporting bias) | Low risk | Weaning protocol is available; all prespecified outcomes reported |
| Other bias | Low risk | Appears to be free of other sources of bias. Sample size calculation stated (based on 80% power to detect a 1 day difference in weaning time, α 0.05, 145 required for each group) |
| Methods | Quasi‐randomized controlled trial | |
| Participants | Setting: USA, 1000‐bed hospital. 14 bed medical ICU; nurse to patient ratio 1:2; 9.5 physician hours/bed/day. 1‐2 RTs. Daily bedside rounds Medical cover at night Participants: 299 adults (intervention 154, control 145) Conditions: cardiopulmonary arrest; pneumonia/acute lung injury; COPD/asthma; cardiogenic pulmonary oedema; neurologic emergency Inclusion: mechanically ventilated > 24 hours Exclusions: previous participants; enrolled in other studies; transferred from other facilities intubated | |
| Interventions | Intervention: protocol delivered by RNs and RTs consisting of daily screening of readiness to wean using 5 criteria; a 1‐hour SBT on CPAP 5 cmH20; and notification of the physician of successful SBT Control: usual practice consisting of weaning according to physician judgement | |
| Outcomes | 1. Total duration of MV (time from start of MV to beginning of SBT that ended with successful discontinuation of MV) 2. Duration of SBT that preceded MV discontinuation 3. ICU length of stay 4. Location after ICU discharge 5. ICU and hospital mortality 6. Reinstitution of MV (< 48 hours & > 48 hours) | |
| Notes | Protocol registration not reported. Successful discontinuation was unassisted breathing for 48 hours. Analyses based on ITT. The sample size (? post hoc) provided 82% power to detect a difference in duration of MV of 1 day, α 0.05. Study approved by Institutional Review Board ‐ waived requirement for informed consent | |
| Risk of bias | ||
| Bias | Authors' judgement | Support for judgement |
| Random sequence generation (selection bias) | High risk | Assigned by hospital number (odd versus even) |
| Allocation concealment (selection bias) | High risk | Case record number |
| Blinding of participants and personnel (performance bias) | High risk | Impossible to blind personnel to the intervention groups |
| Blinding of outcome assessment (detection bias) | Unclear risk | Unclear whether outcome assessors were independent from those making decisions. RNs and RTs recorded results of screening and SBTs on case report forms. Study coordinator documented other data |
| Incomplete outcome data (attrition bias) | Low risk | No missing outcome data. Recruitment and attrition data presented. ITT analysis performed |
| Selective reporting (reporting bias) | Low risk | Weaning protocol is available; all prespecified outcomes reported |
| Other bias | Low risk | Appears to be free of other sources of bias |
| Methods | Randomized controlled trial | |
| Participants | Setting: USA, 1 university medical centre. 3 ICUs with medical and trauma/surgical services; RT to ventilator ratio 1:7; nurse to patient ratio 1:1 or 1:2; 4.7 physician hours/bed/day Participants: 335 adults (intervention 166, control 169) Conditions: postoperative trauma; non‐operative trauma; pneumonia; neurologic emergency; poisoning; GI bleed/liver; COPD/asthma; respiratory failure; metabolic/renal; CHF Inclusion: mechanically ventilated. Exclusions: pregnancy; < 18 years; mentally disabled; prisoners | |
| Interventions | Intervention: protocol delivered by RNs and RTs consisting of twice daily screening of readiness to wean; a 30‐minute SBT (< 72 hours ventilated) or stepwise reduction in PEEP, PS and IMV (> 72 hours ventilated); and notification of the physician of successful SBT Control: usual practice consisting of weaning according to physician judgement on MICU; and a standardized MD approach on trauma services consisting of gradual reductions in IMV, then PS, then SBTs administered (but extubation was based on subjective opinion) | |
| Outcomes | 1. Total duration of MV (primary) 2. Incidence of VAP (primary) 3. Weaning duration (duration of MV from study entry to discontinuation of ventilator support) 4. Duration of MV from initiation of mechanical support to meeting discontinuation criteria 5. Ventilator discontinuation failure rate 6. Tracheostomy 7. Hospital mortality | |
| Notes | Protocol registration not reported. Sample size calculation based on 80% power to detect a difference in time to ventilator discontinuation of 1.5 days, α 0.05, but patient numbers required not reported. Study approved by University Human Subjects Review Committee ‐ requirement for informed consent waived | |
| Risk of bias | ||
| Bias | Authors' judgement | Support for judgement |
| Random sequence generation (selection bias) | Low risk | Stratified according to medical or surgical, put into envelopes and shuffled |
| Allocation concealment (selection bias) | Low risk | Opaque sealed envelopes |
| Blinding of participants and personnel (performance bias) | High risk | Impossible to blind personnel to the intervention groups |
| Blinding of outcome assessment (detection bias) | Low risk | Outcome assessors independent from those involved in intervention |
| Incomplete outcome data (attrition bias) | Low risk | No missing outcome data. Recruitment and attrition data presented |
| Selective reporting (reporting bias) | Low risk | Weaning protocol is available; all prespecified outcomes reported |
| Other bias | Low risk | Appears to be free of other sources of bias |
| Methods | Randomized controlled trial | |
| Participants | Setting: USA. Hospital and units not specified. Staffing ratios not stated Participants: 100 neurosurgical adult patients (intervention 49, control 51) Conditions: head trauma; subarachnoid haemorrhage; intracerebral haemorrhage/arteriovenous malformation; tumour; spinal trauma Inclusion: mechanically ventilated. Exclusions not stated | |
| Interventions | Intervention: RT‐focused protocol consisting of daily screening of readiness to wean; a 2‐hour SBT; and notification of the physician of successful SBT Control: not stated | |
| Outcomes | 1. Total duration of MV (primary) 2. ICU length of stay (primary) 3. Time to successful extubation (primary) 4. Adverse events (reintubation; self‐extubation; tracheostomy, MV exceeding 21 days) 5. Costs of MV, respiratory and ICU care & overall hospitalisation 6. Hospital length of stay 7. Mortality 8. Existence of pneumonia | |
| Notes | Protocol registration not reported. ITT analysis performed. Study powered for 188 patients (80% power, α 0.05) to detect a 20% difference in duration of MV. Study approved by hospital Institutional Review Board and informed consent required | |
| Risk of bias | ||
| Bias | Authors' judgement | Support for judgement |
| Random sequence generation (selection bias) | Unclear risk | Not described |
| Allocation concealment (selection bias) | Unclear risk | Not described |
| Blinding of participants and personnel (performance bias) | High risk | Impossible to blind personnel to the intervention groups |
| Blinding of outcome assessment (detection bias) | Unclear risk | Not described |
| Incomplete outcome data (attrition bias) | Low risk | No missing outcome data. Recruitment and attrition data presented. ITT analysis performed |
| Selective reporting (reporting bias) | Low risk | All prespecified outcomes reported |
| Other bias | Unclear risk | Trial stopped early for futility. Study powered for 188 patients. Planned interim analysis at 12‐months showed lack of efficacy, study stopped at 100 patients |
| Methods | Randomized controlled trial | |
| Participants | Setting: Italy, 1200 bed hospital. Closed neuro‐ICU, 9 bed unit. Nurse to patient ratio 1:2; 24‐hour physicians certified and trained in anaesthesiology and critical care. 1 RT Participants: 318 adult neurosurgical and neurological patients (165 intervention group; 153 control group) Conditions: subarachnoid haemorrhage, intracerebral haemorrhage; head trauma; cerebral tumour; spinal trauma Inclusion: mechanically ventilated adults between 18 and 80 years; not already intubated or transferred from other ICU; mechanically ventilated >12 hours; no continuous sedation infusion; not on controlled mechanical ventilation; ability to trigger the ventilator; no tracheostomy; no surgery scheduled for 72 hours. Exclusion: lesion affecting upper airway; pre‐existing decision to limit life support | |
| Interventions | ICU staff trained and piloted the protocol during a 3‐month run in period Intervention: daily readiness to wean criteria (GCS =/> 8; cough present; tracheal suctioning =/< 2/hour; normal sodium blood values; Temperature < 38.5oC; pH ≥ 7.35 and PaCO2 ≤ 50 mmHg; PaO2/FiO2 ratio ≥ 200 with PEEP ≤ 5 cmH2O; FiO2 ≤ 0.4; Heart rate ≤ 125 b/min; SBP ≥ 90 mmHg without vasoactive medication); followed by a 1‐hour SBT through ventilator circuit with 2 ‐ 3 cmH2O CPAP and FiO2 0.4. Extubation criteria: respiratory rate/tidal volume ratio ≤105, PaO2/FiO2 ≥200, pH ≥7.35 and PaCO2 ≤ 50 mmHg Control: usual care that was daily evaluation by attending physician, weaning and extubation using their own clinical judgement | |
| Outcomes | 1. Rate of extubation within 48 hours (primary) 2. Duration of mechanical ventilation (days) 3. Length of ICU stay (mean/SD) 4. Length of hospital stay (mean/SD) 5. ICU Mortality N(%) 6. Rate of tracheostomy N(%) | |
| Notes | Trial protocol was registered. ITT analysis performed. A priori power analysis showed that a recruitment of 280 patients (140 each group) over a 21 month period would detect a decrease in reintubation rate from 15% to 5% with 80% power at 5% two‐sided level of significance. Ethics committee approval; requirement for informed consent waived | |
| Risk of bias | ||
| Bias | Authors' judgement | Support for judgement |
| Random sequence generation (selection bias) | Low risk | "A computer‐generated randomisation sequence was drawn up. We used a simple randomisation without blocks" |
| Allocation concealment (selection bias) | Low risk | "We utilised the same PC used to register the patient in the ICU, which was located in the office of the chief nurse. As soon as the patient was eligible, a person (the chief nurse from Monday to Friday) not involved in the study (i.e. not one of the authors) communicated to the attending physician the group of assignment" |
| Blinding of participants and personnel (performance bias) | High risk | Impossible to blind personnel to the intervention groups |
| Blinding of outcome assessment (detection bias) | Low risk | Participants, staff and research personnel unblinded to the intervention, "however the analysis of data were performed by two investigators not involved either in the clinical management of patients and in data acquisition and report" |
| Incomplete outcome data (attrition bias) | Low risk | Attrition and exclusions reported |
| Selective reporting (reporting bias) | Low risk | All a priori outcomes reported |
| Other bias | Low risk | Appears to be free of other sources of bias. Sample size calculation stated (based on 80% power, α 0.05, 140 patients in each group) |
| Methods | Randomized controlled trial | |
| Participants | Setting: Bucharest, Romania. Centre for bone marrow, liver and renal transplant (web site information), ICU and staffing not reported Participants: 103 participants (51 intervention group, 52 control group) Conditions: Surgical (abdominal) and myasthenia gravis Inclusion: Not reported Exclusion: Not reported | |
| Interventions | Intervention: Readiness to wean criteria and SBT (communication) Control: Not reported (classical ventilator disconnection) | |
| Outcomes | 1. Duration of MV 2. ICU length of stay 3. Reintubation 4. Mortality | |
| Notes | Protocol registration not reported. The study was reported in a conference abstract and details on ITT, sample size calculation, ethics and trials methods are not reported. We were unable to contact the primary author for details, but managed to contact a co‐author who sent a data file, but could not elaborate further on study details. Data entered into the meta‐analyses were calculated from the raw data sent by a co‐author | |
| Risk of bias | ||
| Bias | Authors' judgement | Support for judgement |
| Random sequence generation (selection bias) | Unclear risk | Not reported |
| Allocation concealment (selection bias) | Unclear risk | Not reported |
| Blinding of participants and personnel (performance bias) | High risk | Impossible to blind personnel to the intervention groups |
| Blinding of outcome assessment (detection bias) | Unclear risk | Not reported |
| Incomplete outcome data (attrition bias) | Unclear risk | Not reported |
| Selective reporting (reporting bias) | Low risk | No study protocol, but usual outcomes reported |
| Other bias | Unclear risk | Abstract lacks detail to confirm |
| Methods | Quasi‐randomized controlled trial | |
| Participants | Setting: Brazil, hospital not described. One coronary care unit. Staffing ratios not stated Participants: 36 coronary care patients (intervention 18, control 18) Conditions: myocardial revascularization; valve surgery; acute coronary syndrome; CHF; pulmonary thromboembolism Inclusion: mechanically ventilated > 24 hours. Exclusion: conditions that might result in difficulty understanding informed consent; lack of consent; end‐stage diseases; dependence on MV | |
| Interventions | Predetermined protocol entry criteria specified. After resolution of cause for MV resolved, all patients underwent a daily clinical evaluation according to prespecified criteria Intervention: SBT 120 minutes delivered by RT then extubation Control: weaning according to physician and RT judgement, typically gradual reduction in ventilatory support (RR and PS) and in some cases SBT without evaluation of clinical criteria | |
| Outcomes | 1. Reintubation rate during hospitalization (primary) 2. Length of CCU stay 3. Time from intubation to start of weaning 4. Time from start of weaning to extubation 5. Time from SBT to extubation 6. Presence of respiratory infection in patients requiring reintubation 7. Mortality of patients requiring reintubation | |
| Notes | Protocol registration not reported. Sample size calculation based on 80% power to detect a difference in reintubation rate of 15% in the intervention group and 60% in the control group, 17 patients per group. Informed consent required: ethical approval obtained | |
| Risk of bias | ||
| Bias | Authors' judgement | Support for judgement |
| Random sequence generation (selection bias) | High risk | 1st recruited patient into experimental group, 2nd into control group, thereafter alternated |
| Allocation concealment (selection bias) | High risk | Not concealed |
| Blinding of participants and personnel (performance bias) | High risk | Impossible to blind personnel to the intervention groups |
| Blinding of outcome assessment (detection bias) | Unclear risk | Not reported |
| Incomplete outcome data (attrition bias) | Unclear risk | Recruitment and attrition data not reported |
| Selective reporting (reporting bias) | Low risk | Study protocol is available; all prespecified outcomes reported |
| Other bias | Low risk | Sample size calculation based on 80% power to detect a difference in reintubation of 15% in experimental group and 60% in control group, α 0.05, 17 patients in each group. Ethics Committee approval obtained |
| Methods | Randomized controlled trial | |
| Participants | Setting: US; single, academic, urban, tertiary medical centre with closed medical ICU Participants: 33 adult participants (15 intervention group; 18 control group) Conditions: Respiratory insufficiency Inclusion:18 years and older; mechanically ventilated via endotracheal tube; requiring mechanical ventilation for > 48 hours Exclusion: do not resuscitate status; tracheostomy; cardiac arrest > 5 minutes with poor neurological prognosis; pregnancy; transfer from another institution; baseline PaCO2 > 60 mmHg | |
| Interventions | Intervention: computer‐driven weaning program ‐ Drager Evita Smartcare System Control: usual care weaning that was SBT or PS (10 cmH2O or less with PEEP 5 cmH2O) for 30‐120 minutes | |
| Outcomes | 1. Duration of weaning (primary) 2. Duration of ICU stay 3. Duration of mechanical ventilation 4. Duration of hospitalization 5. Mortality 6. Sedation requirements 7. No. of SBTs prior to extubation 8. Complications (mortality during weaning; VAP; self extubation; reintubation rate) | |
| Notes | Study was not published. Information obtained from the trial registration site. Trial started January 2007 and stopped May 2010 prior to reaching recruitment target because of slow recruitment and inadequate resources. ITT analyses. Sample size calculation based on 80% power to detect a difference in weaning time of 1.5 (SD 4) days, α 0.05, 220 patients. Protocol approved by Boston University Institutional Review Board | |
| Risk of bias | ||
| Bias | Authors' judgement | Support for judgement |
| Random sequence generation (selection bias) | Low risk | "Randomization was performed utilizing an online random number generator with permuted blocks of four, stratified by etiology of respiratory failure ..." |
| Allocation concealment (selection bias) | Low risk | "...and revealed through opening of opaque envelopes" |
| Blinding of participants and personnel (performance bias) | High risk | Impossible to blind personnel to the intervention groups |
| Blinding of outcome assessment (detection bias) | Unclear risk | Not reported |
| Incomplete outcome data (attrition bias) | Unclear risk | Unclear from the trial register |
| Selective reporting (reporting bias) | Unclear risk | Some outcomes not reported: total duration of MV; ICU length of stay |
| Other bias | Unclear risk | Trial started January 2007 and stopped May 2010 prior to reaching recruitment target because of slow recruitment and inadequate resources |
| Methods | Randomized controlled trial | |
| Participants | Setting: Asan Medical Center, a tertiary academic hospital with 2680 beds in Seoul, Korea. Medical ICU, a closed ICU with 28 beds staffed by 3 attending physicians; 2 ICU fellows; and 6 medical residents in their 2nd or 3rd years. Physicians work in 3 teams each with 3/4 physicians. All physicians attend structured twice daily bedside rounds lastly approximately 2 hours. Decisions about management of mechanically ventilated patients are based on electronic templates and medical records that cover each major physiologic system and completed daily by house staff and charge nurses. Most physicians remain in the ICU for their entire working hours, and 2 house officers stay overnight. All nurses are registered nurses, and the nurse‐to patient ratio was 1:2.5, plus 4 additional senior nurses. Two respiratory therapists were involved in the management of mechanically ventilated patients Participants: 122 enrolled (61 intervention group, 61 control group) Conditions: acute exacerbation of COPD; postoperative; pulmonary oedema; pneumonia; sepsis Inclusion: PaO2/FIO2 > 200 mm Hg; minute ventilation <15 L/min; age 18 to 90 years; pH > 7.3; serum potassium 3 to 5 mmol/L; serum sodium 128 to 150 mmol/L; Hemoglobin > 7 g/dL Exclusion: do‐not‐resuscitate order; ventilatory support less than 12 hours or greater than 14 days; on non‐invasive ventilation; active bleeding; known or suspected increased intracranial pressure | |
| Interventions | Intervention: Nurse‐directed protocol with an algorithm outlining steps that included stepwise reductions in FiO2 to >/= 0.4 and PEEP to </= 5 cmH2O; followed by screening for readiness to wean and CPAP trial at 5 cmH2O for 5 minutes; then gradual PS weaning to 5 cmH2O; followed by SBT via T‐piece for 30 minutes. If successful, screen for extubation and if ready notify physician Control: Weaning at the discretion of the medical resident physicians (blinded to the weaning protocol used in the intervention group) | |
| Outcomes | 1. Weaning time (primary) ‐ defined as the time from enrolment and randomization, to successful discontinuation of mechanical ventilation Classified as successfully weaned if able to breathe unassisted for 48 hours at their first spontaneous breathing trial 2. Overall duration of mechanical ventilation 3. Duration of stay in the ICU 4. Duration of hospitalization 5. Frequency of complications (tracheostomy, failure of discontinuation, death) | |
| Notes | Protocol registration not reported. ITT analysis performed. Sample size calculation was based on the difference in weaning times in pilot study, sample size had 80% power to detect a significant effect, assuming 2‐sided type I error of 0.05 and the rate of the failure of discontinuation was 30%. Institutional review board of hospital approved the study protocol. Data entered into the meta‐analyses were calculated from the raw data sent by the authors | |
| Risk of bias | ||
| Bias | Authors' judgement | Support for judgement |
| Random sequence generation (selection bias) | Low risk | A computerized randomization scheme was used |
| Allocation concealment (selection bias) | Low risk | A computerized randomization scheme used for group assignment at enrolment, and each assignment was indicated on a data form that was folded and sealed in an opaque envelope. The envelope was opened only after written informed consent, mostly provided by relatives because the patients were sedated. The charge nurse screened mechanically ventilated patients in the medical ICU every morning, and eligible patients were randomly assigned to the intervention or control group |
| Blinding of participants and personnel (performance bias) | High risk | Impossible to blind personnel to the intervention groups |
| Blinding of outcome assessment (detection bias) | Unclear risk | Not reported |
| Incomplete outcome data (attrition bias) | Unclear risk | 122 enrolled, but duration of weaning and mechanical ventilation only reported for 93. Attrition not reported |
| Selective reporting (reporting bias) | Unclear risk | No registered protocol; reintubation is a common outcome, but not reported |
| Other bias | Low risk | None apparent |
| Methods | Randomized controlled trial | |
| Participants | Setting: Australia, 390 bed acute tertiary referral hospital with 100,000 admissions/annum. 24‐bed mixed medical/surgical/trauma ICU. Nurse to patient ratio 1:1, 9 intensivists providing twice‐daily structured rounds and supported by 26 hospital medical officers providing 24‐hour care. Participants: 102 adult patients (51 intervention group; 51 control group) Conditions: trauma; coma; postoperative; pneumonia; sepsis; heart failure Inclusion: 24‐hour mandatory ventilation; a ventilator with SmartCare/PS software ready for use; PEEP ≤ 8 cmH2O; PaO2/FiO2 ratio >150 or SaO2 ≥ 90% with FiO2 0.5; Plateau Pressure ≤ 30 cmH2O; haemodynamic stability; temperature 36‐39 C; GCS > 4; no anticipated requirement for transport or surgery; successful completion of 30‐min SBT using max 20 cmH20 PS to achieve VT > 200mL Exclusion: ventilator with software unavailable; CNS disorder with anticipated poor outcome | |
| Interventions | Intervention: automated computerized protocol delivered by Draeger EvitaXL ventilator with SmartCareTM/PS software version 1.1. Programme monitors patient's respiratory status every 2 to 5 minutes and adjusts PS accordingly. When PS reduced to 7 cmH2O (or 5 cmH2O for tracheostomy), PEEP was reduced to 5 cmH2O and following a 1‐hour monitoring period patient assigned as having ventilator "separation potential" Control: weaning of PS and PEEP according to usual local practice in the absence of formal guidelines. When PS reduced to 7 cmH2O (or 5 cmH2O for tracheostomy), PEEP was reduced to 5 cmH2O and following a 1‐hour monitoring period patient assigned as having ventilator "separation potential" | |
| Outcomes | 1. Time to separation (immediately following successful 30‐minute PS SBT [randomization] to declaring "separation potential") in hours 2. Total duration of weaning (randomization to successful extubation) 3. Time from intubation to first extubation 4. Time from intubation to successful extubation 5. Length of ICU stay 6. Length of hospital stay 7. ICU Mortality 8. Rate of successful extubation 9. Rate of reintubation 10. Rate of use of non‐invasive ventilation postextubation 11. Tracheostomy 12. Prolonged mechanical ventilation > 14 days | |
| Notes | Protocol registration not reported. ITT analysis. Sample size calculation not reported. Ethical approval. Required written informed consent from next‐of‐kin and later patients (when competent) | |
| Risk of bias | ||
| Bias | Authors' judgement | Support for judgement |
| Random sequence generation (selection bias) | Low risk | Computer‐generated block randomization (block size 4) |
| Allocation concealment (selection bias) | Low risk | Administered through a sequential opaque envelope technique |
| Blinding of participants and personnel (performance bias) | High risk | Impossible to blind personnel to the intervention groups |
| Blinding of outcome assessment (detection bias) | Unclear risk | Not reported |
| Incomplete outcome data (attrition bias) | Low risk | Attrition and exclusions reported |
| Selective reporting (reporting bias) | Low risk | All a priori outcomes reported |
| Other bias | Low risk | Appears to be free of other sources of bias |
| Methods | Randomized controlled trial | |
| Participants | Setting: Italy, hospital not described. One cardiac surgical ICU. Staffing ratios not stated Participants: 49 patients > 15 years of age (intervention 24, control 25) Conditions: elective coronary, aortic and mitral valve surgery Inclusion: low or medium Higgins risk score Exclusion: FiO2 > 0.5%; PEEP > 10 cmH2O to achieve O2 sat > 90%; PEEP > 10 cmH2O; excessive respiratory secretions; uncontrolled arrhythmias; high inotropic support; bleeding > 250 mLs in first hour; contraindications to steroid administration | |
| Interventions | Intervention: protocol consisting of reduction in SIMV and 2 cmH2O stepwise reduction in PSV until SIMV 0 and PS 4 cmH2O, then extubation Control: weaning according to physician's subjective clinical judgement without the aid of the measured indexes | |
| Outcomes | 1. Total duration of mechanical ventilation (intubation time) 2. ICU length of stay 3. Number of complications recorded (cardiac tamponade; myocardial ischaemia; increased creatinine level; aphasia; disorientation; paralysis; postoperative bleeding; reintubation due to epileptic crisis) | |
| Notes | Protocol registration not reported. ITT not reported. Sample size calculation not reported. Patients assessed 3rd/4th hour after admission. Predetermined protocol entry criteria specified. Ethical committee approval gained and informed consent required | |
| Risk of bias | ||
| Bias | Authors' judgement | Support for judgement |
| Random sequence generation (selection bias) | Low risk | Used a random numbers table generated by a software program on a PC |
| Allocation concealment (selection bias) | Low risk | Each random number was associated with either 'control' or 'experimental' & was inserted into a black sealed envelope |
| Blinding of participants and personnel (performance bias) | High risk | Impossible to blind personnel to the intervention groups |
| Blinding of outcome assessment (detection bias) | Low risk | "The fellows were involved in collecting the data, not in weaning the patient" ‐ communication |
| Incomplete outcome data (attrition bias) | Unclear risk | Outcomes were not prespecified. Recruitment and attrition data absent. ITT not stated |
| Selective reporting (reporting bias) | Unclear risk | Outcomes were not prespecified |
| Other bias | Unclear risk | No data to support following statements; "...Patients that underwent a longer cardiopulmonary bypass time required prolonged MV support...". (Baseline showed patients in the control group had longer cardiopulmonary bypass times.) "...a weaning protocol allows early identification of patients ready for spontaneous breathing, thus reducing MV dependence." (This outcome ‐ early identification or MV time prior to weaning ‐ was not measured.) Data produced from a Fast Track Recovery study for comparison with weaning group data, but no information provided on this group of patients (nos., characteristics etc). Sample size calculation not stated |
| Methods | Randomized controlled trial | |
| Participants | Setting: University Hospital in Germany. Surgical ICU. Staffing ratios not stated Participants: 60 patients, (intervention 30, control 30) Conditions: abdominal, vascular, thoracic & trauma/orthopaedic surgery Inclusion: 18‐80 years, mechanically ventilated via endotracheal tube or tracheostomy for at least 24 hours; breathing spontaneously; Ramsay sedation score ≤ 3; paO2 > 75 cmH2O or SaO2 > 90% at FiO2 ≤ 0.5; 18‐80 years; body weight 35 kg‐200 kg Exclusion: PEEP > 10 cmH2O; haemodynamic instability with demand for catecholamines; rectal temperature > 39oC; haemoglobin < 7 g/dl; pH > 7.2 | |
| Interventions | Intervention: computerized automated weaning of CPAP/ASB mode (SmartCare TM/PS) Control: physician‐directed weaning using no strict protocol, but PSV should be gradually reduced in single steps of no more than 15 cmH2O Extubation criteria: respiratory rate, 30/minute; paO2 >75 cmH2O or SaO2 > 90%; sufficient airway protection; haemodynamic stability | |
| Outcomes | 1. Duration of ventilator weaning in days (time from switching controlled to assisted breathing (CPAP/ASB mode) until extubation or disconnection (if tracheostomy)) 2. Total duration of MV until successful extubation 3. ICU length of stay 4. Reintubation within 48 hours 5. Physician workload (quantity of PSV, FiO2 and PEEP settings/hour) 6. Nursing workload (frequency of alarm "clean CO2 cuvette"/hour) 7. ICU and hospital mortality | |
| Notes | Protocol registration not reported. ITT analysis. Sample size calculation based on 80% power to detect a difference of 2 days in weaning time, α 0.05, 54 patients each group. Local ethics committee approval; signed informed consent from patients or relatives | |
| Risk of bias | ||
| Bias | Authors' judgement | Support for judgement |
| Random sequence generation (selection bias) | Low risk | Randomization list generated using RITA version 1.13a. Stratified randomization with age and duration of MV prior to weaning |
| Allocation concealment (selection bias) | Low risk | Opaque sealed envelopes |
| Blinding of participants and personnel (performance bias) | High risk | Participants, staff and research personnel were unblinded to the intervention |
| Blinding of outcome assessment (detection bias) | Low risk | On contact, authors stated that "outcome assessors were independent from those managing patient care" |
| Incomplete outcome data (attrition bias) | Low risk | All a priori outcomes reported. ITT analysis performed |
| Selective reporting (reporting bias) | Low risk | Appears to be free of other sources of bias |
| Other bias | Unclear risk | Sample size calculation stated (based on 80% power to detect a difference of 2 days in weaning time, α 0.05, 54 patients each group). Unplanned interim analysis was undertaken because of low recruitment after 1 year: sample size and significance levels were recalculated (N = 60 patients) and after the 60th patient the trial was stopped for futility |
| Methods | Randomized controlled trial | |
| Participants | Setting: USA, Medical ICU. Hospital description and staffing ratios not stated Participants: 15 adult patients (intervention 9, control 6) Conditions: COPD/asthma; septic shock; ARDS; pulmonary oedema Inclusion: mechanically ventilated; judged ready to wean by physicians and meeting prespecified inclusion criteria Exclusion: postoperative patients < 3 days | |
| Interventions | Intervention: protocol delivered by a computer‐controlled weaning system (Supersport model 2, Zenith Data Systems) consisting of stepwise reductions in SIMV and PSV responsive to tidal volume & respiratory rate sampling (computer‐directed algorithm) Control: weaning with SIMV and PS reduction as judged appropriate by the patient's physician | |
| Outcomes | 1. Time spent with RR < 8 or > 30 2. Time spent with tidal volume < 5 mL/kg 3. No. of arterial blood gases drawn during weaning 4. Weaning duration 5. MV prior to weaning | |
| Notes | Protocol registration not reported. ITT performed. No sample size calculation performed. Study period and data collection were limited to 48 hours because only one computer system was available for the study. Study approved by hospital Institutional Review Board and informed consent required | |
| Risk of bias | ||
| Bias | Authors' judgement | Support for judgement |
| Random sequence generation (selection bias) | Low risk | Random number table |
| Allocation concealment (selection bias) | Low risk | Sealed envelopes |
| Blinding of participants and personnel (performance bias) | High risk | Impossible to blind personnel to the intervention groups |
| Blinding of outcome assessment (detection bias) | Unclear risk | Outcome assessors were independent from the individuals administering/supervising the intervention |
| Incomplete outcome data (attrition bias) | Low risk | No missing outcome data. Recruitment and attrition data presented |
| Selective reporting (reporting bias) | Low risk | All prespecified outcomes reported |
| Other bias | Low risk | Appears to be free of other sources of bias. No sample size calculation stated |
ARDS ‐ acute respiratory distress syndrome; ASB ‐ assisted spontaneous breathing; CPAP ‐ continuous positive airway pressure; CHF ‐ congestive heart failure; COPD ‐ chronic obstructive pulmonary disease; GI ‐ gastrointestinal; ICU ‐ intensive care unit; IMV ‐ intermittent mandatory ventilation; ITT ‐ intention to treat; MD ‐ medical doctor; MSOF ‐ multi‐system organ failure; MV ‐ mechanical ventilation; NIV = non‐invasive ventilation; PC ‐ personal computer; PEEP ‐ positive end expiratory pressure; PS ‐ pressure support; PSV ‐ pressure support ventilation; RN ‐ registered nurse; RR ‐ respiratory rate; RT ‐ respiratory therapist; SBT‐ spontaneous breathing trial; SD ‐standard deviation; VAP ‐ ventilator‐associated pneumonia.
Characteristics of excluded studies [ordered by study ID]
Ir a:
| Study | Reason for exclusion |
| Compared an automated protocol with protocol guided weaning. The comparator did not fulfil our inclusion criteria | |
| Intervention group was weaned using a computer protocol and compared with a control group where weaning was undertaken using standardized guidelines. Control group did not meet the review inclusion criteria (i.e. was not 'non‐protocolized' according to our definition) | |
| The authors evaluated automated (computerized) protocolized weaning in a population of acute respiratory distress syndrome patients using a cluster randomized controlled trial. From the papers, we were unable to identify the comparator or the weaning outcomes and we were unable to contact the authors to obtain further information | |
| Compared two weaning protocols involving gradual pressure support reduction with or without a spontaneous breathing trial. The comparator did not fulfil our inclusion criteria | |
| Intervention group was weaned using a computer protocol and compared with a control group where weaning was undertaken using standardized guidelines. Control group did not meet the review inclusion criteria (i.e. was not 'non‐protocolized' according to our definition) | |
| Compared computer‐driven automated weaning system with a local protocol based on local written weaning guidelines | |
| Compared the use of a spontaneous breathing trial (SBT) prior to extubation versus no SBT prior to extubation when both groups met weaning readiness criteria. The intervention does not fulfil the definition of a weaning protocol | |
| Compared an automated protocol with a standard weaning protocol. The comparator did not fulfil our inclusion criteria | |
| The authors evaluated automated (computerized) protocolized weaning in a population of acute respiratory distress syndrome patients using a cluster randomized controlled trial. From the papers, we were unable to identify the comparator or the weaning outcomes and we were unable to contact the authors to obtain further information | |
| This was a cluster randomized controlled trial comparing an evidence based protocol with standard practice (no guidelines). The study was stopped due to recruitment problems and we were unable to obtain sufficient data to include it in the review | |
| Compared an automated protocol with a standard weaning protocol. The comparator did not fulfil our inclusion criteria | |
| Control group weaning is not 'non‐protocolized' according to our definition | |
| Intervention group was weaned using a computer protocol and compared with a control group where weaning was undertaken using standardized guidelines. Control group did not meet the review inclusion criteria (i.e. was not 'non‐protocolized' according to our definition) | |
| Types of participants were tracheotomized patients only. Did not meet our study inclusion criteria |
Data and analyses
| Outcome or subgroup title | No. of studies | No. of participants | Statistical method | Effect size |
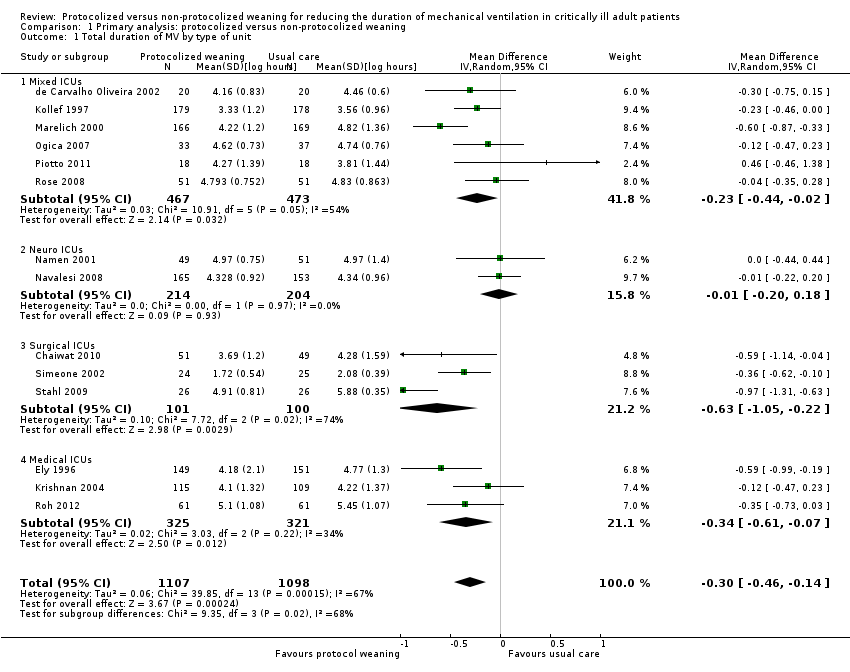
| 1 Total duration of MV by type of unit Show forest plot | 14 | 2205 | Mean Difference (IV, Random, 95% CI) | ‐0.30 [‐0.46, ‐0.14] |
| Analysis 1.1  Comparison 1 Primary analysis: protocolized versus non‐protocolized weaning, Outcome 1 Total duration of MV by type of unit. | ||||
| 1.1 Mixed ICUs | 6 | 940 | Mean Difference (IV, Random, 95% CI) | ‐0.23 [‐0.44, ‐0.02] |
| 1.2 Neuro ICUs | 2 | 418 | Mean Difference (IV, Random, 95% CI) | ‐0.01 [‐0.20, 0.18] |
| 1.3 Surgical ICUs | 3 | 201 | Mean Difference (IV, Random, 95% CI) | ‐0.63 [‐1.05, ‐0.22] |
| 1.4 Medical ICUs | 3 | 646 | Mean Difference (IV, Random, 95% CI) | ‐0.34 [‐0.61, ‐0.07] |
| 2 Total duration of MV by type of approach Show forest plot | 14 | 2205 | Mean Difference (IV, Random, 95% CI) | ‐0.30 [‐0.46, ‐0.14] |
| Analysis 1.2 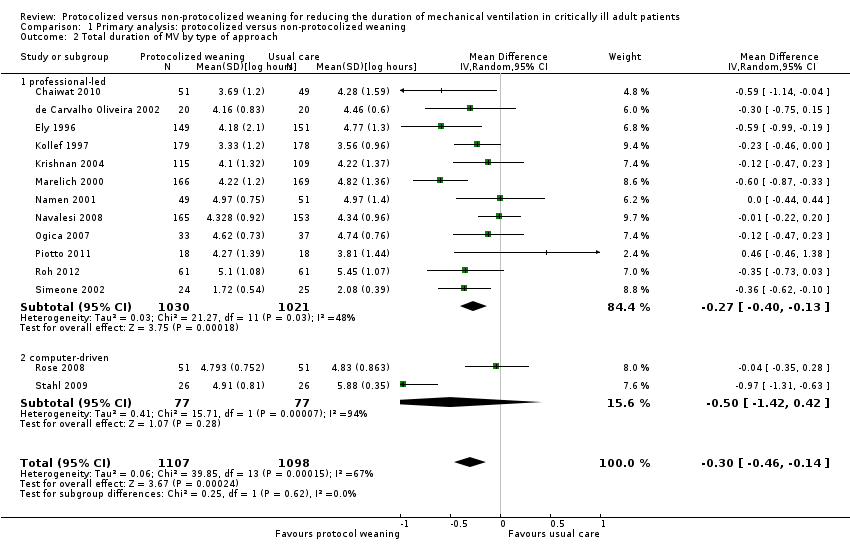 Comparison 1 Primary analysis: protocolized versus non‐protocolized weaning, Outcome 2 Total duration of MV by type of approach. | ||||
| 2.1 professional‐led | 12 | 2051 | Mean Difference (IV, Random, 95% CI) | ‐0.27 [‐0.40, ‐0.13] |
| 2.2 computer‐driven | 2 | 154 | Mean Difference (IV, Random, 95% CI) | ‐0.50 [‐1.42, 0.42] |
| 3 Total duration of MV by type of protocol [log hours] Show forest plot | 14 | 2205 | Mean Difference (IV, Random, 95% CI) | ‐0.30 [‐0.46, ‐0.14] |
| Analysis 1.3 ![Comparison 1 Primary analysis: protocolized versus non‐protocolized weaning, Outcome 3 Total duration of MV by type of protocol [log hours].](/cdsr/doi/10.1002/14651858.CD006904.pub3/media/CDSR/CD006904/image_n/nCD006904-CMP-001-03.png) Comparison 1 Primary analysis: protocolized versus non‐protocolized weaning, Outcome 3 Total duration of MV by type of protocol [log hours]. | ||||
| 3.1 SBT protocol | 8 | 1188 | Mean Difference (IV, Random, 95% CI) | ‐0.18 [‐0.36, 0.00] |
| 3.2 Stepwise reduction protocol | 6 | 1017 | Mean Difference (IV, Random, 95% CI) | ‐0.42 [‐0.66, ‐0.18] |
| 4 Mortality Show forest plot | 14 | 2234 | Odds Ratio (M‐H, Fixed, 95% CI) | 1.02 [0.82, 1.26] |
| Analysis 1.4  Comparison 1 Primary analysis: protocolized versus non‐protocolized weaning, Outcome 4 Mortality. | ||||
| 4.1 Hospital mortality | 8 | 1523 | Odds Ratio (M‐H, Fixed, 95% CI) | 1.04 [0.82, 1.32] |
| 4.2 ICU mortality | 7 | 711 | Odds Ratio (M‐H, Fixed, 95% CI) | 0.93 [0.58, 1.48] |
| 5 Reintubation Show forest plot | 11 | 1487 | Odds Ratio (M‐H, Random, 95% CI) | 0.74 [0.44, 1.23] |
| Analysis 1.5 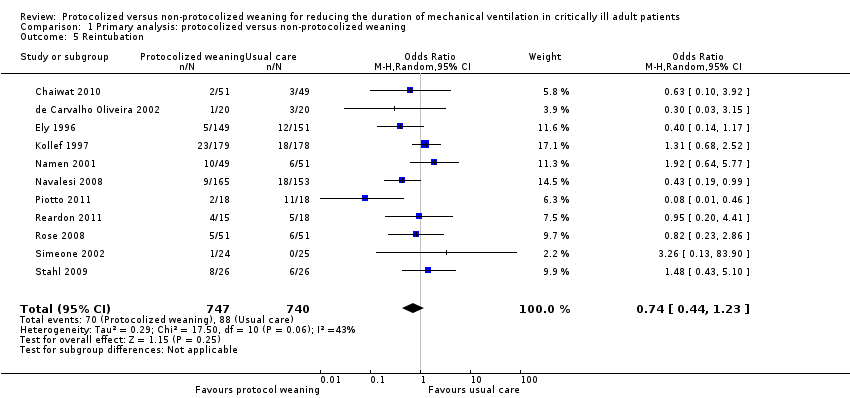 Comparison 1 Primary analysis: protocolized versus non‐protocolized weaning, Outcome 5 Reintubation. | ||||
| 6 Self extubation Show forest plot | 3 | 433 | Odds Ratio (M‐H, Random, 95% CI) | 0.43 [0.14, 1.34] |
| Analysis 1.6  Comparison 1 Primary analysis: protocolized versus non‐protocolized weaning, Outcome 6 Self extubation. | ||||
| 7 Tracheostomy Show forest plot | 8 | 1346 | Odds Ratio (M‐H, Random, 95% CI) | 0.85 [0.51, 1.40] |
| Analysis 1.7 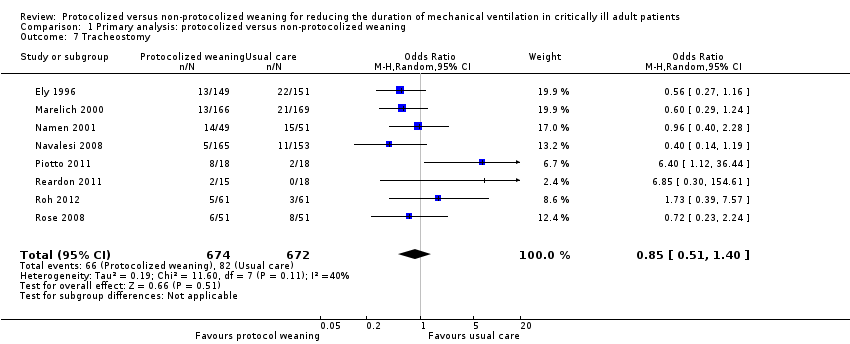 Comparison 1 Primary analysis: protocolized versus non‐protocolized weaning, Outcome 7 Tracheostomy. | ||||
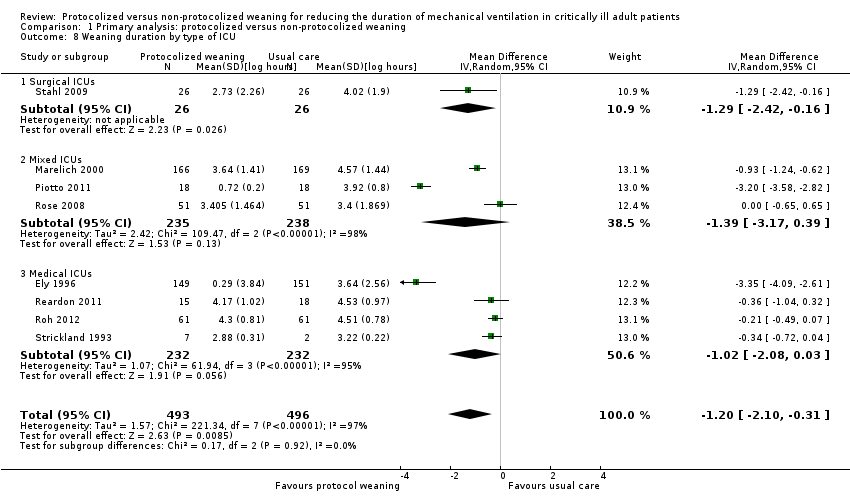
| 8 Weaning duration by type of ICU Show forest plot | 8 | 989 | Mean Difference (IV, Random, 95% CI) | ‐1.20 [‐2.10, ‐0.31] |
| Analysis 1.8  Comparison 1 Primary analysis: protocolized versus non‐protocolized weaning, Outcome 8 Weaning duration by type of ICU. | ||||
| 8.1 Surgical ICUs | 1 | 52 | Mean Difference (IV, Random, 95% CI) | ‐1.29 [‐2.42, ‐0.16] |
| 8.2 Mixed ICUs | 3 | 473 | Mean Difference (IV, Random, 95% CI) | ‐1.39 [‐3.17, 0.39] |
| 8.3 Medical ICUs | 4 | 464 | Mean Difference (IV, Random, 95% CI) | ‐1.02 [‐2.08, 0.03] |
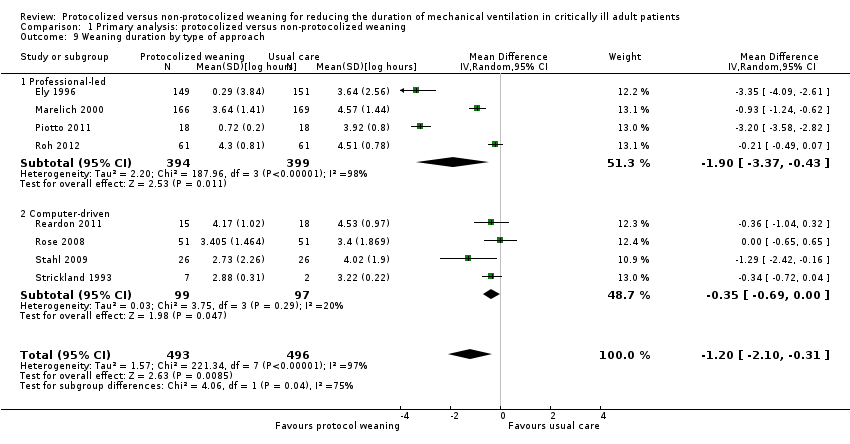
| 9 Weaning duration by type of approach Show forest plot | 8 | 989 | Mean Difference (IV, Random, 95% CI) | ‐1.20 [‐2.10, ‐0.31] |
| Analysis 1.9  Comparison 1 Primary analysis: protocolized versus non‐protocolized weaning, Outcome 9 Weaning duration by type of approach. | ||||
| 9.1 Professional‐led | 4 | 793 | Mean Difference (IV, Random, 95% CI) | ‐1.90 [‐3.37, ‐0.43] |
| 9.2 Computer‐driven | 4 | 196 | Mean Difference (IV, Random, 95% CI) | ‐0.35 [‐0.69, ‐0.00] |
| 10 Weaning duration by type of protocol [log hours] Show forest plot | 8 | 989 | Mean Difference (IV, Random, 95% CI) | ‐1.20 [‐2.10, ‐0.31] |
| Analysis 1.10 ![Comparison 1 Primary analysis: protocolized versus non‐protocolized weaning, Outcome 10 Weaning duration by type of protocol [log hours].](/cdsr/doi/10.1002/14651858.CD006904.pub3/media/CDSR/CD006904/image_n/nCD006904-CMP-001-10.png) Comparison 1 Primary analysis: protocolized versus non‐protocolized weaning, Outcome 10 Weaning duration by type of protocol [log hours]. | ||||
| 10.1 SBT protocol | 2 | 336 | Mean Difference (IV, Random, 95% CI) | ‐3.23 [‐3.57, ‐2.89] |
| 10.2 Stepwise reduction protocol | 6 | 653 | Mean Difference (IV, Random, 95% CI) | ‐0.46 [‐0.81, ‐0.12] |
| 11 ICU length of stay Show forest plot | 9 | 1378 | Mean Difference (IV, Fixed, 95% CI) | ‐0.12 [‐0.21, ‐0.03] |
| Analysis 1.11  Comparison 1 Primary analysis: protocolized versus non‐protocolized weaning, Outcome 11 ICU length of stay. | ||||
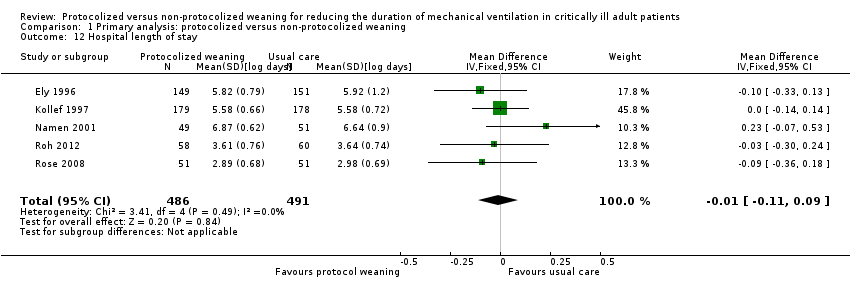
| 12 Hospital length of stay Show forest plot | 5 | 977 | Mean Difference (IV, Fixed, 95% CI) | ‐0.01 [‐0.11, 0.09] |
| Analysis 1.12  Comparison 1 Primary analysis: protocolized versus non‐protocolized weaning, Outcome 12 Hospital length of stay. | ||||
| 13 ICU costs Show forest plot | 2 | 400 | Mean Difference (IV, Random, 95% CI) | 3.37 [‐15.02, 21.76] |
| Analysis 1.13  Comparison 1 Primary analysis: protocolized versus non‐protocolized weaning, Outcome 13 ICU costs. | ||||
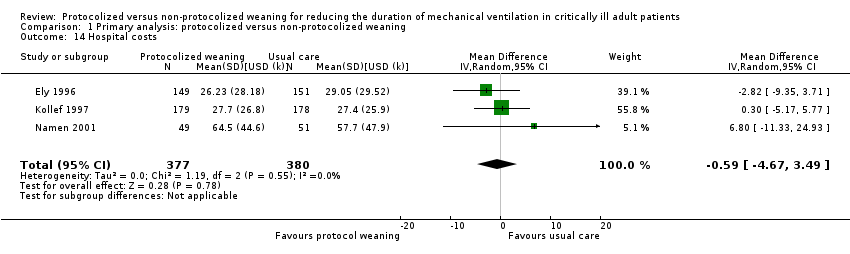
| 14 Hospital costs Show forest plot | 3 | 757 | Mean Difference (IV, Random, 95% CI) | ‐0.59 [‐4.67, 3.49] |
| Analysis 1.14  Comparison 1 Primary analysis: protocolized versus non‐protocolized weaning, Outcome 14 Hospital costs. | ||||
| Outcome or subgroup title | No. of studies | No. of participants | Statistical method | Effect size |
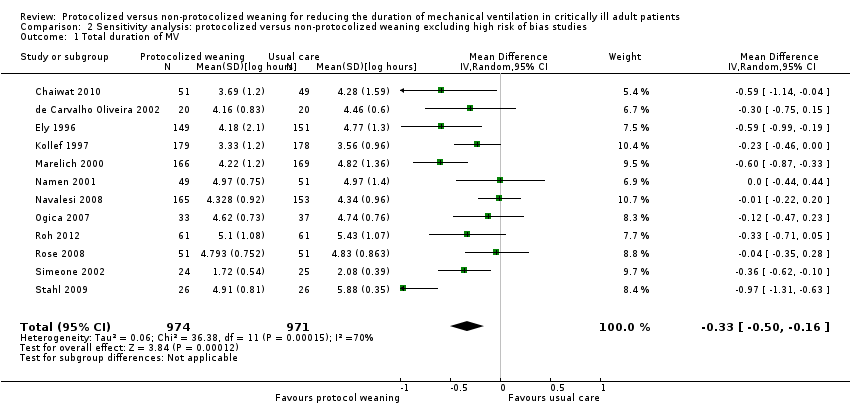
| 1 Total duration of MV Show forest plot | 12 | 1945 | Mean Difference (IV, Random, 95% CI) | ‐0.33 [‐0.50, ‐0.16] |
| Analysis 2.1  Comparison 2 Sensitivity analysis: protocolized versus non‐protocolized weaning excluding high risk of bias studies, Outcome 1 Total duration of MV. | ||||
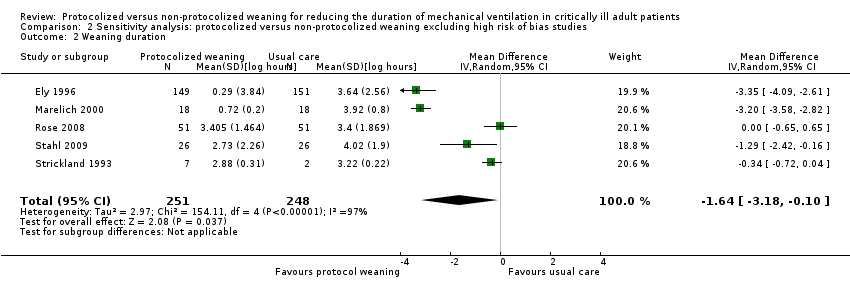
| 2 Weaning duration Show forest plot | 5 | 499 | Mean Difference (IV, Random, 95% CI) | ‐1.64 [‐3.18, ‐0.10] |
| Analysis 2.2  Comparison 2 Sensitivity analysis: protocolized versus non‐protocolized weaning excluding high risk of bias studies, Outcome 2 Weaning duration. | ||||
| Outcome or subgroup title | No. of studies | No. of participants | Statistical method | Effect size |
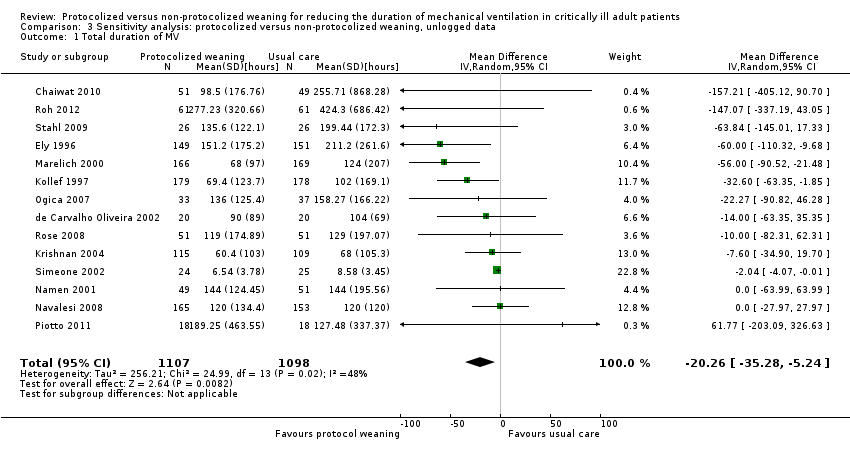
| 1 Total duration of MV Show forest plot | 14 | 2205 | Mean Difference (IV, Random, 95% CI) | ‐20.26 [‐35.28, ‐5.24] |
| Analysis 3.1  Comparison 3 Sensitivity analysis: protocolized versus non‐protocolized weaning, unlogged data, Outcome 1 Total duration of MV. | ||||
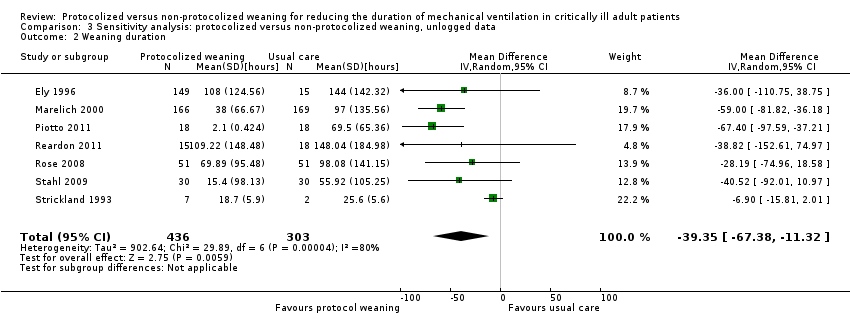
| 2 Weaning duration Show forest plot | 7 | 739 | Mean Difference (IV, Random, 95% CI) | ‐39.35 [‐67.38, ‐11.32] |
| Analysis 3.2  Comparison 3 Sensitivity analysis: protocolized versus non‐protocolized weaning, unlogged data, Outcome 2 Weaning duration. | ||||
| 3 ICU length of stay Show forest plot | 9 | 1378 | Mean Difference (IV, Fixed, 95% CI) | ‐9.08 [‐15.85, ‐2.30] |
| Analysis 3.3  Comparison 3 Sensitivity analysis: protocolized versus non‐protocolized weaning, unlogged data, Outcome 3 ICU length of stay. | ||||
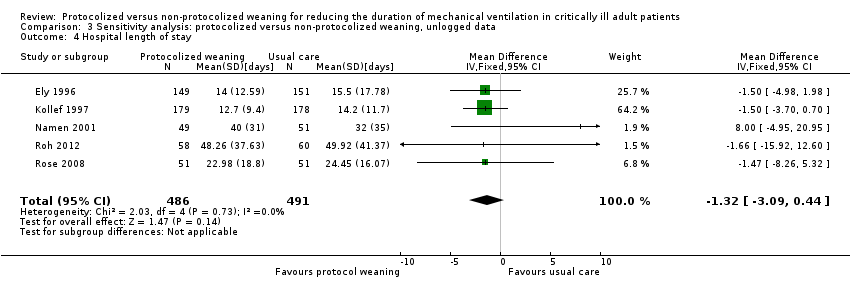
| 4 Hospital length of stay Show forest plot | 5 | 977 | Mean Difference (IV, Fixed, 95% CI) | ‐1.32 [‐3.09, 0.44] |
| Analysis 3.4  Comparison 3 Sensitivity analysis: protocolized versus non‐protocolized weaning, unlogged data, Outcome 4 Hospital length of stay. | ||||

Updated study flow diagram.

Methodological quality graph: review authors' judgements about each methodological quality item presented as percentages across all included studies.

Methodological quality summary: review authors' judgements about each methodological quality item for each included study.
![Forest plot of comparison: 1 Primary analysis: protocolized versus non‐protocolized weaning, outcome: 1.3 Total duration of mechanical ventilation by type of protocol [log hours].](/es/cdsr/doi/10.1002/14651858.CD006904.pub3/media/CDSR/CD006904/image_n/nCD006904-AFig-FIG04.png)
Forest plot of comparison: 1 Primary analysis: protocolized versus non‐protocolized weaning, outcome: 1.3 Total duration of mechanical ventilation by type of protocol [log hours].
![Forest plot of comparison: 1 Primary analysis: protocolized versus non‐protocolized weaning, outcome: 1.9 Weaning duration by type of approach [log hours].](/es/cdsr/doi/10.1002/14651858.CD006904.pub3/media/CDSR/CD006904/image_n/nCD006904-AFig-FIG05.png)
Forest plot of comparison: 1 Primary analysis: protocolized versus non‐protocolized weaning, outcome: 1.9 Weaning duration by type of approach [log hours].
![Funnel plot of comparison: 1 Primary analysis: protocolized versus non‐protocolized weaning, outcome: 1.2 Total duration of MV by type of approach [log hours].](/es/cdsr/doi/10.1002/14651858.CD006904.pub3/media/CDSR/CD006904/image_n/nCD006904-AFig-FIG06.png)
Funnel plot of comparison: 1 Primary analysis: protocolized versus non‐protocolized weaning, outcome: 1.2 Total duration of MV by type of approach [log hours].
Comparison 1 Primary analysis: protocolized versus non‐protocolized weaning, Outcome 1 Total duration of MV by type of unit.

Comparison 1 Primary analysis: protocolized versus non‐protocolized weaning, Outcome 2 Total duration of MV by type of approach.
![Comparison 1 Primary analysis: protocolized versus non‐protocolized weaning, Outcome 3 Total duration of MV by type of protocol [log hours].](/es/cdsr/doi/10.1002/14651858.CD006904.pub3/media/CDSR/CD006904/image_n/nCD006904-CMP-001-03.png)
Comparison 1 Primary analysis: protocolized versus non‐protocolized weaning, Outcome 3 Total duration of MV by type of protocol [log hours].

Comparison 1 Primary analysis: protocolized versus non‐protocolized weaning, Outcome 4 Mortality.

Comparison 1 Primary analysis: protocolized versus non‐protocolized weaning, Outcome 5 Reintubation.

Comparison 1 Primary analysis: protocolized versus non‐protocolized weaning, Outcome 6 Self extubation.

Comparison 1 Primary analysis: protocolized versus non‐protocolized weaning, Outcome 7 Tracheostomy.
Comparison 1 Primary analysis: protocolized versus non‐protocolized weaning, Outcome 8 Weaning duration by type of ICU.
Comparison 1 Primary analysis: protocolized versus non‐protocolized weaning, Outcome 9 Weaning duration by type of approach.
![Comparison 1 Primary analysis: protocolized versus non‐protocolized weaning, Outcome 10 Weaning duration by type of protocol [log hours].](/es/cdsr/doi/10.1002/14651858.CD006904.pub3/media/CDSR/CD006904/image_n/nCD006904-CMP-001-10.png)
Comparison 1 Primary analysis: protocolized versus non‐protocolized weaning, Outcome 10 Weaning duration by type of protocol [log hours].

Comparison 1 Primary analysis: protocolized versus non‐protocolized weaning, Outcome 11 ICU length of stay.
Comparison 1 Primary analysis: protocolized versus non‐protocolized weaning, Outcome 12 Hospital length of stay.

Comparison 1 Primary analysis: protocolized versus non‐protocolized weaning, Outcome 13 ICU costs.
Comparison 1 Primary analysis: protocolized versus non‐protocolized weaning, Outcome 14 Hospital costs.
Comparison 2 Sensitivity analysis: protocolized versus non‐protocolized weaning excluding high risk of bias studies, Outcome 1 Total duration of MV.
Comparison 2 Sensitivity analysis: protocolized versus non‐protocolized weaning excluding high risk of bias studies, Outcome 2 Weaning duration.
Comparison 3 Sensitivity analysis: protocolized versus non‐protocolized weaning, unlogged data, Outcome 1 Total duration of MV.
Comparison 3 Sensitivity analysis: protocolized versus non‐protocolized weaning, unlogged data, Outcome 2 Weaning duration.

Comparison 3 Sensitivity analysis: protocolized versus non‐protocolized weaning, unlogged data, Outcome 3 ICU length of stay.
Comparison 3 Sensitivity analysis: protocolized versus non‐protocolized weaning, unlogged data, Outcome 4 Hospital length of stay.
| Protocolized versus non‐protocolized weaning for reducing the duration of mechanical ventilation in critically ill adult patients | |||||
| Patient or population: mechanically ventilated adult patients Settings: intensive care units Intervention: protocolized weaning Comparison: non‐protocolized weaning | |||||
| Outcomes | Illustrative comparative risks* (95% CI) | Effect Estimates (95% CI) | No of Participants | Quality of the evidence | |
| Assumed risk non‐protocolized weaning | Corresponding risk protocolized weaning | ||||
| Total duration of mechanical ventilation (hours) | Mean 96 hours1 | Mean 71 hours (60.5 to 83.5 hours) | Geometric mean difference ‐26% (‐37% to ‐13%) | 2205 | +++O |
| Weaning duration (hours) | Mean 24 hours1 | Mean 7 hours (2.8 to 17.5 hours) | Geometric mean difference ‐70% (‐88% to ‐27%) | 989 | ++OO |
| ICU length of stay (days) | Mean 8 days1 | Mean 7 days (6.5 to 7.8 days) | Geometric mean difference ‐11% (‐19% to ‐3%) | 1378 [9 studies] | ++OO |
| ICU mortality | 31%1 | 30% (20% to 42%) | OR 0.97 (0.57 to 1.63) | 651 [6 studies] | +++O |
| Reintubation | 10%1 (following deliberate extubation) | 8% (5% to 12%) | OR 0.74 (0.44 to 1.23) | 1487 [11 studies] | ++OO |
| *The basis for the assumed risk (e.g. the mean control group risk) is provided in footnotes. The corresponding risk (and its 95% confidence interval) is based on the assumed risk in the comparison group and the effect estimate of the intervention (and its 95% CI). | |||||
| GRADE Working Group grades of evidence | |||||
| 1 The assumed risk is derived from the median reported in a large epidemiological study of characteristics and outcomes in patients (N = 4968) receiving mechanical ventilation by Esteban 2008. The reported medians were used as an approximation for the means used for illustrative comparisons of all continuous variables. The table shows the mean duration of mechanical ventilation, weaning and ICU length of stay if patients are not weaning by protocol (non‐protocolized weaning) and what would be expected with protocolized weaning based on the effect estimates from our review. 2 There was considerable variability in effect estimates (I2 = 67%) that could not be explained by subgroup analysis although variability was lower than the previous review. The confidence interval was narrower in this review and the difference at the lower limit would still be clinically significant. 3 There was considerable variability in effect estimates (I2 = 97%) and the wide confidence intervals indicate imprecision in results. The lower limit suggests a one hour difference in weaning that is not clinically significant. 4 There was no heterogeneity among trials effects estimates, but wide confidence intervals indicate imprecision in results. 5 There was moderate variability in effect estimates (I2 = 50%). 6 There was moderate variability in effect estimates (I2 = 43%). | |||||
| Study | Assessment frequency | Oxygenation | Other respiratory factors | Cardiovascular | Neurological | Inflammatory response | Medication | Other |
| Daily screen | PaO2/FiO2 >/= 200 on FiO2 </= 0.4 SpO2 >/= 94% | PEEP </= 5 Respiratory rate < 35 Rapid Shallow breathing index </= 105 Static lung compliance >/= 25 mL/cmH2O Minute volume </= 10L/min | HR < 120 b/min | Awake and easily rousable | Not included | Dopamine </= 5 ug/kg/min Noradrenaline </= 5 ug/kg/min | Pain score < 4 | |
| Not reported | PaO2 < 90 on FiO2 </= 0.4 | PEEP < 5 Pimax < ‐ 25 cm H2O | Not included | GCS > 8 | Not included | No sedation No vasopressors | Cause of MV resolved No planned surgery | |
| Daily screen
| PaO2/FiO2 > 200 | PEEP </= 5 f/VT </= 105 | Not included | Not included | Not included | No vasopressors or sedation | Adequate cough
| |
| Daily screen | Not reported | Not reported | Not reported | Not reported | Not reported | Not reported | Not reported | |
| Protocol entry criteria
| PaO2/FiO2 > 200 | PEEP </= 5 RR </= 35 b/min
| HR < 140 b/min | Awake and orientated | Not included | No vasoactive or inotropic agents | Not included | |
| Daily screen
| SpO2 >/= 92% FiO2 </= 0.5 | PEEP </=5
| Stable CAD HR < 140 b/min | No raised ICP | Not included | No paralytics | Cough and gag reflex present Responsive to stimuli
| |
| x 2 daily screen
| PaO2/FiO2 >/= 200 | Not included | MAP >/= 60 mmHg | GCS >/= 10 or tracheostomy | Not included | No vasopressors Dopamine </= 5 ug/kg/min | Adequate cough not limited by pain
| |
| Daily screen | PaO2/FiO2 > 200 | PEEP </= 5 f/VT </= 105 | Not included | Not included | Not included | No vasopressors or sedation | Adequate cough
| |
| Daily screen | PaO2/FiO2 > 200 FiO2 </= 0.4 pH >/= 7.35 PaCO2 </= 50 mmHg | PEEP </= 5
| HR </= 125 b/min SBP >/= 90 mmHg | GCS >/= 8 | T < 38.5oC | No vasopressors Dopamine </= 5 ug/kg/min | Adequate cough Suctioning < 2/hr Normal Na blood values
| |
| Not reported | Not reported | Not reported | Not reported | Not reported | Not reported | Not reported | Not reported | |
| Daily screen | PaO2/FiO2 150‐300 FiO2 </= 0.4 PaO2 >/= 60 mmHg Hb = 8 ‐ 10 g/L
| Not included | MAP >/= 60 mmHg HR </= 140 b/min | Awake GCS >/= 9 | T < 37.8oC | Minimum sedation No or low vasopressors | Cause of MV resolved Effective cough Metabolic stability No hydroelectrolyte disorders
| |
| Daily screen | SaO2 > 90% or PaO2 > 60 mmHg on FiO2 </= 0.5 | Respiratory rate < 35 pH > 7.20 Triggering breaths | SBP > 90 and < 180 HR > 50 and < 130 No cardiac ischaemia | GCS > 8 | Not included | Minimal pressure requirements | Improving condition Absence of excessive secretions Suctioning < hourly Deemed ready to wean | |
| Not reported | FiO2 </= 0.5 | RR </= 35 PEEP </= 8 Triggering breaths | SBP >/= 90 mmHg HR </= 150 b/min | Not included | Not included | No paralytics No vasopressors Dopamine </= 5 ug/kg/min Noradrenaline </= 5 ug/kg/min | Not included | |
| Inclusion criteria | PaO2/FiO2 > 150 or SaO2 >/= 90% on FiO2 0.5 | PEEP </= 8 Plateau pressure </= 30 cmH2O Successful 30 min SBT using PS 20 cm H2O to achieve TV > 200 mL
| Haemodynamically stable | GCS > 4 | T = 36 ‐ 39oC | Not included | No surgery anticipated MV > 24 hr
| |
| Inclusion criteria | PaO2/FiO2 >/= 200 FiO2 < 0.5 pH 7.3 ‐ 7.5 PaO2 30 ‐ 50 mmHg SaO2 > 90% Hb > 8 mg/dL Pulse oximeter oxygenation stable Cardiopulmonary bypass time < 150 min | PEEP < 4 RR < 35 b/min Dynamic compliance > 22 mL/cmH2O Compliance statica >33 mL/cmH2O Vital capacity >10 mL/kg MIP >/= ‐15 cmH2O
| Haemodynamically stable | Awake and conscious | T > 35 < 38oC | Not included | Urine output > 100 mL/hr Normal CXR | |
| Inclusion criteria | FiO2 </= 0.5 PaO2 > 75 mmHg or SaO2 > 90% pH </= 7.2 Hb >/= 7g/dL | PEEP </= 10 | Haemodynamically stable | Not included | Not included | Dopamine </= 5 ug/kg/min | MV > 24 hr Breathing spontaneously Ramsey sedation score =/< 3
| |
| Inclusion criteria | FiO2 </= 0.4 pH >/= 7.3 </= 7.5 PCO2 >/= 30 </= 50 SaO2 >/= 90% on SIMV rate 6 ‐ 10 PS 20 cmH2O | NIF </= ‐ 20 cmH2O FVC >/= 10 mL/kg TV 10 ‐ 15 mL/kg
| Haemodynamically stable | Not included | T </= 37oC | Not included | Judged ready to wean by physician Feeding ‐ parenteral or tube Stable renal function Normal electrolytes
| |
| CAD = coronary artery diease; CXR = chest X‐ray; GCS = Glasgow Coma Scale; FVC = forced vital capacity; Hb = haemoglobin; HR ‐ heart rate; MAP = mean arterial pressure; MIP = maximal inspiratory pressure; MV = mechanical ventilation; NIF = negative inspiratory force; PEEP = positive end expiratory pressure; Pimax = maximal inspiratory mouth pressure; PS = pressure support; RR = respiratory rate; SBP = systolic blood pressure; SIMV = synchronized intermittent mechanical ventilation; T = temperature; TV = tidal volume; f/VT = ratio of respiratory frequency to tidal volume. | ||||||||
| Study | Time of randomization | Intervention protocol | Extubation criteria | Comparator (usual practice) |
| ICU admission | SBP on PS 7 cmH2O, PEEP 5 cmH2O for 2 hours | Notify MD | Not reported | |
| Not reported | SBP on PS 7 cmH2O, PEEP 5 cmH2O for 2 hours | Yes | Not reported | |
| Enrolment, time not reported | SBT 2 hour on CPAP 5 cmH2O | Notify MD | Not reported | |
| Not reported | a) SBT 30 minutes and extubation if passed b) If failed, daily SBT and stepwise reduction in SIMV and PS until 4 breaths/min and PS 7 cmH2O | Not reported | Not reported | |
| ICU admission | a) SBT 30 to 60 min on CPAP 5 cmH2O, PS 6 cmH2O b) PS stepwise reduction to 6 cmH2O c) IMV stepwise reduction to 0 breaths/min, on PEEP 5 cmH2O and PS 6 cmH2O for 30 to 60 min | a) Yes
b) Yes c) Yes | Not reported | |
| Not reported | SBT 1 hour on CPAP 5 cmH2O | Notify MD | Not reported | |
| On meeting weaning criteria | a) < 72‐hour admissions: SBT 30 min on PS </= 8 cmH2O & PEEP </= 8 cmH2O b) > 72‐hour admissions: PEEP, IMV and PS stepwise reductions to achieve FiO2 0.5, PEEP </= 8 cmH2O, IMV </= 6 breaths/min, PS </= 8 cmH2O then SBT as above | a) Notify MD
b) Notify MD | Not reported | |
| On meeting weaning criteria | SBT 2 hours on CPAP 5 cmH2O | Notify MD | Not reported | |
| Enrolment, time not reported | SBT 1 hour on CPAP 2 to 3 cmH2O, FiO2 0.4 | Yes | Not reported | |
| Not reported | SBT (details not reported) | Not reported | Not reported | |
| Not reported | SBT 2 hours on PS 7 cmH2O, PEEP 5 cmH2O, FiO2 0.4, RR 1 breath/min | Yes | Stepwise reduction in PS and IMV | |
| On meeting weaning criteria | Computer automated SmartCareTM/PS with stepwise reductions to PS 7 cmH2O and PEEP 5 cmH2O | Notify MD | Stepwise reduction in PS and SBT | |
| On meeting weaning criteria | CPAP trial on 5 cmH2O, then stepwise reductions in PS to 5 cmH2O, then SBT on T‐piece for 30 minutes | Yes | Not reported | |
| On meeting weaning criteria | Computer automated SmartCareTM/PS with stepwise reductions to PS 7 cmH2O and PEEP 5 cmH2O | No | Stepwise reduction in PS and PEEP | |
| Not reported | SIMV and PS stepwise reductions to SIMV 0 breath/min and PS 4 cmH2O | Yes | Not reported | |
| On meeting weaning criteria | Computer automated SmartCareTM/PS stepwise reductions to PS | Yes | Spepwise reduction in PS and CPAP | |
| On meeting weaning criteria | Computer automated Supersport model 2 stepwise reductions in SIMV and PS to RR 2 breaths/min and PS 5 cmH2O | Not reported | Stepwise reduction in IMV and PS | |
| CPAP = continuous positive airway pressure; IMV = intermittent mechanical ventilation; MD = Medical Doctor; PEEP = positive end expiratory pressure; PS = pressure support; SBT = spontaneous breathing trial; SIMV =synchronized intermittent mechanical ventilation; RR = respiratory rate. | ||||
| Outcome or subgroup title | No. of studies | No. of participants | Statistical method | Effect size |
| 1 Total duration of MV by type of unit Show forest plot | 14 | 2205 | Mean Difference (IV, Random, 95% CI) | ‐0.30 [‐0.46, ‐0.14] |
| 1.1 Mixed ICUs | 6 | 940 | Mean Difference (IV, Random, 95% CI) | ‐0.23 [‐0.44, ‐0.02] |
| 1.2 Neuro ICUs | 2 | 418 | Mean Difference (IV, Random, 95% CI) | ‐0.01 [‐0.20, 0.18] |
| 1.3 Surgical ICUs | 3 | 201 | Mean Difference (IV, Random, 95% CI) | ‐0.63 [‐1.05, ‐0.22] |
| 1.4 Medical ICUs | 3 | 646 | Mean Difference (IV, Random, 95% CI) | ‐0.34 [‐0.61, ‐0.07] |
| 2 Total duration of MV by type of approach Show forest plot | 14 | 2205 | Mean Difference (IV, Random, 95% CI) | ‐0.30 [‐0.46, ‐0.14] |
| 2.1 professional‐led | 12 | 2051 | Mean Difference (IV, Random, 95% CI) | ‐0.27 [‐0.40, ‐0.13] |
| 2.2 computer‐driven | 2 | 154 | Mean Difference (IV, Random, 95% CI) | ‐0.50 [‐1.42, 0.42] |
| 3 Total duration of MV by type of protocol [log hours] Show forest plot | 14 | 2205 | Mean Difference (IV, Random, 95% CI) | ‐0.30 [‐0.46, ‐0.14] |
| 3.1 SBT protocol | 8 | 1188 | Mean Difference (IV, Random, 95% CI) | ‐0.18 [‐0.36, 0.00] |
| 3.2 Stepwise reduction protocol | 6 | 1017 | Mean Difference (IV, Random, 95% CI) | ‐0.42 [‐0.66, ‐0.18] |
| 4 Mortality Show forest plot | 14 | 2234 | Odds Ratio (M‐H, Fixed, 95% CI) | 1.02 [0.82, 1.26] |
| 4.1 Hospital mortality | 8 | 1523 | Odds Ratio (M‐H, Fixed, 95% CI) | 1.04 [0.82, 1.32] |
| 4.2 ICU mortality | 7 | 711 | Odds Ratio (M‐H, Fixed, 95% CI) | 0.93 [0.58, 1.48] |
| 5 Reintubation Show forest plot | 11 | 1487 | Odds Ratio (M‐H, Random, 95% CI) | 0.74 [0.44, 1.23] |
| 6 Self extubation Show forest plot | 3 | 433 | Odds Ratio (M‐H, Random, 95% CI) | 0.43 [0.14, 1.34] |
| 7 Tracheostomy Show forest plot | 8 | 1346 | Odds Ratio (M‐H, Random, 95% CI) | 0.85 [0.51, 1.40] |
| 8 Weaning duration by type of ICU Show forest plot | 8 | 989 | Mean Difference (IV, Random, 95% CI) | ‐1.20 [‐2.10, ‐0.31] |
| 8.1 Surgical ICUs | 1 | 52 | Mean Difference (IV, Random, 95% CI) | ‐1.29 [‐2.42, ‐0.16] |
| 8.2 Mixed ICUs | 3 | 473 | Mean Difference (IV, Random, 95% CI) | ‐1.39 [‐3.17, 0.39] |
| 8.3 Medical ICUs | 4 | 464 | Mean Difference (IV, Random, 95% CI) | ‐1.02 [‐2.08, 0.03] |
| 9 Weaning duration by type of approach Show forest plot | 8 | 989 | Mean Difference (IV, Random, 95% CI) | ‐1.20 [‐2.10, ‐0.31] |
| 9.1 Professional‐led | 4 | 793 | Mean Difference (IV, Random, 95% CI) | ‐1.90 [‐3.37, ‐0.43] |
| 9.2 Computer‐driven | 4 | 196 | Mean Difference (IV, Random, 95% CI) | ‐0.35 [‐0.69, ‐0.00] |
| 10 Weaning duration by type of protocol [log hours] Show forest plot | 8 | 989 | Mean Difference (IV, Random, 95% CI) | ‐1.20 [‐2.10, ‐0.31] |
| 10.1 SBT protocol | 2 | 336 | Mean Difference (IV, Random, 95% CI) | ‐3.23 [‐3.57, ‐2.89] |
| 10.2 Stepwise reduction protocol | 6 | 653 | Mean Difference (IV, Random, 95% CI) | ‐0.46 [‐0.81, ‐0.12] |
| 11 ICU length of stay Show forest plot | 9 | 1378 | Mean Difference (IV, Fixed, 95% CI) | ‐0.12 [‐0.21, ‐0.03] |
| 12 Hospital length of stay Show forest plot | 5 | 977 | Mean Difference (IV, Fixed, 95% CI) | ‐0.01 [‐0.11, 0.09] |
| 13 ICU costs Show forest plot | 2 | 400 | Mean Difference (IV, Random, 95% CI) | 3.37 [‐15.02, 21.76] |
| 14 Hospital costs Show forest plot | 3 | 757 | Mean Difference (IV, Random, 95% CI) | ‐0.59 [‐4.67, 3.49] |
| Outcome or subgroup title | No. of studies | No. of participants | Statistical method | Effect size |
| 1 Total duration of MV Show forest plot | 12 | 1945 | Mean Difference (IV, Random, 95% CI) | ‐0.33 [‐0.50, ‐0.16] |
| 2 Weaning duration Show forest plot | 5 | 499 | Mean Difference (IV, Random, 95% CI) | ‐1.64 [‐3.18, ‐0.10] |
| Outcome or subgroup title | No. of studies | No. of participants | Statistical method | Effect size |
| 1 Total duration of MV Show forest plot | 14 | 2205 | Mean Difference (IV, Random, 95% CI) | ‐20.26 [‐35.28, ‐5.24] |
| 2 Weaning duration Show forest plot | 7 | 739 | Mean Difference (IV, Random, 95% CI) | ‐39.35 [‐67.38, ‐11.32] |
| 3 ICU length of stay Show forest plot | 9 | 1378 | Mean Difference (IV, Fixed, 95% CI) | ‐9.08 [‐15.85, ‐2.30] |
| 4 Hospital length of stay Show forest plot | 5 | 977 | Mean Difference (IV, Fixed, 95% CI) | ‐1.32 [‐3.09, 0.44] |