Različito trajanje liječenja kortikosteroidima u egzacerbaciji kronične opstruktivne bolesti pluća
Referencias
References to studies included in this review
References to studies excluded from this review
References to ongoing studies
Additional references
Characteristics of studies
Characteristics of included studies [ordered by study ID]
| Methods | STUDY DESIGN: parallel group LOCATION/NUMBER OF CENTRES: inpatients in China, unknown number of centres DURATION OF STUDY: 14 days | |
| Participants | N SCREENED = not stated N RANDOMISED = SCS ≤ 7 days n = 44, SCS > 7 days n = 43 N COMPLETED = SCS ≤ 7 days n = 41, SCS > 7 days n = 40 M = 98 F = 32 AGE INT = 70.3, CONTROL = 71.7 (NS diff) SMOKERS: INT = 18/44 (41%), CONTROL = 20/43 (47%) (NS diff) BASELINE DETAILS: Baseline comparison of groups showed no significant differences in age, gender, course of disease, proportion of current smokers or the prestudy course of exacerbation INCLUSION CRITERIA: exacerbation of COPD: type 2 AEs (i.e. at least 2/3 increased dyspnoea, increased sputum, purulent sputum); use of diagnostic criteria for COPD: 2 years of continuous productive cough, FEV1/FVC post bronchodilator < 0.7, FEV1 < 80% predicted EXCLUSION CRITERIA: respiratory failure, diabetes, bronchial asthma | |
| Interventions | SCS ≤ 7 days: prednisolone 30 mg/d 7 days + placebo 7 days SCS > 7 days: prednisolone 30 mg/d 10 days + 15 mg/d 5 days Delivery: oral Co‐interventions permitted: not stated Co‐interventions not permitted: not stated Follow‐up period: not stated | |
| Outcomes | Outcomes measured: lung function, arterial blood gas measurement, days of hospitalisation Composite symptom score: highest 18 (worse) to lowest 0 (no symptoms) for breathlessness, sputum volume, cough, amount of sleep, exercise capacity, wheezing Treatment failure: no definition stated | |
| Notes | INVESTIGATOR‐SUPPLIED DATA: outcomes reported: absolute values and change in FEV1, FEV1/FVC ratio, PEF, PaO2 | |
| Risk of bias | ||
| Bias | Authors' judgement | Support for judgement |
| Random sequence generation (selection bias) | Low risk | Stochastic function used to create 150 numbers 0 to 1 |
| Allocation concealment (selection bias) | Low risk | Sealed envelopes used and allocated by third party |
| Blinding (performance bias and detection bias) | Low risk | Participants: use of identical boxes and medications Researchers: blinded to medications |
| Incomplete outcome data (attrition bias) | Low risk | Numbers of failed treatment given, numbers with side effects given and information included in publication |
| Selective reporting (reporting bias) | Unclear risk | Results given by study author for FEV1, PaO2, symptom scores, rate of relapse, number of side effects, number with failed treatment No information on hospital duration |
| Methods | STUDY DESIGN: parallel LOCATION, NUMBER OF CENTRES: Cairo, Egypt DURATION OF STUDY: 14 days | |
| Participants | N SCREENED: not stated N RANDOMISED: 42 N COMPLETED: not stated M not stated/F not stated AGE: not stated BASELINE DETAILS: not stated EXCLUSION CRITERIA: not stated | |
| Interventions | SCS ≤ 7 days: prednisolone 30 mg 7 days SCS > 7 days: prednisolone 30 mg 14 days Co‐interventions: not stated FOLLOW‐UP PERIOD: 30 days | |
| Outcomes | FEV1 day 1, day 7, day 14 and day 30 Symptom score evaluation (breathlessness, cough and sputum) | |
| Notes | Information from abstract only | |
| Risk of bias | ||
| Bias | Authors' judgement | Support for judgement |
| Random sequence generation (selection bias) | Unclear risk | Not stated |
| Allocation concealment (selection bias) | Unclear risk | Not stated |
| Blinding (performance bias and detection bias) | Unclear risk | States single blinded but no details on blinding provided |
| Incomplete outcome data (attrition bias) | Unclear risk | Specific data not provided |
| Selective reporting (reporting bias) | Unclear risk | Inadequate information to address |
| Methods | STUDY DESIGN: parallel LOCATION, NUMBER OF CENTRES: Switzerland, recruited in 5 teaching hospitals DURATION OF STUDY: 14 days, follow‐up 180 days | |
| Participants | N SCREENED: 717 N RANDOMISED: 314 N COMPLETED: 296 M = 188, F = 123 BASELINE DETAILS: Gender F: SCS ≤ 7 days 33%/SCS > 7 days 47% (P value 0.02) CURRENT SMOKERS: SCS ≤ 7 days 49%/SCS > 7 days 40% LTOT: SCS ≤ 7 days 16%/SCS > 7 days 11% AGE: SCS ≤ 7 days: 69.8 (11.3)/SCS > 7 days 69.8 (10.6) FEV1 % predicted: SCS ≤ 7 days 32 (SD 15)/SCS > 7 days 31 (SD 13) PYH SMOKING median years: SCS ≤ 7 days 50/SCS > 7 days 45 INCLUSION CRITERIA: age > 40 years, smoking history ≥ 20 pack‐years EXCLUSION CRITERIA: history of asthma, FEV1/FVC ratio > 0.7 (post bronchodilator), radiological diagnosis of pneumonia, estimated survival < 6 months (due to severe co‐morbidity), pregnancy or lactation, inability to give written consent | |
| Interventions | SCS ≤ 7 days: 5 days: day 1: IV methylprednisolone 40 mg, days 2 to 5: oral prednisolone 40 mg, days 6to 14: placebo SCS > 7 days: 14 days: day 1: IV methylprednisolone 40 mg, days 2 to 14: oral 40 mg prednisolone Co‐interventions:
Physiotherapy, supplemental oxygen and ventilator support (administered according to international guidelines) TREATMENT PERIOD: 5 days vs 14 days TREATMENT SETTING: inpatient after presentation to ED. Treated as outpatients after discharge direct from ED; INT: 12 participants (7.7%); CONTROL: 13 participants (8.4%) FOLLOW‐UP PERIOD: 180 days | |
| Outcomes | FEV1 % predicted Adverse effects: (infection, hyperglycaemia, hypertension, other) Relapse Duration of hospital stay Mortality Quality of life (bronchitis‐associated quality‐of‐life score, 0 to 6 = worst) Patient‐reported overall performance (visual analogue scale) Dyspnoea (Medical Research Council Dyspnoea score 1 to 5 = worst) | |
| Notes | More women in the short‐term arm (46.5% vs 32.7%; P value 0.02). ISRCTN19646069. | |
| Risk of bias | ||
| Bias | Authors' judgement | Support for judgement |
| Random sequence generation (selection bias) | Low risk | Randomly assigned to one of two treatment regimens using a centralised, computerbased |
| Allocation concealment (selection bias) | Low risk | Each study subject randomly assigned to receive a prepared set of study medication, consisting of two drug vials. The drugs prepared prior to the initiation of the study and packed by the Pharmacology Department, University Hospital, Basel, according to a randomisation list. |
| Blinding (performance bias and detection bias) | Low risk | Patients, caregivers, outcome assessors, data collectors, the biostatistician, and all other investigators remained blinded to group allocation until the primary analysis was completed. |
| Incomplete outcome data (attrition bias) | Low risk | Three patients excluded after randomisation in a blinded fashion because of erroneous initial COPD diagnoses. Data from remaining 311 patients were used for intention‐to‐treat analyses. 296 patients completed 14‐day treatment |
| Selective reporting (reporting bias) | Low risk | Prior to its initiation, the study was registered (ISRCTN19646069). The protocol summary published on the |
| Methods | STUDY DESIGN: parallel LOCATION, NUMBER OF CENTRES: Bangladesh, single tertiary‐care centre DURATION OF STUDY: 14 days | |
| Participants | N SCREENED: not stated N RANDOMISED: not stated N COMPLETED: not stated M = not stated F = not stated AGE: claimed no significant difference between groups BASELINE DETAILS: claimed no significant difference between groups EXCLUSION CRITERIA: not stated | |
| Interventions | SCS ≤ 7 days: 7‐day group received oral prednisolone 30 mg/d for 7 days SCS > 7 days: 14‐day group administered 30 mg/d oral prednisolone for 14 days Co‐interventions: not stated TREATMENT PERIOD: 7 days vs 14 days FOLLOW‐UP PERIOD: not stated | |
| Outcomes | FEV1, FVC, symptom score (specific symptoms not stated) | |
| Notes | No reply from study author to request for more information about study and results | |
| Risk of bias | ||
| Bias | Authors' judgement | Support for judgement |
| Random sequence generation (selection bias) | Unclear risk | Not stated |
| Allocation concealment (selection bias) | Unclear risk | Not stated |
| Blinding (performance bias and detection bias) | Unclear risk | Claimed to be single blind; however did not state whether 7‐day group received placebo for the extra 7 days |
| Incomplete outcome data (attrition bias) | Unclear risk | Not stated |
| Selective reporting (reporting bias) | Unclear risk | Not stated |
| Methods | STUDY DESIGN: parallel LOCATION, NUMBER OF CENTRES: unclear DURATION OF STUDY: 10 days | |
| Participants | N SCREENED: not stated N RANDOMISED: 21 N COMPLETED: not clear M = no details available F = no details available AGE: no details available BASELINE DETAILS: study authors stated no significant differences between groups at baseline EXCLUSION CRITERIA: not stated | |
| Interventions | SCS ≤ 7 days: 3 days of IV CS dose not stated and 7 days of placebo SCS > 7 days: 3 days of intravenous (IV) CS and 7 days oral CS dose not stated Co‐interventions: not stated TREATMENT PERIOD: 10 days vs 3 days FOLLOW‐UP PERIOD: not stated | |
| Outcomes | FEV1, FVC, dyspnoea, cough | |
| Notes | Request to study author for more information about the study and results—no data supplied | |
| Risk of bias | ||
| Bias | Authors' judgement | Support for judgement |
| Random sequence generation (selection bias) | Unclear risk | Not stated |
| Allocation concealment (selection bias) | Unclear risk | Not stated |
| Blinding (performance bias and detection bias) | Unclear risk | Yes, but more information required to decide if adequate |
| Incomplete outcome data (attrition bias) | Unclear risk | Not stated |
| Selective reporting (reporting bias) | Unclear risk | Not stated |
| Methods | STUDY DESIGN: parallel LOCATION, NUMBER OF CENTRES: Izmir, Turkey. 1 tertiary centre DURATION OF STUDY: 6 months | |
| Participants | N SCREENED: 198 N RANDOMISED: 36 N COMPLETED: 34 (SCS ≤ 7 n = 17; SCS > 7 n = 17) M = SCS ≤ 7: 16, SCS > 7: 16 F = SCS ≤ 7: 1, SCS > 7: 1 AGE: SCS ≤ 7: 67.4 SCS > 7: 64.1 BASELINE DETAILS: no significant differences between the 2 groups for age, duration of COPD, smoking history, blood eosinophilia, baseline levels of FEV1 Number of exacerbations within 12 months (31 participants): no differences between groups LTOT SCS ≤ 7: 5 (29%); SCS > 7: 2 (12%) Prior medication: ipratropium bromide, long‐acting beta2‐agonists and theophylline EXCLUSION CRITERIA: personal or family history of asthma, atopy, allergic disease, presence of eosinophilia, use of systemic steroids within the preceding month, presence of severe hypertension, uncompensated congestive heart failure or uncontrolled (or difficult to control) diabetes mellitus and respiratory failure necessitating mechanical ventilation therapy | |
| Interventions | SCS ≤ 7: methylprednisolone, 0.5 mg/kg IV 6‐hourly for 3 days, followed by normal saline solution as placebo treatment IV twice daily for the following 3 days and once daily for the final 4 days SCS > 7: methylprednisolone, 0.5 mg/kg IV 6‐hourly for the first 3 days, followed by 0.5 mg/kg 12‐hourly for 3 days and 0.5 mg/kg once daily for 4 more days (total 10 days) Co‐interventions: all given high doses of inhaled beta2‐agonists, ipratropium bromide, theophylline (dose determined according to serum level measurements), antibiotics when indicated (presence of increased dyspnoea, sputum volume and sputum purulence) for 10 days, and H2‐receptor antagonists for 10 days, during which they received the study medication TREATMENT PERIOD: 10 days. All participants remained hospitalised for at least 10 days FOLLOW‐UP PERIOD: following 6 months | |
| Outcomes | FEV1and PaO2 levels on day 3 and day 10, absolute group means Arterial blood gas levels day 1, day 3, day 5, day 7 and day 10 (arterial blood gases taken on room air after cessation of supplemental oxygen 30 minutes before, if the participant was on oxygen) Symptom scores (dyspnoea, cough) Recurrence of exacerbation in the following 6 months (collected by review of participants' records) Adverse events. Symptom scores (using 7‐point scale on which higher scores represented better function) | |
| Notes | ||
| Risk of bias | ||
| Bias | Authors' judgement | Support for judgement |
| Random sequence generation (selection bias) | Low risk | Randomisation sequence was generated before recruitment of participants. This was done by allocating study participants to odd numbers and the control group to even numbers Randomisation code was broken only after all data were analysed and statistical analysis was performed |
| Allocation concealment (selection bias) | Low risk | Randomisation code was set up and sealed opaque envelopes were prepared before study initiation by one of the study authors (AS), who also prepared the study medications along with the head nurse |
| Blinding (performance bias and detection bias) | Low risk | Double‐blind study: participants and data collectors blinded Only the principal investigator (AS) and the head nurse were informed about the randomisation list Participants were blinded to the nature of the IV medications. On inclusion of a participant in the study, the related envelope was opened and the drug package was given to the nurse in charge of treatment Physician/investigator who followed the participant, recorded arterial blood gas results, performed bedside spirometry and assessed symptom scores remained blinded to the study medication |
| Incomplete outcome data (attrition bias) | Low risk | 2 withdrawals. 1 from each group, reason given |
| Selective reporting (reporting bias) | Low risk | Days 5 and 7 spirometry and ABG results not included. Reason:A comparison of 3 days vs 10 days of treatment was chosen for the 2 groups because these times were roughly the treatment duration in previous studies showing that steroids were effective. Both regimens were of relatively short duration, and the potential for adverse events was taken into account |
| Methods | STUDY DESIGN: parallel LOCATION, NUMBER OF CENTRES: Thailand, single tertiary‐care centre (King Chulalongkorn Memorial Hospital) DURATION OF STUDY: 30 days | |
| Participants | N SCREENED: 107 N RANDOMISED: 48 N COMPLETED: 42 M = SCS ≤ 7: 22; SCS > 7: 20 F = SCS ≤ 7: 3; SCS > 7: 3 AGE: SCS ≤ 7: 72.45 ± 9.62 years; SCS > 7: 73.39 ± 9.16 years BASELINE DETAILS: not stated INCLUSION CRITERIA: participant with COPD who presented with acute exacerbation and age > 40 years Definition of acute exacerbation of COPD: at least 2 of 3 of these symptoms: increased dyspnoea, increased sputum volume, increased purulent sputum Persistence of symptoms at least 24 hours EXCLUSION CRITERIA: patient with history of asthma, atopic, allergy, bronchiectasis, lung cancer, pneumonia Respiratory failure Previously used systemic corticosteroids within preceding 30 days Poorly controlled DM, severe infection | |
| Interventions | SCS ≤ 7: 5‐day group received prednisolone 30 mg/d for 5 days SCS > 7: 10‐day group was administered 30 mg/d prednisolone for 10 days Co‐interventions: not stated TREATMENT PERIOD: 5 days vs 10 days FOLLOW‐UP PERIOD: 30 days | |
| Outcomes | FEV1, FVC, IC, clinical symptoms, fasting plasma glucose and CRP | |
| Notes | Investigators supplied group mean data for FEV1 (L), FVC (L), IC (L), fasting plasma glucose(mg/dL), CRP (mg/L) and recurrent exacerbation within 30 days | |
| Risk of bias | ||
| Bias | Authors' judgement | Support for judgement |
| Random sequence generation (selection bias) | Unclear risk | Block randomisation |
| Allocation concealment (selection bias) | Low risk | Opaque envelopes used |
| Blinding (performance bias and detection bias) | High risk | Participants, investigators, outcome assessors not blinded |
| Incomplete outcome data (attrition bias) | High risk | Number of participants in group 1 was 25, and the number completing the study was 19 |
| Selective reporting (reporting bias) | Unclear risk | Protocol not available |
| Methods | STUDY DESIGN: parallel 3‐group design DURATION OF STUDY: 2 weeks | |
| Participants | N SCREENED: 47 N RANDOMISED: 38 N COMPLETED: 28 (20 withdrawals, 1 death) M = 24 F = 14 AGE: SCS ≤ 7: 69.3, SD 5.5: SCS > 7: 71.1, SD 9.7 BASELINE DETAILS: not stated INCLUSION CRITERIA: > 40 years of age; > 10 pack‐year smoking history; FEV1 < 50% of predicted value | |
| Interventions | SCS ≤ 7: prednisolone 2.5 mg/kg orally daily for 3 days followed by 11 days placebo | |
| Outcomes | Measured: spirometry, 6‐minute walking distance, duration of hospitalisation, PaO2, PaCO2, visual analogue scale of breathlessness (in mm on a 100‐mm scale, more breathless represented by a higher number), treatment failure (no definition), mortality, adverse events | |
| Notes | Study stopped early after 36 months because of poor enrolment. Results published as abstract, and study data available to review authors. Data analysed by review authors in 3 groups. Data from 3‐day and 14‐day treatment groups used in the review | |
| Risk of bias | ||
| Bias | Authors' judgement | Support for judgement |
| Random sequence generation (selection bias) | Low risk | Computer‐generated random numbers table |
| Allocation concealment (selection bias) | Unclear risk | information not available |
| Blinding (performance bias and detection bias) | Low risk | Participants blinded to allocation until completion |
| Incomplete outcome data (attrition bias) | Low risk | Full data on outcomes listed in protocol are available |
| Selective reporting (reporting bias) | Low risk | None identified |
ABG: arterial blood gas; COPD: chronic obstructive pulmonary disease; CRP: C‐reactive protein; CS: corticosteroid; ED: emergency department; FEV1: forced expiratory volume in 1 second; FVC: forced vital capacity; GOLD: Global Strategy for Diagnosis, Management, and Prevention of COPD; IC: inspiratory capacity; INT: intervention; LTOT: long‐term oxygen therapy; PaCO2: partial pressure of carbon dioxide in arterial blood; PaO2: partial pressure of oxygen in arterial blood; PEF: peak expiratory flow; SCS: systemic corticosteroid; SD: standard deviation.
Characteristics of excluded studies [ordered by study ID]
| Study | Reason for exclusion |
| Did not assess different durations of corticosteroid treatment | |
| Compared intravenous methylprednisolone vs placebo for 3 days in exacerbations of COPD | |
| Article was a comment on RCT of carbocysteine | |
| Compared systemic corticosteroids vs placebo | |
| Compared oral steroid vs placebo in stable COPD | |
| Compared oral steroid vs placebo in exacerbations of COPD | |
| Compared oral vs IV corticosteroid given for 5 days | |
| Study of stable COPD not exacerbation | |
| Comparison of methylprednisolone vs dexamethasone in the treatment of patients with acute exacerbations of COPD | |
| Article was a letter on a study by Bullard 1996 |
Characteristics of ongoing studies [ordered by study ID]
| Trial name or title | A randomised double blind study of short course systemic steroids versus conventional 14 days course in acute exacerbations of COPD |
| Methods | Randomised controlled trial, blinded, parallel |
| Participants | Inclusion criteria: All patients admitted to the Royal Hobart Hospital with the primary diagnosis of acute exacerbation of COPD No age limit, males and females Exclusion criteria:
|
| Interventions | Intervention group 1: prednisolone 0.5 mg/kg for 14 days Intervention group 2: prednisolone of 1 mg/kg for 3 days (max 50 mg) + 11 days placebo Control group: placebo |
| Outcomes | Length of stay in hospital, rate of treatment failure, symptom score, lung function tests, sputum cellularity |
| Starting date | 07/07/2007. Recruiting not completed |
| Contact information | Dr David Reid, Prof EH Walters. Menzies Research Institute, Tasmania, Hobart TAS 7001, Australia. +61 3 62267043; [email protected] |
| Notes |
COPD: chronic obstructive pulmonary disease; CS: corticosteroid; GP: general practitioner; ICS: inhaled corticosteroid.
Data and analyses
| Outcome or subgroup title | No. of studies | No. of participants | Statistical method | Effect size |
| 1 Treatment failure Show forest plot | 4 | 457 | Odds Ratio (M‐H, Fixed, 95% CI) | 0.72 [0.36, 1.46] |
| Analysis 1.1 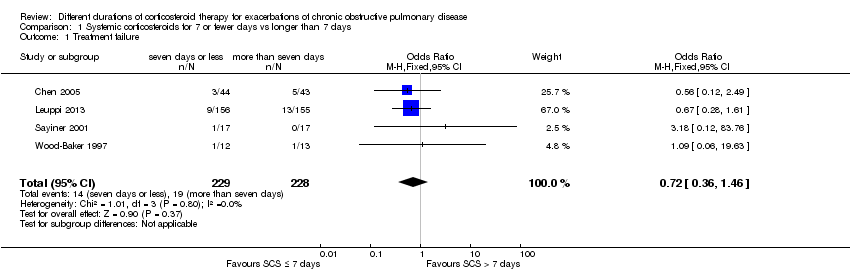 Comparison 1 Systemic corticosteroids for 7 or fewer days vs longer than 7 days, Outcome 1 Treatment failure. | ||||
| 2 Relapse Show forest plot | 4 | 478 | Odds Ratio (M‐H, Fixed, 95% CI) | 1.04 [0.70, 1.56] |
| Analysis 1.2  Comparison 1 Systemic corticosteroids for 7 or fewer days vs longer than 7 days, Outcome 2 Relapse. | ||||
| 3 Time to re‐exacerbation Show forest plot | 1 | Hazard Ratio (Fixed, 95% CI) | Subtotals only | |
| Analysis 1.3  Comparison 1 Systemic corticosteroids for 7 or fewer days vs longer than 7 days, Outcome 3 Time to re‐exacerbation. | ||||
| 4 Adverse effect—hyperglycaemia Show forest plot | 2 | 345 | Odds Ratio (M‐H, Fixed, 95% CI) | 0.99 [0.64, 1.53] |
| Analysis 1.4  Comparison 1 Systemic corticosteroids for 7 or fewer days vs longer than 7 days, Outcome 4 Adverse effect—hyperglycaemia. | ||||
| 5 Adverse effect—hypertension Show forest plot | 1 | Odds Ratio (M‐H, Fixed, 95% CI) | Subtotals only | |
| Analysis 1.5  Comparison 1 Systemic corticosteroids for 7 or fewer days vs longer than 7 days, Outcome 5 Adverse effect—hypertension. | ||||
| 6 Other adverse effects—gastrointestinal tract bleeding, symptomatic gastrointestinal reflux, symptoms of congestive heart failure or ischaemic heart disease, sleep disturbance, fractures, depression Show forest plot | 5 | 503 | Odds Ratio (M‐H, Fixed, 95% CI) | 0.89 [0.46, 1.69] |
| Analysis 1.6  Comparison 1 Systemic corticosteroids for 7 or fewer days vs longer than 7 days, Outcome 6 Other adverse effects—gastrointestinal tract bleeding, symptomatic gastrointestinal reflux, symptoms of congestive heart failure or ischaemic heart disease, sleep disturbance, fractures, depression. | ||||
| 7 Mortality Show forest plot | 2 | 336 | Odds Ratio (M‐H, Fixed, 95% CI) | 0.91 [0.40, 2.06] |
| Analysis 1.7 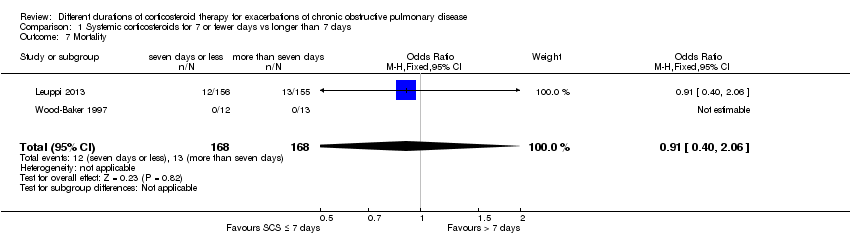 Comparison 1 Systemic corticosteroids for 7 or fewer days vs longer than 7 days, Outcome 7 Mortality. | ||||
| 8 Length of hospitalisation Show forest plot | 3 | 421 | Mean Difference (IV, Fixed, 95% CI) | ‐0.61 [‐1.51, 0.28] |
| Analysis 1.8  Comparison 1 Systemic corticosteroids for 7 or fewer days vs longer than 7 days, Outcome 8 Length of hospitalisation. | ||||
| 9 FEV1 (L) (early) Show forest plot | 3 | 96 | Mean Difference (IV, Fixed, 95% CI) | ‐0.07 [‐0.19, 0.05] |
| Analysis 1.9  Comparison 1 Systemic corticosteroids for 7 or fewer days vs longer than 7 days, Outcome 9 FEV1 (L) (early). | ||||
| 9.1 FEV1 absolute | 2 | 75 | Mean Difference (IV, Fixed, 95% CI) | ‐0.08 [‐0.22, 0.06] |
| 9.2 FEV1 change | 1 | 21 | Mean Difference (IV, Fixed, 95% CI) | ‐0.04 [‐0.27, 0.19] |
| 10 FEV1 % predicted (6 days) Show forest plot | 1 | Mean Difference (IV, Fixed, 95% CI) | Subtotals only | |
| Analysis 1.10 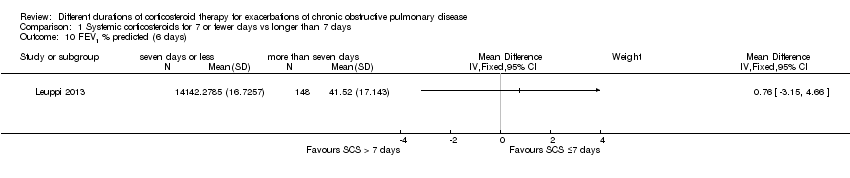 Comparison 1 Systemic corticosteroids for 7 or fewer days vs longer than 7 days, Outcome 10 FEV1 % predicted (6 days). | ||||
| 11 FVC (L) (early) Show forest plot | 3 | 97 | Mean Difference (IV, Fixed, 95% CI) | 0.01 [‐0.20, 0.22] |
| Analysis 1.11 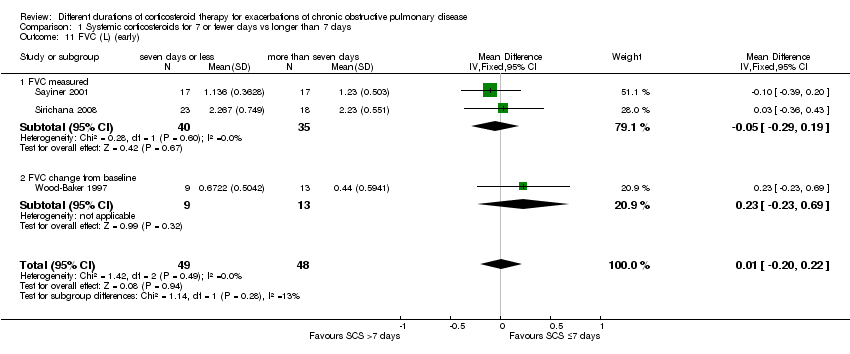 Comparison 1 Systemic corticosteroids for 7 or fewer days vs longer than 7 days, Outcome 11 FVC (L) (early). | ||||
| 11.1 FVC measured | 2 | 75 | Mean Difference (IV, Fixed, 95% CI) | ‐0.05 [‐0.29, 0.19] |
| 11.2 FVC change from baseline | 1 | 22 | Mean Difference (IV, Fixed, 95% CI) | 0.23 [‐0.23, 0.69] |
| 12 FEV1 (L) end of treatment Show forest plot | 4 | 187 | Mean Difference (IV, Random, 95% CI) | ‐0.04 [‐0.19, 0.10] |
| Analysis 1.12  Comparison 1 Systemic corticosteroids for 7 or fewer days vs longer than 7 days, Outcome 12 FEV1 (L) end of treatment. | ||||
| 12.1 FEV1 measured | 3 | 164 | Mean Difference (IV, Random, 95% CI) | ‐0.05 [‐0.25, 0.16] |
| 12.2 FEV1 change from baseline | 1 | 23 | Mean Difference (IV, Random, 95% CI) | ‐0.04 [‐0.23, 0.14] |
| 13 FEV1 % predicted 30 days Show forest plot | 1 | Mean Difference (IV, Fixed, 95% CI) | Subtotals only | |
| Analysis 1.13  Comparison 1 Systemic corticosteroids for 7 or fewer days vs longer than 7 days, Outcome 13 FEV1 % predicted 30 days. | ||||
| 14 FVC (L) end of treatment Show forest plot | 3 | 99 | Mean Difference (IV, Fixed, 95% CI) | ‐0.12 [‐0.33, 0.09] |
| Analysis 1.14  Comparison 1 Systemic corticosteroids for 7 or fewer days vs longer than 7 days, Outcome 14 FVC (L) end of treatment. | ||||
| 14.1 FVC measured | 2 | 77 | Mean Difference (IV, Fixed, 95% CI) | ‐0.14 [‐0.39, 0.11] |
| 14.2 FVC change from baseline | 1 | 22 | Mean Difference (IV, Fixed, 95% CI) | ‐0.07 [‐0.44, 0.29] |
| 15 PaO2 (mmHg) (early) Show forest plot | 1 | Mean Difference (IV, Fixed, 95% CI) | Totals not selected | |
| Analysis 1.15  Comparison 1 Systemic corticosteroids for 7 or fewer days vs longer than 7 days, Outcome 15 PaO2 (mmHg) (early). | ||||
| 16 PaO2 (mmHg) end of treatment Show forest plot | 2 | 121 | Mean Difference (IV, Fixed, 95% CI) | ‐1.38 [‐4.96, 2.21] |
| Analysis 1.16 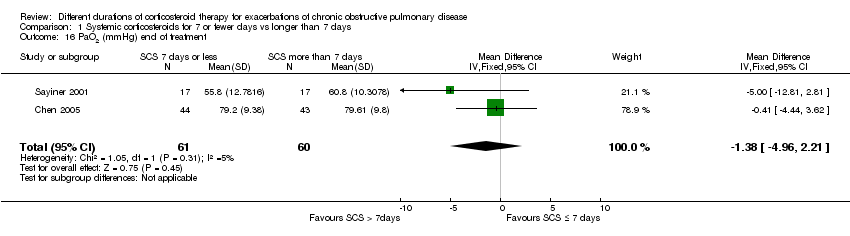 Comparison 1 Systemic corticosteroids for 7 or fewer days vs longer than 7 days, Outcome 16 PaO2 (mmHg) end of treatment. | ||||
| 17 PaCO2 (mmHg) Show forest plot | 1 | Mean Difference (IV, Fixed, 95% CI) | Totals not selected | |
| Analysis 1.17  Comparison 1 Systemic corticosteroids for 7 or fewer days vs longer than 7 days, Outcome 17 PaCO2 (mmHg). | ||||
| 17.1 3 days of follow‐up | 1 | Mean Difference (IV, Fixed, 95% CI) | 0.0 [0.0, 0.0] | |
| 17.2 10 days of follow‐up | 1 | Mean Difference (IV, Fixed, 95% CI) | 0.0 [0.0, 0.0] | |
| 18 Symptoms—dyspnoea (early) Show forest plot | 2 | 320 | Std. Mean Difference (IV, Fixed, 95% CI) | ‐0.08 [‐0.29, 0.14] |
| Analysis 1.18 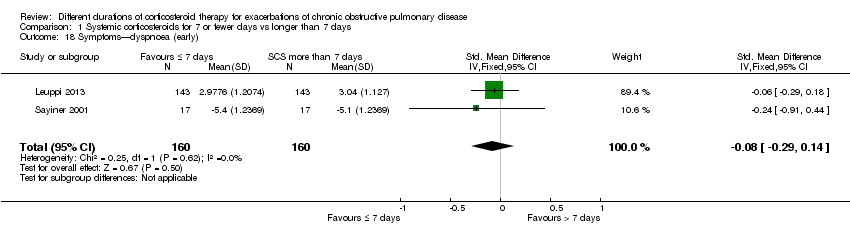 Comparison 1 Systemic corticosteroids for 7 or fewer days vs longer than 7 days, Outcome 18 Symptoms—dyspnoea (early). | ||||
| 19 Symptoms—dyspnoea (15 days) Show forest plot | 4 | 404 | Std. Mean Difference (IV, Fixed, 95% CI) | 0.16 [‐0.03, 0.36] |
| Analysis 1.19  Comparison 1 Systemic corticosteroids for 7 or fewer days vs longer than 7 days, Outcome 19 Symptoms—dyspnoea (15 days). | ||||
| 19.1 Change | 3 | 133 | Std. Mean Difference (IV, Fixed, 95% CI) | 0.25 [‐0.09, 0.60] |
| 19.2 Absolute | 1 | 271 | Std. Mean Difference (IV, Fixed, 95% CI) | 0.12 [‐0.12, 0.36] |
| 20 Quality of life—overall (6 days) Show forest plot | 1 | Mean Difference (IV, Fixed, 95% CI) | Subtotals only | |
| Analysis 1.20  Comparison 1 Systemic corticosteroids for 7 or fewer days vs longer than 7 days, Outcome 20 Quality of life—overall (6 days). | ||||
| 21 Quality of life—overall (30 days) Show forest plot | 1 | Mean Difference (IV, Fixed, 95% CI) | Subtotals only | |
| Analysis 1.21 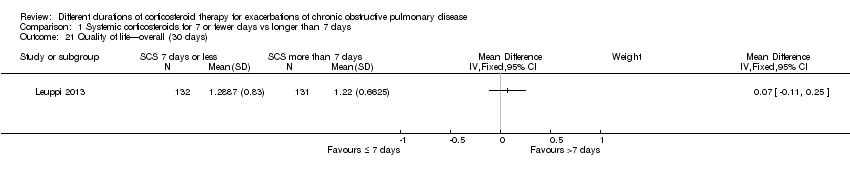 Comparison 1 Systemic corticosteroids for 7 or fewer days vs longer than 7 days, Outcome 21 Quality of life—overall (30 days). | ||||

1 Study flow diagram.

Risk of bias summary: review authors' judgements about each item for each included study.

Risk of bias graph: review authors' judgements about each risk of bias item presented as percentages across all included studies.

Forest plot outcome: treatment failure comparing systemic corticosteroids for ≤ 7 days vs > 7 days.
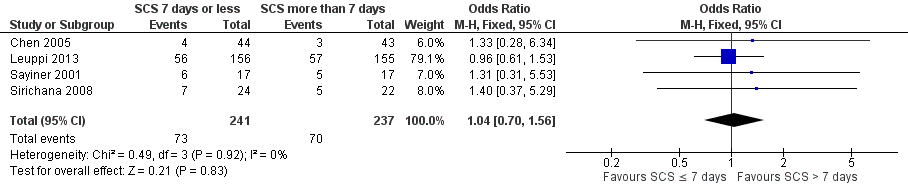
Forest plot of comparison: 1 Systemic corticosteroids for 7 or fewer days vs longer than seven days, outcome: 1.2 Relapse.

Comparison 1 Systemic corticosteroids for 7 or fewer days vs longer than 7 days, Outcome 1 Treatment failure.

Comparison 1 Systemic corticosteroids for 7 or fewer days vs longer than 7 days, Outcome 2 Relapse.
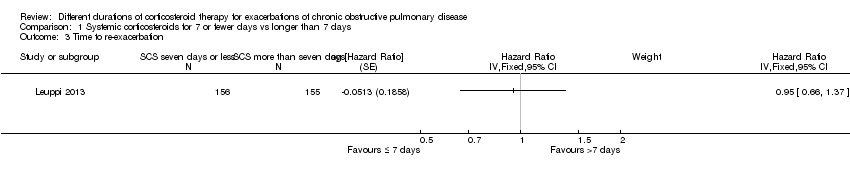
Comparison 1 Systemic corticosteroids for 7 or fewer days vs longer than 7 days, Outcome 3 Time to re‐exacerbation.

Comparison 1 Systemic corticosteroids for 7 or fewer days vs longer than 7 days, Outcome 4 Adverse effect—hyperglycaemia.
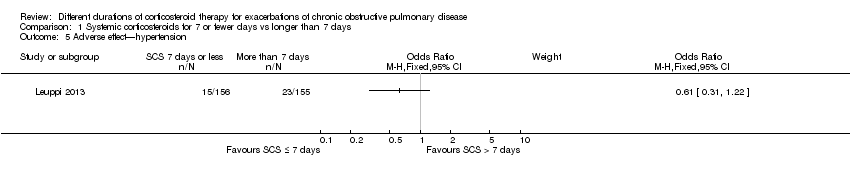
Comparison 1 Systemic corticosteroids for 7 or fewer days vs longer than 7 days, Outcome 5 Adverse effect—hypertension.

Comparison 1 Systemic corticosteroids for 7 or fewer days vs longer than 7 days, Outcome 6 Other adverse effects—gastrointestinal tract bleeding, symptomatic gastrointestinal reflux, symptoms of congestive heart failure or ischaemic heart disease, sleep disturbance, fractures, depression.

Comparison 1 Systemic corticosteroids for 7 or fewer days vs longer than 7 days, Outcome 7 Mortality.
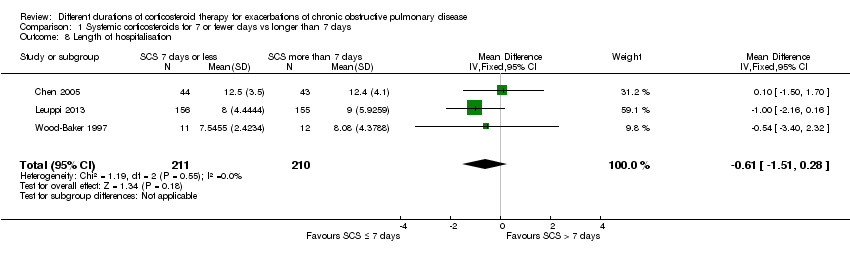
Comparison 1 Systemic corticosteroids for 7 or fewer days vs longer than 7 days, Outcome 8 Length of hospitalisation.

Comparison 1 Systemic corticosteroids for 7 or fewer days vs longer than 7 days, Outcome 9 FEV1 (L) (early).

Comparison 1 Systemic corticosteroids for 7 or fewer days vs longer than 7 days, Outcome 10 FEV1 % predicted (6 days).

Comparison 1 Systemic corticosteroids for 7 or fewer days vs longer than 7 days, Outcome 11 FVC (L) (early).

Comparison 1 Systemic corticosteroids for 7 or fewer days vs longer than 7 days, Outcome 12 FEV1 (L) end of treatment.

Comparison 1 Systemic corticosteroids for 7 or fewer days vs longer than 7 days, Outcome 13 FEV1 % predicted 30 days.

Comparison 1 Systemic corticosteroids for 7 or fewer days vs longer than 7 days, Outcome 14 FVC (L) end of treatment.

Comparison 1 Systemic corticosteroids for 7 or fewer days vs longer than 7 days, Outcome 15 PaO2 (mmHg) (early).

Comparison 1 Systemic corticosteroids for 7 or fewer days vs longer than 7 days, Outcome 16 PaO2 (mmHg) end of treatment.
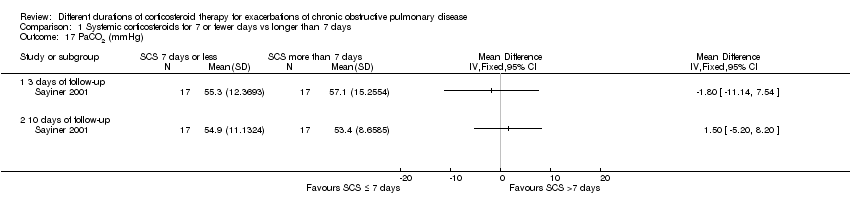
Comparison 1 Systemic corticosteroids for 7 or fewer days vs longer than 7 days, Outcome 17 PaCO2 (mmHg).

Comparison 1 Systemic corticosteroids for 7 or fewer days vs longer than 7 days, Outcome 18 Symptoms—dyspnoea (early).
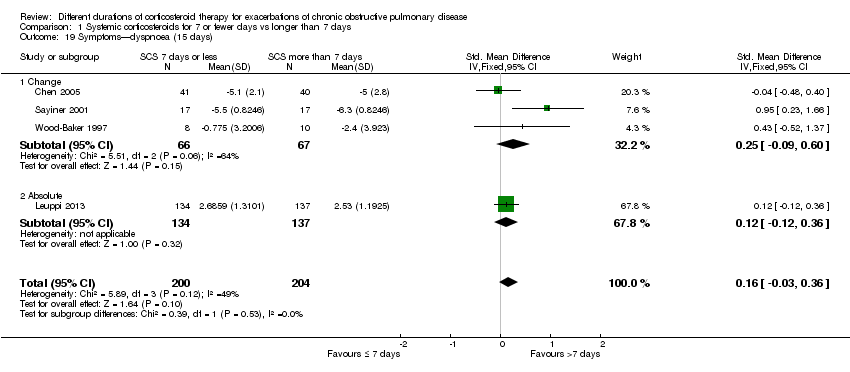
Comparison 1 Systemic corticosteroids for 7 or fewer days vs longer than 7 days, Outcome 19 Symptoms—dyspnoea (15 days).

Comparison 1 Systemic corticosteroids for 7 or fewer days vs longer than 7 days, Outcome 20 Quality of life—overall (6 days).

Comparison 1 Systemic corticosteroids for 7 or fewer days vs longer than 7 days, Outcome 21 Quality of life—overall (30 days).
| SCS treatment for 7 or fewer days compared with SCS treatment for longer than 7 days for acute exacerbations of COPD | ||||||
| Patient or population: patients with acute exacerbations of COPD | ||||||
| Outcomes | Illustrative comparative risks* (95% CI) | Relative effect | Number of participants | Quality of the evidence | Comments | |
| Assumed risk | Corresponding risk | |||||
| SCS treatment for longer than 7 days | SCS treatment for 7 or fewer days | |||||
| Treatment failure | 83 per 1000 | 61 per 1000 | OR 0.72 | 457 | ⊕⊕⊕⊝ | Equivalent to 22 fewer (95% CI 51 fewer to 34 more) |
| Relapse | 295 per 1000 | 304 per 1000 | OR 1.04 | 478 | ⊕⊕⊕⊝ | In one study (Leuppi 2013), hazard ratio for time to re‐exacerbation was 0.95 (95% CI 0.66 to 1.37) |
| Adverse drug effect—hyperglycaemia | 442 per 1000 | 439 per 1000 | OR 0.99 | 345 | ⊕⊕⊕⊝ | |
| Adverse drug effects | 84 per 1000 | 75 per 1000 | OR 0.88 | 503 | ⊕⊕⊝⊝ | |
| Mortality | 77 per 1000 | 71 per 1000 | OR 0.91 | 336 | ⊕⊕⊕⊝ | |
| Length of hospitalisation | Mean length of hospitalisation in control groups was | Mean length of hospitalisation in intervention groups was | 421 | ⊕⊕⊕⊝ | ||
| Lung function (end of treatment) | Mean FEV1 in control groups ranged from 0.84 to 1.14 L | Mean lung function (end of treatment) in intervention groups was | 187 | ⊕⊝⊝⊝ | ||
| Health‐related quality of life (QOL) Overall score (includes activity limitations, symptoms, fatigue, emotional functioning); scale 0 best to 6 worst; minimum important difference 0.5 Follow‐up: 30 days | Mean QOL score in control groups was 1.24 | Mean QOL score in intervention groups was 0.06 higher (‐0.16 lower to 0.28 higher) | 271 (1 study) | ⊕⊕⊕⊝ | ||
| *The basis for the assumed risk (e.g. median control group risk across studies) is provided in footnotes. The corresponding risk (and its 95% confidence interval) is based on the assumed risk in the comparison group and the relative effect of the intervention (and its 95% CI). | ||||||
| GRADE Working Group grades of evidence. | ||||||
| aWide confidence intervals include significant benefit or harm (‐1 for imprecision). | ||||||
| Study ID/Setting | Inclusion criteria | AE definition | N participants included/Completing | Mean age, years | % males/ % smokers | Prestudy SCS use, % | SCS ≤ 7 days | SCS > 7 days | Definition of treatment failure |
| Chen 2005 China/ inpatients | 2 years of continuous productive cough, FEV1/FVC post BD < 0.7, FEV1 < 80% predicted. No respiratory failure, diabetes or bronchial asthma | At least 2 of 3 symptoms: increased sputum or dyspnoea or purulent sputum | 86/81 | 71 | 75/44 | Not stated | Prednisolone 30 mg 7 days | Prednisolone 30 mg/d 10 days + 15 mg/d 5 days | Not known |
| Gomaa 2008 (abstract only) | FEV1 < 50% predicted, no respiratory acidosis | Not stated | 42/Not known | Not stated | Not stated | Not stated | Prednisolone 30 mg 7 days | Prednisolone 30 mg 15 days | Outcome not reported |
| Leuppi 2013 Switzerland/5 sites | Age > 40 years, smoking history ≥ 20 pack‐years | At least 2 of the following: change in baseline dyspnoea, cough or sputum quantity/purulence | 314/296 | 69 | 60/45 | 20 | 5 days: days 1 to 4 methylprednisolone 40 mg, days 2 to 5 oral prednisolone 40 mg | 14 days: days 1 to 4 methylprednisolone 40 mg, days 2 to 14 oral 40 mg prednisolone | Received open‐label glucocorticoids during index exacerbation |
| Rahman 2004 (abstract only) Bangladesh/1 site | Not stated | Not stated | Not stated | Not stated | Not stated | Not stated | Prednisolone 30 mg 7 days | Prednisolone 30 mg 14 days | Outcome not reported |
| Salam 1998 (abstract only) USA/Unknown sites | Not stated | Not stated | 21/Not known | Not stated | Not stated | None in previous month | IV CS 3 days | IV CS 3 days + 7 days OCS | Outcome not reported |
| Sayiner 2001 Turkey/1 site | FEV1 < 35% predicted, PYH > 20, no respiratory failure requiring ventilation | Not stated, requiring admission | 36/34 | 65 | 94/Not stated | None in previous month | IV methylprednisone 0.5 mg/kg qds 3 days | IV methylprednisone 0.5 mg/kg qds 3 days, bd 3 days, od 4 days | Required open‐label steroid treatment |
| Sirichana 2008 (abstract and author data) Thailand/1 site | Age > 40 years, symptoms > 24 hours | Increase in at least 2 of 3 symptoms—dyspnoea, sputum volume, sputum purulence; requiring admission | 48/42 | 73 | 88/Not stated | None in previous month | Prednisolone 30 mg 5 days | Prednisolone 30 mg 10 days | Outcome not reported |
| Wood‐Baker 1997 (abstract and author data) Australia & New Zealand/2 sites | Age > 40 years; > 10 pack‐year smoking history; FEV1 < 50% predicted | Not stated, requiring admission | 38/28 | 71 | 63/Not stated | None for current AEs, no long‐term OS > 5 mg/d | Prednisolone 2.5 mg/kg orally daily for 3 days | Prednisolone 0.6 mg/kg orally daily for 7 days followed by prednisolone 0.3 mg/kg orally daily for 7 days | Lack of progress according to attending physician during treatment |
| Excluding Sirichana (not blinded) | All studies | |
| Relapse | 1.01 (0.66 to 1.55) | 1.04 (0.70 to 1.56) |
| FEV1 early | ‐0.09 (‐0.22 to 0.05) | ‐0.07 (‐0.19 to 0.05) |
| FEV1 end | ‐0.06 (‐0.23 to 0.11) | ‐0.04 (‐0.19 to 0.10) |
| FVC early | ‐0.00 (‐0.25 to 0.25) | 0.01 (‐0.20 to 0.22) |
| FVC end | ‐0.14 (‐0.38 to 0.09) | ‐0.12 (‐0.33 to 0.09) |
| Adverse event—other | 0.94 (0.48 to 1.82) | 0.89 (0.46 to 1.69) |
| Excluding Sayiner (IV SCS) | All studies | |
| Treatment failure | 0.66 (0.32 to 1.37) | 0.72 (0.36 to 1.46) |
| Relapse | 1.02 (0.67 to 1.56) | 1.04 (0.70 to 1.56) |
| Adverse event—hyperglycaemia | 0.99 (0.63 to 1.54) | 0.99 (0.64 to 1.53) |
| Adverse event—other | 0.89 (0.46 to 1.69) | 0.89 (0.46 to 1.69) |
| FEV1 early | ‐0.02 (‐0.19 to 0.16) | ‐0.07 (‐0.19 to 0.05) |
| FEV1 end | 0.03 (‐0.06 to 0.12) | ‐0.04 (‐0.19 to 0.10) |
| FVC early | 0.12 (‐0.18 to 0.42) | 0.01 (‐0.20 to 0.22) |
| FVC end | ‐0.06 (‐0.34 to 0.22) | ‐0.12 (‐0.33 to 0.09) |
| Outcome or subgroup title | No. of studies | No. of participants | Statistical method | Effect size |
| 1 Treatment failure Show forest plot | 4 | 457 | Odds Ratio (M‐H, Fixed, 95% CI) | 0.72 [0.36, 1.46] |
| 2 Relapse Show forest plot | 4 | 478 | Odds Ratio (M‐H, Fixed, 95% CI) | 1.04 [0.70, 1.56] |
| 3 Time to re‐exacerbation Show forest plot | 1 | Hazard Ratio (Fixed, 95% CI) | Subtotals only | |
| 4 Adverse effect—hyperglycaemia Show forest plot | 2 | 345 | Odds Ratio (M‐H, Fixed, 95% CI) | 0.99 [0.64, 1.53] |
| 5 Adverse effect—hypertension Show forest plot | 1 | Odds Ratio (M‐H, Fixed, 95% CI) | Subtotals only | |
| 6 Other adverse effects—gastrointestinal tract bleeding, symptomatic gastrointestinal reflux, symptoms of congestive heart failure or ischaemic heart disease, sleep disturbance, fractures, depression Show forest plot | 5 | 503 | Odds Ratio (M‐H, Fixed, 95% CI) | 0.89 [0.46, 1.69] |
| 7 Mortality Show forest plot | 2 | 336 | Odds Ratio (M‐H, Fixed, 95% CI) | 0.91 [0.40, 2.06] |
| 8 Length of hospitalisation Show forest plot | 3 | 421 | Mean Difference (IV, Fixed, 95% CI) | ‐0.61 [‐1.51, 0.28] |
| 9 FEV1 (L) (early) Show forest plot | 3 | 96 | Mean Difference (IV, Fixed, 95% CI) | ‐0.07 [‐0.19, 0.05] |
| 9.1 FEV1 absolute | 2 | 75 | Mean Difference (IV, Fixed, 95% CI) | ‐0.08 [‐0.22, 0.06] |
| 9.2 FEV1 change | 1 | 21 | Mean Difference (IV, Fixed, 95% CI) | ‐0.04 [‐0.27, 0.19] |
| 10 FEV1 % predicted (6 days) Show forest plot | 1 | Mean Difference (IV, Fixed, 95% CI) | Subtotals only | |
| 11 FVC (L) (early) Show forest plot | 3 | 97 | Mean Difference (IV, Fixed, 95% CI) | 0.01 [‐0.20, 0.22] |
| 11.1 FVC measured | 2 | 75 | Mean Difference (IV, Fixed, 95% CI) | ‐0.05 [‐0.29, 0.19] |
| 11.2 FVC change from baseline | 1 | 22 | Mean Difference (IV, Fixed, 95% CI) | 0.23 [‐0.23, 0.69] |
| 12 FEV1 (L) end of treatment Show forest plot | 4 | 187 | Mean Difference (IV, Random, 95% CI) | ‐0.04 [‐0.19, 0.10] |
| 12.1 FEV1 measured | 3 | 164 | Mean Difference (IV, Random, 95% CI) | ‐0.05 [‐0.25, 0.16] |
| 12.2 FEV1 change from baseline | 1 | 23 | Mean Difference (IV, Random, 95% CI) | ‐0.04 [‐0.23, 0.14] |
| 13 FEV1 % predicted 30 days Show forest plot | 1 | Mean Difference (IV, Fixed, 95% CI) | Subtotals only | |
| 14 FVC (L) end of treatment Show forest plot | 3 | 99 | Mean Difference (IV, Fixed, 95% CI) | ‐0.12 [‐0.33, 0.09] |
| 14.1 FVC measured | 2 | 77 | Mean Difference (IV, Fixed, 95% CI) | ‐0.14 [‐0.39, 0.11] |
| 14.2 FVC change from baseline | 1 | 22 | Mean Difference (IV, Fixed, 95% CI) | ‐0.07 [‐0.44, 0.29] |
| 15 PaO2 (mmHg) (early) Show forest plot | 1 | Mean Difference (IV, Fixed, 95% CI) | Totals not selected | |
| 16 PaO2 (mmHg) end of treatment Show forest plot | 2 | 121 | Mean Difference (IV, Fixed, 95% CI) | ‐1.38 [‐4.96, 2.21] |
| 17 PaCO2 (mmHg) Show forest plot | 1 | Mean Difference (IV, Fixed, 95% CI) | Totals not selected | |
| 17.1 3 days of follow‐up | 1 | Mean Difference (IV, Fixed, 95% CI) | 0.0 [0.0, 0.0] | |
| 17.2 10 days of follow‐up | 1 | Mean Difference (IV, Fixed, 95% CI) | 0.0 [0.0, 0.0] | |
| 18 Symptoms—dyspnoea (early) Show forest plot | 2 | 320 | Std. Mean Difference (IV, Fixed, 95% CI) | ‐0.08 [‐0.29, 0.14] |
| 19 Symptoms—dyspnoea (15 days) Show forest plot | 4 | 404 | Std. Mean Difference (IV, Fixed, 95% CI) | 0.16 [‐0.03, 0.36] |
| 19.1 Change | 3 | 133 | Std. Mean Difference (IV, Fixed, 95% CI) | 0.25 [‐0.09, 0.60] |
| 19.2 Absolute | 1 | 271 | Std. Mean Difference (IV, Fixed, 95% CI) | 0.12 [‐0.12, 0.36] |
| 20 Quality of life—overall (6 days) Show forest plot | 1 | Mean Difference (IV, Fixed, 95% CI) | Subtotals only | |
| 21 Quality of life—overall (30 days) Show forest plot | 1 | Mean Difference (IV, Fixed, 95% CI) | Subtotals only | |