| 1 Leaving the study early Show forest plot | 2 | | Risk Ratio (M‐H, Fixed, 95% CI) | Subtotals only |
|
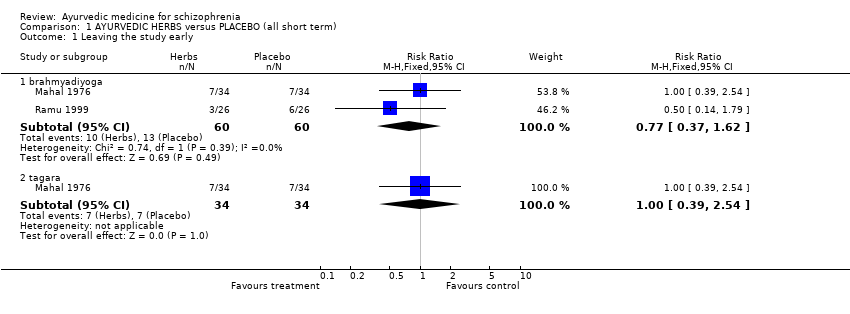
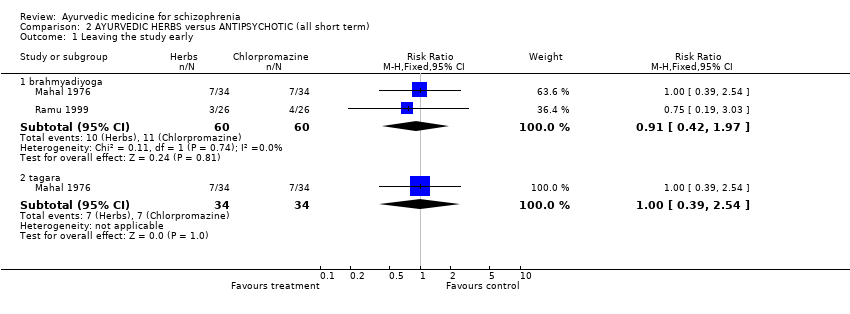
| 1.1 brahmyadiyoga | 2 | 120 | Risk Ratio (M‐H, Fixed, 95% CI) | 0.91 [0.42, 1.97] |
| 1.2 tagara | 1 | 68 | Risk Ratio (M‐H, Fixed, 95% CI) | 1.0 [0.39, 2.54] |
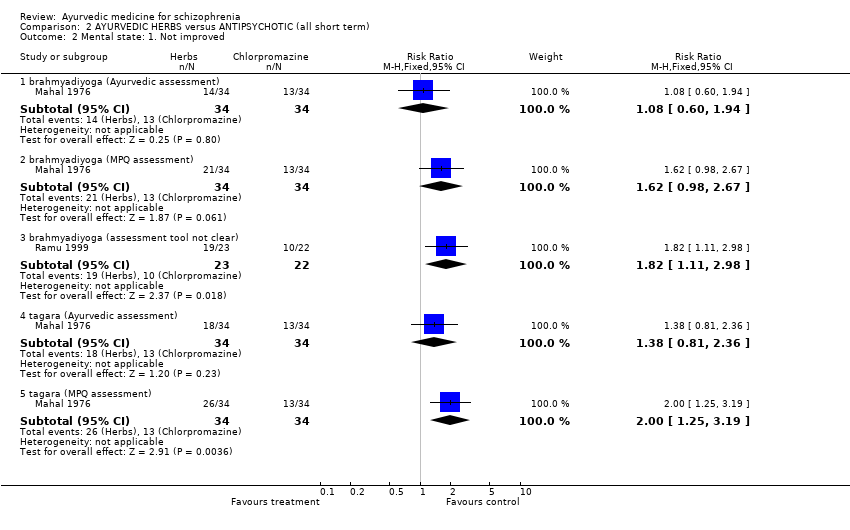
| 2 Mental state: 1. Not improved Show forest plot | 2 | | Risk Ratio (M‐H, Fixed, 95% CI) | Subtotals only |
|
| 2.1 brahmyadiyoga (Ayurvedic assessment) | 1 | 68 | Risk Ratio (M‐H, Fixed, 95% CI) | 1.08 [0.60, 1.94] |
| 2.2 brahmyadiyoga (MPQ assessment) | 1 | 68 | Risk Ratio (M‐H, Fixed, 95% CI) | 1.62 [0.98, 2.67] |
| 2.3 brahmyadiyoga (assessment tool not clear) | 1 | 45 | Risk Ratio (M‐H, Fixed, 95% CI) | 1.82 [1.11, 2.98] |
| 2.4 tagara (Ayurvedic assessment) | 1 | 68 | Risk Ratio (M‐H, Fixed, 95% CI) | 1.38 [0.81, 2.36] |
| 2.5 tagara (MPQ assessment) | 1 | 68 | Risk Ratio (M‐H, Fixed, 95% CI) | 2.0 [1.25, 3.19] |
| 3 Mental state: 2. Unco‐operative or did not comprehend Show forest plot | 1 | | Risk Ratio (M‐H, Fixed, 95% CI) | Subtotals only |
|
| 3.1 brahmyadiyoga | 1 | 68 | Risk Ratio (M‐H, Fixed, 95% CI) | 1.0 [0.27, 3.68] |
| 3.2 tagara | 1 | 68 | Risk Ratio (M‐H, Fixed, 95% CI) | 0.75 [0.18, 3.10] |
| 4 Mental state: 3a.i. Average improvement ‐ positive symptoms (PSRS, zero =good, skewed data) Show forest plot | | | Other data | No numeric data |
|
| 4.1 brahmyadiyoga | | | Other data | No numeric data |
| 4.2 tagara | | | Other data | No numeric data |
| 5 Mental state: 3a.ii. Average endpoint score ‐ postive symptoms (PSRS, zero = good, skewed data) Show forest plot | | | Other data | No numeric data |
|
| 6 Mental state: 3b.i. Average improvement ‐ negative symptoms (PSRS, zero =good, skewed data) Show forest plot | | | Other data | No numeric data |
|
| 6.1 brahmyadiyoga | | | Other data | No numeric data |
| 6.2 tagara | | | Other data | No numeric data |
| 7 Mental state: 3b.ii. Average endpoint score ‐ negative symptoms (PSRS, zero =good, skewed data) Show forest plot | | | Other data | No numeric data |
|
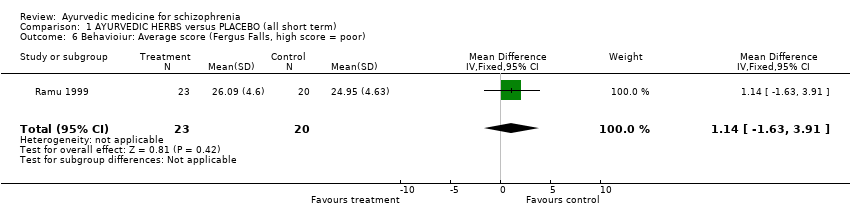
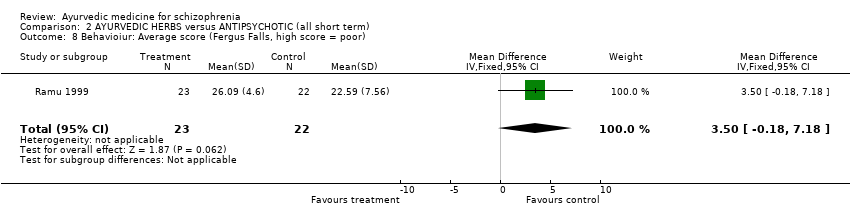
| 8 Behavioiur: Average score (Fergus Falls, high score = poor) Show forest plot | 1 | 45 | Mean Difference (IV, Fixed, 95% CI) | 3.5 [‐0.18, 7.18] |
|
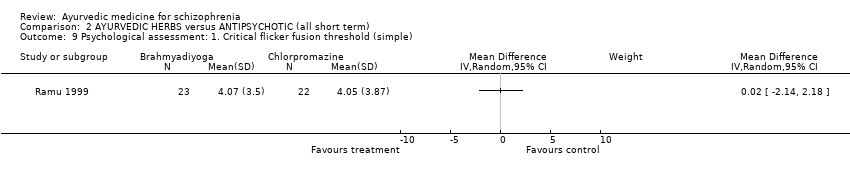
| 9 Psychological assessment: 1. Critical flicker fusion threshold (simple) Show forest plot | 1 | | Mean Difference (IV, Random, 95% CI) | Subtotals only |
|
| 10 Psychological assessment: 2. Reaction and vigilance (skewed data) Show forest plot | | | Other data | No numeric data |
|
| 10.1 reaction time (simple) | | | Other data | No numeric data |
| 10.2 vigilance | | | Other data | No numeric data |
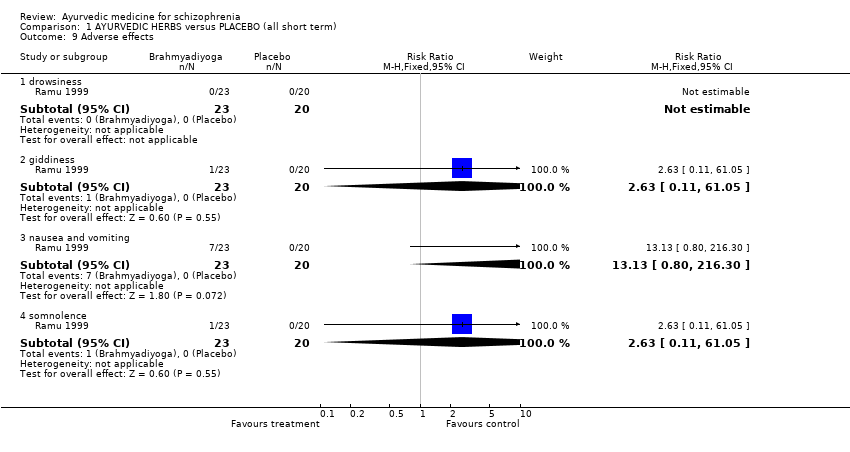
| 11 Adverse effects Show forest plot | 2 | 180 | Risk Ratio (M‐H, Fixed, 95% CI) | 1.20 [0.48, 2.97] |
|
| 11.1 drowsiness | 1 | 45 | Risk Ratio (M‐H, Fixed, 95% CI) | 0.11 [0.01, 1.87] |
| 11.2 giddiness | 1 | 45 | Risk Ratio (M‐H, Fixed, 95% CI) | 0.48 [0.05, 4.91] |
| 11.3 somnolence | 1 | 45 | Risk Ratio (M‐H, Fixed, 95% CI) | 0.96 [0.06, 14.37] |
| 11.4 nausea and vomiting | 1 | 45 | Risk Ratio (M‐H, Fixed, 95% CI) | 14.38 [0.87, 237.58] |