Gefitinib para el cáncer de pulmón de células no pequeñas avanzado
Referencias
Referencias de los estudios incluidos en esta revisión
Referencias de los estudios excluidos de esta revisión
Referencias de los estudios en curso
Referencias adicionales
Referencias de otras versiones publicadas de esta revisión
Characteristics of studies
Characteristics of included studies [ordered by study ID]
| Methods | Design: parallel‐group Randomisation: yes, method stated Blinding: open‐label Withdrawals: stated | |
| Participants | Setting: multicentre study, hospital outpatient department Number eligible: 86 Number enrolled: 73 Number in treatment group: 39 Number in control group: 31 Number of withdrawals (treatment/control): TP1 14/31; TPII 25/24 Number completing trial (treatment/control): 0/0 Age range: (treatment/control) 35 to 73 years/29 to 76 years Sex: 15 M, 55 F Ethnicity: East Asian NSCLC diagnosis: histologic/cytologic diagnosis of NSCLC, stage IIIB to IV disease Inclusion criteria: stage IIIB to IV NSCLC with at least one measurable lesion, ECOG PS 0 or 1, EGFR mutation status unknown Exclusion criteria: received treatment for NSCLC other than palliative radiotherapy, smoker of more than 100 cigarettes in lifetime, life expectancy of < 12 weeks Baseline characteristics of treatment/control groups: comparable | |
| Interventions | TP1 All patients received first‐line chemotherapy: Intravenously on day 1 of 3‐week cycle for 4 cycles TPII Received either: Pemetrexed 500 mg/m2 with optional cisplatin 75 mg/m2 in first 2 cycles intravenously | |
| Outcomes | Progression‐free survival Overall survival Tumour response – RECIST Duration of response ASEs – NCI‐CTC Haematology and biochemical parameters | |
| Notes | — | |
| Risk of bias | ||
| Bias | Authors' judgement | Support for judgement |
| Random sequence generation (selection bias) | Low risk | Quote: "Stratified random assignment method, random allocation sequence generated by central computerised voice response unit" Comment: this was judged as a low risk of bias |
| Allocation concealment (selection bias) | Low risk | Quote: "random allocation sequence generated by central computerised voice response unit" Comment: this was judged as adequate |
| Blinding (performance bias and detection bias) | Low risk | No blinding but review authors judge that outcome is not likely to be influenced by lack of blinding Comment: this was judged as a low risk of bias |
| Incomplete outcome data (attrition bias) | Low risk | Exclusions and reasons for withdrawals presented in Figure 1. Missing outcome data balanced in numbers across interventional groups with similar reasons for missing data across groups. Data analysed using intention‐to‐treat analysis Comment: this was judged as a low risk of bias |
| Selective reporting (reporting bias) | Low risk | All prespecified outcomes were reported Comment: this was judged as a low risk of bias |
| Other bias | Unclear risk | Funded by Eli Lilly and Company. Authors have received honoraria from Eli Lilly and some authors are current employees or previous employees of Eli Lilly. Comment: this was judged as an unclear risk of bias |
| Methods | Design: parallel‐group Randomisation: yes, method not stated Blinding: double‐blind Withdrawals: not stated | |
| Participants | Setting: single‐centre study, hospital outpatient department Number eligible: 90 Number enrolled: 90 Number in treatment group: 45 Number in control group: 45 Number of withdrawals (treatment/control): not stated Number completing trial (treatment/control): not stated Age range: 57 to 83 years Sex: 50 M, 40 F Ethnicity: East Asian NSCLC diagnosis: histologic/cytologic diagnosis of non‐squamous NSCLC, stage IIIB to IV disease. Presence of EGFR sensitive mutation Inclusion criteria: at least one measurable lesion, an estimated life expectancy of at least 12 weeks, adequate major organ function Exclusion criteria: any of the following: myocardial infarction within the previous 3 months, uncontrolled angina pectoris or arrhythmia, brain metastasis, uncontrolled hypertension or diabetes, active infection, pulmonary fibrosis, pleural effusion or ascites requiring drainage, or cerebrovascular disease Baseline characteristics of treatment/control groups: comparable | |
| Interventions | Pemetrexed 500 mg/m2 on day 1 PLUS gefitinib 250 mg on day 2 to 16 Cycles repeated every 3 weeks until disease progression Gefitinib 250 mg on day 2 to 16 PLUS placebo on day 1 Cycles repeated every 3 weeks until disease progression | |
| Outcomes | Tumour response – RECIST ASEs – NCI‐CTC Progression‐free survival Overall survival | |
| Notes | — | |
| Risk of bias | ||
| Bias | Authors' judgement | Support for judgement |
| Random sequence generation (selection bias) | Unclear risk | Quote: "patients were randomly divided.." but no further information provided Comment: there was insufficient information to permit a clear judgement of risk of bias |
| Allocation concealment (selection bias) | Unclear risk | No information provided Comment: there was insufficient information to permit a clear judgement of risk of bias |
| Blinding (performance bias and detection bias) | Low risk | Quote: "All investigators and patients were masked to treatment allocation" |
| Incomplete outcome data (attrition bias) | Unclear risk | No information provided Comment: there was insufficient information to permit a clear judgement of risk of bias |
| Selective reporting (reporting bias) | Low risk | All prespecified outcomes were reported Comment: this was judged as a low risk of bias |
| Other bias | Unclear risk | There were no declarations of potential conflicts of interest or indication of funding or support Comment: there was insufficient information to permit a clear judgement of the risk of bias |
| Methods | Design: parallel‐group | |
| Participants | Setting: single‐centre study, hospital outpatient department Number eligible: 48 Inclusion criteria: failed previous chemotherapy with ?2 regimens (including taxanes and platinum‐based chemotherapy); clinically measurable disease; no previous radiotherapy directed at lesions; adequate bone marrow reserve with WBC count < 4000/mm3; platelets < 100,000/mm3; haemoglobin < 10 g/dL; life expectancy of > 2 months | |
| Interventions | 250 mg gefitinib daily | |
| Outcomes | Overall survival | |
| Notes | — | |
| Risk of bias | ||
| Bias | Authors' judgement | Support for judgement |
| Random sequence generation (selection bias) | Unclear risk | Quote: "Eligible patients were randomized..." but no further information provided Comment: there was insufficient information to permit a clear judgement of risk of bias |
| Allocation concealment (selection bias) | Unclear risk | No information provided Comment: there was insufficient information to permit a clear judgement of risk of bias |
| Blinding (performance bias and detection bias) | Low risk | No blinding but review authors judge that outcome is not likely to be influenced by lack of blinding Comment: this was judged as a low risk of bias |
| Incomplete outcome data (attrition bias) | High risk | No information provided Comment: this was judged as a high risk of bias |
| Selective reporting (reporting bias) | Low risk | All prespecified outcomes were reported Comment: this was judged as a low risk of bias |
| Other bias | Unclear risk | There were no declarations of potential conflicts of interest or indication of funding or support Comment: there was insufficient information to permit a clear judgement of the risk of bias |
| Methods | Design: parallel‐group Randomisation: yes, method not stated Blinding: open‐label Withdrawals: stated Jadad score: 2 | |
| Participants | Setting: single‐centre study, hospital outpatient department Number eligible: 115 Number enrolled: 115 Number in treatment group: 58 Number in control group: 57 Number of withdrawals (treatment/control): 0/0 Number completing trial (treatment/control): 58/57 Age range (treatment/control): 37 to 87 years/30 to 85 years Sex: 69 M, 45 F Ethnicity: Taiwanese NSCLC diagnosis: histological and cytological diagnosis of adenocarcinoma of the lung Inclusion criteria: stage IIIB or IV adenocarcinoma of the lung, age 18 years or older, failed previous chemotherapy, WHO PS of 0 to 3, clinically measurable disease, no previous radiotherapy directed at the measurable lesion(s), adequate bone marrow reserve with a white blood count > 4000/mm3 Exclusion criteria: previous treatment with 5FU‐related chemotherapeutic agent, interstitial lung disease, with inadequate liver function (total bilirubin > 1.5 times and alanine aminotransferase/aspartate transaminase > 3 times the upper limit normal) or inadequate renal function with creatinine > 2.0 mg/dl Baseline characteristics of treatment/control groups: comparable | |
| Interventions | Gefitinib 250 mg/day Gefitinib (250 mg/day) + UFT (tegafur 100 mg + uracil 224 mg) | |
| Outcomes | Progression‐free survival Overall survival Tumour response – RECIST ASEs – NCI‐CTC Haematology and biochemical parameters Quality of life (LCS) | |
| Notes | — | |
| Risk of bias | ||
| Bias | Authors' judgement | Support for judgement |
| Random sequence generation (selection bias) | Unclear risk | Randomised but no details provided Comment: there was insufficient detail reported about the method used to generate the allocation sequence to allow a clear assessment of whether it would produce comparable groups |
| Allocation concealment (selection bias) | Unclear risk | No information provided Comment: there was insufficient information to permit a clear judgement |
| Blinding (performance bias and detection bias) | Low risk | No blinding but review authors judge that outcome is not likely to be influenced by lack of blinding Comment: this was judged as low risk of bias |
| Incomplete outcome data (attrition bias) | High risk | No information provided Comment: this was judged as a high risk of bias |
| Selective reporting (reporting bias) | Low risk | All prespecified outcomes were reported Comment: this was judged as a low risk of bias |
| Other bias | Low risk | Grants from National Science Council of the Republic of China and Taipei Veterans General Hospital |
| Methods | Design: parallel‐group Randomisation: yes, method stated Blinding: open‐label Withdrawals: not stated | |
| Participants | Setting: multicentre study, hospital outpatient department Number eligible: 232 Number enrolled: 195 Number in treatment group: 129 Number in control group: 66 Number of withdrawals (treatment/control): 106/59 Number completing trial (treatment/control): 23/7 Age range: (treatment/control) 33 to 84 years/41 to 80 years Sex: 68 M, 123 F Ethnicity: East Asian NSCLC diagnosis: histologic/cytologic diagnosis of non‐squamous NSCLC, stage IV or recurrent disease. Presence of activating EGFR mutation Inclusion criteria: age ≥ 18 years, ECOG 0 or 1, measurable disease documented by CT or MRI as defined by RECIST criteria Exclusion criteria: prior systemic chemotherapy, immunotherapy or biologic therapy, including targeted therapy (e.g. EGFR‐TKI) for stage IV or recurrent NSCLC. Receipt of adjuvant or neoadjuvant treatment with pemetrexed or an EGFR‐TKI, thoracic radiation therapy within 28 days before enrolment or could not take folic acid, vitamin B12 and dexamethasone Baseline characteristics of treatment/control groups: comparable | |
| Interventions | Pemetrexed 500 mg/m2 on day 1 PLUS gefitinib 250 mg daily Cycles repeated every 3 weeks Gefitinib 250 mg daily | |
| Outcomes | Progression‐free survival Overall survival Time to progressive disease (TtPD) Tumour response – RECIST Duration of response ASEs – NCI‐CTC Quality of life Biomarker analysis | |
| Notes | — | |
| Risk of bias | ||
| Bias | Authors' judgement | Support for judgement |
| Random sequence generation (selection bias) | Low risk | Quote "random assignment was conducted using a computer‐generated random sequence and an interactive voice‐response system." Comment: this was judged as a low risk of bias |
| Allocation concealment (selection bias) | Unclear risk | No information provided Comment: there was insufficient information to permit a clear judgement of risk of bias |
| Blinding (performance bias and detection bias) | Low risk | No blinding but review authors judge that outcome is not likely to be influenced by lack of blinding Comment: this was judged as a low risk of bias |
| Incomplete outcome data (attrition bias) | Low risk | Exclusions and reasons for withdrawals presented in Figure 1. Missing outcomes balanced in numbers across intervention groups with similar reasons for missing data across groups. Data analysed using intention‐to‐treat analysis Comment: this was judged as low risk of bias |
| Selective reporting (reporting bias) | Low risk | All prespecified outcomes were reported, except for overall survival Quote: "At time of PFS analysis, OS data were immature, and therefore, are not presented" Comment: this was judged as a low risk of bias |
| Other bias | Unclear risk | Authors report consultative roles within industry, and other potential financial conflicts of interest Comment: this was judged as an unclear risk of bias |
| Methods | Design: parallel‐group Randomisation: yes, method not stated Blinding: open‐label Withdrawals: stated | |
| Participants | Setting: multicentre study, hospital outpatient department Number eligible: 205 Number enrolled: 196 Number in treatment group: 97 Number in control group: 99 Number of withdrawals (treatment/control): 20/38 Number completing trial (treatment/control): 77/61 Age range: treatment 70 to 89, control 70 to 86 Sex: M 148, F 48 Ethnicity: white 162, Asian 31, other 3 NSCLC diagnosis: histologically confirmed stage IIIB or stage IV NSCLC Inclusion criteria: age > 70 years, at least 1 measurable lesion according to RECIST criteria, histological biopsy and paraffin block from the original tumour or metastatic site, no prior chemotherapy, biologic or immunologic therapy, WHO performance status of 0 to 2, life expectancy of at least 12 weeks Exclusion criteria: newly diagnosed central nervous system metastases that had not yet been treated, any evidence of clinically active interstitial lung disease, other coexisting malignancies or malignancies discovered within the last 5 years other than basal cell carcinoma or cervical cancer in situ, prior treatment with EGFR inhibitors, treatment with an investigational drug within 30 days Baseline characteristics of treatment/control groups: comparable | |
| Interventions | Gefitinib 250 mg/day Vinorelbine 30 mg/m2 infusion on days 1 and 8 of a 21‐day cycle | |
| Outcomes | Overall survival Progression‐free survival (PFS) Tumour response ‐ RECIST ASEs ‐ NCI‐CTC Quality of life ‐ LCS/FACT‐L | |
| Notes | — | |
| Risk of bias | ||
| Bias | Authors' judgement | Support for judgement |
| Random sequence generation (selection bias) | Low risk | Quote: "randomly assigned in 1:1 manner" Comment: this was judged as a low risk of bias |
| Allocation concealment (selection bias) | Unclear risk | No information provided Comment: there was insufficient information to permit a clear judgement of risk of bias |
| Blinding (performance bias and detection bias) | Low risk | No blinding but review authors judge that outcome is not likely to be influenced by lack of blinding Comment: this was judged as a low risk of bias |
| Incomplete outcome data (attrition bias) | Low risk | Exclusions and reasons for withdrawals presented in Figure 1. Missing outcomes balanced in numbers across intervention groups with similar reasons for missing data across groups. Data analysed using intention‐to‐treat analysis Comment: this was judged as a low risk of bias |
| Selective reporting (reporting bias) | Low risk | All prespecified outcomes were reported Comment: this was judged as a low risk of bias |
| Other bias | Unclear risk | Authors report consultative roles within industry and other potential financial conflicts of interest Comment: this was judged as an unclear risk of bias |
| Methods | Design: parallel‐group Randomisation: yes, method stated Blinding: open‐label Withdrawals: stated | |
| Participants | Setting: multicentre study, hospital outpatient department Number eligible: 141 Number enrolled: 141 Number in treatment 1 group: 68 Number in treatment 2 group: 73 Number of withdrawals (treatment 1/treatment 2): 0/0 Number completing trial (treatment 1/treatment 2): 68/73 Age range: treatment 1 34 to 85 years; treatment 2 29 to 83 years Sex: 98 M, 43 F Ethnicity: 42.6% Caucasian; 44.0% Hispanic; 5.0% Oriental; 1.5% Black; 7.1% other NSCLC diagnosis: histologically or cytologically confirmed advanced (stage IIIb or IV) NSCLC that had progressed on or after 1 previous chemotherapy regimen. Also 1 or more measurable lesion according to RECIST Inclusion criteria: WHO PS 0 to 2; life expectancy > 12 weeks, age > 18 years, symptomatic (LCS score < 24), capable of understanding the FACT‐L questionnaire Exclusion criteria: previous taxane treatment, treatment with any chemotherapeutic within 30 days prior to study, radiotherapy within 3 weeks prior to study, known cerebral metastasis, any evidence of ongoing interstitial lung disease (ILD), coexisting malignancies, malignancies diagnosed within the last 5 years, with exception of basal cell carcinoma or cervical carcinoma in situ, any unresolved chronic toxicity above grade 2 NCI‐CTC from previous anti‐cancer therapy, laboratory values outside requested limits, psychiatric disorders that may affect completion of FACT‐L questionnaire Baseline characteristics of treatment/control groups: comparable | |
| Interventions | Treatment 1: gefitinib 250 mg/day Treatment 2: docetaxel 75 mg/m2 IV every 3 weeks | |
| Outcomes | LCS component of FACT‐L Tumour response ‐ RECIST Overall survival, progression‐free survival ASEs ‐ NCI‐CTC | |
| Notes | — | |
| Risk of bias | ||
| Bias | Authors' judgement | Support for judgement |
| Random sequence generation (selection bias) | Low risk | Quote: "sealed randomisation envelopes which were allocated sequentially to patients" Comment: this was judged as low risk of bias |
| Allocation concealment (selection bias) | Low risk | Quote: "sealed randomisation envelopes which were allocated sequentially to patients" Comment: this was judged as low risk of bias |
| Blinding (performance bias and detection bias) | Low risk | No blinding but review authors judge that outcome is not likely to be influenced by lack of blinding. Comment: this was judged as low risk of bias |
| Incomplete outcome data (attrition bias) | Low risk | Missing outcomes balanced in numbers across intervention groups with similar reasons for missing data across groups. 139/141 completed the trial. Comment: this was judged as low risk of bias |
| Selective reporting (reporting bias) | Unclear risk | All prespecified outcomes were reported. Progression‐free survival was not a prespecified outcome but included in results. Quote: "Progression‐free survival was not defined as a study variable in the protocol, but as tumour assessments were performed consistently for both treatment arms, it was also estimated." Comment: this was judged as an unclear risk of bias |
| Other bias | Unclear risk | There were no declarations of potential conflicts of interest or indication of funding or support Comment: there was insufficient information to permit a clear judgement of the risk of bias |
| Methods | Design: parallel‐group Randomisation: yes, method not stated Blinding: open‐label Withdrawals: stated | |
| Participants | Setting: single‐centre study, hospital outpatient department Number eligible: 46 Number enrolled: 46 Number in treatment group: 23 Number in control group: 23 Number of withdrawals (treatment/control): 0/0 Number completing trial (treatment/control): 23/23 Age range: (treatment/control): 41 to 74years/47 to 72 years Sex: 29 M, 17 F Ethnicity: East Asian NSCLC diagnosis: histologic or pathologically proven diagnosis of nonsquamous NSCLC, stage IIIB to IV disease Inclusion criteria: age 18 to 75 years, Received prior platinum‐based chemotherapy of 4 to 6 cycles and has had progressive disease,at least 1 target lesion, ECOG 0 to 2, adequate bone marrow and organ function Exclusion criteria: not stated Baseline characteristics of treatment/control groups: comparable | |
| Interventions | Gefitinib 250 mg/day Pemetrexed 500 mg/m2 intravenously, every 4 weeks until disease progression or unacceptable toxicity | |
| Outcomes | Tumour response – RECIST Progression‐free survival Overall survival Toxicity – CTCAE Quality of life – FACT‐L | |
| Notes | — | |
| Risk of bias | ||
| Bias | Authors' judgement | Support for judgement |
| Random sequence generation (selection bias) | Unclear risk | Quote: "randomized" but random sequence generation not discussed Comment: there was insufficient information to permit a clear judgement of risk of bias |
| Allocation concealment (selection bias) | Unclear risk | No information provided Comment: there was insufficient information to permit a clear judgement of risk of bias |
| Blinding (performance bias and detection bias) | Low risk | No blinding but review authors judge that outcome is not likely to be influenced by lack of blinding Comment: this was judged as low risk of bias |
| Incomplete outcome data (attrition bias) | Low risk | No missing data Comment: this was judged as low risk of bias |
| Selective reporting (reporting bias) | Low risk | All prespecified outcomes were reported Comment: this was judged as low risk of bias |
| Other bias | Unclear risk | No information provided Comment: there was insufficient information to permit a clear judgement of risk of bias |
| Methods | Design: parallel‐group Randomisation: yes, method not stated | |
| Participants | Setting: multicentre study, hospital outpatient department Number eligible: 210 NSCLC diagnosis: histologic or cytologic confirmation of advanced or metastatic NSCLC; stage III or IV not curable with surgery or radiotherapy at study entry Exclusion criteria: more than 2 previous chemotherapy regimens, systemic anticancer therapy within 21 days, radiotherapy within 14 days before start of treatment; unresolved chronic toxicity higher than in NCI‐CTC grade 2; ALT or AST levels greater than 2.5 times upper limit of reference range; serum creatinine levels greater than 1.5 times the upper limit of reference range; neutrophils less than 1.5 x 10⁹/L or platelets less than 75 x 109/L Baseline characteristics of treatment/control groups: comparable except for sex. Some demographic imbalances between Japanese and non‐Japanese populations. | |
| Interventions | Treatment 1: gefitinib 250 mg/day | |
| Outcomes | Objective tumour response rate ‐ RECIST | |
| Notes | — | |
| Risk of bias | ||
| Bias | Authors' judgement | Support for judgement |
| Random sequence generation (selection bias) | Unclear risk | Quote: "randomized" but no further information provided Comment: there was insufficient information to permit a clear judgement of risk of bias |
| Allocation concealment (selection bias) | Unclear risk | No information provided Comment: there was insufficient information to permit a clear judgement of risk of bias |
| Blinding (performance bias and detection bias) | Low risk | Quote: "double‐blind", "blinded treatment supplies" Comment: this was judged as a low risk of bias |
| Incomplete outcome data (attrition bias) | Low risk | Quote: "1 patient excluded due to protocol violation", otherwise no missing data Comment: this was judged as a low risk of bias |
| Selective reporting (reporting bias) | Low risk | All prespecified outcomes were reported Comment: this was judged as a low risk of bias |
| Other bias | Unclear risk | Co‐authors are recipients of research grants and honoraria from Astra Zeneca Comment: this was judged as an unclear risk of bias |
| Methods | Design: parallel‐group Randomisation: yes, method stated Blinding: double‐blind, double‐dummy Withdrawals: stated | |
| Participants | Setting: multicentre study, hospital outpatient department Number eligible: 173 Number enrolled: 173 Number in treatment group: 86 Number in control group: 87 Number of withdrawals (treatment/control): 15/9 Number completing trial (treatment/control): 71/78 Age range: 28 to 80 years Sex: M 133, F 40 Ethnicity: not stated NSCLC diagnosis: histologically or cytologically confirmed stage IIIB or IV NSCLC (UICC 6th ed) Inclusion criteria: not amenable to local therapy, non‐progressing after prior platinum‐based chemotherapy (2 to 6 cycles) and without unacceptable toxicity. Age older than 18 years, WHO PS 2 or less, adequate renal, hepatic and haematological function. Patients with brain metastasis were eligible, provided asymptomatic after cranial irradiation. Exclusion criteria: previous EGFR therapy, symptomatic brain metastasis, other malignancies, pregnancy or breastfeeding and interstitial pulmonary disease. Baseline characteristics of treatment/control groups: comparable | |
| Interventions | Treatment: gefitinib 250 mg daily Control: placebo | |
| Outcomes | Overall survival Time to progression Tumour response – RECIST ASEs – NCI‐CTC Haematology and biochemical parameters | |
| Notes | — | |
| Risk of bias | ||
| Bias | Authors' judgement | Support for judgement |
| Random sequence generation (selection bias) | Low risk | Quote: "centralised double blind random assignment using minimisation technique" Comment: this was judged as a low risk of bias |
| Allocation concealment (selection bias) | Low risk | Quote: "centralised double blind random assignment using minimisation technique" Comment: this was judged as a low risk of bias |
| Blinding (performance bias and detection bias) | Low risk | Double‐blind. Quote: "matched daily placebo tablet" Comment: this was judged as a low risk of bias |
| Incomplete outcome data (attrition bias) | Low risk | Exclusions and reasons for withdrawals presented in Figure 1. Missing outcomes balanced in numbers across intervention groups with similar reasons for missing data across groups (24/173 lost to follow‐up/censored). Intention‐to‐treat analysis Comment: this was judged as a low risk of bias |
| Selective reporting (reporting bias) | Low risk | All prespecified outcomes were reported Comment: this was judged as a low risk of bias |
| Other bias | Low risk | Funding from EORTC, ILCP, National Cancer Institute, Fonda Cancer (FOCA) Belgium Comment: this was judged as a low risk of bias |
| Methods | Design: parallel‐group | |
| Participants | Setting: multicentre study, hospital outpatient department Number eligible: 1093 NSCLC diagnosis: histologically or cytologically confirmed NSCLC Inclusion criteria: NSCLC locally advanced stage II disease not curable with surgery or radiotherapy or stage IV disease; aged < 18 years; WHO PS 0 to 2 Exclusion criteria: previously received chemotherapy (prior radiotherapy or surgery allowed); hypersensitive to mannitol, corticosteroids, H2‐antagonists, antihistamines or agents formulated with polyoxyethylated castor oil; had received radiotherapy within the last 2 weeks; had unresolved toxicity from previous radiation therapy or incomplete healing from previous surgery; had pre‐existing motor or sensory neurotoxicity (NCI‐CTC < grade 2); showed evidence of severe or uncontrolled systemic disease; had recent conditions requiring medication or uncontrolled significant active infections; had absolute neutrophils count < 2000/mm3; WBC < 4000/mm3; platelets < 100000/mm3; serum bilirubin greater than 1.25 times normal upper limit; ALT or AST greater than 2.5 times normal upper limit; creatinine clearance < 60 mL/min; were pregnant or breastfeeding; other coexisting malignancies or malignancies diagnosed within the last 5 years with the exception of basal cell carcinoma or cervical cancer in situ; had mixed NSCLC plus small cell lung cancer Baseline characteristics of treatment/control groups: comparable | |
| Interventions | Regime A: 3‐week cycle of IV gemcitabine 1250 mg/m2 for 30 min of day 1 and day 8; IV Cisplatin 80 mg/m2 after gemcitabine administration on day 1 only Treatment 1: gefitinib 250 mg/day + 6 cycles of regime A | |
| Outcomes | Overall survival | |
| Notes | — | |
| Risk of bias | ||
| Bias | Authors' judgement | Support for judgement |
| Random sequence generation (selection bias) | Low risk | Quote: "randomly assigned to one of three groups.. further stratification by dynamic randomisation..." Comment: this was judged as a low risk of bias |
| Allocation concealment (selection bias) | Unclear risk | No information provided Comment: there was insufficient information to permit a clear judgement of risk of bias |
| Blinding (performance bias and detection bias) | Low risk | Quote: "double‐blind manner" Comment: this was judged as a low risk of bias |
| Incomplete outcome data (attrition bias) | High risk | No information provided Comment: this was judged as a high risk of bias |
| Selective reporting (reporting bias) | Low risk | All prespecified outcomes were reported Comment: this was judged as a low risk of bias |
| Other bias | Low risk | Financial conflicts of interest declared Comment: this was judged as a low risk of bias |
| Methods | Design: parallel‐group Randomisation: yes, method not stated Blinding: double‐blind, double‐dummy Withdrawals: stated | |
| Participants | Setting: multicentre study, hospital outpatient department Number eligible: 220 Number enrolled: 201 Number in treatment group: 100 Number in control group: 101 Number of withdrawals (treatment/control): 26/19 Number completing trial (treatment/control): 100/101 Age range: treatment 43 to 89, control 42 to 90 Sex: M 122, F 79 Ethnicity: white 193 NSCLC diagnosis: histologically or cytologically confirmed locally advanced or metastatic NSCLC not amenable to curative surgery or radiotherapy Inclusion criteria: age > 18 years, chemotherapy‐naive, WHO performance of 2 or 3, measurable disease (RECIST), no prior EGFR inhibitor therapy Exclusion criteria: untreated, newly diagnosed metastases in the CNS; other coexisting malignancies or malignancies diagnosed within the last 5 years other than basal cell carcinoma or cervical cancer in situ; fewer than 4 weeks since completion of wide‐field radiotherapy or persistence of any radiotherapy‐related toxicity; unresolved chronic toxicity greater than National Cancer Institute Common Toxicity Criteria for Adverse Events grade 2 from previous anticancer therapy (except alopecia); evidence of clinically active interstitial lung disease; prior treatment with epidermal growth factor receptor inhibitors, biologic or immunological therapy; and treatment with an investigational drug within the prior 30 days. Baseline characteristics of treatment/control groups: comparable | |
| Interventions | Gefitinib 250 mg/day plus best supportive care Placebo plus best supportive care | |
| Outcomes | Overall survival Progression‐free survival (PFS) Tumour response ‐ RECIST ASEs ‐ NCI‐CTC Haematology and biochemical parameters Quality of life Pulmonary symptom improvement (PSI) | |
| Notes | — | |
| Risk of bias | ||
| Bias | Authors' judgement | Support for judgement |
| Random sequence generation (selection bias) | Low risk | Quote: "randomly assigned 1:1 according to a randomisation scheme prepared by biostatics group, AstraZeneca" Comment: this was judged as a low risk of bias |
| Allocation concealment (selection bias) | Low risk | Central allocation Comment: this was judged as a low risk of bias |
| Blinding (performance bias and detection bias) | Low risk | Quote: "double‐blind", "gefitinib and placebo tablets physically identical and presented in identical packaging" Comment: this was judged as a low risk of bias |
| Incomplete outcome data (attrition bias) | Low risk | Attrition presented in Figure 1. Missing outcomes balanced in numbers across intervention groups with similar reasons for missing data across groups. Intention‐to‐treat analysis performed Comment: this was judged as a low risk of bias |
| Selective reporting (reporting bias) | Low risk | All prespecified outcomes were reported Comment: this was judged as a low risk of bias |
| Other bias | Unclear risk | Co‐authors are recipients of research grants and honoraria from industry Comment: this was judged as an unclear risk of bias |
| Methods | Design: parallel‐group Randomisation: yes, method not stated Blinding: open‐label Withdrawals: stated Jadad score: 2 | |
| Participants | Setting: multicentre study, hospital outpatient department Number eligible: 316 Number enrolled: 313 Number in treatment group: 159 Number in control group: 154 Number of withdrawals (treatment/control): 0/4 Number completing trial (treatment/control): 159/150 Age range: (treatment/control): 32 to 74 years/19 to 74 years Sex: 35 M, 174 F Ethnicity: Asian NSCLC diagnosis: stage IIIB (ineligible for curative radiotherapy) or IV adenocarcinoma of the lung with measurable or non‐measurable disease Inclusion criteria: stage IIIB or IV adenocarcinoma of the lung. ECOG PS 0 to 2, adequate bone marrow, liver and renal function. Exclusion criteria: known severe hypersensitivity to gefitinib or any constituents of this product, any evidence of clinically active interstitial lung disease; severe or uncontrolled systemic disease; concomitant use of phenytoin, carbamazepine, rifampin, barbiturate or St John's Wort; non‐stable brain metastasis Baseline characteristics of treatment/control groups: comparable | |
| Interventions | Gefitinib 250 mg/day Gemcitabine (1250 mg/m2) on days 1 and 8 plus cisplatin (75 mg/m2) on day 1. Cycles repeated every 3 weeks for up to a maximum of 9 cycles as tolerated. | |
| Outcomes | Overall survival Progression‐free survival Tumour response – RECIST ASEs – NCI‐CTC Quality of life – EORTC Quality of Life Questionnaire C30 and LC13 | |
| Notes | — | |
| Risk of bias | ||
| Bias | Authors' judgement | Support for judgement |
| Random sequence generation (selection bias) | Unclear risk | Randomised but no further details provided Comment: there was insufficient information to permit a clear judgement of risk of bias |
| Allocation concealment (selection bias) | Unclear risk | No information provided Comment: there was insufficient information to permit a clear judgement of risk of bias |
| Blinding (performance bias and detection bias) | Low risk | No blinding but review authors judge that outcome is not likely to be influenced by lack of blinding Comment: this was judged as a low risk of bias |
| Incomplete outcome data (attrition bias) | Low risk | Exclusions and reasons for withdrawals presented in Figure 1. Reasons for missing data unlikely to be related to true outcome (4/313 withdrawn, but all from the chemotherapy arm). Intention‐to‐treat analysis performed Comment: this was judged as a low risk of bias |
| Selective reporting (reporting bias) | Low risk | All prespecified outcomes were reported Comment: this was judged as a low risk of bias |
| Other bias | Unclear risk | Co‐authors are recipients of research grants and honoraria from industry Comment: this was judged as an unclear risk of bias |
| Methods | Design: parallel‐group | |
| Participants | Setting: multicentre study, hospital outpatient department Number eligible: 1037 Inclusion criteria: no prior chemotherapy; age < 18 years; WHO PS 0 to 2 Exclusion criteria: presence of mixed NSCLC or small cell lung cancer; brain metastases that were newly diagnosed or had not been treated with surgery or radiation; previously treated CNS metastases or spinal cord compression in presence of clinically stable disease; less than 2 weeks since radiotherapy; unresolved toxicity from prior radiotherapy or incomplete healing from surgery; evidence of severe systemic disease; greater than trace protein or blood on repeat urinalysis; absolute neutrophils count < 2000/µL; WBC < 4000/µL; platelets < 100,000/µL; serum bilirubin greater than 1.25 times normal upper limit; ALT or AST greater than 2.5 times normal upper limit; serum creatinine greater 1.5 times normal upper limit; pregnancy; breastfeeding; hypersensitive to mannitol, corticosteroids, H2‐antagonists, antihistamines or agents formulated with polyoxyethylated castor oil Baseline characteristics of treatment/control groups: comparable | |
| Interventions | Regime A: IV Paclitaxel 225 mg/m3 over 3 hours on day 1 of 3 week cycle immediately followed by IV carboplatin AUC of 6 mg/mL over 15 to 30 min on day 1 Treatment 1: gefitinib 250 mg/day + 6 cycles of regime A | |
| Outcomes | Overall survival | |
| Notes | — | |
| Risk of bias | ||
| Bias | Authors' judgement | Support for judgement |
| Random sequence generation (selection bias) | Unclear risk | Quote: "randomized to receive..." Comment: there was insufficient information to permit a clear judgement of risk of bias |
| Allocation concealment (selection bias) | Unclear risk | No information provided Comment: there was insufficient information to permit a clear judgement of risk of bias |
| Blinding (performance bias and detection bias) | Low risk | "double‐blind" with use of placebo tablets Comment: this was judged as a low risk of bias |
| Incomplete outcome data (attrition bias) | Unclear risk | No information provided Intention‐to‐treat analysis performed Comment: there was insufficient information to permit a clear judgement of risk of bias |
| Selective reporting (reporting bias) | Low risk | All prespecified outcomes were reported Comment: this was judged as a low risk of bias |
| Other bias | Low risk | Financial conflicts of interest declared Comment: this was judged as a low risk of bias |
| Methods | Design: parallel‐group Randomisation: yes, method not stated Blinding: not stated Withdrawals: stated | |
| Participants | Setting: multicentre study, hospital outpatient department Number eligible: 243 Number enrolled: 243 Number in treatment group: 118 Number in control group: 125 Number of withdrawals (treatment/control): 0/0 Number completing trial (treatment/control): 118/125 Age range: treatment: 24 to 79 years, control 37 to 81 years Sex: M 153, F 90 Ethnicity: White 221, Black 18, Asian 2, other 2 NSCLC diagnosis: pathologically confirmed and inoperable stage IIIA or IIIB NSCLC Inclusion criteria: ECOG 0 or 1, measurable or non‐measurable disease, no prior systemic therapy, radiation therapy or complete surgical resection, adequate organ function, FEV1 of less then 2.0 L if also have a minimum FEV1 of 800 mL in contralateral lung Exclusion criteria: pleural or pericardial effusions, patients with multiple tumours within the lung Baseline characteristics of treatment/control groups: comparable | |
| Interventions | All patients received concurrent cisplatin and etoposide with thoracic radiation according to SWOG 9504 Treatment 1: gefitinib 250 mg/day Treatment 2: placebo | |
| Outcomes | Overall survival Progression‐free survival (PFS) ASEs ‐ NCI‐CTC | |
| Notes | — | |
| Risk of bias | ||
| Bias | Authors' judgement | Support for judgement |
| Random sequence generation (selection bias) | Unclear risk | Quote: "Randomised" but no further information given Comment: there was insufficient information to permit a clear judgement of risk of bias |
| Allocation concealment (selection bias) | Unclear risk | No information provided Comment: there was insufficient information to permit a clear judgement of risk of bias |
| Blinding (performance bias and detection bias) | Low risk | No blinding but review authors judge that outcome is not likely to be influenced by lack of blinding Comment: this was judged as a low risk of bias |
| Incomplete outcome data (attrition bias) | Low risk | Exclusions and attrition stated in text. Missing outcomes balanced in numbers across intervention groups with similar reasons for missing data across groups. 115/571 (20%) eligible patients dropped out before random assignment due to progressive disease and 27 (5%) dropped out as a result of death from cancer, treatment or other causes. Comment: this was judged as a low risk of bias |
| Selective reporting (reporting bias) | Low risk | All prespecified outcomes were reported Comment: this was judged as a low risk of bias |
| Other bias | Unclear risk | Co‐authors are recipients of research grants and honoraria from industry Quote: "Study closed early as unplanned interim analysis rejected alternative hypothesis of improved survival..." Comment: this was judged as an unclear risk of bias |
| Methods | Design: parallel‐group Randomisation: yes, method stated Blinding: open‐label Withdrawals: stated | |
| Participants | Setting: multicentre study, hospital outpatient department Number eligible: 1607 Number enrolled: 1466 Number in treatment group: 733 Number in control group: 733 Number of withdrawals (treatment/control): 701/711 Number completing trial (treatment/control): 116/107 Age range: treatment 27 to 84 years, control 20 to 84 years Sex: M 954, F 512 Ethnicity: White 1090, Asian 323, Black 22, other 31 NSCLC diagnosis: histologically or cytologically confirmed locally advanced or metastatic NSCLC Inclusion criteria: 18 years or older, NSCLC that progressed or recurred after at least 1 previous platinum‐based chemotherapy regimen (up to 2 regimens allowed), WHO performance status 0 to 2, measurable or non‐measurable disease by Response Evaluation Criteria in Solid Tumours (RECIST), had no previous therapy with EGFR tyrosine kinase inhibitor, absolute neutrophil count < 1.5 x 10⁹/L, adequate hepatic function Exclusion criteria: not stated Baseline characteristics of treatment/control groups: comparable | |
| Interventions | Treatment: gefitinib (250 mg/day) Control: docetaxel (75 mg/m2 in a 1‐hour infusion every 3 weeks) with standard premedication | |
| Outcomes | Overall survival Progression‐free survival (PFS) Tumour response ‐ RECIST ASEs ‐ NCI‐CTC FACT‐L, TOI, LCS EGFR gene copy number | |
| Notes | — | |
| Risk of bias | ||
| Bias | Authors' judgement | Support for judgement |
| Random sequence generation (selection bias) | Low risk | Quote: "Use of a centralised registration and randomisation centre, contacted by telephone, to assign patients to a specific treatment group" Comment: this was judged as a low risk of bias |
| Allocation concealment (selection bias) | Low risk | Quote: "Use of a centralised registration and randomisation centre, contacted by telephone, to assign patients to a specific treatment group" Comment: this was judged as a low risk of bias |
| Blinding (performance bias and detection bias) | Low risk | No blinding but review authors judge that outcome is not likely to be influenced by lack of blinding Comment: this was judged as a low risk of bias |
| Incomplete outcome data (attrition bias) | Low risk | Exclusions and attrition presented in Figure 1. Missing outcome data balanced in numbers across intervention groups with similar reasons for missing data across groups. Comment: this was judged as a low risk of bias |
| Selective reporting (reporting bias) | Low risk | All prespecified outcomes were reported Comment: this was judged as a low risk of bias |
| Other bias | Low risk | Co‐authors are recipients of research grants and honoraria from industry. Study was supported by Astra Zeneca, but principal investigators had unrestricted access to the study data and gave assurance for the accuracy and completeness of the reported analyses. Comment: this was judged as a low risk of bias |
| Methods | Design: parallel‐group Randomisation: yes, method not stated Blinding: open‐label Withdrawals: stated | |
| Participants | Setting: single‐centre study, hospital outpatient department Number eligible: 95 Number enrolled: 95 Number in treatment group: 48 Number in control group: 47 Number of withdrawals (treatment/control): not stated Number completing trial (treatment/control): 0/2 Age range: (treatment/control) 42 to 82 years/31 to 81 years Sex: 68 M, 27 F Ethnicity: East Asian NSCLC diagnosis: histologically or cytologically proven advanced (stage IIIB or IV) or recurrent NSCLC; disease progression after first‐line or second‐line chemotherapy; age ≥ 18 years; ECOG PS ≤ 2; at least one measurable lesion; adequate bone marrow (absolute neutrophil count ≥ 1500/mL and platelet count ≥ 100,000/mL), normal hepatic (bilirubin ≥ 1.5 ULN and hepatic transaminase ≤ 2.5 ULN) and renal (serum creatinine < 1.5 mg/dL) functions; and an estimated life expectancy of at least 3 months Patients with brain metastases were eligible if treated with radiotherapy and clinically stable. Exclusion criteria: patients with chronic diarrhoea of any grade, inflammatory bowel disease, uncontrolled comorbid illness or other malignancies Baseline characteristics of treatment/control groups: comparable | |
| Interventions | Pemetrexed 500 mg/m2 intravenously on day 1 of 21‐day cycle Gefitinib 250 mg/day oral 1 cycle for 21 days Cycles to continue until disease progression, unacceptable toxicity or until patient declined further treatment | |
| Outcomes | Progression‐free survival rate at 6 months Progression‐free survival Tumour response – RECIST ASEs – NCI‐CTC Overall survival | |
| Notes | Study closed early due to poor accrual | |
| Risk of bias | ||
| Bias | Authors' judgement | Support for judgement |
| Random sequence generation (selection bias) | Unclear risk | Quote: "patients were randomized.." but no further information provided Comment: there was insufficient information to permit a clear judgement of risk of bias |
| Allocation concealment (selection bias) | Unclear risk | No information provided Comment: there was insufficient information to permit a clear judgement of risk of bias |
| Blinding (performance bias and detection bias) | Low risk | Open‐label but review authors judge that outcome is not likely to be influenced by lack of blinding Comment: this was judged as a low risk of bias |
| Incomplete outcome data (attrition bias) | High risk | Withdrawals not stated Comment: this was judged as a high risk of bias |
| Selective reporting (reporting bias) | Low risk | All prespecified outcomes were reported Comment: this was judged as a low risk of bias |
| Other bias | Unclear risk | No specific funding was disclosed and authors made no disclosure of conflicts of interest Comment: this was judged as an unclear risk of bias |
| Methods | Design: parallel‐group | |
| Participants | Setting: multicentre study, hospital outpatient department Number eligible: 261 NSCLC diagnosis: pathological diagnosis of NSCLC, stage IIIB or IV disease extent Inclusion criteria: treatment with 2 or more regimens containing cisplatin or carboplatin and docetaxel, given either concurrently or as separate regimens; disease progression or unacceptable toxicity with last chemotherapy regimen; symptomatic NSCLC as determined by score of 24 of 28 on LCS of FACT‐L; measurable or evaluable indicator lesions, WHO PS 0 to 2 Exclusion criteria: received chemotherapy or irradiation within 14 days; unresolved toxicity greater than grade 2 from prior chemotherapy; neutrophil count less than 1.5 x 10⁹/L; platelet count less than 75 x 109/L; bilirubin level more than 1.25 times the upper limit of normal; creatinine clearance less than 30 mL/min | |
| Interventions | Treatment 1: gefitinib 250 mg/day (1 x 250 mg tablet + 1 placebo tablet) | |
| Outcomes | FACT‐L | |
| Notes | — | |
| Risk of bias | ||
| Bias | Authors' judgement | Support for judgement |
| Random sequence generation (selection bias) | Unclear risk | Quote: "patients were randomized.." but no further information provided Comment: there was insufficient information to permit a clear judgement of risk of bias |
| Allocation concealment (selection bias) | Unclear risk | No information provided Comment: there was insufficient information to permit a clear judgement of risk of bias |
| Blinding (performance bias and detection bias) | Low risk | No blinding but review authors judge that outcome is not likely to be influenced by lack of blinding Comment: this was judged as a low risk of bias |
| Incomplete outcome data (attrition bias) | Low risk | 1/261 "lost to follow‐up" Comment: this was judged as a low risk of bias |
| Selective reporting (reporting bias) | Low risk | All prespecified outcomes were reported Comment: this was judged as a low risk of bias |
| Other bias | Unclear risk | Research support received from Astra Zeneca Comment: this was judged as an unclear risk of bias |
| Methods | Design: parallel‐group Randomisation: yes, method not stated Blinding: double‐blind Withdrawals: stated | |
| Participants | Setting: multicentre study, hospital outpatient department Number eligible: 163 Number enrolled: 161 Number in treatment group: 82 Number in control group: 79 Number of withdrawals (treatment/control): 8/12 Number completing trial (treatment/control): 82/79 Age range: treatment 21 to 74 years, control 20 to 73 years Sex: M 100, F 61 Ethnicity: Korean NSCLC diagnosis: histologically or cytologically confirmed NSCLC with stage IIB or IV Inclusion criteria: patients with NSCLC who received only 1 previous platinum‐doublet chemotherapy regimen, and who were considered candidates for further chemotherapy. Age 18 years or older, WHO performance status of 0 to 2, progressive or recurrent disease following previous chemotherapy (adjuvant chemotherapy was allowed if full cytotoxic doses of platinum‐based doublet therapy was given in patients with early disease having progressed), measurable disease by RECIST, adequate bone marrow, renal and hepatic function Exclusion criteria: previous docetaxel or any other EGFR‐targeted treatment, any evidence of clinically active interstitial lung disease, newly diagnosed central nervous system metastases, or any unresolved chronic toxicity greater than NCI‐CTCAE grade 2 from previous anti‐cancer therapy Baseline characteristics of treatment/control groups: comparable | |
| Interventions | Gefitinib 250 mg/day Docetaxel 75 mg/m2 as a 1‐hour intravenous infusion on day 1 every 3 weeks | |
| Outcomes | Overall survival Progression‐free survival (PFS) Tumour response ‐ RECIST ASEs ‐ NCI‐CTC Quality of life ‐ LCS of FACT‐L, the Trial Outcome Index | |
| Notes | — | |
| Risk of bias | ||
| Bias | Authors' judgement | Support for judgement |
| Random sequence generation (selection bias) | Unclear risk | Quote: "randomly assigned .. after stratification..." but no further information provided Comment: there was insufficient information to permit a clear judgement of risk of bias |
| Allocation concealment (selection bias) | Unclear risk | No information provided Comment: there was insufficient information to permit a clear judgement of risk of bias |
| Blinding (performance bias and detection bias) | Low risk | No blinding but review authors judge that outcome is not likely to be influenced by lack of blinding Comment: this was judged as a low risk of bias |
| Incomplete outcome data (attrition bias) | Low risk | Attrition presented in Figure 1. Missing outcome data balanced in numbers across intervention groups with similar reasons for missing data across groups. Comment: this was judged as a low risk of bias |
| Selective reporting (reporting bias) | Low risk | All prespecified outcomes were reported Comment: this was judged as a low risk of bias |
| Other bias | Low risk | Quote: "No potential conflicts of interest were disclosed." Comment: this was judged as a low risk of bias |
| Methods | Design: parallel‐group Randomisation: yes, method not stated Blinding: open‐label Withdrawals: stated | |
| Participants | Setting: single‐centre study, hospital outpatient department Number eligible: 98 Number enrolled: 98 Number in treatment group: 50 Number in control group: 48 Number of withdrawals (treatment/control): 1/0 Number completing trial (treatment/control): 49/48 Age range: (treatment/control): 42 to 69 years Sex: 59 M, 39 F Ethnicity: East Asian NSCLC diagnosis: pathologically proven diagnosis of NSCLC, stage IIIB to IV disease Inclusion criteria: age ≥ 18 years, Karnofsky score of ≥ 70, life expectancy ≥ 3 months, Received at least 1 cycles of prior chemotherapy (Navelbine, Gemzar or cisplatin), Have at least 1 target lesion, adequate organ function, normal ECG Exclusion criteria: not stated Baseline characteristics of treatment/control groups: comparable | |
| Interventions | Gefitinib 250 mg/day Docetaxel 75 mg/m2 intravenously, every 3 weeks for 2 to 4 cycles or until disease progression or unacceptable toxicity | |
| Outcomes | Tumour response – RECIST Survival Toxicity – CTCAE Quality of life – WHO criteria | |
| Notes | — | |
| Risk of bias | ||
| Bias | Authors' judgement | Support for judgement |
| Random sequence generation (selection bias) | Unclear risk | "Randomized" but no further information provided Comment: there was insufficient information to permit a clear judgement of risk of bias |
| Allocation concealment (selection bias) | Unclear risk | No information provided Comment: there was insufficient information to permit a clear judgement of risk of bias |
| Blinding (performance bias and detection bias) | Low risk | No blinding but review authors judge that outcome is not likely to be influenced by lack of blinding Comment: this was judged as a low risk of bias |
| Incomplete outcome data (attrition bias) | Low risk | No missing data |
| Selective reporting (reporting bias) | Low risk | All prespecified outcomes were reported Comment: this was judged as a low risk of bias |
| Other bias | Unclear risk | No information provided Comment: there was insufficient information to permit a clear judgement of risk of bias |
| Methods | Design: parallel‐group Randomisation: yes, method not stated Blinding: open‐label Withdrawals: stated | |
| Participants | Setting: single‐centre study, hospital outpatient department Number eligible: 51 Number enrolled: 51 Number in treatment group: 25 Number in control group: 26 Number of withdrawals (treatment/control): 0/0 Number completing trial (treatment/control): 25/26 Age range: (treatment/control): 34 to 73years/36 to 76 years Sex: 9 M, 42 F Ethnicity: East Asian NSCLC diagnosis: histologic or pathologically proven diagnosis of NSCLC, stage IIIB to IV disease Inclusion criteria: age ≥ 18 years, non‐smoker (< 100 cigarettes consumed in lifetime) or former light smoker (< 10 pack‐year history), received no prior chemotherapy of biological/immunological anti‐cancer therapy Exclusion criteria: not stated Baseline characteristics of treatment/control groups: comparable | |
| Interventions | Gefitinib 250 mg/day Paclitaxel 200 mg/m2 with carboplatin AUC5 intravenously for 6 cycles or until disease progression | |
| Outcomes | Progression‐free survival Overall survival Tumour response – RECIST | |
| Notes | — | |
| Risk of bias | ||
| Bias | Authors' judgement | Support for judgement |
| Random sequence generation (selection bias) | Unclear risk | "Randomized" but no further information provided Comment: there was insufficient information to permit a clear judgement of risk of bias |
| Allocation concealment (selection bias) | Unclear risk | No information provided Comment: there was insufficient information to permit a clear judgement of risk of bias |
| Blinding (performance bias and detection bias) | Low risk | No blinding but review authors judge that outcome is not likely to be influenced by lack of blinding Comment: this was judged as a low risk of bias |
| Incomplete outcome data (attrition bias) | Low risk | No missing data |
| Selective reporting (reporting bias) | Low risk | All prespecified outcomes were reported Comment: this was judged as a low risk of bias |
| Other bias | Unclear risk | No information provided Comment: there was insufficient information to permit a clear judgement of risk of bias |
| Methods | Design: parallel‐group Randomisation: yes, method not stated Blinding: not blinded Withdrawals: stated | |
| Participants | Setting: multicentre study, hospital outpatient department Number eligible: 230 Number enrolled: 230 Number in treatment group: 115 Number in control group: 115 Number of withdrawals (treatment/control): 1/5 Number completing trial (treatment/control): 114/110 Age range: treatment: 43 to 75 years, control: 35 to 75 years Sex: 48 M, 145 F Ethnicity: not stated ‐ Japanese NSCLC diagnosis: advanced NSCLC Inclusion criteria: harbouring sensitive EGFR mutations, absence of resistant EGFR mutation T790M, no history of chemotherapy, age 75 or younger Exclusion criteria: presence of resistant EGFR mutation Baseline characteristics of treatment/control groups: comparable | |
| Interventions | Treatment 1: gefitinib 250 mg/day Treatment 2: Paclitaxel (at least dose of 200 mg/m2 of body‐surface area, given intravenously over 3‐hour period) and carboplatin (at a dose equivalent to an area under the concentration‐time curve of 6, given intravenously over a 1‐hour period), both administered on the first day of every 3‐week cycle | |
| Outcomes | Overall survival ‐ date of randomisation to date of death Progression‐free survival (PFS) Tumour response ‐ RECIST ASEs ‐ NCI‐CTC | |
| Notes | — | |
| Risk of bias | ||
| Bias | Authors' judgement | Support for judgement |
| Random sequence generation (selection bias) | Unclear risk | "Randomized" but no further information provided Comment: there was insufficient information to permit a clear judgement of risk of bias |
| Allocation concealment (selection bias) | Unclear risk | No information provided Comment: there was insufficient information to permit a clear judgement of risk of bias |
| Blinding (performance bias and detection bias) | Low risk | No blinding but review authors judge that outcome is not likely to be influenced by lack of blinding Comment: this was judged as a low risk of bias |
| Incomplete outcome data (attrition bias) | Low risk | Exclusions presented in Figure 1, attrition stated in text. Reasons for missing data unlikely to be related to true outcome. 224/230 patients included in PFS population, 227/230 patients included in safety population. Intention‐to‐treat analysis performed Comment: this was judged as a low risk of bias |
| Selective reporting (reporting bias) | Low risk | All prespecified outcomes were reported Comment: this was judged as a low risk of bias |
| Other bias | Low risk | Quote: "In the planned interim analysis of data, PFS was significantly longer in the gefitinib group than in standard‐chemotherapy group resulting in early termination of the study" Funded by Japan Society for Promotion and Science and Japanese Foundation for Multidisciplinary Treatment of Cancer and Tokyo Cooperative Oncology Group Comment: this was judged as an unclear risk of bias |
| Methods | Design: parallel‐group Randomisation: yes, method stated Blinding: open‐label Withdrawals: stated | |
| Participants | Setting: multicentre study, hospital outpatient department Number eligible: 511 Number enrolled: 489 Number in treatment group: 245 Number in control group: 244 Number of withdrawals (treatment/control): 233/241 Number completing trial (treatment/control): 12/3 Age range: < 64 years = 275, > 65 years = 216 Sex: M 302, F 187 Ethnicity: Japanese NSCLC diagnosis: histologically or cytologically confirmed NSCLC (stage IIIB/IV) Inclusion criteria: age 20 years or older, pretreated locally advanced/metastatic (stage IIIB/IV) NSCLC, or recurrent NSCLC, NSCLC not amenable to curative surgery or radiotherapy or postoperative recurrent NSCLC, failure of prior treatment with 1 or 2 chemotherapy regimens (> 1 platinum based regimen), life expectancy of 3 months or greater, WHO PS score 0 to 2, measurable disease by RECIST, WBC count of 4.0 to 12.0 x 10⁹ cells/L, neutrophil count < 2.0 x 10⁹ cells/L, platelet count > 100 x 109 cells/L, serum bilirubin < 1.5 x 10⁹ cells/L, ALT or AST < 2.5 x upper limit of reference range, serum creatinine < 1.5 mg/dL, arterial oxygen tension > 70 torr. Exclusion criteria: received last chemotherapy within 4 weeks before enrolment, received prior treatment with a docetaxel‐containing regimen or any anti‐EGFR therapy, an allergy or suspected allergy to gefitinib or docetaxel, other coexisting malignancies diagnosed within the last 5 years, with exceptions, any unresolved chronic toxicity greater than NCI‐CTC grade 2 from previous anticancer therapy, any evidence of severe or uncontrolled systemic disease, as judged by investigator, current status of pregnancy or breastfeeding, treatment with a non‐approved or investigational drug within 30 drugs before enrolment, intracerebral metastases, significant malabsorption syndrome, past history of or concurrent interstitial lung disease, idiopathic pulmonary fibrosis or pneumoconiosis, or radiation pneumonia or drug‐induced pneumonia, that required corticosteroids, fever with suspected infection or treatment with systemic corticosteroids for > 4 weeks Baseline characteristics of treatment/control groups: comparable | |
| Interventions | Gefitinib 250 mg/day Docetaxel every 3 weeks as a 1‐hour intravenous infusion of 60 mg/m2 | |
| Outcomes | Overall survival Progression‐free survival (PFS) Tumour response ‐ RECIST ASEs ‐ NCI‐CTC | |
| Notes | — | |
| Risk of bias | ||
| Bias | Authors' judgement | Support for judgement |
| Random sequence generation (selection bias) | Low risk | Quote: "randomly assigned by using stratification..." Comment: this was judged as a low risk of bias |
| Allocation concealment (selection bias) | Unclear risk | No information provided Comment: there was insufficient information to permit a clear judgement of risk of bias |
| Blinding (performance bias and detection bias) | Low risk | No blinding but review authors judge that outcome is not likely to be influenced by lack of blinding Comment: this was judged as a low risk of bias |
| Incomplete outcome data (attrition bias) | Low risk | Attrition and exclusions presented in Figure 1. Missing outcome data balanced in numbers across intervention groups with similar reasons for missing data across groups. 483/489 patients analysed for safety, 387/489 (79%) analysed for response (balanced between treatment arms) Intention‐to‐treat analysis performed Comment: this was judged as a low risk of bias |
| Selective reporting (reporting bias) | Low risk | All prespecified outcomes were reported Comment: this was judged as a low risk of bias |
| Other bias | Low risk | Co‐authors have received honoraria from industry Comment: this was judged as a low risk of bias |
| Methods | Design: parallel‐group Randomisation: yes, method stated Blinding: open‐label Withdrawals: stated | |
| Participants | Setting: multicentre study, hospital outpatient department Number eligible: 177 Number enrolled: 177 Number in treatment group: 88 Number in control group: 89 Number of withdrawals (treatment/control): 50/30 Number completing trial (treatment/control): 30/59 Age range: treatment: 34 to 73 years, control: 41 to 75 years Sex: M 53, F 119 Ethnicity: Japanese NSCLC diagnosis: histologically or cytologically confirmed NSCLC (stage IIIB/IV) harbouring an activating mutation of EGFR gene (either exon 19 deletion or L858R in exon 21) Inclusion criteria: aged 75 or younger, WHO performance status 0 to 1, had measurable or non‐measurable disease according to RECIST, adequate organ function. Patients with postoperative recurrence, treated with adjuvant therapy other than cisplatin plus docetaxel, were included when interval between end of adjuvant chemotherapy and registration exceeded 6 months for platinum‐doublet therapy and more than 1 month for oral tegafur plus uracil therapy. Exclusion criteria: received previous drug therapy that had targeted the EGFR, a history of interstitial lung disease, severe drug allergy, active infection or other serious disease condition, symptomatic brain metastases, poorly controlled pleural effusion, pericardial effusion or ascites necessitating drainage, active double cancer, or severe hypersensitivity to drugs containing poly solvate 80, pregnancy or lactation. Baseline characteristics of treatment/control groups: comparable | |
| Interventions | Gefitinib 250 mg/day Docetaxel 60 mg/m2, administered intravenously over a 1‐hour period, followed by cisplatin 80 mg/m2, administered intravenously over a 90‐min period with adequate hydration, in cycles of once every 21 days for 3 to 6 cycles | |
| Outcomes | Progression‐free survival (PFS) Overall survival Tumour response ‐ RECIST Disease control rate ASEs ‐ NCI‐CTC Mutation‐type‐specific survival | |
| Notes | — | |
| Risk of bias | ||
| Bias | Authors' judgement | Support for judgement |
| Random sequence generation (selection bias) | Low risk | Quote: "randomly assigned in 1:1 ratio" Comment: this was judged as a low risk of bias |
| Allocation concealment (selection bias) | Low risk | Quote: "Patients were allocated at the WJOG data centre to each treatment group using a desktop computer programmed for the minimisation method." Comment: this was judged as a low risk of bias |
| Blinding (performance bias and detection bias) | Low risk | No blinding but review authors judge that outcome is not likely to be influenced by lack of blinding Comment: this was judged as a low risk of bias |
| Incomplete outcome data (attrition bias) | Low risk | Exclusions and attrition presented in Figure 1. Reasons for missing data unlikely to be related to true outcome. 5/177 withdrawn. Comment: this was judged as a low risk of bias |
| Selective reporting (reporting bias) | Low risk | All prespecified outcomes were reported, except for overall survival. Quote: "data for overall survival were immature, with follow‐up still ongoing" Comment: this was judged as a low risk of bias |
| Other bias | Low risk | Trial designed and conducted independently of any pharmaceutical company Author conflicts of interest declared Trial closed early as results of contemporary studies showing improved PFS in EGFR mutation positive NSCLC. Further trial accrual was felt to be futile and unethical. Comment: this was judged as low risk of bias |
| Methods | Design: parallel‐group Randomisation: yes, method stated Blinding: not blinded Withdrawals: stated | |
| Participants | Setting: multicentre study, hospital outpatient department Number eligible: 1329 Number enrolled: 1217 Number in treatment group: 609 Number in control group: 608 Number of withdrawals (treatment/control): 12/28 Number completing trial (treatment/control): 597/580 Age range: treatment: 24 to 84 years, control: 25 to 84 years Sex: M 252, F 965 Ethnicity: Chinese 618, Japanese 233, other East Asian 363, other 3 NSCLC diagnosis: histologically or cytologically confirmed stage IIIB or IV NSCLC with histological features of adenocarcinoma Inclusion criteria: 18 years or older, non‐smoker or former light smokers (those who had stopped smoking at least 15 years previously and had a total of ?10 pack‐years of smoking), no previous chemotherapy or biologic or immunologic therapy, WHO PS 0 to 2, measurable disease according to RECIST criteria with at least 1 measurable lesion, not previously irradiated, adjuvant chemotherapy permitted if not platinum‐based and completed > 6 months previously, absolute neutrophil count > 2.0 x 10⁹ and adequate hepatic function Exclusion criteria: not stated Baseline characteristics of treatment/control groups: comparable | |
| Interventions | Treatment: gefitinib 250 mg/day Control: Paclitaxel (200 mg/m2 of body‐surface area, administered intravenously over a 3‐hour period on the first day of the cycle) followed immediately by carboplatin (at a dose calculated to produce an area under the curve of 5.0 to 6.0 per mL per min, administered intravenously over a period of 15 to 60 min) | |
| Outcomes | Overall survival Progression‐free survival (PFS) Tumour response ‐ RECIST ASEs ‐ NCI‐CTC Quality of life ‐ FACT‐L, TOI, LCS score of FACT‐L | |
| Notes | — | |
| Risk of bias | ||
| Bias | Authors' judgement | Support for judgement |
| Random sequence generation (selection bias) | Low risk | Quote: "randomisation was performed with the use of dynamic balancing..." Comment: this was judged as a low risk of bias |
| Allocation concealment (selection bias) | Unclear risk | No information provided Comment: there was insufficient information to permit a clear judgement of risk of bias |
| Blinding (performance bias and detection bias) | Low risk | No blinding but review authors judge that outcome is not likely to be influenced by lack of blinding Comment: this was judged as a low risk of bias |
| Incomplete outcome data (attrition bias) | Low risk | Exclusions and attrition presented in Figure 1. Missing outcome data balanced in numbers across intervention groups with similar reasons for missing data across groups. 1159/1217 (95%) included in analysis Intention‐to‐treat analysis performed Comment: this was judged as a low risk of bias |
| Selective reporting (reporting bias) | Low risk | All prespecified outcomes were reported Comment: this was judged as a low risk of bias |
| Other bias | Unclear risk | Funding from the Chinese Lung Cancer Research Foundation. Co‐authors received consulting fees and grant support from industry. Comment: this was judged as an unclear risk of bias |
| Methods | Design: parallel‐group Randomisation: yes, method stated Blinding: double‐blind Withdrawals: stated | |
| Participants | Setting: multicentre study, hospital outpatient department Number eligible: 128 Number enrolled: 85 Number in treatment group: 43 Number in control group: 42 Number of withdrawals (treatment/control): 43/41 Number completing trial (treatment/control): 0/0 Age range: treatment 45 to 79 years, control 30 to 79 years Sex: M 71, F 14 Ethnicity: not stated NSCLC diagnosis: stage IIIb/IV NSCLC Inclusion criteria: age 18 to 80, NSCLC with measurable disease, ECOG PS 2 or 3, adequate organ function Exclusion criteria: prior chemotherapy, prior EGFR therapy or prior thoracic radiotherapy Baseline characteristics of treatment/control groups: comparable | |
| Interventions | Gefitinib 250 mg daily Docetaxel 75 mg/m2 day 1 every 3 weeks | |
| Outcomes | Overall survival Time to progression Tumour response ‐ RECIST ASEs ‐ NCI‐CTC | |
| Notes | — | |
| Risk of bias | ||
| Bias | Authors' judgement | Support for judgement |
| Random sequence generation (selection bias) | Low risk | Quote: "random assignment was block stratified..." Comment: this was judged as a low risk of bias |
| Allocation concealment (selection bias) | Unclear risk | No information provided Comment: there was insufficient information to permit a clear judgement of risk of bias |
| Blinding (performance bias and detection bias) | Low risk | No blinding but review authors judge that outcome is not likely to be influenced by lack of blinding Comment: this was judged as a low risk of bias |
| Incomplete outcome data (attrition bias) | Low risk | Exclusions and attrition presented in Figure 1. Missing outcome data balanced in numbers across intervention groups with similar reasons for missing data across groups. Comment: this was judged as a low risk of bias |
| Selective reporting (reporting bias) | Low risk | All prespecified outcomes were reported Comment: this was judged as a low risk of bias |
| Other bias | Low risk | Co‐authors have received honoraria from industry Comment: this was judged as a low risk of bias |
| Methods | Design: parallel‐group Randomisation: yes, method stated Blinding: placebo‐controlled Withdrawals: stated | |
| Participants | Setting: multicentre study, hospital outpatient department Number eligible: 287 Number enrolled: 265 Number in treatment group: 133 Number in control group: 132 Number of withdrawals (treatment/control): 1/0 Number completing trial (treatment/control): 23/18 Age range: (treatment/control) 33 to 79 years/35 to 79 years Sex: 94 M, 171 F Ethnicity: East Asian 78%; Spanish/French/German/Italian/Russia 22% NSCLC diagnosis: histologic/cytologic diagnosis of NSCLC, stage IIIB to IV disease, chemotherapy‐naive Inclusion criteria: age ≥ 18 years; chemotherapy‐naive advanced NSCLC and an activating EGFR mutation as confirmed by local testing, who had achieved a complete or partial response for longer than 4 months, or durable stable disease for at least 6 months on first‐line gefitinib and had subsequently developed radiological disease progression. Life expectancy of > 12 months, and a WHO PS of 0 or 1. Exclusion criteria: NSCLC of predominately squamous cell histology, a history of interstitial lung disease, any other coexisting malignancies diagnosed within the past 5 years (excluding basal cell carcinoma, cervical cancer in situ, or completely resected intramucosal gastric cancer) or treatment with another investigational drug 4 weeks of less before random allocation Baseline characteristics of treatment/control groups: comparable | |
| Interventions | Gefitinib 250 mg daily PLUS cisplatin 75 mg/m2 and pemetrexed 500 mg/m2 on day 1 of cycle Placebo PLUS cisplatin 75 mg/m2 and pemetrexed 500 mg/m2 on day 1 of cycle | |
| Outcomes | Progression‐free survival Tumour response – RECIST Overall survival ASEs – NCI‐CTC Health‐related quality of life – FACT‐L, LCS, TOI | |
| Notes | — | |
| Risk of bias | ||
| Bias | Authors' judgement | Support for judgement |
| Random sequence generation (selection bias) | Low risk | Use of "central block randomisation to allocate patients (1:1)..." Comment: this was judged as a low risk of bias |
| Allocation concealment (selection bias) | Low risk | Patients were assigned a unique enrolment number using an interactive web response system Comment: this was judged as a low risk of bias |
| Blinding (performance bias and detection bias) | Low risk | Placebo‐controlled with identical packaging Comment: this was judged as a low risk of bias |
| Incomplete outcome data (attrition bias) | Low risk | Withdrawals stated in Figure 1 Missing outcome data balanced in numbers across intervention groups with similar reasons for missing data across groups Comment: this was judged as a low risk of bias |
| Selective reporting (reporting bias) | Low risk | All prespecified outcomes were reported Comment: this was judged as a low risk of bias |
| Other bias | Unclear risk | Authors have received honoraria, consultant and advisor fees from industry Study funded by Astra Zeneca, who co‐ordinated the trial, managed the database and undertook analyses Comment: this was judged as an unclear risk of bias |
| Methods | Design: parallel‐group Randomisation: yes, method not stated Blinding: open‐label Withdrawals: stated | |
| Participants | Setting: multicentre study, hospital outpatient department Number eligible: 147 Number enrolled: 141 Number in treatment group: 71 Number in control group: 70 Number of withdrawals (treatment/control): 3/3 Number completing trial (treatment/control): 68/67 Age range: (treatment/control): 40 to 77 years/30 to 78 years Sex: 20 M, 115 F Ethnicity: Asian NSCLC diagnosis: histologically or cytologically confirmed pulmonary adenocarcinoma Inclusion criteria: histologically or cytologically confirmed pulmonary adenocarcinoma that progressed after just 1 previous platinum‐based chemotherapy regimen for advanced disease, never‐smoker, 18 years or older, ECOG PS 0 to 2, measurable or evaluable disease, adequate bone marrow, renal and hepatic function Exclusion criteria: prior EGFR TKI or pemetrexed treatment and symptomatic or uncontrolled brain metastases Baseline characteristics of treatment/control groups: comparable | |
| Interventions | Gefitinib 250 mg/day Pemetrexed 500 mg/m2 on day 1 of a 21‐day cycle Cycles repeated until disease progression, unacceptable toxicity, or until patient or investigator requested therapy discontinuation | |
| Outcomes | Tumour response – RECIST Overall survival Progression‐free survival ASEs – NCI‐CTC Haematology and biochemical parameters Quality of life – EORTC Quality of Life Questionnaire C30 (EORTC QLQ‐C30) | |
| Notes | — | |
| Risk of bias | ||
| Bias | Authors' judgement | Support for judgement |
| Random sequence generation (selection bias) | Low risk | Quote: "consecutively assigned to either arm according to a predefined computer‐generated randomisation scheme developed by statisticians" Comment: this was judged as a low risk of bias |
| Allocation concealment (selection bias) | Low risk | Quote: "consecutively assigned to either arm according to a predefined computer‐generated randomisation scheme developed by statisticians" Comment: this was judged as a low risk of bias |
| Blinding (performance bias and detection bias) | Low risk | No blinding but review authors judge that outcome is not likely to be influenced by lack of blinding Comment: this was judged as a low risk of bias |
| Incomplete outcome data (attrition bias) | Low risk | Exclusions and attrition presented in Figure 1. Missing outcome data balanced in numbers across intervention groups with similar reasons for missing data across groups. 135/141 patients analysed for efficacy. Comment: this was judged as a low risk of bias |
| Selective reporting (reporting bias) | Low risk | All prespecified outcomes were reported Comment: this was judged as a low risk of bias |
| Other bias | Unclear risk | No specific funding was disclosed and authors made no disclosure of conflicts of interest Comment: this was judged as an unclear risk of bias |
| Methods | Design: parallel‐group Randomisation: yes, method stated Blinding: double‐blind Withdrawals: stated | |
| Participants | Setting: multicentre study, hospital outpatient department Number eligible: 604 Number enrolled: 603 Number in treatment group: 302 Number in control group: 301 Number of withdrawals (treatment/control): 4/4 Number completing trial (treatment/control): 298/297 Age range: treatment 25 to 74 years; control 35 to 74 years Sex: M 383, F 215 Ethnicity: Japanese NSCLC diagnosis: histologically or cytologically confirmed stage IIIB (with malignant pleural effusion or contralateral hilar lymph node metastases) or stage IV NSCLC Inclusion criteria: NSCLC who had not previously received any chemotherapy, patients who had recurrence after complete surgical resection were permitted, ECOG performance status 0 to 1, adequate organ function as indicated as WBC count > 4000/µL, absolute neutrophil count > 2000/µL, haemoglobin > 9.5 g/dL, AST/ALT < 2.5 times the upper limit of normal, total bilirubin < 1.5 mg/dL, serum creatinine < 1.2 mg/dL, PaO2 in arterial blood > 70 mmHg. Asymptomatic brain metastases were allowed provided they had been irradiated and were clinically and radiologically stable. Exclusion criteria: patients treated with either adjuvant or neoadjuvant chemotherapy. Radiologically or clinically apparent interstitial pneumonitis or pulmonary fibrosis. Baseline characteristics of treatment/control groups: comparable | |
| Interventions | Arm A: platinum doublet chemotherapy ‐ up to 6 cycles Arm B: 3 cycles of chemotherapy followed by gefitinib 250g/day orally until disease progression | |
| Outcomes | Overall survival Progression‐free survival (PFS) Tumour response ‐ RECIST Quality of life ‐ FACT‐L | |
| Notes | — | |
| Risk of bias | ||
| Bias | Authors' judgement | Support for judgement |
| Random sequence generation (selection bias) | Unclear risk | "Randomised" but no further information provided Comment: there was insufficient information to permit a clear judgement of risk of bias |
| Allocation concealment (selection bias) | Unclear risk | No information provided Comment: there was insufficient information to permit a clear judgement of risk of bias |
| Blinding (performance bias and detection bias) | Low risk | No blinding but review authors judge that outcome is not likely to be influenced by lack of blinding Comment: this was judged as a low risk of bias |
| Incomplete outcome data (attrition bias) | Low risk | Exclusions presented in Figure 1; withdrawals were stated in text. Missing outcome data balanced in numbers across intervention groups with similar reasons for missing data across groups. 595/604 included in analysis. Comment: this was judged as a low risk of bias |
| Selective reporting (reporting bias) | Low risk | All prespecified outcomes were reported Comment: this was judged as a low risk of bias |
| Other bias | Low risk | Co‐authors have received honoraria from industry Comment: this was judged as a low risk of bias |
| Methods | Design: parallel‐group | |
| Participants | Setting: multicentre study, hospital outpatient department Number eligible: 1836 Inclusion criteria: NSCLC not curable with surgery or radiotherapy; previously received 1 or 2 chemotherapy regimens; refractory to (recurrent or progressive disease within 90 days of chemotherapy) or intolerant of latest chemotherapy regimen; younger than 70 years; received at least 1 previous platinum‐based chemotherapy regimen; WHO PS 0 to 2; life expectancy of at least 8 weeks Exclusion criteria: presence of small cell lung cancer alone or with NSCLC; administration of last dose of single‐agent chemotherapy within the previous 21 days; untreated or clinically unstable newly diagnosed metastasis in central nervous system; less than 1 week since completion of previous radiotherapy or persistence of any radiotherapy‐related toxic effects; unresolved chronic toxic effects from previous anticancer therapy; known severe hypersensitivity to gefitinib or any tablet excipients; inability to swallow tablets; other coexisting malignant disease (apart from basal cell carcinoma); absolute neutrophils count less than 1.0 x 10⁹/L; platelet count less than 100 x 109/L; serum bilirubin concentration more than 3 times upper limit of normal; AST or AST concentration more than 5x upper limit of normal; more than 2 previous chemotherapy regimens for NSCLC; previous treatment with an experimental agent of which the main mechanism of action is inhibition of epidermal growth receptor or its associated tyrosine kinase; concomitant use of phenytoin, carbamazepine, rifampicin, barbiturates, St John's wort; severe or uncontrolled systemic disease; clinically active interstitial lung disease (except uncomplicated lymphangitic carcinomatosis); pregnancy; breastfeeding Baseline characteristics of treatment/control groups: comparable | |
| Interventions | Gefitinib 250 mg/day | |
| Outcomes | Overall survival | |
| Notes | — | |
| Risk of bias | ||
| Bias | Authors' judgement | Support for judgement |
| Random sequence generation (selection bias) | Low risk | Quote: "randomisation done by a minimisation method" Comment: this was judged as a low risk of bias |
| Allocation concealment (selection bias) | Low risk | Quote: "central registration and randomisation centre" Comment: this was judged as a low risk of bias |
| Blinding (performance bias and detection bias) | Low risk | Quote: "double‐blind", "physically identical tablets and packaging" Comment: this was judged as a low risk of bias |
| Incomplete outcome data (attrition bias) | Low risk | Quote: "818/1126 in treatment group and 451/562 in placebo group discontinued". Missing outcomes balanced in numbers across intervention groups with similar reasons for missing data across groups. Comment: this was judged as a low risk of bias |
| Selective reporting (reporting bias) | Low risk | All prespecified outcomes were reported Comment: this was judged as a low risk of bias |
| Other bias | Low risk | Co‐authors have received honoraria from industry Comment: this was judged as a low risk of bias |
| Methods | Design: parallel‐group Randomisation: yes, method not stated Blinding: open‐label Withdrawals: not stated | |
| Participants | Setting: single‐centre study, hospital outpatient department Number eligible: 188 Number enrolled: 188 Number in treatment group: 94 Number in control group: 94 Number of withdrawals (treatment/control): not stated Number completing trial (treatment/control): not stated Age range: (treatment/control): 60 to 82 years Sex: 98 M, 90 F Ethnicity: East Asian NSCLC diagnosis: histologic/cytologic diagnosis of NSCLC, stage IIIB to IV disease Inclusion criteria: stage IIIB to IV NSCLC, inoperable due to medical reasons or rejecting surgery, or the patients accepting 4 to 8 cycles of first‐line chemotherapy and achieving complete remission, partial response or stability. KPS ≥ 60, no other disease interfering patients to complete the treatment; no brain metastases, with good compliance Exclusion criteria: not stated Baseline characteristics of treatment/control groups: comparable | |
| Interventions | Pemetrexed 500 mg/m2 day 1 to 3 Gefitinib 250 mg/daily | |
| Outcomes | Tumour response – RECIST ASEs – NCI‐CTC | |
| Notes | — | |
| Risk of bias | ||
| Bias | Authors' judgement | Support for judgement |
| Random sequence generation (selection bias) | Unclear risk | "...randomized" Comment: there was insufficient information to permit a clear judgement of risk of bias |
| Allocation concealment (selection bias) | Unclear risk | No information provided Comment: there was insufficient information to permit a clear judgement of risk of bias |
| Blinding (performance bias and detection bias) | Low risk | Open‐label but review authors judge that outcome is not likely to be influenced by lack of blinding Comment: this was judged as a low risk of bias |
| Incomplete outcome data (attrition bias) | High risk | Withdrawals not stated Comment: this was judged as a high risk of bias |
| Selective reporting (reporting bias) | High risk | "survival time" was a prespecified outcome but not reported in methods; reason for this is unclear Comment: this was judged as a high risk of bias |
| Other bias | Low risk | Disclosed no conflicts of interest Comment: this was judged as a low risk of bias |
| Methods | Design: parallel‐group Randomisation: yes, method not stated Blinding: open‐label Withdrawals: stated | |
| Participants | Setting: multicentre study, hospital outpatient department Number eligible: 155 Number enrolled: 100 Number in treatment group: 48 Number in control group: 48 Number of withdrawals (treatment/control): 2/2 Number completing trial (treatment/control): 8/10 Age range: (treatment/control) 33 to 83 years/32 to 83 years Sex: 43 M, 53 F Ethnicity: East Asian NSCLC diagnosis: histologic/cytologic diagnosis of NSCLC, stage IIIB to IV disease Inclusion criteria: advanced, refractory or recurrent NSCLC after at least 1 previous regimen; achievement of stable disease after 1 month of gefitinib 250 mg daily therapy; measurable lesions by RECIST criteria; ECOG PS 0 to 2; satisfactory renal, haematological and cardiac function. Stable brain metastases were allowed. Exclusion criteria: previous EGFR TKI therapy, pregnancy, breastfeeding, or unable to take oral medications Baseline characteristics of treatment/control groups: comparable | |
| Interventions | Gefitinib 500 mg/day Gefitinib 250 mg/day | |
| Outcomes | Tumour response – RECIST Progression‐free survival Overall survival ASEs – NCI‐CTC | |
| Notes | — | |
| Risk of bias | ||
| Bias | Authors' judgement | Support for judgement |
| Random sequence generation (selection bias) | Unclear risk | "...randomized " Comment: there was insufficient information to permit a clear judgement of risk of bias |
| Allocation concealment (selection bias) | Unclear risk | No information provided Comment: there was insufficient information to permit a clear judgement of risk of bias |
| Blinding (performance bias and detection bias) | Low risk | Open‐label but review authors judge that outcome is not likely to be influenced by lack of blinding Comment: this was judged as a low risk of bias |
| Incomplete outcome data (attrition bias) | Low risk | Withdrawals stated with reasons such as "consent not given" provided Comment: this was judged as a low risk of bias |
| Selective reporting (reporting bias) | Low risk | All prespecified outcomes were reported Comment: this was judged as a low risk of bias |
| Other bias | Low risk | Study supported by Wu Jieping Medical Foundation Project grant and National funding programmes. One author has declared having received research support from industry. Comment: this was judged as a low risk of bias |
| Methods | Design: parallel‐group Randomisation: yes, method stated Blinding: open‐label Withdrawals: stated | |
| Participants | Setting: multicentre study, hospital outpatient department Number eligible: 253 Number enrolled: 236 Number in treatment group: 118 Number in control group: 118 Number of withdrawals (treatment/control): 4/0 Number completing trial (treatment/control): 12/46 Age range: treatment 24 to 81 years; control 31 to 79 years Sex: 59 M, 177 F Ethnicity: East Asian NSCLC diagnosis: histologic/cytologic diagnosis of non‐squamous NSCLC, stage IIIB to IV disease Inclusion criteria: chemotherapy‐naive patients of East Asian ethnicity and unknown EGFR mutation status. Stage IIIB to IV non‐squamous NSCLC. Age ≥ 18 years, "light ex smokers" or "never smokers" measurable disease by RECIST version 1.0, ECOG PS 0 or 1 Exclusion criteria: known EGFR status before study entry, documented brain metastasis (previously treated stable brain metastases were allowed), clinically significant third space fluid collections, inability to interrupt aspirin or other non‐steroidal anti‐inflammatory agents (except aspirin at a dose of 1300 mg daily for a 5‐day period) and concomitant use of CYP3A4 inducers Baseline characteristics of treatment/control groups: comparable | |
| Interventions | PC/Gefitinib arm Pemetrexed (500 mg/m2) + cisplatin (75 mg/m2) on day 1 of 21‐day cycle. Maximum of 6 cycles. Then non‐progressing patients received gefitinib 250 mg daily as maintenance Gefitinib arm Gefitinib 250 mg daily as maintenance | |
| Outcomes | Progression‐free survival Overall survival Tumour response – RECIST Time to progressive disease (TtPD) Duration of response (DoR) ASEs – NCI‐CTC Association between EGFR mutation status and clinical outcomes | |
| Notes | — | |
| Risk of bias | ||
| Bias | Authors' judgement | Support for judgement |
| Random sequence generation (selection bias) | Low risk | "... randomisation was controlled by a centrally located computerised voice response unit using a computer‐generated random sequence and an interactive voice response system..." Comment: this was judged as a low risk of bias |
| Allocation concealment (selection bias) | Low risk | External computer generated random sequence Comment: this was judged as a low risk of bias |
| Blinding (performance bias and detection bias) | Low risk | Open‐label but review authors judge that outcome is not likely to be influenced by lack of blinding Comment: this was judged as a low risk of bias |
| Incomplete outcome data (attrition bias) | Low risk | Withdrawals presented in Figure 1. 58 patients completed the study, with balanced numbers between both arms. Comment: this was judged as a low risk of bias |
| Selective reporting (reporting bias) | Low risk | All prespecified outcomes were reported Comment: this was judged as a low risk of bias |
| Other bias | Unclear risk | Authors have declared paid consultancies, honorarium and research funding from industry Comment: this was judged as an unclear risk of bias |
| Methods | Design: parallel‐group Randomisation: yes, method not stated Blinding: open‐label Withdrawals: stated | |
| Participants | Setting: single‐centre study, hospital outpatient department Number eligible: 120 Number enrolled: 117 Number in treatment group: 58 Number in control group: 59 Number of withdrawals (treatment/control): 6/2 Number completing trial (treatment/control): 27/27 Age range: treatmnet 36 to 72 years;control 33 to 70 years Sex: 58 M, 59 F Ethnicity: East Asian NSCLC diagnosis: histologic/cytologic diagnosis of advanced or recurrent non‐squamous NSCLC, stage IIIB to IV disease Inclusion criteria: ≥ 18 years, stage IIIB to IV non‐squamous NSCLC ECOG PS 0 to 1; measurable disease according to RECIST, adequate haematological hepatic and renal functions, life expectancy of > 12 weeks Exclusion criteria: received previous systemic anticancer treatment or had severe drug allergy, or another serious disease or condition, uncontrolled brain metastases, uncontrolled pleural effusion and/or pericardial effusion, or second malignancy, pregnancy or lactation. Baseline characteristics of treatment/control groups: comparable | |
| Interventions | PC/G Pemetrexed 500 mg/m2 + either cisplatin (75 mg/m2) or carboplatin (AUC5) Intravenously on day 1 of a 3‐week cycle Gefitinib 250 mg orally on day 3 to 16 of a 21‐day cycle PC Pemetrexed 500 mg/m2 + either cisplatin (75 mg/m2) or carboplatin (AUC5) Intravenously on day 1 of a 3‐week cycle Continued until disease progression | |
| Outcomes | Non‐progression rate (NPR) Tumour response – RECIST Progression‐free survival Overall survival ASEs – NCI‐CTC | |
| Notes | — | |
| Risk of bias | ||
| Bias | Authors' judgement | Support for judgement |
| Random sequence generation (selection bias) | Unclear risk | "...randomized in 1:1 ratio" and stratified by smoking status, EGFR genotype Comment: this was judged as an unclear risk of bias |
| Allocation concealment (selection bias) | Unclear risk | No information provided Comment: there was insufficient information to permit a clear judgement of risk of bias |
| Blinding (performance bias and detection bias) | Low risk | No blinding but review authors judge that outcome is not likely to be influenced by lack of blinding Comment: this was judged as a low risk of bias |
| Incomplete outcome data (attrition bias) | Low risk | Withdrawals stated in text Comment: this was judged as a low risk of bias |
| Selective reporting (reporting bias) | Low risk | All prespecified outcomes were reported Comment: this was judged as a low risk of bias |
| Other bias | Low risk | Authors declared no competing conflicts of interest |
| Methods | Design: parallel‐group Randomisation: yes, method stated Blinding: double‐blind Withdrawals: stated | |
| Participants | Setting: multicentre study, hospital outpatient department Number eligible: 298 Number enrolled: 296 Number in treatment group: 148 Number in control group: 148 Number of withdrawals (treatment/control): 81/95 Number completing trial (treatment/control): 67/53 Age range: treatment 31 to 79 years; control 20 to 75 years Sex: 175 M, 121 F Ethnicity: East Asian (Chinese) NSCLC diagnosis: histologically or cytologically confirmed stage IIIB or IV NSCLC Inclusion criteria: stage IIIB or IV NSCLC, 18 years or older, life expectancy of > 12 weeks, WHO PS 0 to 2, completed 4 cycles of first‐line platinum doublet chemotherapy without disease progression and acceptable toxic effects Exclusion criteria: patients with known EGFR status to avoid selection bias. Prior exposure to monoclonal antibodies or small molecule inhibitors against EGFR receptors (e.g. gefitinib, erlotinib, C225). Participation in another clinical study or received treatment with a non‐approved agent within 42 days before Day 1 of study treatment. Serum bilirubin > 3 x ULRR, Aspartate aminotransferase (AST/SGOT) or alanine aminotransferase (ALT/SGPT) ≥ 2.5 x ULN if no demonstrable liver metastases (or > 5 x in presence of liver metastases). Any unresolved chronic toxicity greater than common toxicity criteria (CTCAE) grade 2 from previous anticancer therapy excluding peripheral neuropathy. Patients with previously diagnosed and treated CNS metastases or spinal cord compression may be considered if they are clinically stable and have been discontinued from steroid therapy for at least 4 weeks prior to first dose of study medication. Any evidence of clinically active interstitial lung disease (patients with chronic, stable, radiographic changes who are asymptomatic need not be excluded). Pre‐existing idiopathic pulmonary fibrosis evidence by CT scan at baseline. Patients who have undergone complete tumour resection after responding to platinum‐based chemotherapy. As judged by the investigator, any evidence of severe or uncontrolled systemic disease (e.g. unstable or uncompensated respiratory, cardiac, hepatic or renal disease). Treatment with any systemic anticancer therapies other than the prescribed protocol chemotherapy regimen (refer to Inclusion criterion). Exception: palliative radiotherapy for symptom relief of lesions present at diagnosis will be allowed; however, palliative wide field radiotherapy to the lung must be completed at least 4 weeks before day 1 with no persistence of any radiotherapy‐related toxicity. Other co‐existing malignancies or malignancies diagnosed within the last 5 years with the exception of basal cell carcinoma or cervical cancer in situ. Pregnancy or breastfeeding (women of child bearing potential). Concomitant use of phenytoin, carbamazepine, rifampicin, barbiturates or St. John’s wort. Previous bone marrow transplant. Whole blood transfusion within 120 days of the date of genetic sample collection. Known biomarker status of one or more of the following: tumour EGFR gene copy number, tumour EGFR gene mutation status, tumour EGFR protein expression. Baseline characteristics of treatment/control groups: comparable | |
| Interventions | Gefitinib 250 mg/day Placebo (oral) | |
| Outcomes | Progression‐free survival Overall survival Time to progression Tumour response – RECIST ASEs – NCI‐CTC Haematology and biochemical parameters Quality of life (FACT‐L) | |
| Notes | — | |
| Risk of bias | ||
| Bias | Authors' judgement | Support for judgement |
| Random sequence generation (selection bias) | Low risk | Quote: "randomisation was done centrally by a third‐party randomisation centre that had no other role in the study", "Randomization was performed using dynamic balancing..." Comment: this was judged as a low risk of bias |
| Allocation concealment (selection bias) | Low risk | Quote: "randomisation was done centrally by a third‐party randomisation centre that had no other role in the study" Comment: this was judged as a low risk of bias |
| Blinding (performance bias and detection bias) | Low risk | Quote: "active and placebo drugs were identical in form and packaging to ensure blinding" Comment: this was judged as a low risk of bias |
| Incomplete outcome data (attrition bias) | Low risk | Exclusions and attrition presented in Figure 1. Missing outcomes balanced in numbers across intervention groups with similar reasons for missing data across groups. All 296 patients were available for analysis. Comment: this was judged as a low risk of bias |
| Selective reporting (reporting bias) | Low risk | All prespecified outcomes were reported Comment: this was judged as a low risk of bias |
| Other bias | Unclear risk | Funding for study from Astra Zeneca. Co‐authors have received research support from industry. Comment: this was judged as an unclear risk of bias |
ALT: alanine transaminase
ASE: adverse side effects
AST: aspartate transaminase
AUC: area under curve
CNS: central nervous system
CT: computerised tomography
CTCAE: Common Toxicity Criteria for Adverse Events
ECG: electrocardiogram
ECOG: Eastern Cooperative Oncology Group
ECOG PS: ECOG Performance Status
EGFR: epidermal growth factor receptor
EORTC: European Organisation for Research and Treatment of Cancer
F: female
FACT‐L: Functional Assessment of Cancer Therapy‐Lung
FEV1: forced expiratory volume in one second
ILCP: Italian Lung Cancer Project
IV: intravenous
KPS: Karnofsky Performance Status
LCS: lung cancer subscale
M: male
MRI: magnetic resonance imaging
NCI‐CTC: National Cancer Institute Common Toxicity Criteria
NSCLC: non‐small cell lung cancer
PFS: progression‐free survival
PR: partial response
RECIST: Response Evaluation Criteria in Solid Tumours
SGOT: serum glutamic‐oxaloacetic transaminase
SGPT: serum glutamic‐pyruvic transaminase
TKI: tyrosine kinase inhibitor
TOI: Trial Outcome Index
UFT: tegafur + uracil
UICC: Union for International Cancer Control
ULN: upper limit of normal
ULRR: upper limit of the reference range
WBC: white blood cell
WHO: World Health Organization
WHO PS: WHO Performance Status
Characteristics of excluded studies [ordered by study ID]
| Study | Reason for exclusion |
| Recruited only EGFR‐mutation negative patients | |
| Gefitinib versus other EGFR TKI | |
| Open‐label, non‐randomised study | |
| No direct comparison arm | |
| Cross‐over study | |
| Gefitinib versus other EGFR TKI | |
| Gefitinib + chemotherapy (sequential) versus gefitinib + chemotherapy (alternating) | |
| Gefitinib versus other EGFR TKI | |
| Recruited only EGFR‐mutation negative patients |
EGFR: epidermal growth factor receptor
TKI: tyrosine kinase inhibitor
Characteristics of ongoing studies [ordered by study ID]
| Trial name or title | Docetaxel versus gefitinib in patients with locally advanced or metastatic NSCLC pretreated with platinum‐based chemotherapy |
| Methods | Randomised |
| Participants | 30 patients with locally advanced or metastatic NSCLC previously treated with cisplatin‐based chemotherapy, who had progressive or recurrent disease and ECOG performance score 0 to 2 |
| Interventions | Gefitinib 250 mg/day versus docetaxel 75 mg/m2 every 3 weeks |
| Outcomes | Tumour response Adverse events |
| Starting date | Not known |
| Contact information | Not known |
| Notes | — |
| Trial name or title | A double‐blind, randomized, placebo‐controlled phase III intergroup study of gefitinib (G) in patients (pts) with advanced NSCLC, non‐progressing after first‐line platinum‐based chemotherapy (EORTC 08021‐ILCP 01/03) |
| Methods | Randomised |
| Participants | Advanced NSCLC |
| Interventions | Gefitinib 250 mg daily versus placebo |
| Outcomes | Overall survival Progression‐free survival Toxicity |
| Starting date | Not known |
| Contact information | Not known |
| Notes | — |
| Trial name or title | Randomized phase II study of pemetrexed versus gefitinib for patients with previously treated non‐small cell lung cancer |
| Methods | Randomised |
| Participants | Patients with histologically or cytologically confirmed advanced (stage IIIB or IV) or recurrent NSCLC were eligible if they were; age > 18 years, with measurable lesion, previously treated, an Eastern Cooperative Oncology Group (ECOG) Performance Status (PS) 0 to 2, and with adequate organ function |
| Interventions | 500 mg/m2 of pemetrexed intravenously every 3 weeks with vitamin supplementation versus gefitinib 250 mg/day until disease progression, intolerable toxicity or withdrawal of consent |
| Outcomes | Tumour response PFS OS Toxicity |
| Starting date | Not known |
| Contact information | Not known |
| Notes | — |
| Trial name or title | Pilot trial of ZD1839 (Iressa‐TM‐), an oral inhibitor of epidermal growth factor receptor (EGFR) tyrosine kinase, in combination with carboplatin (C) and paclitaxel (P) in previously untreated advanced non‐small cell lung cancer |
| Methods | Not known |
| Participants | Not known |
| Interventions | Not known |
| Outcomes | Not known |
| Starting date | Not known |
| Contact information | Not known |
| Notes | — |
| Trial name or title | Randomized phase II study comparing paclitaxel/carboplatin intercalated with gefitinib to paclitaxel/carboplatin alone for chemotherapy‐naive non‐small cell lung cancer patients either with history of smoking or with wild‐type EGFR |
| Methods | Randomised |
| Participants | Chemotherapy‐naive advanced NSCLC patients with good ECOG PS of 0 or 1 |
| Interventions | PCG arm: P 175 mg/m2 and C AUC 5 intravenously on day 1 intercalated with G 250 mg orally on days 2 through 15 every 3 weeks for 4 cycles followed by G 250 mg orally until progressive disease PC arm: P 175 mg/m2 and C AUC 5 on day 1 every 3 weeks for 4 cycles only without maintenance therapy |
| Outcomes | Tumour response PFS OS Toxicity |
| Starting date | Not known |
| Contact information | Not known |
| Notes | — |
| Trial name or title | First‐line treatment (txt) with pemetrexed‐cisplatin (PC), followed sequentially by gefitinib (G) or pemetrexed, in Asian, never‐smoker (n/smkr) patients (pts) with advanced NSCLC: an open‐label, randomized phase II trial |
| Methods | Randomised |
| Participants | Advanced NSCLC Asian, chemotherapy‐naive, non‐smoker |
| Interventions | First‐line PC + TXT followed by gefitinib 250 mg daily versus placebo |
| Outcomes | Progression‐free survival Response rate Toxicities |
| Starting date | February 2007 |
| Contact information | Not known |
| Notes | — |
| Trial name or title | A randomized phase II study of sequential carboplatin/paclitaxel (CP) and gefitinib (G) in chemotherapy‐naive patients with advanced non‐small‐cell lung cancer (NSCLC): preliminary results |
| Methods | Not known |
| Participants | Not known |
| Interventions | Not known |
| Outcomes | Not known |
| Starting date | Not known |
| Contact information | Not known |
| Notes | — |
| Trial name or title | A randomized phase 2 trial of pemetrexed (P) and gefitinib (G) versus G as first‐line treatment for patients with stage IV non‐squamous (NS) non‐small cell lung cancer (NSCLC) with activating epidermal growth factor receptor (EGFR) mutations |
| Methods | Randomised |
| Participants | Stage IV NS NSCLC, an Eastern Cooperative Oncology Group performance status (ECOG PS) of 0 to 1 and an activating EGFR mutation |
| Interventions | Gefitinib versus pemetrexed |
| Outcomes | PFS Time to progressive disease OS ORR DCR Adverse events |
| Starting date | Not known |
| Contact information | Not known |
| Notes | — |
AUC: Area under curve
C: carboplatin
DCR: disease control rate
ECOG: Eastern Cooperative Oncology Group
ECOG PS: ECOG Performance Status
EGFR: epidermal growth factor receptor
G: gefitinib
NSCLC: non‐small cell lung cancer
ORR: overall response rate
OS: overall survival
P: paclitaxel
PC: pemetrexed‐cisplatin
PFS: progression‐free survival
TXT: first‐line treatment
Data and analyses
| Outcome or subgroup title | No. of studies | No. of participants | Statistical method | Effect size |
| 1 HR Overall survival Show forest plot | 4 | Hazard Ratio (Random, 95% CI) | Subtotals only | |
| Analysis 1.1  Comparison 1 Gefitinib versus placebo, Outcome 1 HR Overall survival. | ||||
| 1.1 G(250) vs P = 1st line | 1 | Hazard Ratio (Random, 95% CI) | 0.84 [0.62, 1.14] | |
| 1.2 G(250) vs P = 2nd line | 1 | Hazard Ratio (Random, 95% CI) | 0.89 [0.79, 1.01] | |
| 1.3 G(500) vs P = Maintenance | 2 | Hazard Ratio (Random, 95% CI) | 1.14 [0.61, 2.14] | |
| 2 HR Progression‐free survival Show forest plot | 4 | Hazard Ratio (Random, 95% CI) | Subtotals only | |
| Analysis 1.2 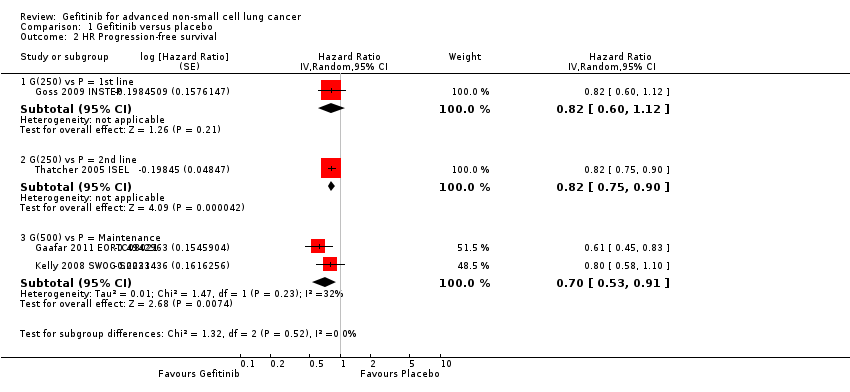 Comparison 1 Gefitinib versus placebo, Outcome 2 HR Progression‐free survival. | ||||
| 2.1 G(250) vs P = 1st line | 1 | Hazard Ratio (Random, 95% CI) | 0.82 [0.60, 1.12] | |
| 2.2 G(250) vs P = 2nd line | 1 | Hazard Ratio (Random, 95% CI) | 0.82 [0.75, 0.90] | |
| 2.3 G(500) vs P = Maintenance | 2 | Hazard Ratio (Random, 95% CI) | 0.70 [0.53, 0.91] | |
| 3 1‐year survival rate Show forest plot | 2 | Risk Ratio (M‐H, Fixed, 95% CI) | Subtotals only | |
| Analysis 1.3  Comparison 1 Gefitinib versus placebo, Outcome 3 1‐year survival rate. | ||||
| 3.1 G(250) vs P = 2nd line | 1 | 1439 | Risk Ratio (M‐H, Fixed, 95% CI) | 1.28 [1.05, 1.57] |
| 3.2 G(500) vs P = Maintenance | 1 | 243 | Risk Ratio (M‐H, Fixed, 95% CI) | 0.90 [0.78, 1.04] |
| 4 Skin rash Show forest plot | 3 | 2060 | Risk Ratio (M‐H, Fixed, 95% CI) | 7.92 [1.46, 43.03] |
| Analysis 1.4  Comparison 1 Gefitinib versus placebo, Outcome 4 Skin rash. | ||||
| 4.1 G(250) vs P = 1st line | 1 | 201 | Risk Ratio (M‐H, Fixed, 95% CI) | 0.0 [0.0, 0.0] |
| 4.2 G(250) vs P = 2nd line | 1 | 1688 | Risk Ratio (M‐H, Fixed, 95% CI) | 8.98 [1.20, 67.13] |
| 4.3 G(250) vs P = Maintenance | 1 | 171 | Risk Ratio (M‐H, Fixed, 95% CI) | 5.06 [0.25, 103.82] |
| 5 Pruritus Show forest plot | 2 | 1889 | Risk Ratio (M‐H, Fixed, 95% CI) | 2.00 [0.22, 17.82] |
| Analysis 1.5 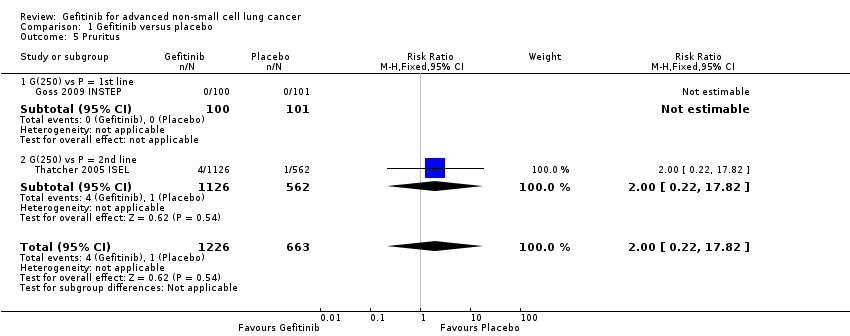 Comparison 1 Gefitinib versus placebo, Outcome 5 Pruritus. | ||||
| 5.1 G(250) vs P = 1st line | 1 | 201 | Risk Ratio (M‐H, Fixed, 95% CI) | 0.0 [0.0, 0.0] |
| 5.2 G(250) vs P = 2nd line | 1 | 1688 | Risk Ratio (M‐H, Fixed, 95% CI) | 2.00 [0.22, 17.82] |
| 6 Diarrhoea Show forest plot | 3 | 2060 | Risk Ratio (M‐H, Fixed, 95% CI) | 2.48 [1.15, 5.35] |
| Analysis 1.6  Comparison 1 Gefitinib versus placebo, Outcome 6 Diarrhoea. | ||||
| 6.1 G(250) vs P = 1st line | 1 | 201 | Risk Ratio (M‐H, Fixed, 95% CI) | 1.01 [0.21, 4.89] |
| 6.2 G(250) vs P = 2nd line | 1 | 1688 | Risk Ratio (M‐H, Fixed, 95% CI) | 3.09 [1.21, 7.91] |
| 6.3 G(250) vs P = Maintenance | 1 | 171 | Risk Ratio (M‐H, Fixed, 95% CI) | 3.03 [0.13, 73.47] |
| 7 Constipation Show forest plot | 1 | 201 | Risk Ratio (M‐H, Fixed, 95% CI) | 1.01 [0.06, 15.93] |
| Analysis 1.7  Comparison 1 Gefitinib versus placebo, Outcome 7 Constipation. | ||||
| 7.1 G(250) vs P = 1st line | 1 | 201 | Risk Ratio (M‐H, Fixed, 95% CI) | 1.01 [0.06, 15.93] |
| 8 Nausea Show forest plot | 2 | 1889 | Risk Ratio (M‐H, Random, 95% CI) | 0.65 [0.03, 12.44] |
| Analysis 1.8  Comparison 1 Gefitinib versus placebo, Outcome 8 Nausea. | ||||
| 8.1 G(250) vs P = 1st line | 1 | 201 | Risk Ratio (M‐H, Random, 95% CI) | 0.11 [0.01, 2.06] |
| 8.2 G(250) vs P = 2nd line | 1 | 1688 | Risk Ratio (M‐H, Random, 95% CI) | 2.25 [0.49, 10.36] |
| 9 Vomiting Show forest plot | 2 | 1859 | Risk Ratio (M‐H, Fixed, 95% CI) | 3.21 [0.83, 12.38] |
| Analysis 1.9 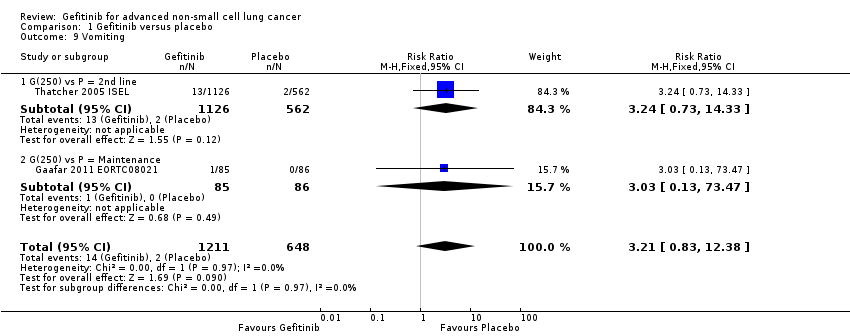 Comparison 1 Gefitinib versus placebo, Outcome 9 Vomiting. | ||||
| 9.1 G(250) vs P = 2nd line | 1 | 1688 | Risk Ratio (M‐H, Fixed, 95% CI) | 3.24 [0.73, 14.33] |
| 9.2 G(250) vs P = Maintenance | 1 | 171 | Risk Ratio (M‐H, Fixed, 95% CI) | 3.03 [0.13, 73.47] |
| 10 Anorexia Show forest plot | 3 | 2060 | Risk Ratio (M‐H, Fixed, 95% CI) | 1.22 [0.64, 2.33] |
| Analysis 1.10 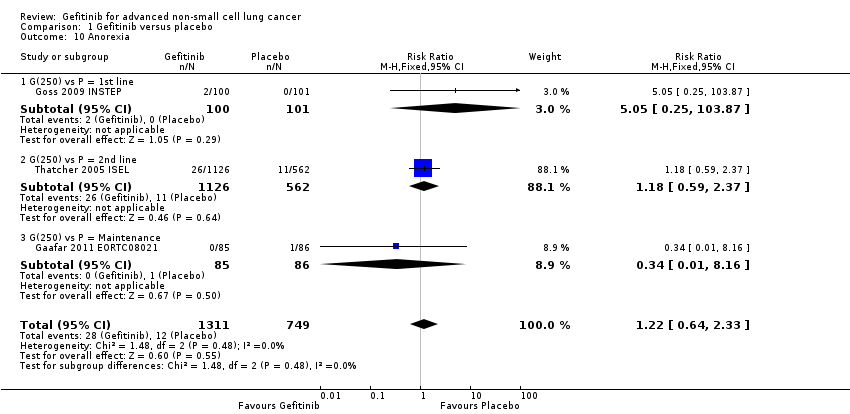 Comparison 1 Gefitinib versus placebo, Outcome 10 Anorexia. | ||||
| 10.1 G(250) vs P = 1st line | 1 | 201 | Risk Ratio (M‐H, Fixed, 95% CI) | 5.05 [0.25, 103.87] |
| 10.2 G(250) vs P = 2nd line | 1 | 1688 | Risk Ratio (M‐H, Fixed, 95% CI) | 1.18 [0.59, 2.37] |
| 10.3 G(250) vs P = Maintenance | 1 | 171 | Risk Ratio (M‐H, Fixed, 95% CI) | 0.34 [0.01, 8.16] |
| 11 Fatigue Show forest plot | 2 | Risk Ratio (M‐H, Fixed, 95% CI) | Subtotals only | |
| Analysis 1.11 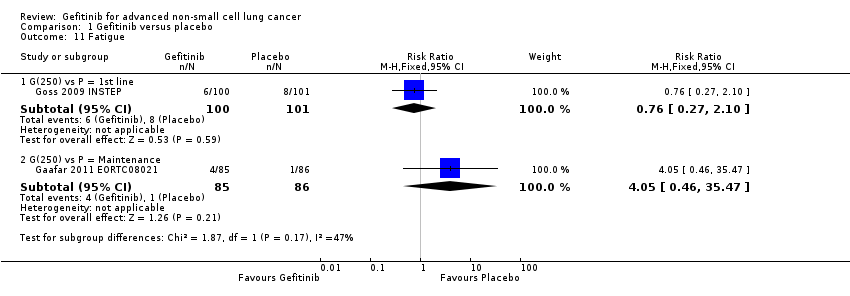 Comparison 1 Gefitinib versus placebo, Outcome 11 Fatigue. | ||||
| 11.1 G(250) vs P = 1st line | 1 | 201 | Risk Ratio (M‐H, Fixed, 95% CI) | 0.76 [0.27, 2.10] |
| 11.2 G(250) vs P = Maintenance | 1 | 171 | Risk Ratio (M‐H, Fixed, 95% CI) | 4.05 [0.46, 35.47] |
| 12 Asthenia Show forest plot | 1 | Risk Ratio (M‐H, Fixed, 95% CI) | Subtotals only | |
| Analysis 1.12  Comparison 1 Gefitinib versus placebo, Outcome 12 Asthenia. | ||||
| 12.1 G(250) vs P = 2nd line | 1 | 1688 | Risk Ratio (M‐H, Fixed, 95% CI) | 1.20 [0.66, 2.17] |
| 13 Respiratory tract infection Show forest plot | 2 | 1889 | Risk Ratio (M‐H, Random, 95% CI) | 0.53 [0.07, 3.83] |
| Analysis 1.13  Comparison 1 Gefitinib versus placebo, Outcome 13 Respiratory tract infection. | ||||
| 13.1 G(250) vs P = 1st line | 1 | 201 | Risk Ratio (M‐H, Random, 95% CI) | 0.11 [0.01, 2.06] |
| 13.2 G(250) vs P = 2nd line | 1 | 1688 | Risk Ratio (M‐H, Random, 95% CI) | 1.00 [0.54, 1.84] |
| 14 Dyspnoea Show forest plot | 3 | 2060 | Risk Ratio (M‐H, Random, 95% CI) | 0.98 [0.59, 1.63] |
| Analysis 1.14  Comparison 1 Gefitinib versus placebo, Outcome 14 Dyspnoea. | ||||
| 14.1 G(250) vs P = 1st line | 1 | 201 | Risk Ratio (M‐H, Random, 95% CI) | 1.85 [0.71, 4.81] |
| 14.2 G(250) vs P = 2nd line | 1 | 1688 | Risk Ratio (M‐H, Random, 95% CI) | 0.83 [0.49, 1.42] |
| 14.3 G(250) vs P = Maintenance | 1 | 171 | Risk Ratio (M‐H, Random, 95% CI) | 0.67 [0.20, 2.31] |
| 15 Anaemia Show forest plot | 1 | 201 | Risk Ratio (M‐H, Fixed, 95% CI) | 7.07 [0.37, 135.12] |
| Analysis 1.15  Comparison 1 Gefitinib versus placebo, Outcome 15 Anaemia. | ||||
| 15.1 G(250) vs P = 1st line | 1 | 201 | Risk Ratio (M‐H, Fixed, 95% CI) | 7.07 [0.37, 135.12] |
| 16 Abdominal pain Show forest plot | 1 | 201 | Risk Ratio (M‐H, Fixed, 95% CI) | 0.51 [0.05, 5.48] |
| Analysis 1.16  Comparison 1 Gefitinib versus placebo, Outcome 16 Abdominal pain. | ||||
| 16.1 G(250) vs P = 1st line | 1 | 201 | Risk Ratio (M‐H, Fixed, 95% CI) | 0.51 [0.05, 5.48] |
| 17 Increased ALT Show forest plot | 1 | 171 | Risk Ratio (M‐H, Fixed, 95% CI) | 9.11 [1.18, 70.32] |
| Analysis 1.17  Comparison 1 Gefitinib versus placebo, Outcome 17 Increased ALT. | ||||
| 17.1 G(250) vs P = Maintenance | 1 | 171 | Risk Ratio (M‐H, Fixed, 95% CI) | 9.11 [1.18, 70.32] |
| 18 Increased AST Show forest plot | 1 | 171 | Risk Ratio (M‐H, Fixed, 95% CI) | 7.08 [0.89, 56.34] |
| Analysis 1.18  Comparison 1 Gefitinib versus placebo, Outcome 18 Increased AST. | ||||
| 18.1 G(250) vs P = Maintenance | 1 | 171 | Risk Ratio (M‐H, Fixed, 95% CI) | 7.08 [0.89, 56.34] |
| 19 Neutropenia Show forest plot | 1 | 171 | Risk Ratio (M‐H, Fixed, 95% CI) | 3.03 [0.13, 73.47] |
| Analysis 1.19  Comparison 1 Gefitinib versus placebo, Outcome 19 Neutropenia. | ||||
| 19.1 G(250) vs P = Maintenance | 1 | 171 | Risk Ratio (M‐H, Fixed, 95% CI) | 3.03 [0.13, 73.47] |
| 20 Anaemia Show forest plot | 1 | 171 | Risk Ratio (M‐H, Fixed, 95% CI) | 0.20 [0.01, 4.15] |
| Analysis 1.20  Comparison 1 Gefitinib versus placebo, Outcome 20 Anaemia. | ||||
| 20.1 G(250) vs P = Maintenance | 1 | 171 | Risk Ratio (M‐H, Fixed, 95% CI) | 0.20 [0.01, 4.15] |
| 21 Thrombocytopaenia Show forest plot | 1 | 171 | Risk Ratio (M‐H, Fixed, 95% CI) | 3.03 [0.13, 73.47] |
| Analysis 1.21  Comparison 1 Gefitinib versus placebo, Outcome 21 Thrombocytopaenia. | ||||
| 21.1 G(250) vs P = Maintenance | 1 | 171 | Risk Ratio (M‐H, Fixed, 95% CI) | 3.03 [0.13, 73.47] |
| 22 Overall response rate Show forest plot | 3 | Risk Ratio (M‐H, Fixed, 95% CI) | Subtotals only | |
| Analysis 1.22 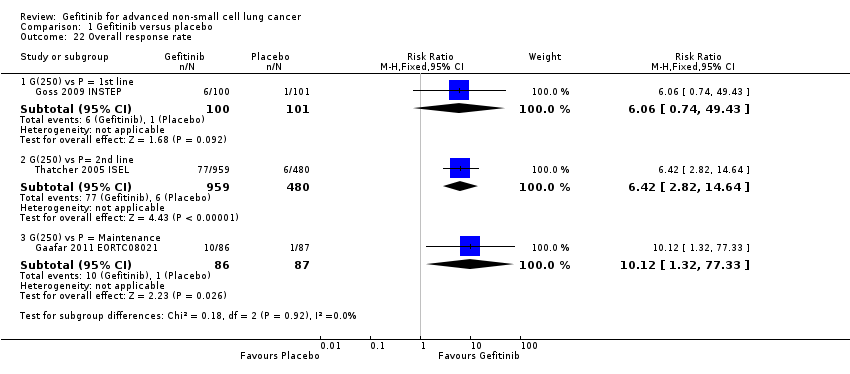 Comparison 1 Gefitinib versus placebo, Outcome 22 Overall response rate. | ||||
| 22.1 G(250) vs P = 1st line | 1 | 201 | Risk Ratio (M‐H, Fixed, 95% CI) | 6.06 [0.74, 49.43] |
| 22.2 G(250) vs P= 2nd line | 1 | 1439 | Risk Ratio (M‐H, Fixed, 95% CI) | 6.42 [2.82, 14.64] |
| 22.3 G(250) vs P = Maintenance | 1 | 173 | Risk Ratio (M‐H, Fixed, 95% CI) | 10.12 [1.32, 77.33] |
| 23 Disease control rate Show forest plot | 3 | Risk Ratio (M‐H, Fixed, 95% CI) | Subtotals only | |
| Analysis 1.23 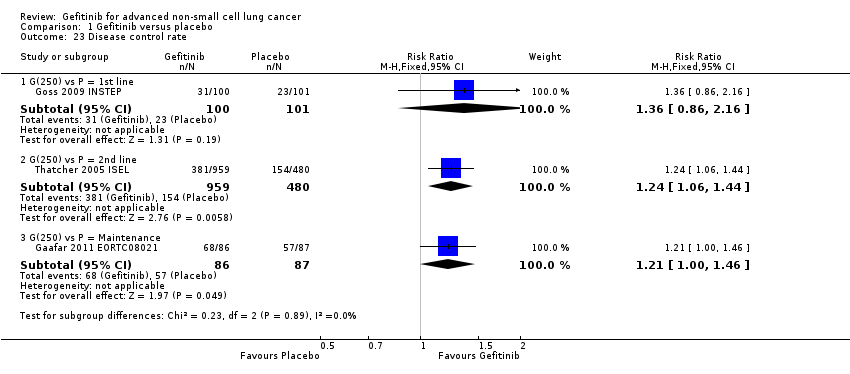 Comparison 1 Gefitinib versus placebo, Outcome 23 Disease control rate. | ||||
| 23.1 G(250) vs P = 1st line | 1 | 201 | Risk Ratio (M‐H, Fixed, 95% CI) | 1.36 [0.86, 2.16] |
| 23.2 G(250) vs P = 2nd line | 1 | 1439 | Risk Ratio (M‐H, Fixed, 95% CI) | 1.24 [1.06, 1.44] |
| 23.3 G(250) vs P = Maintenance | 1 | 173 | Risk Ratio (M‐H, Fixed, 95% CI) | 1.21 [1.00, 1.46] |
| Outcome or subgroup title | No. of studies | No. of participants | Statistical method | Effect size |
| 1 HR Overall survival Show forest plot | 2 | Hazard Ratio (Fixed, 95% CI) | Subtotals only | |
| Analysis 2.1  Comparison 2 Gefitinib versus placebo (Asian subgroup), Outcome 1 HR Overall survival. | ||||
| 1.1 G(250) vs P = 2nd line | 1 | Hazard Ratio (Fixed, 95% CI) | 0.66 [0.48, 0.91] | |
| 1.2 G(250) vs P = Maintenance | 1 | Hazard Ratio (Fixed, 95% CI) | 0.88 [0.68, 1.14] | |
| 2 HR Progression‐free survival Show forest plot | 2 | Hazard Ratio (Fixed, 95% CI) | Subtotals only | |
| Analysis 2.2  Comparison 2 Gefitinib versus placebo (Asian subgroup), Outcome 2 HR Progression‐free survival. | ||||
| 2.1 G(250) vs P = 2nd line | 1 | Hazard Ratio (Fixed, 95% CI) | 0.69 [0.52, 0.91] | |
| 2.2 G(250) vs P = Maintenance | 1 | Hazard Ratio (Fixed, 95% CI) | 0.42 [0.33, 0.54] | |
| 3 1‐year survival rate Show forest plot | 1 | Risk Ratio (M‐H, Fixed, 95% CI) | Subtotals only | |
| Analysis 2.3  Comparison 2 Gefitinib versus placebo (Asian subgroup), Outcome 3 1‐year survival rate. | ||||
| 3.1 G(250) vs P = 2nd line | 1 | 342 | Risk Ratio (M‐H, Fixed, 95% CI) | 1.75 [1.20, 2.55] |
| 4 Overall response rate Show forest plot | 2 | Risk Ratio (M‐H, Random, 95% CI) | Subtotals only | |
| Analysis 2.4  Comparison 2 Gefitinib versus placebo (Asian subgroup), Outcome 4 Overall response rate. | ||||
| 4.1 G(250) vs P = 2nd line | 1 | 306 | Risk Ratio (M‐H, Random, 95% CI) | 6.03 [1.46, 24.91] |
| 4.2 G(250) vs P = Maintenance | 1 | 296 | Risk Ratio (M‐H, Random, 95% CI) | 35.00 [4.86, 252.15] |
| Outcome or subgroup title | No. of studies | No. of participants | Statistical method | Effect size |
| 1 HR Overall survival Show forest plot | 1 | Hazard Ratio (Fixed, 95% CI) | Subtotals only | |
| Analysis 3.1  Comparison 3 Gefitinib versus placebo (biomarker subgroup), Outcome 1 HR Overall survival. | ||||
| 1.1 G(250) vs P = Maintenance | 1 | Hazard Ratio (Fixed, 95% CI) | 0.39 [0.15, 0.98] | |
| 2 HR Progression‐free survival Show forest plot | 1 | Hazard Ratio (Fixed, 95% CI) | Subtotals only | |
| Analysis 3.2 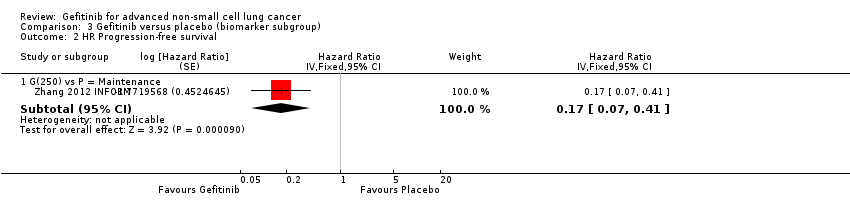 Comparison 3 Gefitinib versus placebo (biomarker subgroup), Outcome 2 HR Progression‐free survival. | ||||
| 2.1 G(250) vs P = Maintenance | 1 | Hazard Ratio (Fixed, 95% CI) | 0.17 [0.07, 0.41] | |
| Outcome or subgroup title | No. of studies | No. of participants | Statistical method | Effect size |
| 1 HR Overall survival Show forest plot | 2 | Hazard Ratio (Fixed, 95% CI) | Subtotals only | |
| Analysis 4.1 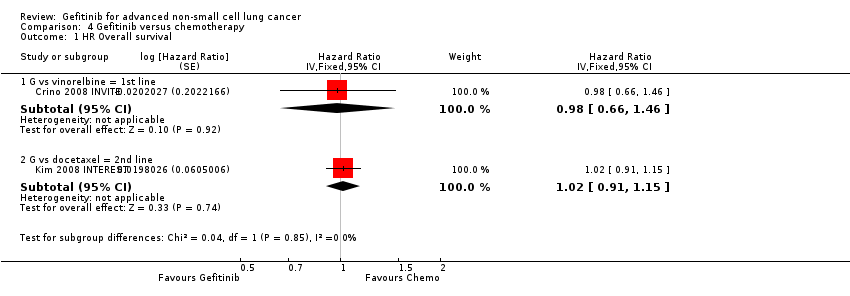 Comparison 4 Gefitinib versus chemotherapy, Outcome 1 HR Overall survival. | ||||
| 1.1 G vs vinorelbine = 1st line | 1 | Hazard Ratio (Fixed, 95% CI) | 0.98 [0.66, 1.46] | |
| 1.2 G vs docetaxel = 2nd line | 1 | Hazard Ratio (Fixed, 95% CI) | 1.02 [0.91, 1.15] | |
| 2 HR Progression‐free survival Show forest plot | 2 | Hazard Ratio (Fixed, 95% CI) | Subtotals only | |
| Analysis 4.2  Comparison 4 Gefitinib versus chemotherapy, Outcome 2 HR Progression‐free survival. | ||||
| 2.1 G vs vinorelbine = 1st line | 1 | Hazard Ratio (Fixed, 95% CI) | 1.19 [0.86, 1.65] | |
| 2.2 G vs docetaxel = 2nd line | 1 | Hazard Ratio (Fixed, 95% CI) | 1.04 [0.92, 1.17] | |
| 3 1‐year survival rate Show forest plot | 3 | 1741 | Risk Ratio (M‐H, Fixed, 95% CI) | 0.94 [0.82, 1.08] |
| Analysis 4.3  Comparison 4 Gefitinib versus chemotherapy, Outcome 3 1‐year survival rate. | ||||
| 3.1 G vs vinorelbine = 1st line | 1 | 190 | Risk Ratio (M‐H, Fixed, 95% CI) | 1.02 [0.69, 1.52] |
| 3.2 G vs docetaxel = 1st line | 1 | 85 | Risk Ratio (M‐H, Fixed, 95% CI) | 0.39 [0.08, 1.90] |
| 3.3 G vs docetaxel = 2nd line | 1 | 1466 | Risk Ratio (M‐H, Fixed, 95% CI) | 0.94 [0.82, 1.09] |
| 4 Skin rash Show forest plot | 4 | 1858 | Risk Ratio (M‐H, Fixed, 95% CI) | 2.40 [1.08, 5.31] |
| Analysis 4.4  Comparison 4 Gefitinib versus chemotherapy, Outcome 4 Skin rash. | ||||
| 4.1 G vs vinorelbine = 1st line | 1 | 190 | Risk Ratio (M‐H, Fixed, 95% CI) | 5.11 [0.25, 104.94] |
| 4.2 G vs docetaxel = 1st line | 1 | 85 | Risk Ratio (M‐H, Fixed, 95% CI) | 0.49 [0.05, 5.19] |
| 4.3 G vs docetaxel = 2nd line | 2 | 1583 | Risk Ratio (M‐H, Fixed, 95% CI) | 2.82 [1.11, 7.13] |
| 5 Constipation Show forest plot | 3 | 1719 | Risk Ratio (M‐H, Fixed, 95% CI) | 0.41 [0.17, 0.97] |
| Analysis 4.5  Comparison 4 Gefitinib versus chemotherapy, Outcome 5 Constipation. | ||||
| 5.1 G vs vinorelbine = 1st line | 1 | 190 | Risk Ratio (M‐H, Fixed, 95% CI) | 0.20 [0.01, 4.20] |
| 5.2 G vs docetaxel = 1st line | 1 | 85 | Risk Ratio (M‐H, Fixed, 95% CI) | 0.33 [0.01, 7.78] |
| 5.3 G vs docetaxel = 2nd line | 1 | 1444 | Risk Ratio (M‐H, Fixed, 95% CI) | 0.45 [0.17, 1.18] |
| 6 Fatigue Show forest plot | 2 | 275 | Risk Ratio (M‐H, Fixed, 95% CI) | 0.16 [0.03, 0.88] |
| Analysis 4.6  Comparison 4 Gefitinib versus chemotherapy, Outcome 6 Fatigue. | ||||
| 6.1 G vs vinorelbine = 1st line | 1 | 190 | Risk Ratio (M‐H, Fixed, 95% CI) | 0.07 [0.00, 1.18] |
| 6.2 G vs docetaxel = 1st line | 1 | 85 | Risk Ratio (M‐H, Fixed, 95% CI) | 0.49 [0.05, 5.19] |
| 7 Asthenia Show forest plot | 3 | 1773 | Risk Ratio (M‐H, Fixed, 95% CI) | 0.51 [0.35, 0.75] |
| Analysis 4.7  Comparison 4 Gefitinib versus chemotherapy, Outcome 7 Asthenia. | ||||
| 7.1 G vs vinorelbine = 1st line | 1 | 190 | Risk Ratio (M‐H, Fixed, 95% CI) | 0.15 [0.01, 2.79] |
| 7.2 G vs docetaxel = 2nd line | 2 | 1583 | Risk Ratio (M‐H, Fixed, 95% CI) | 0.53 [0.36, 0.78] |
| 8 Neurotoxicity Show forest plot | 2 | 1529 | Risk Ratio (M‐H, Fixed, 95% CI) | 0.07 [0.01, 0.34] |
| Analysis 4.8  Comparison 4 Gefitinib versus chemotherapy, Outcome 8 Neurotoxicity. | ||||
| 8.1 G vs docetaxel = 1st line | 1 | 85 | Risk Ratio (M‐H, Fixed, 95% CI) | 0.09 [0.01, 1.56] |
| 8.2 G vs docetaxel = 2nd line | 1 | 1444 | Risk Ratio (M‐H, Fixed, 95% CI) | 0.06 [0.01, 0.43] |
| 9 Neutropenia Show forest plot | 4 | 1857 | Risk Ratio (M‐H, Fixed, 95% CI) | 0.04 [0.02, 0.06] |
| Analysis 4.9  Comparison 4 Gefitinib versus chemotherapy, Outcome 9 Neutropenia. | ||||
| 9.1 G vs vinorelbine = 1st line | 1 | 190 | Risk Ratio (M‐H, Fixed, 95% CI) | 0.03 [0.00, 0.43] |
| 9.2 G vs docetaxel = 1st line | 1 | 85 | Risk Ratio (M‐H, Fixed, 95% CI) | 0.15 [0.04, 0.63] |
| 9.3 G vs docetaxel = 2nd line | 2 | 1582 | Risk Ratio (M‐H, Fixed, 95% CI) | 0.04 [0.02, 0.06] |
| 10 Leukopenia Show forest plot | 2 | 324 | Risk Ratio (M‐H, Fixed, 95% CI) | 0.03 [0.00, 0.22] |
| Analysis 4.10  Comparison 4 Gefitinib versus chemotherapy, Outcome 10 Leukopenia. | ||||
| 10.1 G vs vinorelbine = 1st line | 1 | 190 | Risk Ratio (M‐H, Fixed, 95% CI) | 0.07 [0.00, 1.18] |
| 10.2 G vs docetaxel = 2nd line | 1 | 134 | Risk Ratio (M‐H, Fixed, 95% CI) | 0.02 [0.00, 0.32] |
| 11 Febrile neutropenia Show forest plot | 3 | 1768 | Risk Ratio (M‐H, Fixed, 95% CI) | 0.12 [0.06, 0.23] |
| Analysis 4.11 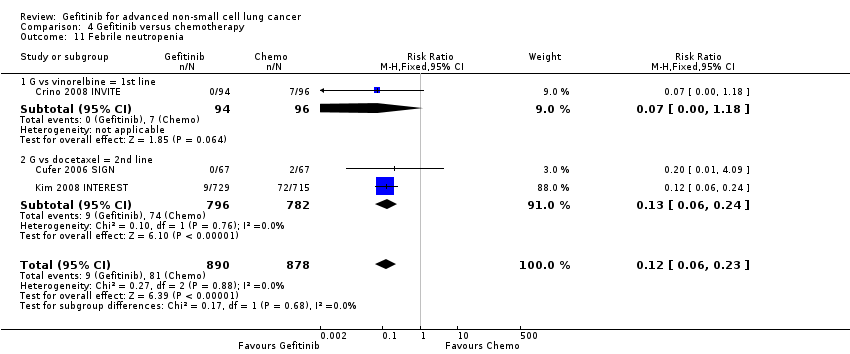 Comparison 4 Gefitinib versus chemotherapy, Outcome 11 Febrile neutropenia. | ||||
| 11.1 G vs vinorelbine = 1st line | 1 | 190 | Risk Ratio (M‐H, Fixed, 95% CI) | 0.07 [0.00, 1.18] |
| 11.2 G vs docetaxel = 2nd line | 2 | 1578 | Risk Ratio (M‐H, Fixed, 95% CI) | 0.13 [0.06, 0.24] |
| 12 Pruritus Show forest plot | 1 | 139 | Risk Ratio (M‐H, Fixed, 95% CI) | 5.22 [0.26, 106.74] |
| Analysis 4.12  Comparison 4 Gefitinib versus chemotherapy, Outcome 12 Pruritus. | ||||
| 12.1 G vs docetaxel = 2nd line | 1 | 139 | Risk Ratio (M‐H, Fixed, 95% CI) | 5.22 [0.26, 106.74] |
| 13 Diarrhoea Show forest plot | 4 | 1858 | Risk Ratio (M‐H, Fixed, 95% CI) | 0.81 [0.48, 1.34] |
| Analysis 4.13  Comparison 4 Gefitinib versus chemotherapy, Outcome 13 Diarrhoea. | ||||
| 13.1 G vs vinorelbine = 1st line | 1 | 190 | Risk Ratio (M‐H, Fixed, 95% CI) | 1.02 [0.26, 3.96] |
| 13.2 G vs docetaxel = 1st line | 1 | 85 | Risk Ratio (M‐H, Fixed, 95% CI) | 0.98 [0.14, 6.62] |
| 13.3 G vs docetaxel = 2nd line | 2 | 1583 | Risk Ratio (M‐H, Fixed, 95% CI) | 0.76 [0.43, 1.35] |
| 14 Vomiting Show forest plot | 2 | 1583 | Risk Ratio (M‐H, Fixed, 95% CI) | 0.55 [0.19, 1.63] |
| Analysis 4.14  Comparison 4 Gefitinib versus chemotherapy, Outcome 14 Vomiting. | ||||
| 14.1 G vs docetaxel = 2nd line | 2 | 1583 | Risk Ratio (M‐H, Fixed, 95% CI) | 0.55 [0.19, 1.63] |
| 15 Anorexia Show forest plot | 3 | 1719 | Risk Ratio (M‐H, Fixed, 95% CI) | 1.43 [0.61, 3.32] |
| Analysis 4.15  Comparison 4 Gefitinib versus chemotherapy, Outcome 15 Anorexia. | ||||
| 15.1 G vs vinorelbine = 1st line | 1 | 190 | Risk Ratio (M‐H, Fixed, 95% CI) | 1.02 [0.15, 7.10] |
| 15.2 G vs docetaxel = 1st line | 1 | 85 | Risk Ratio (M‐H, Fixed, 95% CI) | 0.0 [0.0, 0.0] |
| 15.3 G vs docetaxel = 2nd line | 1 | 1444 | Risk Ratio (M‐H, Fixed, 95% CI) | 1.54 [0.60, 3.95] |
| 16 Stomatitis Show forest plot | 1 | 1444 | Risk Ratio (M‐H, Fixed, 95% CI) | 0.14 [0.01, 2.71] |
| Analysis 4.16  Comparison 4 Gefitinib versus chemotherapy, Outcome 16 Stomatitis. | ||||
| 16.1 G vs docetaxel = 2nd line | 1 | 1444 | Risk Ratio (M‐H, Fixed, 95% CI) | 0.14 [0.01, 2.71] |
| 17 Arthralgia/myalgia Show forest plot | 2 | 1529 | Risk Ratio (M‐H, Fixed, 95% CI) | 0.25 [0.03, 2.19] |
| Analysis 4.17 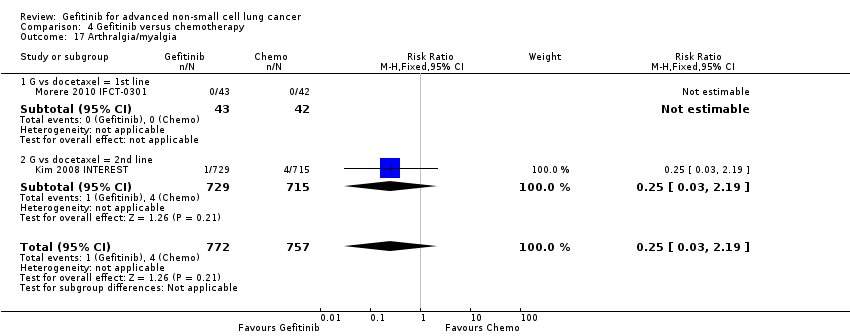 Comparison 4 Gefitinib versus chemotherapy, Outcome 17 Arthralgia/myalgia. | ||||
| 17.1 G vs docetaxel = 1st line | 1 | 85 | Risk Ratio (M‐H, Fixed, 95% CI) | 0.0 [0.0, 0.0] |
| 17.2 G vs docetaxel = 2nd line | 1 | 1444 | Risk Ratio (M‐H, Fixed, 95% CI) | 0.25 [0.03, 2.19] |
| 18 Peripheral oedema Show forest plot | 2 | 1634 | Risk Ratio (M‐H, Fixed, 95% CI) | 0.09 [0.00, 1.61] |
| Analysis 4.18  Comparison 4 Gefitinib versus chemotherapy, Outcome 18 Peripheral oedema. | ||||
| 18.1 G vs vinorelbine = 1st line | 1 | 190 | Risk Ratio (M‐H, Fixed, 95% CI) | 0.0 [0.0, 0.0] |
| 18.2 G vs docetaxel = 2nd line | 1 | 1444 | Risk Ratio (M‐H, Fixed, 95% CI) | 0.09 [0.00, 1.61] |
| 19 Respiratory tract infection Show forest plot | 1 | 1444 | Risk Ratio (M‐H, Fixed, 95% CI) | 0.90 [0.52, 1.57] |
| Analysis 4.19  Comparison 4 Gefitinib versus chemotherapy, Outcome 19 Respiratory tract infection. | ||||
| 19.1 G vs docetaxel = 2nd line | 1 | 1444 | Risk Ratio (M‐H, Fixed, 95% CI) | 0.90 [0.52, 1.57] |
| 20 Dyspnoea Show forest plot | 3 | 1773 | Risk Ratio (M‐H, Fixed, 95% CI) | 0.82 [0.57, 1.16] |
| Analysis 4.20  Comparison 4 Gefitinib versus chemotherapy, Outcome 20 Dyspnoea. | ||||
| 20.1 G vs vinorelbine = 1st line | 1 | 190 | Risk Ratio (M‐H, Fixed, 95% CI) | 0.26 [0.03, 2.24] |
| 20.2 G vs docetaxel = 2nd line | 2 | 1583 | Risk Ratio (M‐H, Fixed, 95% CI) | 0.85 [0.59, 1.22] |
| 21 Cough Show forest plot | 2 | 1583 | Risk Ratio (M‐H, Fixed, 95% CI) | 1.18 [0.36, 3.84] |
| Analysis 4.21 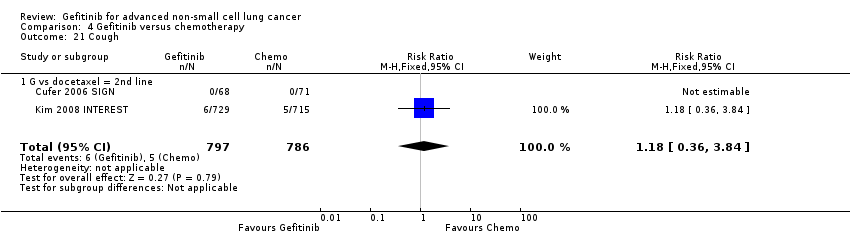 Comparison 4 Gefitinib versus chemotherapy, Outcome 21 Cough. | ||||
| 21.1 G vs docetaxel = 2nd line | 2 | 1583 | Risk Ratio (M‐H, Fixed, 95% CI) | 1.18 [0.36, 3.84] |
| 22 Anaemia Show forest plot | 4 | 1853 | Risk Ratio (M‐H, Fixed, 95% CI) | 0.70 [0.36, 1.36] |
| Analysis 4.22  Comparison 4 Gefitinib versus chemotherapy, Outcome 22 Anaemia. | ||||
| 22.1 G vs vinorelbine = 1st line | 1 | 190 | Risk Ratio (M‐H, Fixed, 95% CI) | 0.34 [0.01, 8.25] |
| 22.2 G vs docetaxel = 1st line | 1 | 85 | Risk Ratio (M‐H, Fixed, 95% CI) | 0.14 [0.01, 2.62] |
| 22.3 G vs docetaxel = 2nd line | 2 | 1578 | Risk Ratio (M‐H, Fixed, 95% CI) | 0.86 [0.42, 1.75] |
| 23 Thrombocytopenia Show forest plot | 2 | 219 | Risk Ratio (M‐H, Fixed, 95% CI) | 3.0 [0.12, 72.35] |
| Analysis 4.23  Comparison 4 Gefitinib versus chemotherapy, Outcome 23 Thrombocytopenia. | ||||
| 23.1 G vs docetaxel = 1st line | 1 | 85 | Risk Ratio (M‐H, Fixed, 95% CI) | 0.0 [0.0, 0.0] |
| 23.2 G vs docetaxel = 2nd line | 1 | 134 | Risk Ratio (M‐H, Fixed, 95% CI) | 3.0 [0.12, 72.35] |
| 24 Hypokalaemia Show forest plot | 1 | 190 | Risk Ratio (M‐H, Fixed, 95% CI) | 1.02 [0.06, 16.09] |
| Analysis 4.24  Comparison 4 Gefitinib versus chemotherapy, Outcome 24 Hypokalaemia. | ||||
| 24.1 G vs vinorelbine = 1st line | 1 | 190 | Risk Ratio (M‐H, Fixed, 95% CI) | 1.02 [0.06, 16.09] |
| 25 Pyrexia Show forest plot | 3 | 1773 | Risk Ratio (M‐H, Fixed, 95% CI) | 0.59 [0.14, 2.47] |
| Analysis 4.25  Comparison 4 Gefitinib versus chemotherapy, Outcome 25 Pyrexia. | ||||
| 25.1 G vs vinorelbine = 1st line | 1 | 190 | Risk Ratio (M‐H, Fixed, 95% CI) | 1.02 [0.06, 16.09] |
| 25.2 G vs docetaxel = 2nd line | 2 | 1583 | Risk Ratio (M‐H, Fixed, 95% CI) | 0.49 [0.09, 2.67] |
| 26 Overall response rate Show forest plot | 2 | Risk Ratio (M‐H, Fixed, 95% CI) | Subtotals only | |
| Analysis 4.26  Comparison 4 Gefitinib versus chemotherapy, Outcome 26 Overall response rate. | ||||
| 26.1 G vs docetaxel = 2nd line | 2 | 1607 | Risk Ratio (M‐H, Fixed, 95% CI) | 1.16 [0.85, 1.59] |
| 27 Disease control rate Show forest plot | 2 | Risk Ratio (M‐H, Fixed, 95% CI) | Subtotals only | |
| Analysis 4.27 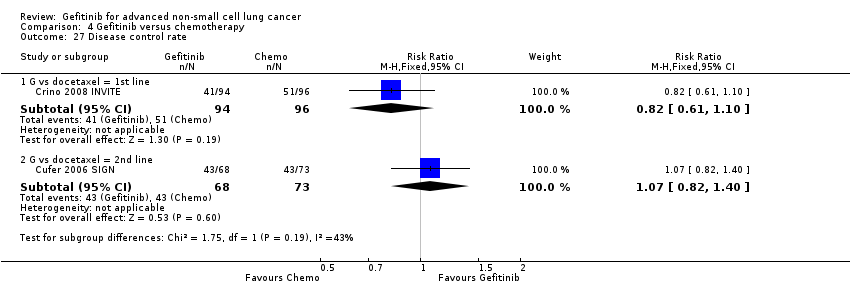 Comparison 4 Gefitinib versus chemotherapy, Outcome 27 Disease control rate. | ||||
| 27.1 G vs docetaxel = 1st line | 1 | 190 | Risk Ratio (M‐H, Fixed, 95% CI) | 0.82 [0.61, 1.10] |
| 27.2 G vs docetaxel = 2nd line | 1 | 141 | Risk Ratio (M‐H, Fixed, 95% CI) | 1.07 [0.82, 1.40] |
| 28 FACT‐L QOL improvement rate Show forest plot | 2 | 1656 | Mean Difference (IV, Fixed, 95% CI) | 10.50 [9.55, 11.45] |
| Analysis 4.28  Comparison 4 Gefitinib versus chemotherapy, Outcome 28 FACT‐L QOL improvement rate. | ||||
| 28.1 G vs vinorelbine = 1st line | 1 | 190 | Mean Difference (IV, Fixed, 95% CI) | 13.4 [8.25, 18.55] |
| 28.2 G vs docetaxel = 2nd line | 1 | 1466 | Mean Difference (IV, Fixed, 95% CI) | 10.40 [9.43, 11.37] |
| 29 LCS QOL improvement rate Show forest plot | 2 | 1656 | Mean Difference (IV, Fixed, 95% CI) | 3.63 [3.08, 4.19] |
| Analysis 4.29  Comparison 4 Gefitinib versus chemotherapy, Outcome 29 LCS QOL improvement rate. | ||||
| 29.1 G vs vinorelbine = 1st line | 1 | 190 | Mean Difference (IV, Fixed, 95% CI) | 3.80 [2.42, 5.18] |
| 29.2 G vs docetaxel = 2nd line | 1 | 1466 | Mean Difference (IV, Fixed, 95% CI) | 3.60 [2.99, 4.21] |
| 30 TOI QOL improvement rate Show forest plot | 2 | 1656 | Mean Difference (IV, Random, 95% CI) | 9.87 [1.26, 18.48] |
| Analysis 4.30 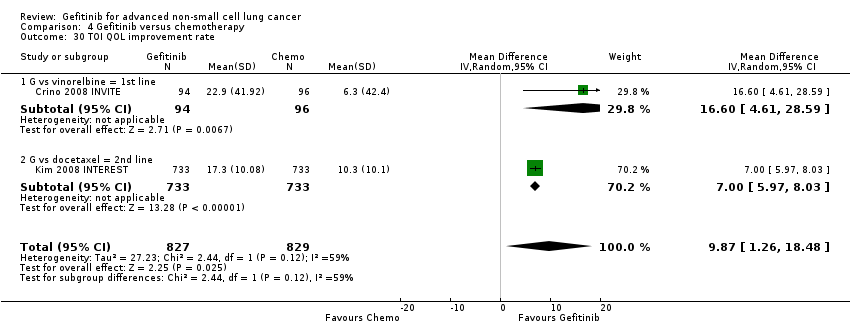 Comparison 4 Gefitinib versus chemotherapy, Outcome 30 TOI QOL improvement rate. | ||||
| 30.1 G vs vinorelbine = 1st line | 1 | 190 | Mean Difference (IV, Random, 95% CI) | 16.60 [4.61, 28.59] |
| 30.2 G vs docetaxel = 2nd line | 1 | 1466 | Mean Difference (IV, Random, 95% CI) | 7.0 [5.97, 8.03] |
| 31 PSI QOL improvement rate Show forest plot | 1 | 190 | Mean Difference (IV, Fixed, 95% CI) | 5.60 [3.55, 7.65] |
| Analysis 4.31  Comparison 4 Gefitinib versus chemotherapy, Outcome 31 PSI QOL improvement rate. | ||||
| 31.1 G vs vinorelbine = 1st line | 1 | 190 | Mean Difference (IV, Fixed, 95% CI) | 5.60 [3.55, 7.65] |
| Outcome or subgroup title | No. of studies | No. of participants | Statistical method | Effect size |
| 1 HR Overall survival = 1st line Show forest plot | 4 | Hazard Ratio (Random, 95% CI) | 0.94 [0.82, 1.06] | |
| Analysis 5.1  Comparison 5 Gefitinib versus chemotherapy (Asian subgroup), Outcome 1 HR Overall survival = 1st line. | ||||
| 1.1 G vs carboplatin + paclitaxel | 2 | Hazard Ratio (Random, 95% CI) | 1.09 [0.64, 1.84] | |
| 1.2 G vs gemcitabine + cisplatin | 1 | Hazard Ratio (Random, 95% CI) | 0.93 [0.72, 1.21] | |
| 1.3 G vs pemetrexed + cisplatin | 1 | Hazard Ratio (Random, 95% CI) | 0.94 [0.68, 1.30] | |
| 2 HR Overall survival = 2nd line Show forest plot | 3 | Hazard Ratio (Random, 95% CI) | 0.94 [0.79, 1.12] | |
| Analysis 5.2  Comparison 5 Gefitinib versus chemotherapy (Asian subgroup), Outcome 2 HR Overall survival = 2nd line. | ||||
| 2.1 G vs docetaxel | 2 | Hazard Ratio (Random, 95% CI) | 0.97 [0.80, 1.17] | |
| 2.2 G vs pemetrexed | 1 | Hazard Ratio (Random, 95% CI) | 0.80 [0.50, 1.28] | |
| 3 HR Overall survival = Maintenance Show forest plot | 1 | Hazard Ratio (Random, 95% CI) | 2.15 [0.83, 5.55] | |
| Analysis 5.3  Comparison 5 Gefitinib versus chemotherapy (Asian subgroup), Outcome 3 HR Overall survival = Maintenance. | ||||
| 3.1 G vs pemetrexed | 1 | Hazard Ratio (Random, 95% CI) | 2.15 [0.83, 5.55] | |
| 4 HR Progression‐free survival = 1st line Show forest plot | 5 | Hazard Ratio (Random, 95% CI) | 0.65 [0.43, 0.98] | |
| Analysis 5.4 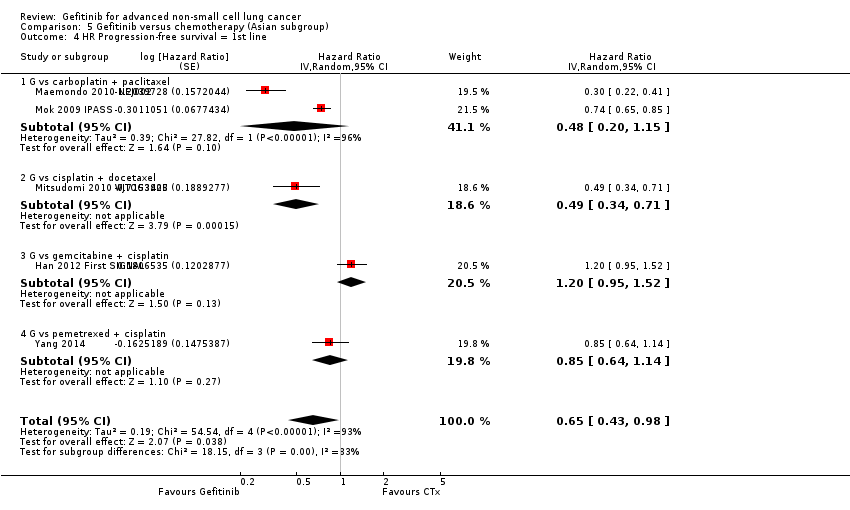 Comparison 5 Gefitinib versus chemotherapy (Asian subgroup), Outcome 4 HR Progression‐free survival = 1st line. | ||||
| 4.1 G vs carboplatin + paclitaxel | 2 | Hazard Ratio (Random, 95% CI) | 0.48 [0.20, 1.15] | |
| 4.2 G vs cisplatin + docetaxel | 1 | Hazard Ratio (Random, 95% CI) | 0.49 [0.34, 0.71] | |
| 4.3 G vs gemcitabine + cisplatin | 1 | Hazard Ratio (Random, 95% CI) | 1.20 [0.95, 1.52] | |
| 4.4 G vs pemetrexed + cisplatin | 1 | Hazard Ratio (Random, 95% CI) | 0.85 [0.64, 1.14] | |
| 5 HR Progression‐free survival = 2nd line Show forest plot | 3 | Hazard Ratio (Random, 95% CI) | 0.71 [0.57, 0.88] | |
| Analysis 5.5  Comparison 5 Gefitinib versus chemotherapy (Asian subgroup), Outcome 5 HR Progression‐free survival = 2nd line. | ||||
| 5.1 G vs docetaxel | 2 | Hazard Ratio (Random, 95% CI) | 0.78 [0.65, 0.94] | |
| 5.2 G vs pemetrexed | 1 | Hazard Ratio (Random, 95% CI) | 0.54 [0.37, 0.79] | |
| 6 HR Progression‐free survival = Maintenance Show forest plot | 1 | Hazard Ratio (Random, 95% CI) | 0.53 [0.27, 1.04] | |
| Analysis 5.6 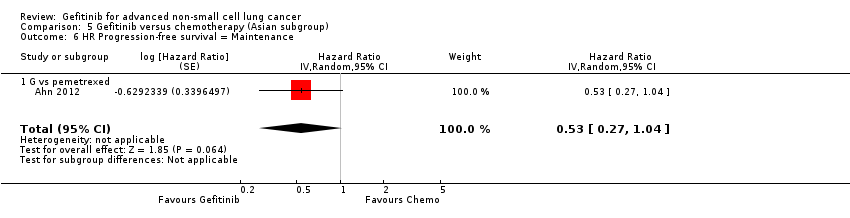 Comparison 5 Gefitinib versus chemotherapy (Asian subgroup), Outcome 6 HR Progression‐free survival = Maintenance. | ||||
| 6.1 G vs pemetrexed | 1 | Hazard Ratio (Random, 95% CI) | 0.53 [0.27, 1.04] | |
| 7 1‐year survival rate Show forest plot | 7 | Risk Ratio (M‐H, Fixed, 95% CI) | Subtotals only | |
| Analysis 5.7  Comparison 5 Gefitinib versus chemotherapy (Asian subgroup), Outcome 7 1‐year survival rate. | ||||
| 7.1 1st line | 3 | 1754 | Risk Ratio (M‐H, Fixed, 95% CI) | 1.03 [0.97, 1.09] |
| 7.2 2nd line | 3 | 681 | Risk Ratio (M‐H, Fixed, 95% CI) | 0.94 [0.81, 1.11] |
| 7.3 Maintenance | 1 | 70 | Risk Ratio (M‐H, Fixed, 95% CI) | 0.79 [0.65, 0.98] |
| 8 Nausea Show forest plot | 10 | 2898 | Risk Ratio (M‐H, Fixed, 95% CI) | 0.34 [0.17, 0.64] |
| Analysis 5.8  Comparison 5 Gefitinib versus chemotherapy (Asian subgroup), Outcome 8 Nausea. | ||||
| 8.1 1st line | 4 | 1912 | Risk Ratio (M‐H, Fixed, 95% CI) | 0.19 [0.06, 0.54] |
| 8.2 2nd line | 5 | 916 | Risk Ratio (M‐H, Fixed, 95% CI) | 0.59 [0.22, 1.60] |
| 8.3 Maintenance | 1 | 70 | Risk Ratio (M‐H, Fixed, 95% CI) | 0.53 [0.09, 2.98] |
| 9 Vomiting Show forest plot | 6 | 2447 | Risk Ratio (M‐H, Random, 95% CI) | 0.19 [0.05, 0.77] |
| Analysis 5.9  Comparison 5 Gefitinib versus chemotherapy (Asian subgroup), Outcome 9 Vomiting. | ||||
| 9.1 1st line | 3 | 1737 | Risk Ratio (M‐H, Random, 95% CI) | 0.08 [0.02, 0.29] |
| 9.2 2nd line | 2 | 640 | Risk Ratio (M‐H, Random, 95% CI) | 1.31 [0.30, 5.77] |
| 9.3 Maintenance | 1 | 70 | Risk Ratio (M‐H, Random, 95% CI) | 0.20 [0.02, 1.69] |
| 10 Anorexia Show forest plot | 10 | 2950 | Risk Ratio (M‐H, Fixed, 95% CI) | 0.36 [0.27, 0.49] |
| Analysis 5.10  Comparison 5 Gefitinib versus chemotherapy (Asian subgroup), Outcome 10 Anorexia. | ||||
| 10.1 1st line | 4 | 1964 | Risk Ratio (M‐H, Fixed, 95% CI) | 0.32 [0.23, 0.45] |
| 10.2 2nd line | 5 | 916 | Risk Ratio (M‐H, Fixed, 95% CI) | 0.53 [0.27, 1.02] |
| 10.3 Maintenance | 1 | 70 | Risk Ratio (M‐H, Fixed, 95% CI) | 0.79 [0.05, 12.20] |
| 11 Fatigue Show forest plot | 10 | 1960 | Risk Ratio (M‐H, Fixed, 95% CI) | 0.32 [0.22, 0.46] |
| Analysis 5.11 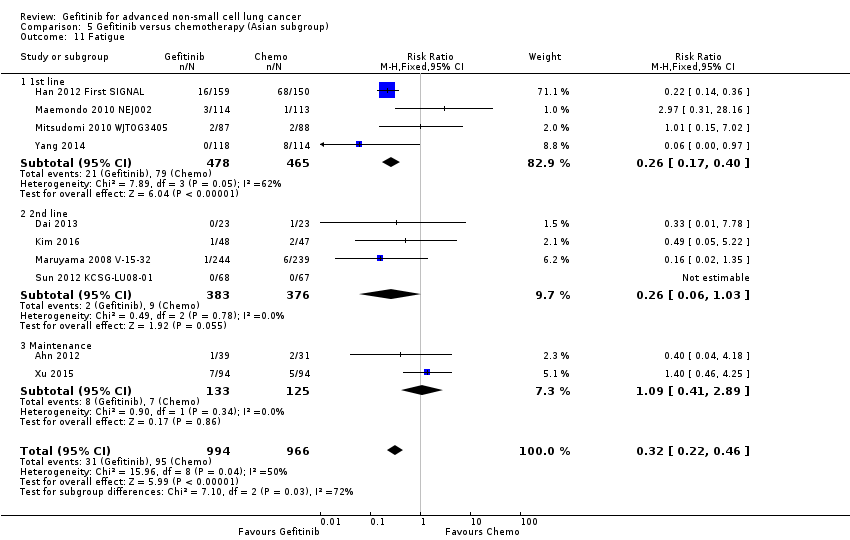 Comparison 5 Gefitinib versus chemotherapy (Asian subgroup), Outcome 11 Fatigue. | ||||
| 11.1 1st line | 4 | 943 | Risk Ratio (M‐H, Fixed, 95% CI) | 0.26 [0.17, 0.40] |
| 11.2 2nd line | 4 | 759 | Risk Ratio (M‐H, Fixed, 95% CI) | 0.26 [0.06, 1.03] |
| 11.3 Maintenance | 2 | 258 | Risk Ratio (M‐H, Fixed, 95% CI) | 1.09 [0.41, 2.89] |
| 12 Arthralgia/myalgia Show forest plot | 4 | 2063 | Risk Ratio (M‐H, Fixed, 95% CI) | 0.14 [0.03, 0.61] |
| Analysis 5.12  Comparison 5 Gefitinib versus chemotherapy (Asian subgroup), Outcome 12 Arthralgia/myalgia. | ||||
| 12.1 1st line | 2 | 1423 | Risk Ratio (M‐H, Fixed, 95% CI) | 0.14 [0.03, 0.61] |
| 12.2 2nd line | 2 | 640 | Risk Ratio (M‐H, Fixed, 95% CI) | 0.0 [0.0, 0.0] |
| 13 Asthenia Show forest plot | 4 | 1755 | Risk Ratio (M‐H, Fixed, 95% CI) | 0.22 [0.08, 0.58] |
| Analysis 5.13  Comparison 5 Gefitinib versus chemotherapy (Asian subgroup), Outcome 13 Asthenia. | ||||
| 13.1 1st line | 3 | 1598 | Risk Ratio (M‐H, Fixed, 95% CI) | 0.21 [0.07, 0.61] |
| 13.2 2nd line | 1 | 157 | Risk Ratio (M‐H, Fixed, 95% CI) | 0.31 [0.03, 2.94] |
| 14 Neurotoxicity Show forest plot | 4 | 1797 | Risk Ratio (M‐H, Fixed, 95% CI) | 0.07 [0.02, 0.24] |
| Analysis 5.14  Comparison 5 Gefitinib versus chemotherapy (Asian subgroup), Outcome 14 Neurotoxicity. | ||||
| 14.1 1st line | 2 | 1505 | Risk Ratio (M‐H, Fixed, 95% CI) | 0.07 [0.02, 0.24] |
| 14.2 2nd line | 2 | 292 | Risk Ratio (M‐H, Fixed, 95% CI) | 0.0 [0.0, 0.0] |
| 15 Neutropenia Show forest plot | 10 | 3061 | Risk Ratio (M‐H, Random, 95% CI) | 0.11 [0.05, 0.27] |
| Analysis 5.15  Comparison 5 Gefitinib versus chemotherapy (Asian subgroup), Outcome 15 Neutropenia. | ||||
| 15.1 1st line | 5 | 2139 | Risk Ratio (M‐H, Random, 95% CI) | 0.05 [0.03, 0.07] |
| 15.2 2nd line | 3 | 664 | Risk Ratio (M‐H, Random, 95% CI) | 0.12 [0.08, 0.18] |
| 15.3 Maintenance | 2 | 258 | Risk Ratio (M‐H, Random, 95% CI) | 1.20 [0.49, 2.96] |
| 16 Anaemia Show forest plot | 9 | 2538 | Risk Ratio (M‐H, Fixed, 95% CI) | 0.18 [0.12, 0.29] |
| Analysis 5.16 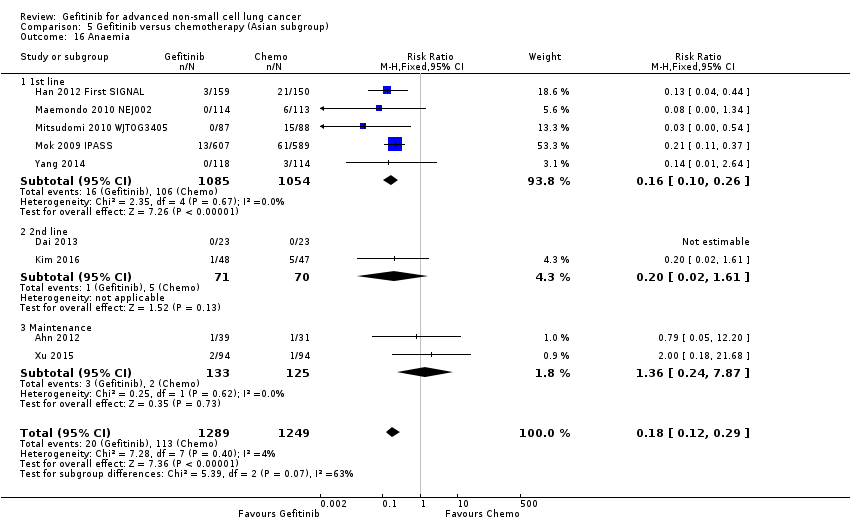 Comparison 5 Gefitinib versus chemotherapy (Asian subgroup), Outcome 16 Anaemia. | ||||
| 16.1 1st line | 5 | 2139 | Risk Ratio (M‐H, Fixed, 95% CI) | 0.16 [0.10, 0.26] |
| 16.2 2nd line | 2 | 141 | Risk Ratio (M‐H, Fixed, 95% CI) | 0.20 [0.02, 1.61] |
| 16.3 Maintenance | 2 | 258 | Risk Ratio (M‐H, Fixed, 95% CI) | 1.36 [0.24, 7.87] |
| 17 Leukopenia Show forest plot | 4 | 2086 | Risk Ratio (M‐H, Random, 95% CI) | 0.07 [0.02, 0.23] |
| Analysis 5.17  Comparison 5 Gefitinib versus chemotherapy (Asian subgroup), Outcome 17 Leukopenia. | ||||
| 17.1 1st line | 3 | 1603 | Risk Ratio (M‐H, Random, 95% CI) | 0.04 [0.02, 0.08] |
| 17.2 2nd line | 1 | 483 | Risk Ratio (M‐H, Random, 95% CI) | 0.16 [0.09, 0.26] |
| 18 Thrombocytopenia Show forest plot | 7 | 1070 | Risk Ratio (M‐H, Fixed, 95% CI) | 0.32 [0.14, 0.72] |
| Analysis 5.18 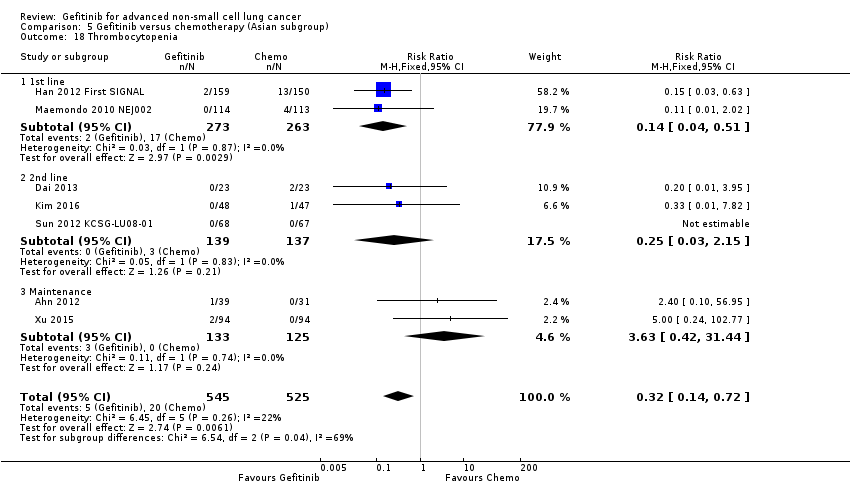 Comparison 5 Gefitinib versus chemotherapy (Asian subgroup), Outcome 18 Thrombocytopenia. | ||||
| 18.1 1st line | 2 | 536 | Risk Ratio (M‐H, Fixed, 95% CI) | 0.14 [0.04, 0.51] |
| 18.2 2nd line | 3 | 276 | Risk Ratio (M‐H, Fixed, 95% CI) | 0.25 [0.03, 2.15] |
| 18.3 Maintenance | 2 | 258 | Risk Ratio (M‐H, Fixed, 95% CI) | 3.63 [0.42, 31.44] |
| 19 Febrile neutropenia Show forest plot | 2 | 1679 | Risk Ratio (M‐H, Fixed, 95% CI) | 0.09 [0.03, 0.28] |
| Analysis 5.19  Comparison 5 Gefitinib versus chemotherapy (Asian subgroup), Outcome 19 Febrile neutropenia. | ||||
| 19.1 1st line | 1 | 1196 | Risk Ratio (M‐H, Fixed, 95% CI) | 0.06 [0.01, 0.43] |
| 19.2 2nd line | 1 | 483 | Risk Ratio (M‐H, Fixed, 95% CI) | 0.12 [0.03, 0.49] |
| 20 Skin rash Show forest plot | 10 | 3174 | Risk Ratio (M‐H, Random, 95% CI) | 3.11 [1.28, 7.55] |
| Analysis 5.20  Comparison 5 Gefitinib versus chemotherapy (Asian subgroup), Outcome 20 Skin rash. | ||||
| 20.1 1st line | 5 | 2141 | Risk Ratio (M‐H, Random, 95% CI) | 5.09 [2.21, 11.72] |
| 20.2 2nd line | 3 | 775 | Risk Ratio (M‐H, Random, 95% CI) | 2.54 [0.46, 13.95] |
| 20.3 Maintenance | 2 | 258 | Risk Ratio (M‐H, Random, 95% CI) | 0.91 [0.24, 3.44] |
| 21 Diarrhoea Show forest plot | 10 | 3055 | Risk Ratio (M‐H, Fixed, 95% CI) | 2.79 [1.57, 4.94] |
| Analysis 5.21  Comparison 5 Gefitinib versus chemotherapy (Asian subgroup), Outcome 21 Diarrhoea. | ||||
| 21.1 1st line | 5 | 2139 | Risk Ratio (M‐H, Fixed, 95% CI) | 2.74 [1.43, 5.27] |
| 21.2 2nd line | 5 | 916 | Risk Ratio (M‐H, Fixed, 95% CI) | 2.93 [0.88, 9.73] |
| 22 Increased ALT Show forest plot | 7 | 1542 | Risk Ratio (M‐H, Fixed, 95% CI) | 10.03 [5.23, 19.26] |
| Analysis 5.22 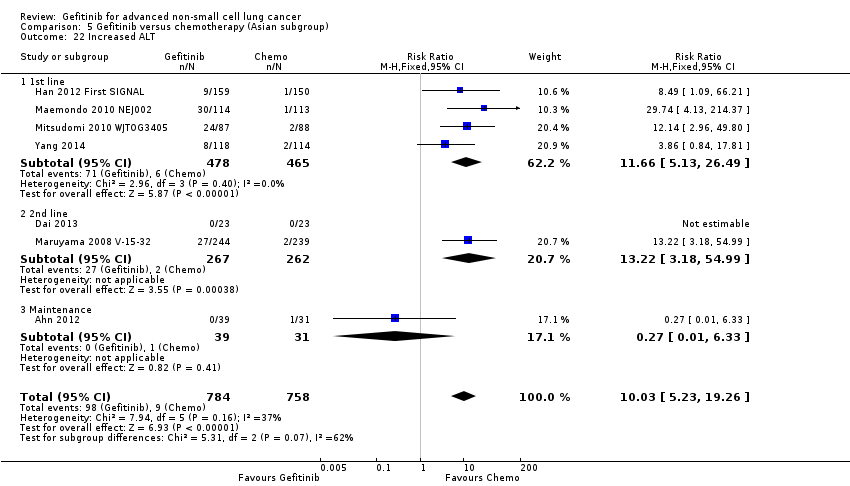 Comparison 5 Gefitinib versus chemotherapy (Asian subgroup), Outcome 22 Increased ALT. | ||||
| 22.1 1st line | 4 | 943 | Risk Ratio (M‐H, Fixed, 95% CI) | 11.66 [5.13, 26.49] |
| 22.2 2nd line | 2 | 529 | Risk Ratio (M‐H, Fixed, 95% CI) | 13.22 [3.18, 54.99] |
| 22.3 Maintenance | 1 | 70 | Risk Ratio (M‐H, Fixed, 95% CI) | 0.27 [0.01, 6.33] |
| 23 Increased AST Show forest plot | 4 | 762 | Risk Ratio (M‐H, Fixed, 95% CI) | 7.73 [2.78, 21.46] |
| Analysis 5.23  Comparison 5 Gefitinib versus chemotherapy (Asian subgroup), Outcome 23 Increased AST. | ||||
| 23.1 1st line | 3 | 716 | Risk Ratio (M‐H, Fixed, 95% CI) | 7.73 [2.78, 21.46] |
| 23.2 2nd line | 1 | 46 | Risk Ratio (M‐H, Fixed, 95% CI) | 0.0 [0.0, 0.0] |
| 24 Overall response rate Show forest plot | 14 | Risk Ratio (M‐H, Random, 95% CI) | Subtotals only | |
| Analysis 5.24 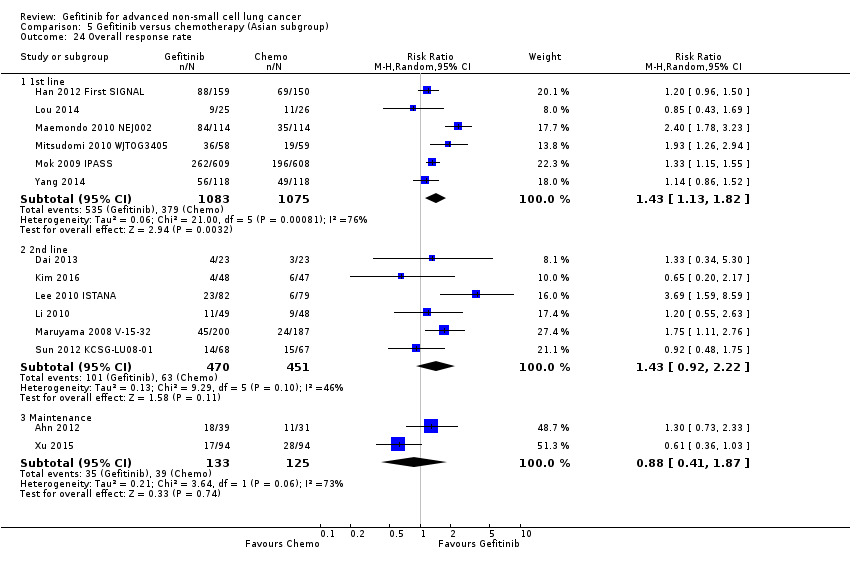 Comparison 5 Gefitinib versus chemotherapy (Asian subgroup), Outcome 24 Overall response rate. | ||||
| 24.1 1st line | 6 | 2158 | Risk Ratio (M‐H, Random, 95% CI) | 1.43 [1.13, 1.82] |
| 24.2 2nd line | 6 | 921 | Risk Ratio (M‐H, Random, 95% CI) | 1.43 [0.92, 2.22] |
| 24.3 Maintenance | 2 | 258 | Risk Ratio (M‐H, Random, 95% CI) | 0.88 [0.41, 1.87] |
| 25 Stable disease Show forest plot | 9 | Risk Ratio (M‐H, Random, 95% CI) | Subtotals only | |
| Analysis 5.25  Comparison 5 Gefitinib versus chemotherapy (Asian subgroup), Outcome 25 Stable disease. | ||||
| 25.1 1st line | 5 | 941 | Risk Ratio (M‐H, Random, 95% CI) | 0.47 [0.34, 0.64] |
| 25.2 2nd line | 2 | 143 | Risk Ratio (M‐H, Random, 95% CI) | 1.08 [0.64, 1.82] |
| 25.3 Maintenance | 2 | 258 | Risk Ratio (M‐H, Random, 95% CI) | 0.64 [0.44, 0.93] |
| 26 Disease control rate Show forest plot | 9 | Risk Ratio (M‐H, Random, 95% CI) | Subtotals only | |
| Analysis 5.26  Comparison 5 Gefitinib versus chemotherapy (Asian subgroup), Outcome 26 Disease control rate. | ||||
| 26.1 1st line | 5 | 1848 | Risk Ratio (M‐H, Random, 95% CI) | 0.99 [0.86, 1.13] |
| 26.2 2nd line | 3 | 528 | Risk Ratio (M‐H, Random, 95% CI) | 0.99 [0.78, 1.25] |
| 26.3 Maintenance | 1 | 188 | Risk Ratio (M‐H, Random, 95% CI) | 0.65 [0.49, 0.85] |
| 27 FACT‐L QOL improvement rate Show forest plot | 3 | 1670 | Mean Difference (IV, Fixed, 95% CI) | 9.50 [7.95, 11.05] |
| Analysis 5.27 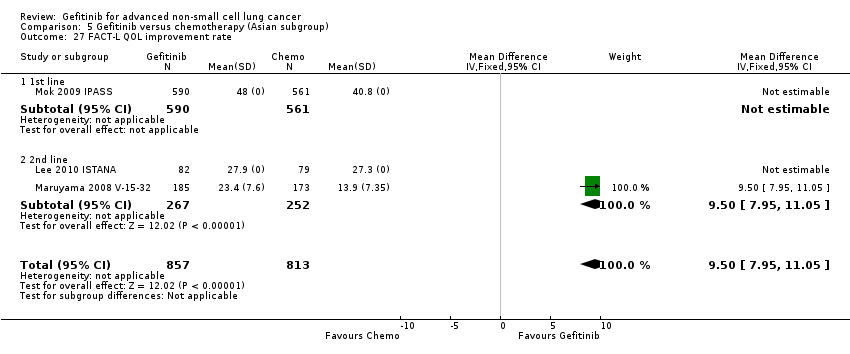 Comparison 5 Gefitinib versus chemotherapy (Asian subgroup), Outcome 27 FACT‐L QOL improvement rate. | ||||
| 27.1 1st line | 1 | 1151 | Mean Difference (IV, Fixed, 95% CI) | 0.0 [0.0, 0.0] |
| 27.2 2nd line | 2 | 519 | Mean Difference (IV, Fixed, 95% CI) | 9.50 [7.95, 11.05] |
| 28 LCS QOL improvement rate Show forest plot | 3 | 1748 | Mean Difference (IV, Fixed, 95% CI) | 2.30 [1.53, 3.07] |
| Analysis 5.28  Comparison 5 Gefitinib versus chemotherapy (Asian subgroup), Outcome 28 LCS QOL improvement rate. | ||||
| 28.1 1st line | 1 | 1151 | Mean Difference (IV, Fixed, 95% CI) | 0.0 [0.0, 0.0] |
| 28.2 2nd line | 2 | 597 | Mean Difference (IV, Fixed, 95% CI) | 2.30 [1.53, 3.07] |
| 29 TOI QOL improvement rate Show forest plot | 3 | 1670 | Mean Difference (IV, Fixed, 95% CI) | 11.8 [9.17, 14.43] |
| Analysis 5.29  Comparison 5 Gefitinib versus chemotherapy (Asian subgroup), Outcome 29 TOI QOL improvement rate. | ||||
| 29.1 1st line | 1 | 1151 | Mean Difference (IV, Fixed, 95% CI) | 0.0 [0.0, 0.0] |
| 29.2 2nd line | 2 | 519 | Mean Difference (IV, Fixed, 95% CI) | 11.8 [9.17, 14.43] |
| Outcome or subgroup title | No. of studies | No. of participants | Statistical method | Effect size |
| 1 HR Overall survival = 1st line Show forest plot | 5 | Hazard Ratio (Fixed, 95% CI) | 0.97 [0.77, 1.21] | |
| Analysis 6.1  Comparison 6 Gefitinib versus chemotherapy (EGFR mutation), Outcome 1 HR Overall survival = 1st line. | ||||
| 1.1 Biomarker driven selection | 2 | Hazard Ratio (Fixed, 95% CI) | 0.98 [0.72, 1.33] | |
| 1.2 Clinical feature driven selection | 3 | Hazard Ratio (Fixed, 95% CI) | 0.95 [0.68, 1.33] | |
| 2 HR Overall survival = 2nd line Show forest plot | 1 | Hazard Ratio (Fixed, 95% CI) | 0.83 [0.41, 1.66] | |
| Analysis 6.2  Comparison 6 Gefitinib versus chemotherapy (EGFR mutation), Outcome 2 HR Overall survival = 2nd line. | ||||
| 2.1 G vs docetaxel | 1 | Hazard Ratio (Fixed, 95% CI) | 0.83 [0.41, 1.66] | |
| 3 HR Progression‐free survival = 1st line Show forest plot | 5 | Hazard Ratio (Random, 95% CI) | 0.47 [0.36, 0.61] | |
| Analysis 6.3  Comparison 6 Gefitinib versus chemotherapy (EGFR mutation), Outcome 3 HR Progression‐free survival = 1st line. | ||||
| 3.1 Biomarker driven selection | 2 | Hazard Ratio (Random, 95% CI) | 0.39 [0.26, 0.59] | |
| 3.2 Clinical feature driven selection | 3 | Hazard Ratio (Random, 95% CI) | 0.53 [0.41, 0.70] | |
| 4 HR Progression‐free survival = 2nd line Show forest plot | 2 | Hazard Ratio (Fixed, 95% CI) | 0.24 [0.12, 0.47] | |
| Analysis 6.4  Comparison 6 Gefitinib versus chemotherapy (EGFR mutation), Outcome 4 HR Progression‐free survival = 2nd line. | ||||
| 4.1 G vs docetaxel | 1 | Hazard Ratio (Fixed, 95% CI) | 0.16 [0.05, 0.50] | |
| 4.2 G vs pemetrexed | 1 | Hazard Ratio (Fixed, 95% CI) | 0.30 [0.13, 0.70] | |
| 5 Overall response rate Show forest plot | 7 | 758 | Risk Ratio (M‐H, Random, 95% CI) | 1.71 [1.34, 2.19] |
| Analysis 6.5 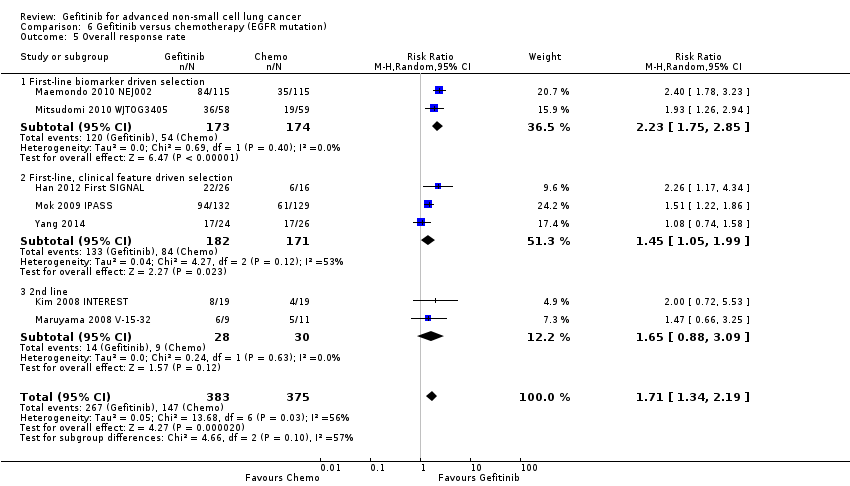 Comparison 6 Gefitinib versus chemotherapy (EGFR mutation), Outcome 5 Overall response rate. | ||||
| 5.1 First‐line biomarker driven selection | 2 | 347 | Risk Ratio (M‐H, Random, 95% CI) | 2.23 [1.75, 2.85] |
| 5.2 First‐line, clinical feature driven selection | 3 | 353 | Risk Ratio (M‐H, Random, 95% CI) | 1.45 [1.05, 1.99] |
| 5.3 2nd line | 2 | 58 | Risk Ratio (M‐H, Random, 95% CI) | 1.65 [0.88, 3.09] |
| 6 Stable disease Show forest plot | 3 | 397 | Risk Ratio (M‐H, Random, 95% CI) | 0.52 [0.28, 0.97] |
| Analysis 6.6  Comparison 6 Gefitinib versus chemotherapy (EGFR mutation), Outcome 6 Stable disease. | ||||
| 6.1 First‐line, biomarker driven selection | 2 | 347 | Risk Ratio (M‐H, Random, 95% CI) | 0.47 [0.22, 0.98] |
| 6.2 First‐line, clinical feature driven selection | 1 | 50 | Risk Ratio (M‐H, Random, 95% CI) | 0.87 [0.26, 2.85] |
| 7 Disease control rate Show forest plot | 5 | 2001 | Risk Ratio (M‐H, Random, 95% CI) | 1.05 [0.93, 1.19] |
| Analysis 6.7  Comparison 6 Gefitinib versus chemotherapy (EGFR mutation), Outcome 7 Disease control rate. | ||||
| 7.1 First‐line, biomarker driven selection | 2 | 347 | Risk Ratio (M‐H, Random, 95% CI) | 1.15 [1.05, 1.26] |
| 7.2 First‐line, clinical feature driven selection | 2 | 1267 | Risk Ratio (M‐H, Random, 95% CI) | 0.93 [0.87, 0.99] |
| 7.3 Second‐line | 1 | 387 | Risk Ratio (M‐H, Random, 95% CI) | 1.03 [0.77, 1.36] |
| Outcome or subgroup title | No. of studies | No. of participants | Statistical method | Effect size |
| 1 1‐year survival rate Show forest plot | 2 | 424 | Risk Ratio (M‐H, Fixed, 95% CI) | 0.83 [0.61, 1.11] |
| Analysis 7.1 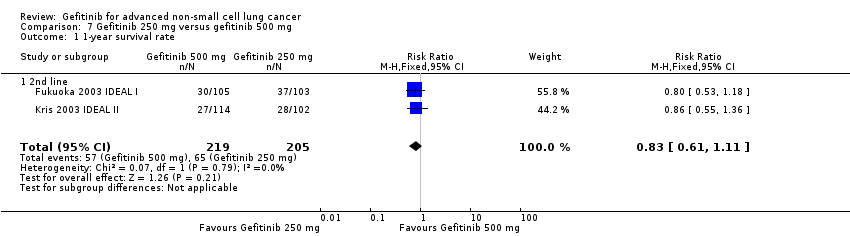 Comparison 7 Gefitinib 250 mg versus gefitinib 500 mg, Outcome 1 1‐year survival rate. | ||||
| 1.1 2nd line | 2 | 424 | Risk Ratio (M‐H, Fixed, 95% CI) | 0.83 [0.61, 1.11] |
| 2 Skin rash Show forest plot | 2 | 290 | Risk Ratio (M‐H, Fixed, 95% CI) | 8.13 [1.51, 43.72] |
| Analysis 7.2  Comparison 7 Gefitinib 250 mg versus gefitinib 500 mg, Outcome 2 Skin rash. | ||||
| 2.1 2nd line | 1 | 209 | Risk Ratio (M‐H, Fixed, 95% CI) | 6.80 [0.85, 54.32] |
| 2.2 Maintenance | 1 | 81 | Risk Ratio (M‐H, Fixed, 95% CI) | 10.41 [0.61, 176.21] |
| 3 Acne Show forest plot | 1 | 209 | Risk Ratio (M‐H, Fixed, 95% CI) | 4.86 [0.24, 100.02] |
| Analysis 7.3  Comparison 7 Gefitinib 250 mg versus gefitinib 500 mg, Outcome 3 Acne. | ||||
| 3.1 2nd line | 1 | 209 | Risk Ratio (M‐H, Fixed, 95% CI) | 4.86 [0.24, 100.02] |
| 4 Pruritus Show forest plot | 1 | 209 | Risk Ratio (M‐H, Fixed, 95% CI) | 2.92 [0.12, 70.77] |
| Analysis 7.4  Comparison 7 Gefitinib 250 mg versus gefitinib 500 mg, Outcome 4 Pruritus. | ||||
| 4.1 2nd line | 1 | 209 | Risk Ratio (M‐H, Fixed, 95% CI) | 2.92 [0.12, 70.77] |
| 5 Diarrhoea Show forest plot | 3 | 521 | Risk Ratio (M‐H, Fixed, 95% CI) | 8.36 [1.58, 44.34] |
| Analysis 7.5  Comparison 7 Gefitinib 250 mg versus gefitinib 500 mg, Outcome 5 Diarrhoea. | ||||
| 5.1 2nd line | 3 | 521 | Risk Ratio (M‐H, Fixed, 95% CI) | 8.36 [1.58, 44.34] |
| 6 Nausea Show forest plot | 1 | 209 | Risk Ratio (M‐H, Fixed, 95% CI) | 0.97 [0.06, 15.33] |
| Analysis 7.6 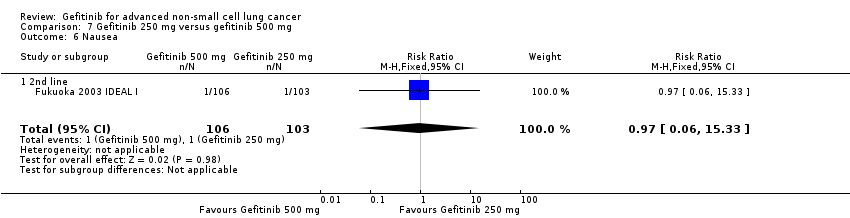 Comparison 7 Gefitinib 250 mg versus gefitinib 500 mg, Outcome 6 Nausea. | ||||
| 6.1 2nd line | 1 | 209 | Risk Ratio (M‐H, Fixed, 95% CI) | 0.97 [0.06, 15.33] |
| 7 Vomiting Show forest plot | 1 | 209 | Risk Ratio (M‐H, Fixed, 95% CI) | 0.0 [0.0, 0.0] |
| Analysis 7.7  Comparison 7 Gefitinib 250 mg versus gefitinib 500 mg, Outcome 7 Vomiting. | ||||
| 7.1 2nd line | 1 | 209 | Risk Ratio (M‐H, Fixed, 95% CI) | 0.0 [0.0, 0.0] |
| 8 Anorexia Show forest plot | 1 | 209 | Risk Ratio (M‐H, Fixed, 95% CI) | 2.92 [0.12, 70.77] |
| Analysis 7.8 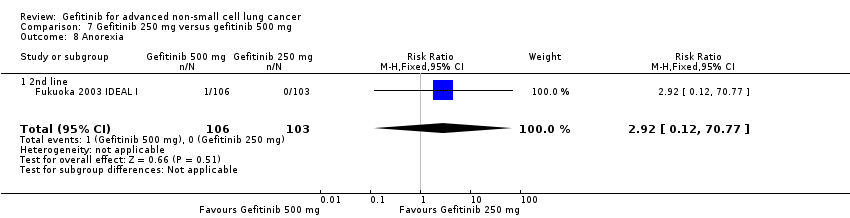 Comparison 7 Gefitinib 250 mg versus gefitinib 500 mg, Outcome 8 Anorexia. | ||||
| 8.1 2nd line | 1 | 209 | Risk Ratio (M‐H, Fixed, 95% CI) | 2.92 [0.12, 70.77] |
| 9 Asthenia Show forest plot | 1 | 209 | Risk Ratio (M‐H, Fixed, 95% CI) | 2.92 [0.12, 70.77] |
| Analysis 7.9  Comparison 7 Gefitinib 250 mg versus gefitinib 500 mg, Outcome 9 Asthenia. | ||||
| 9.1 2nd line | 1 | 209 | Risk Ratio (M‐H, Fixed, 95% CI) | 2.92 [0.12, 70.77] |
| 10 Overall response rate Show forest plot | 3 | Risk Ratio (M‐H, Fixed, 95% CI) | Subtotals only | |
| Analysis 7.10  Comparison 7 Gefitinib 250 mg versus gefitinib 500 mg, Outcome 10 Overall response rate. | ||||
| 10.1 2nd line | 2 | 424 | Risk Ratio (M‐H, Fixed, 95% CI) | 0.92 [0.58, 1.46] |
| 10.2 Maintenance | 1 | 96 | Risk Ratio (M‐H, Fixed, 95% CI) | 1.0 [0.35, 2.88] |
| 11 Partial response Show forest plot | 1 | 216 | Risk Ratio (M‐H, Fixed, 95% CI) | 0.75 [0.34, 1.65] |
| Analysis 7.11  Comparison 7 Gefitinib 250 mg versus gefitinib 500 mg, Outcome 11 Partial response. | ||||
| 11.1 2nd line | 1 | 216 | Risk Ratio (M‐H, Fixed, 95% CI) | 0.75 [0.34, 1.65] |
| 12 FACT‐L Symptom improvement rate Show forest plot | 2 | 356 | Mean Difference (IV, Fixed, 95% CI) | 3.70 [‐7.28, 14.69] |
| Analysis 7.12  Comparison 7 Gefitinib 250 mg versus gefitinib 500 mg, Outcome 12 FACT‐L Symptom improvement rate. | ||||
| 12.1 2nd line | 2 | 356 | Mean Difference (IV, Fixed, 95% CI) | 3.70 [‐7.28, 14.69] |
| 13 TOI QOL improvement rate Show forest plot | 2 | 424 | Mean Difference (IV, Fixed, 95% CI) | 7.38 [‐2.30, 17.05] |
| Analysis 7.13  Comparison 7 Gefitinib 250 mg versus gefitinib 500 mg, Outcome 13 TOI QOL improvement rate. | ||||
| 13.1 2nd line | 2 | 424 | Mean Difference (IV, Fixed, 95% CI) | 7.38 [‐2.30, 17.05] |
| Outcome or subgroup title | No. of studies | No. of participants | Statistical method | Effect size |
| 1 HR Progression‐free survival Show forest plot | 2 | Hazard Ratio (Random, 95% CI) | Subtotals only | |
| Analysis 8.1 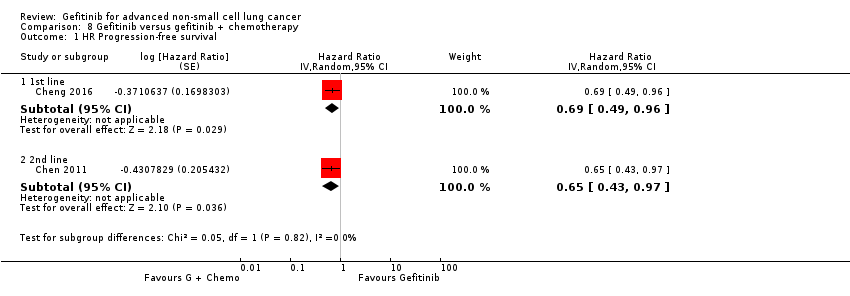 Comparison 8 Gefitinib versus gefitinib + chemotherapy, Outcome 1 HR Progression‐free survival. | ||||
| 1.1 1st line | 1 | Hazard Ratio (Random, 95% CI) | 0.69 [0.49, 0.96] | |
| 1.2 2nd line | 1 | Hazard Ratio (Random, 95% CI) | 0.65 [0.43, 0.97] | |
| 2 1‐year survival rate Show forest plot | 2 | 163 | Risk Ratio (M‐H, Fixed, 95% CI) | 1.15 [0.92, 1.43] |
| Analysis 8.2 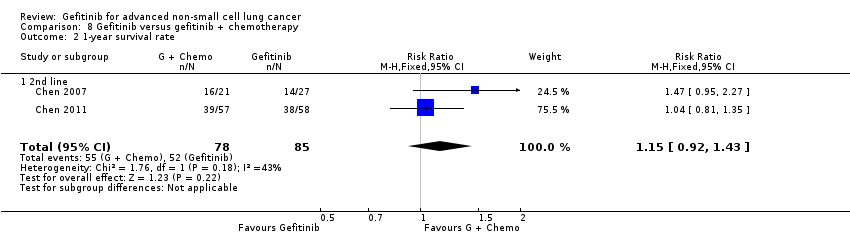 Comparison 8 Gefitinib versus gefitinib + chemotherapy, Outcome 2 1‐year survival rate. | ||||
| 2.1 2nd line | 2 | 163 | Risk Ratio (M‐H, Fixed, 95% CI) | 1.15 [0.92, 1.43] |
| 3 1‐year progression‐free survival Show forest plot | 2 | 163 | Risk Ratio (M‐H, Fixed, 95% CI) | 2.29 [1.38, 3.80] |
| Analysis 8.3  Comparison 8 Gefitinib versus gefitinib + chemotherapy, Outcome 3 1‐year progression‐free survival. | ||||
| 3.1 2nd line | 2 | 163 | Risk Ratio (M‐H, Fixed, 95% CI) | 2.29 [1.38, 3.80] |
| 4 Skin rash Show forest plot | 3 | 329 | Risk Ratio (M‐H, Fixed, 95% CI) | 1.34 [0.39, 4.57] |
| Analysis 8.4  Comparison 8 Gefitinib versus gefitinib + chemotherapy, Outcome 4 Skin rash. | ||||
| 4.1 1st line | 2 | 281 | Risk Ratio (M‐H, Fixed, 95% CI) | 1.01 [0.23, 4.51] |
| 4.2 2nd line | 1 | 48 | Risk Ratio (M‐H, Fixed, 95% CI) | 2.57 [0.25, 26.47] |
| 5 Diarrhoea Show forest plot | 3 | 329 | Risk Ratio (M‐H, Fixed, 95% CI) | 1.16 [0.21, 6.34] |
| Analysis 8.5  Comparison 8 Gefitinib versus gefitinib + chemotherapy, Outcome 5 Diarrhoea. | ||||
| 5.1 1st line | 2 | 281 | Risk Ratio (M‐H, Fixed, 95% CI) | 1.16 [0.21, 6.34] |
| 5.2 2nd line | 1 | 48 | Risk Ratio (M‐H, Fixed, 95% CI) | 0.0 [0.0, 0.0] |
| 6 Constipation Show forest plot | 1 | 48 | Risk Ratio (M‐H, Fixed, 95% CI) | 0.42 [0.02, 9.92] |
| Analysis 8.6  Comparison 8 Gefitinib versus gefitinib + chemotherapy, Outcome 6 Constipation. | ||||
| 6.1 2nd line | 1 | 48 | Risk Ratio (M‐H, Fixed, 95% CI) | 0.42 [0.02, 9.92] |
| 7 Fatigue Show forest plot | 3 | 329 | Risk Ratio (M‐H, Fixed, 95% CI) | 2.68 [0.60, 11.90] |
| Analysis 8.7 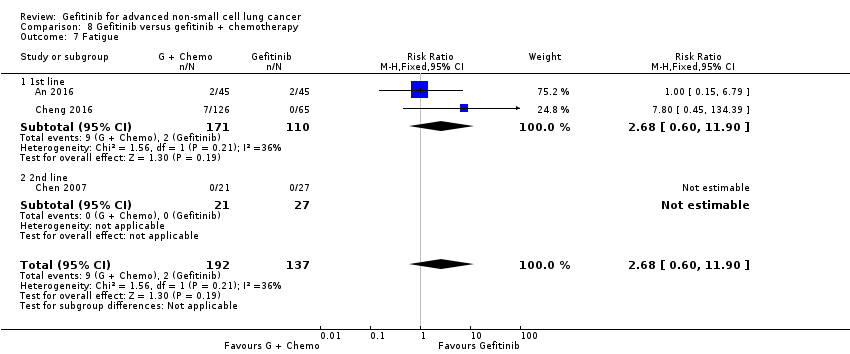 Comparison 8 Gefitinib versus gefitinib + chemotherapy, Outcome 7 Fatigue. | ||||
| 7.1 1st line | 2 | 281 | Risk Ratio (M‐H, Fixed, 95% CI) | 2.68 [0.60, 11.90] |
| 7.2 2nd line | 1 | 48 | Risk Ratio (M‐H, Fixed, 95% CI) | 0.0 [0.0, 0.0] |
| 8 Leukopenia Show forest plot | 2 | 138 | Risk Ratio (M‐H, Fixed, 95% CI) | 1.50 [0.48, 4.70] |
| Analysis 8.8  Comparison 8 Gefitinib versus gefitinib + chemotherapy, Outcome 8 Leukopenia. | ||||
| 8.1 1st line | 1 | 90 | Risk Ratio (M‐H, Fixed, 95% CI) | 1.25 [0.36, 4.35] |
| 8.2 2nd line | 1 | 48 | Risk Ratio (M‐H, Fixed, 95% CI) | 3.82 [0.16, 89.24] |
| 9 Anaemia Show forest plot | 3 | 329 | Risk Ratio (M‐H, Fixed, 95% CI) | 3.22 [0.66, 15.72] |
| Analysis 8.9  Comparison 8 Gefitinib versus gefitinib + chemotherapy, Outcome 9 Anaemia. | ||||
| 9.1 1st line | 2 | 281 | Risk Ratio (M‐H, Fixed, 95% CI) | 3.06 [0.49, 19.15] |
| 9.2 2nd line | 1 | 48 | Risk Ratio (M‐H, Fixed, 95% CI) | 3.82 [0.16, 89.24] |
| 10 Thrombocytopenia Show forest plot | 2 | 138 | Risk Ratio (M‐H, Fixed, 95% CI) | 0.0 [0.0, 0.0] |
| Analysis 8.10  Comparison 8 Gefitinib versus gefitinib + chemotherapy, Outcome 10 Thrombocytopenia. | ||||
| 10.1 1st line | 1 | 90 | Risk Ratio (M‐H, Fixed, 95% CI) | 0.0 [0.0, 0.0] |
| 10.2 2nd line | 1 | 48 | Risk Ratio (M‐H, Fixed, 95% CI) | 0.0 [0.0, 0.0] |
| 11 Neutropenia Show forest plot | 3 | 329 | Risk Ratio (M‐H, Fixed, 95% CI) | 1.47 [0.71, 3.02] |
| Analysis 8.11 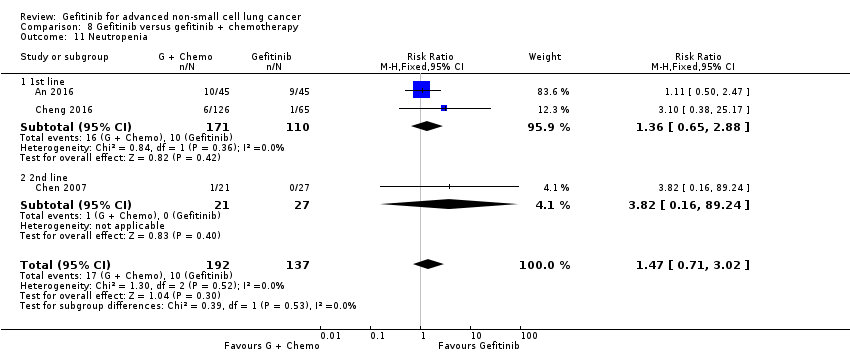 Comparison 8 Gefitinib versus gefitinib + chemotherapy, Outcome 11 Neutropenia. | ||||
| 11.1 1st line | 2 | 281 | Risk Ratio (M‐H, Fixed, 95% CI) | 1.36 [0.65, 2.88] |
| 11.2 2nd line | 1 | 48 | Risk Ratio (M‐H, Fixed, 95% CI) | 3.82 [0.16, 89.24] |
| 12 Increased ALT Show forest plot | 2 | 281 | Risk Ratio (M‐H, Fixed, 95% CI) | 2.57 [1.09, 6.04] |
| Analysis 8.12  Comparison 8 Gefitinib versus gefitinib + chemotherapy, Outcome 12 Increased ALT. | ||||
| 12.1 1st line | 2 | 281 | Risk Ratio (M‐H, Fixed, 95% CI) | 2.57 [1.09, 6.04] |
| 13 Increased AST Show forest plot | 2 | 281 | Risk Ratio (M‐H, Fixed, 95% CI) | 1.47 [0.56, 3.88] |
| Analysis 8.13 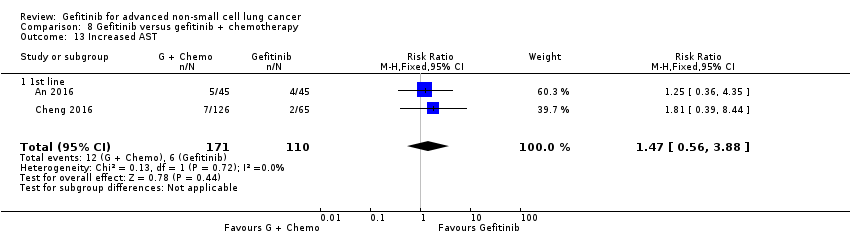 Comparison 8 Gefitinib versus gefitinib + chemotherapy, Outcome 13 Increased AST. | ||||
| 13.1 1st line | 2 | 281 | Risk Ratio (M‐H, Fixed, 95% CI) | 1.47 [0.56, 3.88] |
| 14 Vomiting Show forest plot | 1 | 191 | Risk Ratio (M‐H, Fixed, 95% CI) | 1.56 [0.06, 37.74] |
| Analysis 8.14 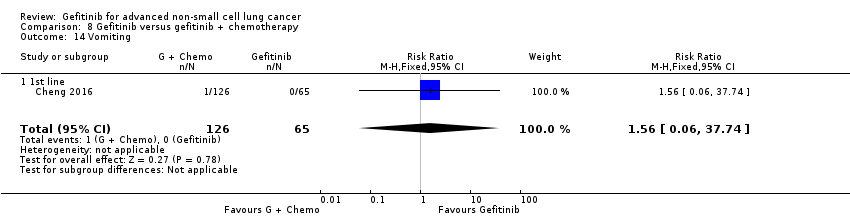 Comparison 8 Gefitinib versus gefitinib + chemotherapy, Outcome 14 Vomiting. | ||||
| 14.1 1st line | 1 | 191 | Risk Ratio (M‐H, Fixed, 95% CI) | 1.56 [0.06, 37.74] |
| 15 Nausea Show forest plot | 1 | 191 | Risk Ratio (M‐H, Fixed, 95% CI) | 1.56 [0.06, 37.74] |
| Analysis 8.15  Comparison 8 Gefitinib versus gefitinib + chemotherapy, Outcome 15 Nausea. | ||||
| 15.1 1st line | 1 | 191 | Risk Ratio (M‐H, Fixed, 95% CI) | 1.56 [0.06, 37.74] |
| 16 Overall response rate Show forest plot | 2 | 281 | Risk Ratio (M‐H, Fixed, 95% CI) | 1.02 [0.89, 1.17] |
| Analysis 8.16  Comparison 8 Gefitinib versus gefitinib + chemotherapy, Outcome 16 Overall response rate. | ||||
| 16.1 1st line | 2 | 281 | Risk Ratio (M‐H, Fixed, 95% CI) | 1.02 [0.89, 1.17] |
| 17 Partial response Show forest plot | 4 | 444 | Risk Ratio (M‐H, Fixed, 95% CI) | 1.01 [0.88, 1.16] |
| Analysis 8.17  Comparison 8 Gefitinib versus gefitinib + chemotherapy, Outcome 17 Partial response. | ||||
| 17.1 1st line | 2 | 281 | Risk Ratio (M‐H, Fixed, 95% CI) | 1.01 [0.88, 1.16] |
| 17.2 2nd line | 2 | 163 | Risk Ratio (M‐H, Fixed, 95% CI) | 1.02 [0.71, 1.47] |
| 18 Stable disease Show forest plot | 4 | 444 | Risk Ratio (M‐H, Fixed, 95% CI) | 0.97 [0.69, 1.37] |
| Analysis 8.18  Comparison 8 Gefitinib versus gefitinib + chemotherapy, Outcome 18 Stable disease. | ||||
| 18.1 1st line | 2 | 281 | Risk Ratio (M‐H, Fixed, 95% CI) | 0.67 [0.39, 1.16] |
| 18.2 2nd line | 2 | 163 | Risk Ratio (M‐H, Fixed, 95% CI) | 1.30 [0.84, 2.03] |
| Outcome or subgroup title | No. of studies | No. of participants | Statistical method | Effect size |
| 1 HR Overall survival Show forest plot | 3 | Hazard Ratio (Fixed, 95% CI) | Subtotals only | |
| Analysis 9.1  Comparison 9 Gefitinib + chemotherapy versus chemotherapy, Outcome 1 HR Overall survival. | ||||
| 1.1 1st line [Asian] | 2 | Hazard Ratio (Fixed, 95% CI) | 0.86 [0.72, 1.02] | |
| 1.2 2nd line [EGFRm] | 1 | Hazard Ratio (Fixed, 95% CI) | 1.62 [1.05, 2.50] | |
| 2 HR Progression‐free survival Show forest plot | 3 | Hazard Ratio (Fixed, 95% CI) | Subtotals only | |
| Analysis 9.2 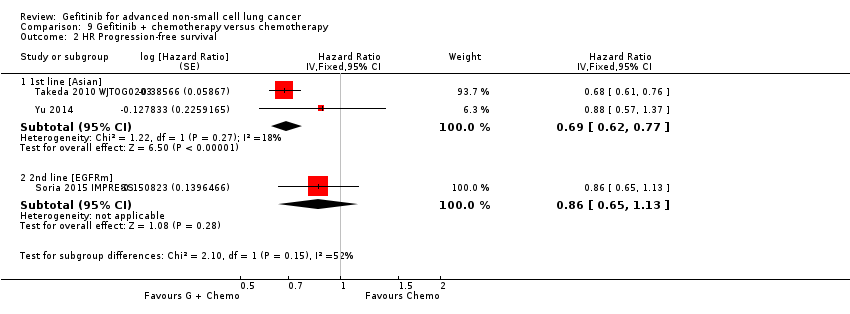 Comparison 9 Gefitinib + chemotherapy versus chemotherapy, Outcome 2 HR Progression‐free survival. | ||||
| 2.1 1st line [Asian] | 2 | Hazard Ratio (Fixed, 95% CI) | 0.69 [0.62, 0.77] | |
| 2.2 2nd line [EGFRm] | 1 | Hazard Ratio (Fixed, 95% CI) | 0.86 [0.65, 1.13] | |
| 3 1‐year survival rate Show forest plot | 2 | 1411 | Risk Ratio (M‐H, Fixed, 95% CI) | 0.95 [0.84, 1.08] |
| Analysis 9.3  Comparison 9 Gefitinib + chemotherapy versus chemotherapy, Outcome 3 1‐year survival rate. | ||||
| 3.1 1st line | 2 | 1411 | Risk Ratio (M‐H, Fixed, 95% CI) | 0.95 [0.84, 1.08] |
| 4 Skin rash Show forest plot | 5 | 2379 | Risk Ratio (M‐H, Fixed, 95% CI) | 2.98 [1.54, 5.77] |
| Analysis 9.4  Comparison 9 Gefitinib + chemotherapy versus chemotherapy, Outcome 4 Skin rash. | ||||
| 4.1 1st line | 2 | 1400 | Risk Ratio (M‐H, Fixed, 95% CI) | 2.64 [1.23, 5.63] |
| 4.2 1st line [Asian] | 2 | 715 | Risk Ratio (M‐H, Fixed, 95% CI) | 4.23 [1.08, 16.54] |
| 4.3 2nd line [EGFRm] | 1 | 264 | Risk Ratio (M‐H, Fixed, 95% CI) | 0.0 [0.0, 0.0] |
| 5 Acne Show forest plot | 3 | 1664 | Risk Ratio (M‐H, Fixed, 95% CI) | 4.95 [1.09, 22.51] |
| Analysis 9.5  Comparison 9 Gefitinib + chemotherapy versus chemotherapy, Outcome 5 Acne. | ||||
| 5.1 1st line | 2 | 1400 | Risk Ratio (M‐H, Fixed, 95% CI) | 5.59 [0.99, 31.60] |
| 5.2 2nd line [EGFRm] | 1 | 264 | Risk Ratio (M‐H, Fixed, 95% CI) | 3.0 [0.12, 72.98] |
| 6 Diarrhoea Show forest plot | 5 | 2379 | Risk Ratio (M‐H, Random, 95% CI) | 2.04 [1.17, 3.58] |
| Analysis 9.6  Comparison 9 Gefitinib + chemotherapy versus chemotherapy, Outcome 6 Diarrhoea. | ||||
| 6.1 1st line | 2 | 1400 | Risk Ratio (M‐H, Random, 95% CI) | 2.44 [1.17, 5.09] |
| 6.2 1st line [Asian] | 2 | 715 | Risk Ratio (M‐H, Random, 95% CI) | 0.97 [0.32, 2.92] |
| 6.3 2nd line [EGFRm] | 1 | 264 | Risk Ratio (M‐H, Random, 95% CI) | 3.0 [0.32, 28.47] |
| 7 Pruritus Show forest plot | 2 | 1400 | Risk Ratio (M‐H, Fixed, 95% CI) | 1.99 [0.18, 21.89] |
| Analysis 9.7  Comparison 9 Gefitinib + chemotherapy versus chemotherapy, Outcome 7 Pruritus. | ||||
| 7.1 1st line | 2 | 1400 | Risk Ratio (M‐H, Fixed, 95% CI) | 1.99 [0.18, 21.89] |
| 8 Vomiting Show forest plot | 5 | 2379 | Risk Ratio (M‐H, Fixed, 95% CI) | 1.24 [0.81, 1.89] |
| Analysis 9.8  Comparison 9 Gefitinib + chemotherapy versus chemotherapy, Outcome 8 Vomiting. | ||||
| 8.1 1st line | 2 | 1400 | Risk Ratio (M‐H, Fixed, 95% CI) | 1.05 [0.53, 2.06] |
| 8.2 1st line [Asian] | 2 | 715 | Risk Ratio (M‐H, Fixed, 95% CI) | 1.28 [0.70, 2.32] |
| 8.3 2nd line [EGFRm] | 1 | 264 | Risk Ratio (M‐H, Fixed, 95% CI) | 2.0 [0.51, 7.83] |
| 9 Nausea Show forest plot | 5 | 2379 | Risk Ratio (M‐H, Fixed, 95% CI) | 0.82 [0.58, 1.17] |
| Analysis 9.9  Comparison 9 Gefitinib + chemotherapy versus chemotherapy, Outcome 9 Nausea. | ||||
| 9.1 1st line | 2 | 1400 | Risk Ratio (M‐H, Fixed, 95% CI) | 1.06 [0.51, 2.18] |
| 9.2 1st line [Asian] | 2 | 715 | Risk Ratio (M‐H, Fixed, 95% CI) | 0.74 [0.48, 1.14] |
| 9.3 2nd line [EGFRm] | 1 | 264 | Risk Ratio (M‐H, Fixed, 95% CI) | 0.83 [0.26, 2.66] |
| 10 Anorexia Show forest plot | 5 | 2379 | Risk Ratio (M‐H, Fixed, 95% CI) | 0.82 [0.55, 1.20] |
| Analysis 9.10 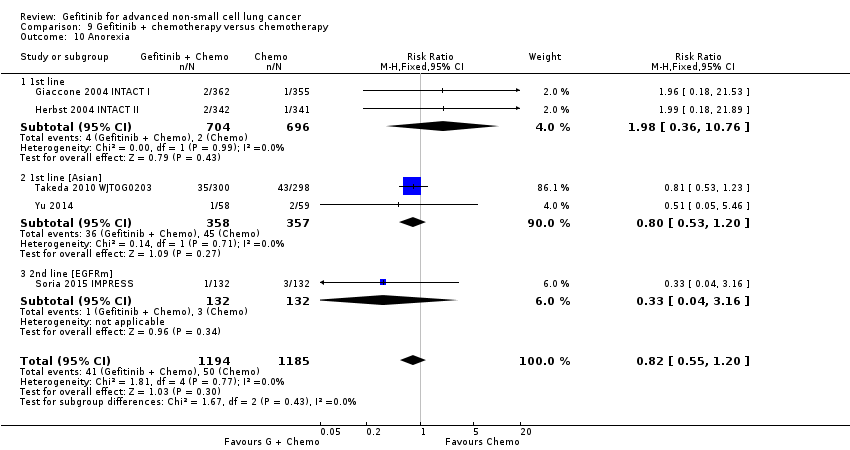 Comparison 9 Gefitinib + chemotherapy versus chemotherapy, Outcome 10 Anorexia. | ||||
| 10.1 1st line | 2 | 1400 | Risk Ratio (M‐H, Fixed, 95% CI) | 1.98 [0.36, 10.76] |
| 10.2 1st line [Asian] | 2 | 715 | Risk Ratio (M‐H, Fixed, 95% CI) | 0.80 [0.53, 1.20] |
| 10.3 2nd line [EGFRm] | 1 | 264 | Risk Ratio (M‐H, Fixed, 95% CI) | 0.33 [0.04, 3.16] |
| 11 Asthenia Show forest plot | 3 | 1664 | Risk Ratio (M‐H, Random, 95% CI) | 0.80 [0.21, 2.99] |
| Analysis 9.11 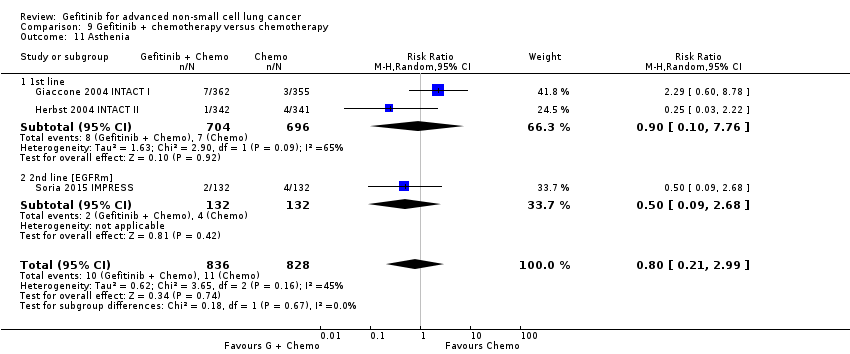 Comparison 9 Gefitinib + chemotherapy versus chemotherapy, Outcome 11 Asthenia. | ||||
| 11.1 1st line | 2 | 1400 | Risk Ratio (M‐H, Random, 95% CI) | 0.90 [0.10, 7.76] |
| 11.2 2nd line [EGFRm] | 1 | 264 | Risk Ratio (M‐H, Random, 95% CI) | 0.5 [0.09, 2.68] |
| 12 Dyspnoea Show forest plot | 2 | 947 | Risk Ratio (M‐H, Fixed, 95% CI) | 1.00 [0.25, 3.96] |
| Analysis 9.12 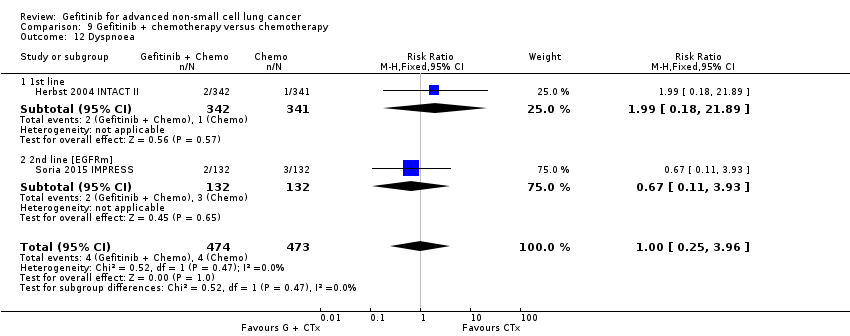 Comparison 9 Gefitinib + chemotherapy versus chemotherapy, Outcome 12 Dyspnoea. | ||||
| 12.1 1st line | 1 | 683 | Risk Ratio (M‐H, Fixed, 95% CI) | 1.99 [0.18, 21.89] |
| 12.2 2nd line [EGFRm] | 1 | 264 | Risk Ratio (M‐H, Fixed, 95% CI) | 0.67 [0.11, 3.93] |
| 13 Anaemia Show forest plot | 3 | 979 | Risk Ratio (M‐H, Fixed, 95% CI) | 0.74 [0.53, 1.03] |
| Analysis 9.13  Comparison 9 Gefitinib + chemotherapy versus chemotherapy, Outcome 13 Anaemia. | ||||
| 13.1 1st line [Asian] | 2 | 715 | Risk Ratio (M‐H, Fixed, 95% CI) | 0.63 [0.44, 0.90] |
| 13.2 2nd line [EGFRm] | 1 | 264 | Risk Ratio (M‐H, Fixed, 95% CI) | 2.2 [0.79, 6.16] |
| 14 Neutropenia Show forest plot | 5 | 2379 | Risk Ratio (M‐H, Fixed, 95% CI) | 0.97 [0.87, 1.08] |
| Analysis 9.14  Comparison 9 Gefitinib + chemotherapy versus chemotherapy, Outcome 14 Neutropenia. | ||||
| 14.1 1st line | 2 | 1400 | Risk Ratio (M‐H, Fixed, 95% CI) | 1.18 [0.77, 1.80] |
| 14.2 1st line [Asian] | 2 | 715 | Risk Ratio (M‐H, Fixed, 95% CI) | 0.93 [0.84, 1.03] |
| 14.3 2nd line [EGFRm] | 1 | 264 | Risk Ratio (M‐H, Fixed, 95% CI) | 1.29 [0.49, 3.35] |
| 15 Leukopenia Show forest plot | 4 | 2262 | Risk Ratio (M‐H, Fixed, 95% CI) | 1.08 [0.89, 1.31] |
| Analysis 9.15 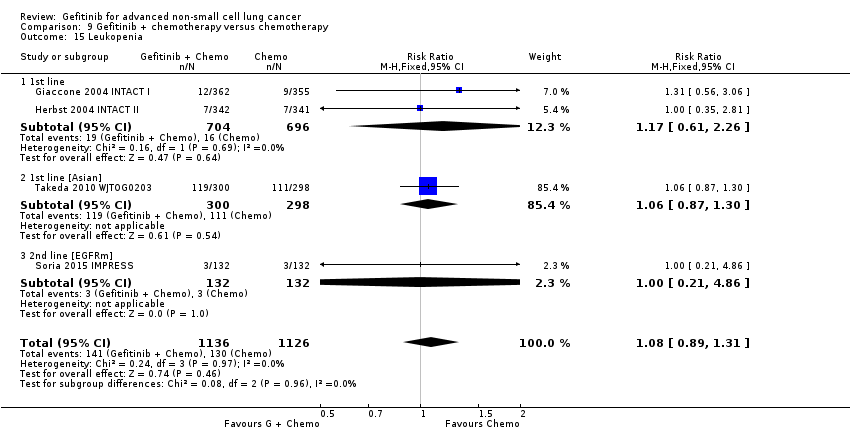 Comparison 9 Gefitinib + chemotherapy versus chemotherapy, Outcome 15 Leukopenia. | ||||
| 15.1 1st line | 2 | 1400 | Risk Ratio (M‐H, Fixed, 95% CI) | 1.17 [0.61, 2.26] |
| 15.2 1st line [Asian] | 1 | 598 | Risk Ratio (M‐H, Fixed, 95% CI) | 1.06 [0.87, 1.30] |
| 15.3 2nd line [EGFRm] | 1 | 264 | Risk Ratio (M‐H, Fixed, 95% CI) | 1.0 [0.21, 4.86] |
| 16 Overall response rate Show forest plot | 5 | 2314 | Risk Ratio (M‐H, Fixed, 95% CI) | 1.08 [0.97, 1.20] |
| Analysis 9.16  Comparison 9 Gefitinib + chemotherapy versus chemotherapy, Outcome 16 Overall response rate. | ||||
| 16.1 1st line | 2 | 1343 | Risk Ratio (M‐H, Fixed, 95% CI) | 1.07 [0.94, 1.22] |
| 16.2 1st line [Asian] | 2 | 706 | Risk Ratio (M‐H, Fixed, 95% CI) | 1.14 [0.93, 1.40] |
| 16.3 2nd line [EGFRm] | 1 | 265 | Risk Ratio (M‐H, Fixed, 95% CI) | 0.93 [0.66, 1.31] |

Study flow diagram for searches 1966‐2017.
(EGFR: epidermal growth factor receptor)

'Risk of bias' summary: review authors' judgements about each risk of bias item for each included study.
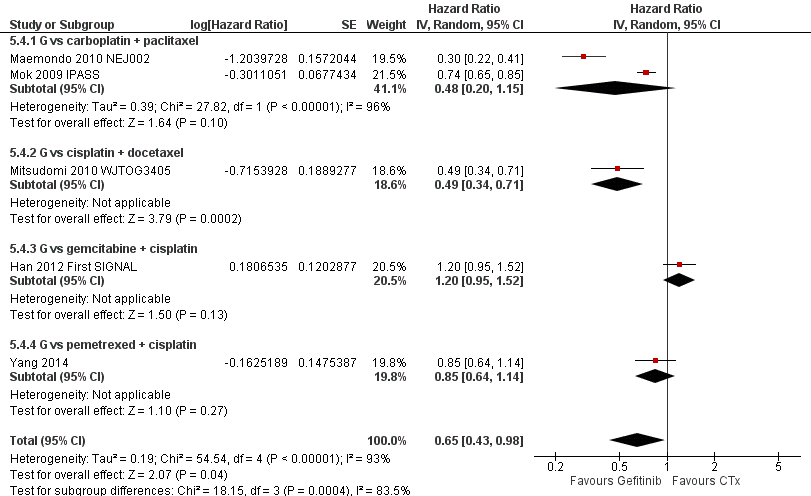
Progression‐free survival: Gefitinib versus first‐line chemotherapy in an Asian population (Analysis 5.4).

Progression‐free survival: Gefitinib versus second‐line chemotherapy in an Asian population (Analysis 5.5).

Progression‐free survival: Gefitinib versus first‐line chemotherapy in an EGFR mutation positive population (Analysis 6.3).

Progression‐free survival: Gefitinib versus second‐line chemotherapy in an EGFR mutation positive population (Analysis 6.4).
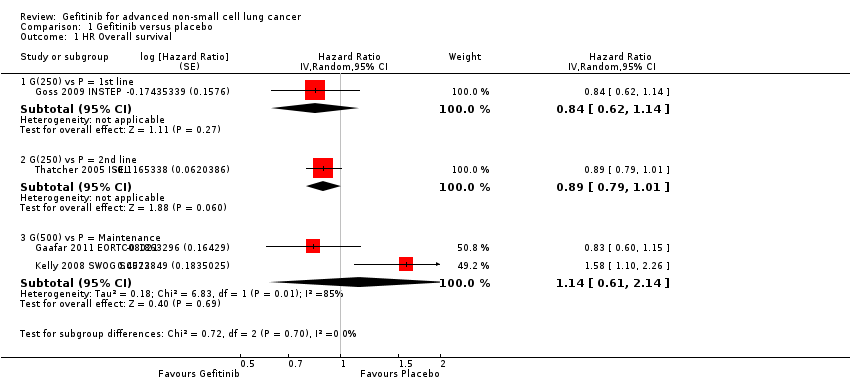
Comparison 1 Gefitinib versus placebo, Outcome 1 HR Overall survival.

Comparison 1 Gefitinib versus placebo, Outcome 2 HR Progression‐free survival.

Comparison 1 Gefitinib versus placebo, Outcome 3 1‐year survival rate.

Comparison 1 Gefitinib versus placebo, Outcome 4 Skin rash.

Comparison 1 Gefitinib versus placebo, Outcome 5 Pruritus.

Comparison 1 Gefitinib versus placebo, Outcome 6 Diarrhoea.

Comparison 1 Gefitinib versus placebo, Outcome 7 Constipation.

Comparison 1 Gefitinib versus placebo, Outcome 8 Nausea.

Comparison 1 Gefitinib versus placebo, Outcome 9 Vomiting.

Comparison 1 Gefitinib versus placebo, Outcome 10 Anorexia.

Comparison 1 Gefitinib versus placebo, Outcome 11 Fatigue.
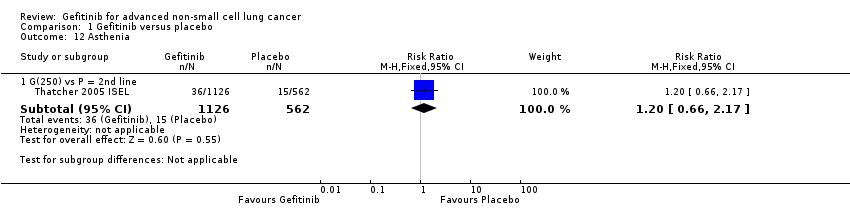
Comparison 1 Gefitinib versus placebo, Outcome 12 Asthenia.

Comparison 1 Gefitinib versus placebo, Outcome 13 Respiratory tract infection.

Comparison 1 Gefitinib versus placebo, Outcome 14 Dyspnoea.
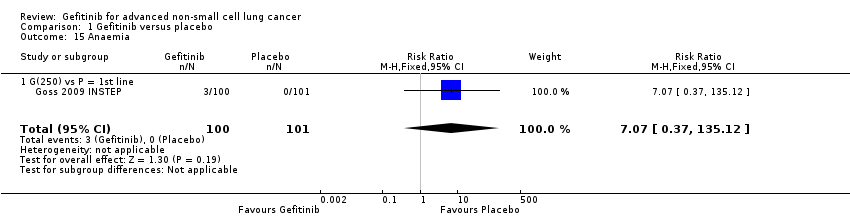
Comparison 1 Gefitinib versus placebo, Outcome 15 Anaemia.

Comparison 1 Gefitinib versus placebo, Outcome 16 Abdominal pain.

Comparison 1 Gefitinib versus placebo, Outcome 17 Increased ALT.

Comparison 1 Gefitinib versus placebo, Outcome 18 Increased AST.

Comparison 1 Gefitinib versus placebo, Outcome 19 Neutropenia.

Comparison 1 Gefitinib versus placebo, Outcome 20 Anaemia.

Comparison 1 Gefitinib versus placebo, Outcome 21 Thrombocytopaenia.

Comparison 1 Gefitinib versus placebo, Outcome 22 Overall response rate.

Comparison 1 Gefitinib versus placebo, Outcome 23 Disease control rate.

Comparison 2 Gefitinib versus placebo (Asian subgroup), Outcome 1 HR Overall survival.
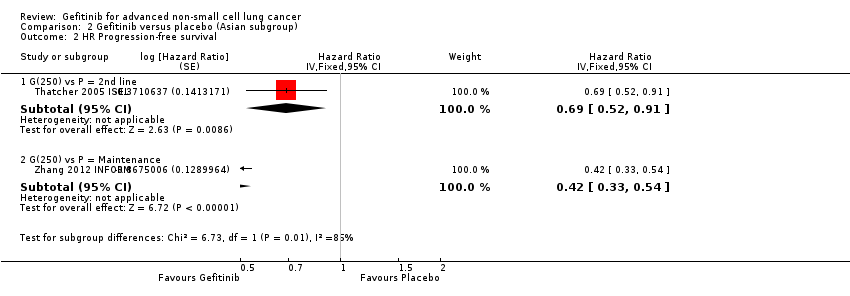
Comparison 2 Gefitinib versus placebo (Asian subgroup), Outcome 2 HR Progression‐free survival.
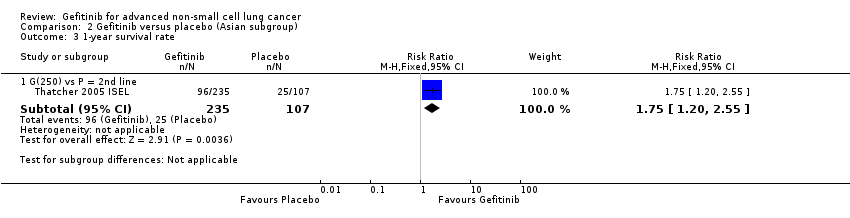
Comparison 2 Gefitinib versus placebo (Asian subgroup), Outcome 3 1‐year survival rate.

Comparison 2 Gefitinib versus placebo (Asian subgroup), Outcome 4 Overall response rate.
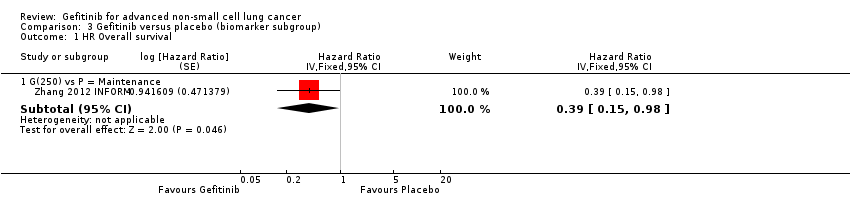
Comparison 3 Gefitinib versus placebo (biomarker subgroup), Outcome 1 HR Overall survival.

Comparison 3 Gefitinib versus placebo (biomarker subgroup), Outcome 2 HR Progression‐free survival.

Comparison 4 Gefitinib versus chemotherapy, Outcome 1 HR Overall survival.

Comparison 4 Gefitinib versus chemotherapy, Outcome 2 HR Progression‐free survival.
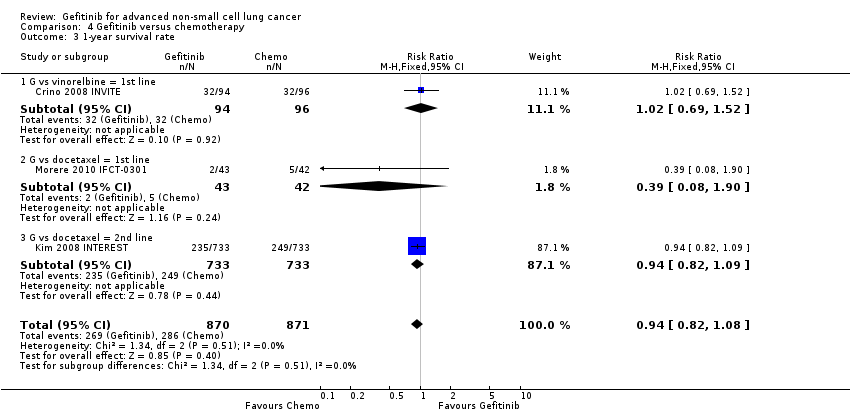
Comparison 4 Gefitinib versus chemotherapy, Outcome 3 1‐year survival rate.

Comparison 4 Gefitinib versus chemotherapy, Outcome 4 Skin rash.
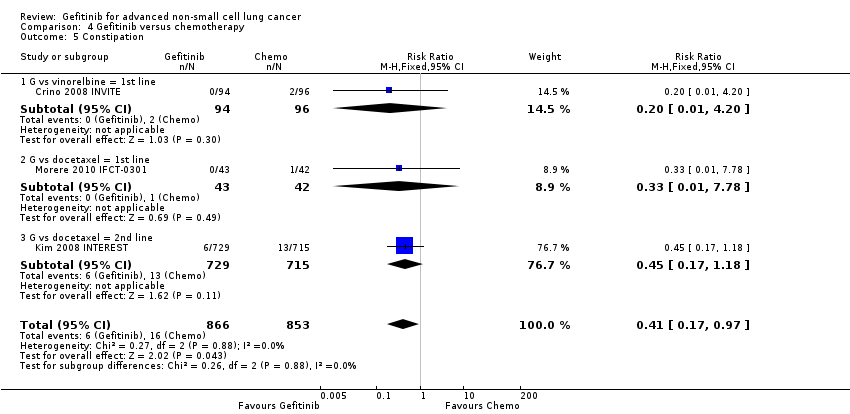
Comparison 4 Gefitinib versus chemotherapy, Outcome 5 Constipation.

Comparison 4 Gefitinib versus chemotherapy, Outcome 6 Fatigue.

Comparison 4 Gefitinib versus chemotherapy, Outcome 7 Asthenia.
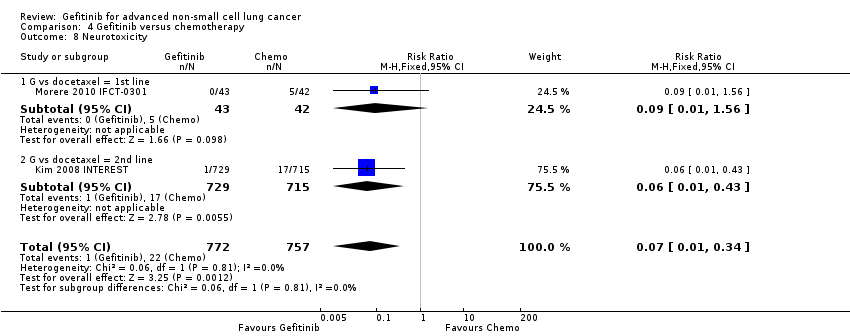
Comparison 4 Gefitinib versus chemotherapy, Outcome 8 Neurotoxicity.

Comparison 4 Gefitinib versus chemotherapy, Outcome 9 Neutropenia.

Comparison 4 Gefitinib versus chemotherapy, Outcome 10 Leukopenia.

Comparison 4 Gefitinib versus chemotherapy, Outcome 11 Febrile neutropenia.

Comparison 4 Gefitinib versus chemotherapy, Outcome 12 Pruritus.
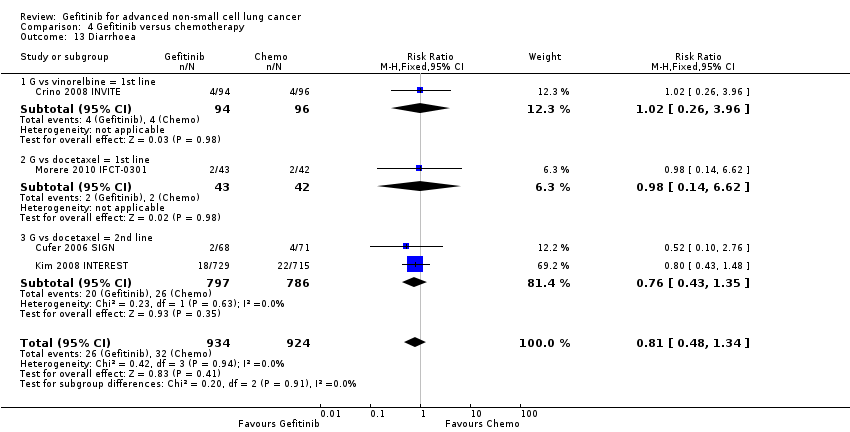
Comparison 4 Gefitinib versus chemotherapy, Outcome 13 Diarrhoea.
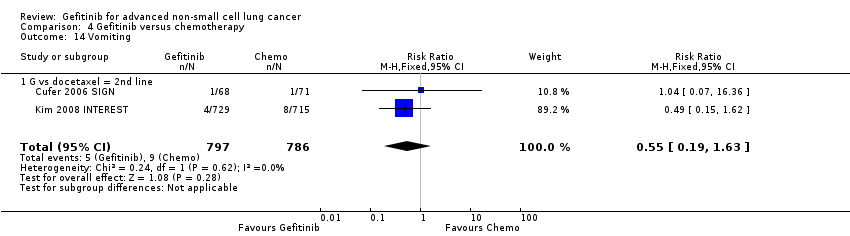
Comparison 4 Gefitinib versus chemotherapy, Outcome 14 Vomiting.
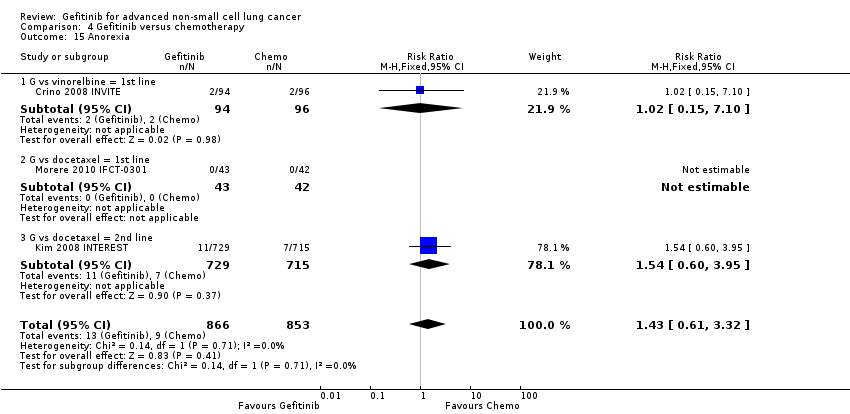
Comparison 4 Gefitinib versus chemotherapy, Outcome 15 Anorexia.
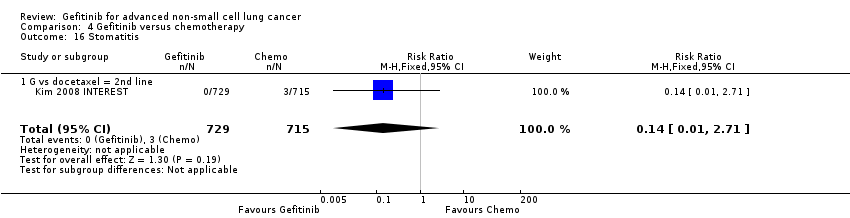
Comparison 4 Gefitinib versus chemotherapy, Outcome 16 Stomatitis.

Comparison 4 Gefitinib versus chemotherapy, Outcome 17 Arthralgia/myalgia.
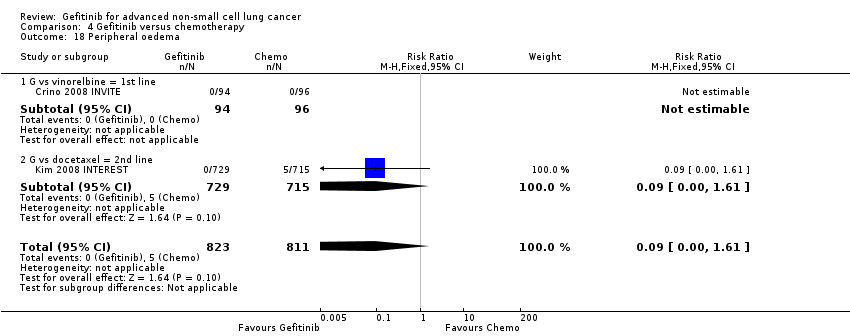
Comparison 4 Gefitinib versus chemotherapy, Outcome 18 Peripheral oedema.

Comparison 4 Gefitinib versus chemotherapy, Outcome 19 Respiratory tract infection.

Comparison 4 Gefitinib versus chemotherapy, Outcome 20 Dyspnoea.

Comparison 4 Gefitinib versus chemotherapy, Outcome 21 Cough.

Comparison 4 Gefitinib versus chemotherapy, Outcome 22 Anaemia.

Comparison 4 Gefitinib versus chemotherapy, Outcome 23 Thrombocytopenia.
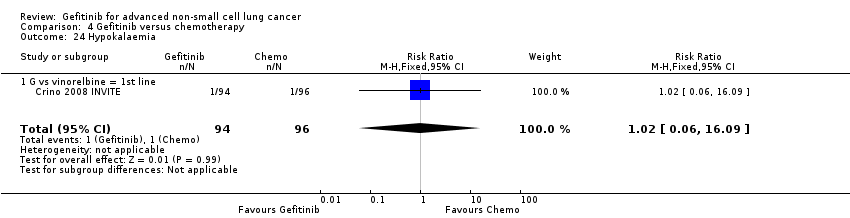
Comparison 4 Gefitinib versus chemotherapy, Outcome 24 Hypokalaemia.

Comparison 4 Gefitinib versus chemotherapy, Outcome 25 Pyrexia.
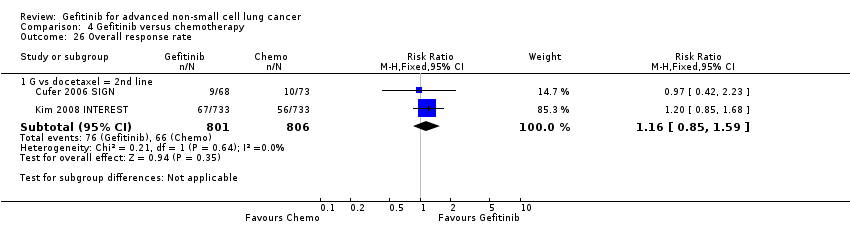
Comparison 4 Gefitinib versus chemotherapy, Outcome 26 Overall response rate.

Comparison 4 Gefitinib versus chemotherapy, Outcome 27 Disease control rate.
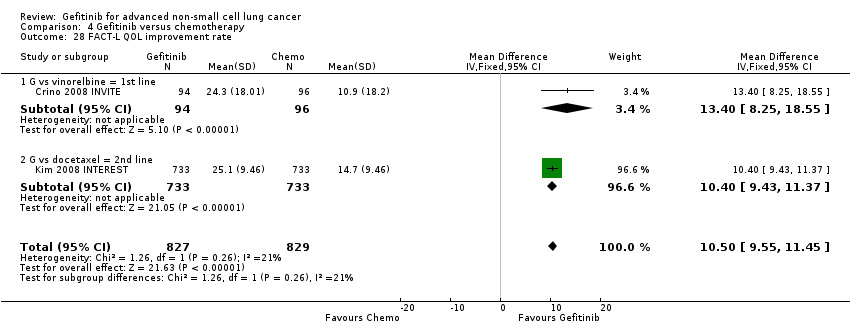
Comparison 4 Gefitinib versus chemotherapy, Outcome 28 FACT‐L QOL improvement rate.

Comparison 4 Gefitinib versus chemotherapy, Outcome 29 LCS QOL improvement rate.

Comparison 4 Gefitinib versus chemotherapy, Outcome 30 TOI QOL improvement rate.

Comparison 4 Gefitinib versus chemotherapy, Outcome 31 PSI QOL improvement rate.

Comparison 5 Gefitinib versus chemotherapy (Asian subgroup), Outcome 1 HR Overall survival = 1st line.

Comparison 5 Gefitinib versus chemotherapy (Asian subgroup), Outcome 2 HR Overall survival = 2nd line.

Comparison 5 Gefitinib versus chemotherapy (Asian subgroup), Outcome 3 HR Overall survival = Maintenance.

Comparison 5 Gefitinib versus chemotherapy (Asian subgroup), Outcome 4 HR Progression‐free survival = 1st line.
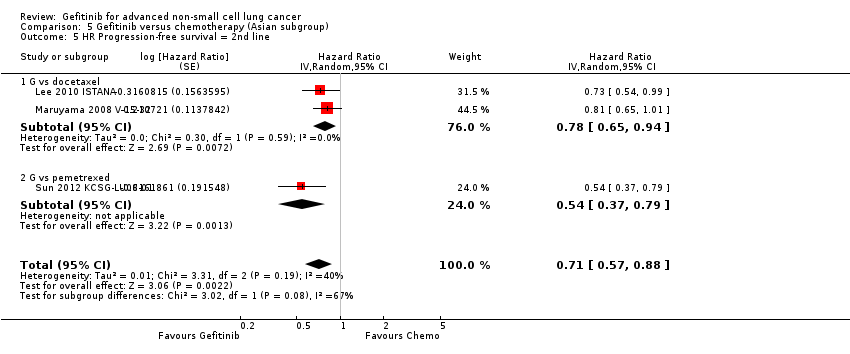
Comparison 5 Gefitinib versus chemotherapy (Asian subgroup), Outcome 5 HR Progression‐free survival = 2nd line.

Comparison 5 Gefitinib versus chemotherapy (Asian subgroup), Outcome 6 HR Progression‐free survival = Maintenance.

Comparison 5 Gefitinib versus chemotherapy (Asian subgroup), Outcome 7 1‐year survival rate.

Comparison 5 Gefitinib versus chemotherapy (Asian subgroup), Outcome 8 Nausea.

Comparison 5 Gefitinib versus chemotherapy (Asian subgroup), Outcome 9 Vomiting.

Comparison 5 Gefitinib versus chemotherapy (Asian subgroup), Outcome 10 Anorexia.

Comparison 5 Gefitinib versus chemotherapy (Asian subgroup), Outcome 11 Fatigue.

Comparison 5 Gefitinib versus chemotherapy (Asian subgroup), Outcome 12 Arthralgia/myalgia.

Comparison 5 Gefitinib versus chemotherapy (Asian subgroup), Outcome 13 Asthenia.

Comparison 5 Gefitinib versus chemotherapy (Asian subgroup), Outcome 14 Neurotoxicity.

Comparison 5 Gefitinib versus chemotherapy (Asian subgroup), Outcome 15 Neutropenia.

Comparison 5 Gefitinib versus chemotherapy (Asian subgroup), Outcome 16 Anaemia.
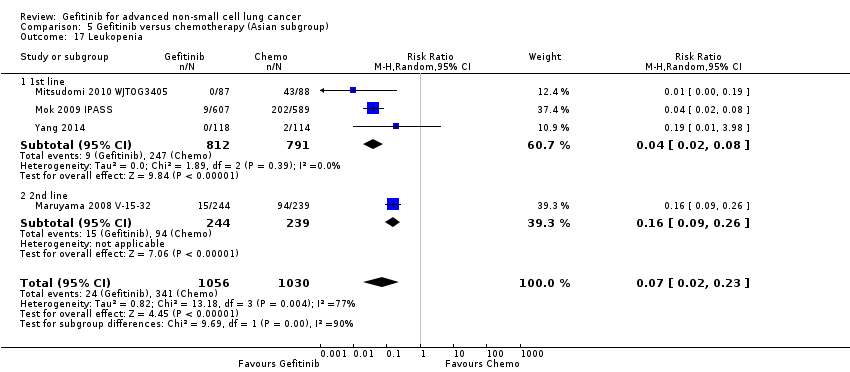
Comparison 5 Gefitinib versus chemotherapy (Asian subgroup), Outcome 17 Leukopenia.

Comparison 5 Gefitinib versus chemotherapy (Asian subgroup), Outcome 18 Thrombocytopenia.
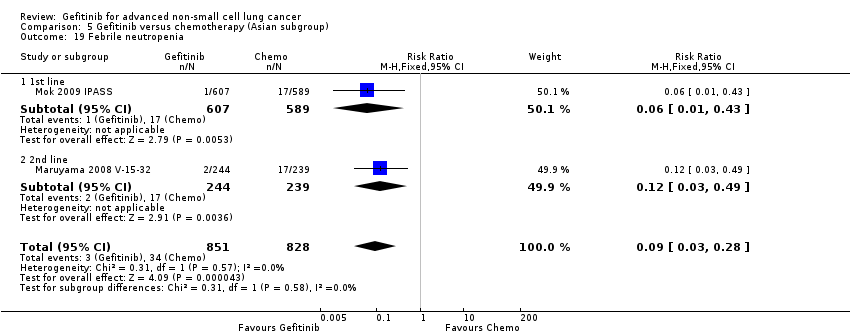
Comparison 5 Gefitinib versus chemotherapy (Asian subgroup), Outcome 19 Febrile neutropenia.

Comparison 5 Gefitinib versus chemotherapy (Asian subgroup), Outcome 20 Skin rash.
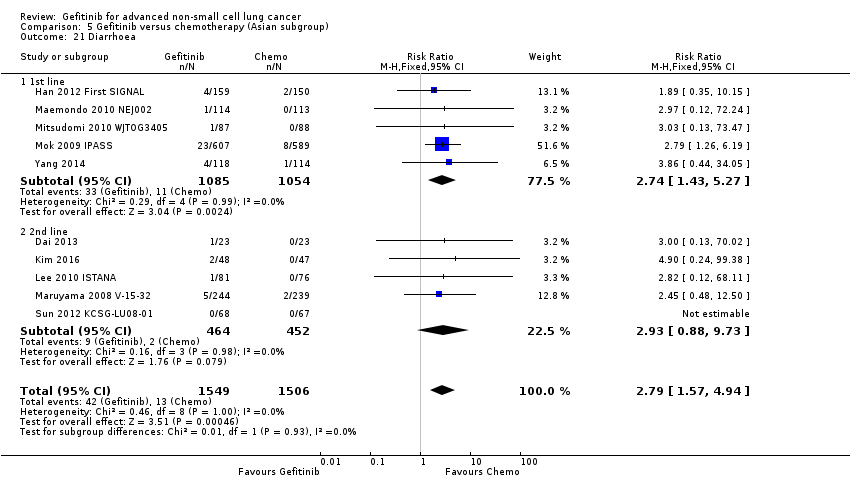
Comparison 5 Gefitinib versus chemotherapy (Asian subgroup), Outcome 21 Diarrhoea.

Comparison 5 Gefitinib versus chemotherapy (Asian subgroup), Outcome 22 Increased ALT.

Comparison 5 Gefitinib versus chemotherapy (Asian subgroup), Outcome 23 Increased AST.

Comparison 5 Gefitinib versus chemotherapy (Asian subgroup), Outcome 24 Overall response rate.
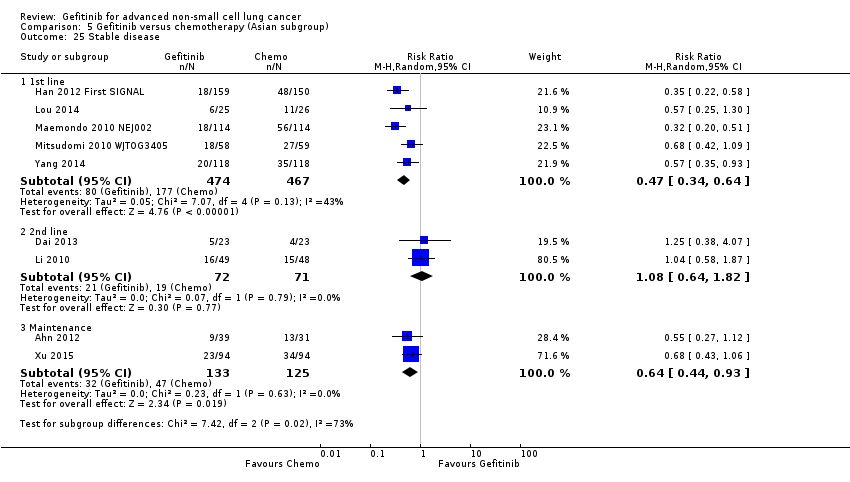
Comparison 5 Gefitinib versus chemotherapy (Asian subgroup), Outcome 25 Stable disease.

Comparison 5 Gefitinib versus chemotherapy (Asian subgroup), Outcome 26 Disease control rate.

Comparison 5 Gefitinib versus chemotherapy (Asian subgroup), Outcome 27 FACT‐L QOL improvement rate.

Comparison 5 Gefitinib versus chemotherapy (Asian subgroup), Outcome 28 LCS QOL improvement rate.
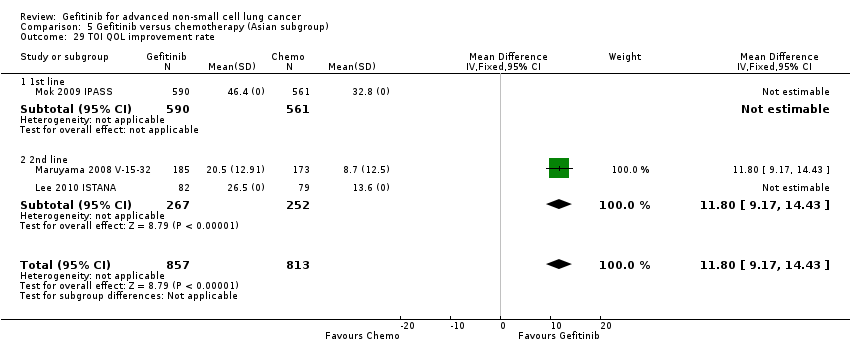
Comparison 5 Gefitinib versus chemotherapy (Asian subgroup), Outcome 29 TOI QOL improvement rate.

Comparison 6 Gefitinib versus chemotherapy (EGFR mutation), Outcome 1 HR Overall survival = 1st line.
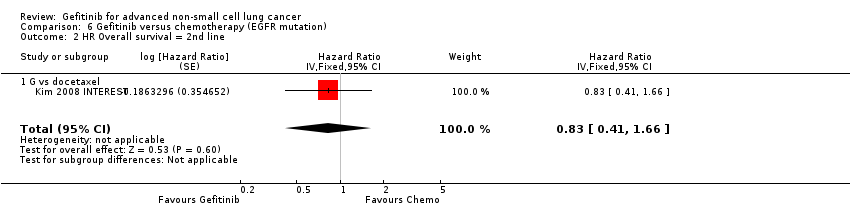
Comparison 6 Gefitinib versus chemotherapy (EGFR mutation), Outcome 2 HR Overall survival = 2nd line.
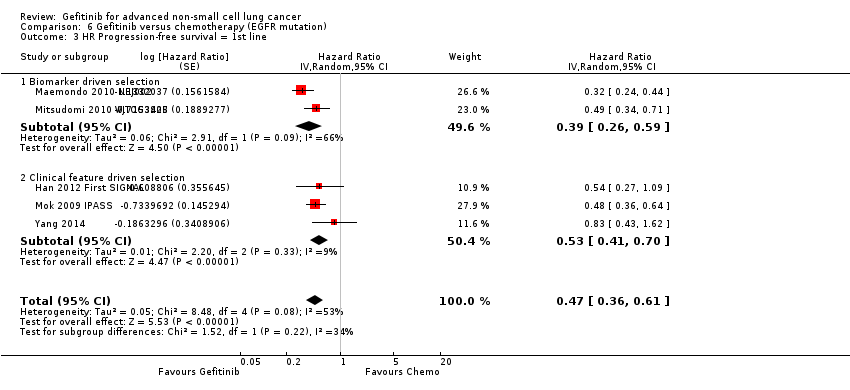
Comparison 6 Gefitinib versus chemotherapy (EGFR mutation), Outcome 3 HR Progression‐free survival = 1st line.
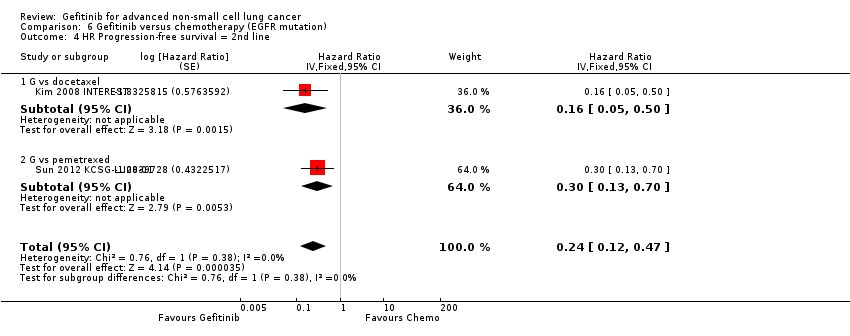
Comparison 6 Gefitinib versus chemotherapy (EGFR mutation), Outcome 4 HR Progression‐free survival = 2nd line.

Comparison 6 Gefitinib versus chemotherapy (EGFR mutation), Outcome 5 Overall response rate.
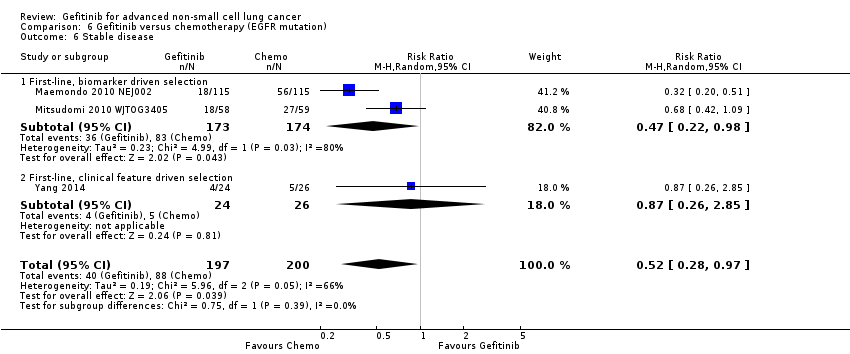
Comparison 6 Gefitinib versus chemotherapy (EGFR mutation), Outcome 6 Stable disease.

Comparison 6 Gefitinib versus chemotherapy (EGFR mutation), Outcome 7 Disease control rate.

Comparison 7 Gefitinib 250 mg versus gefitinib 500 mg, Outcome 1 1‐year survival rate.

Comparison 7 Gefitinib 250 mg versus gefitinib 500 mg, Outcome 2 Skin rash.
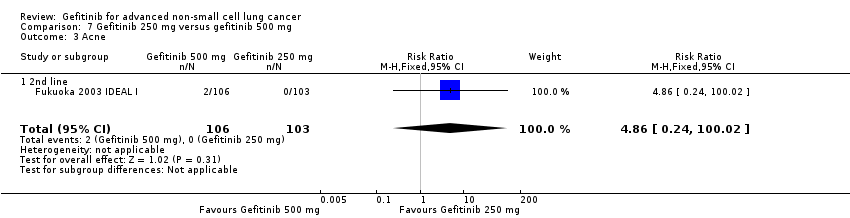
Comparison 7 Gefitinib 250 mg versus gefitinib 500 mg, Outcome 3 Acne.

Comparison 7 Gefitinib 250 mg versus gefitinib 500 mg, Outcome 4 Pruritus.
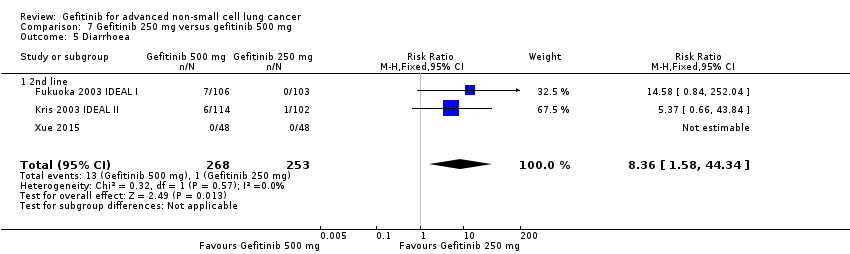
Comparison 7 Gefitinib 250 mg versus gefitinib 500 mg, Outcome 5 Diarrhoea.

Comparison 7 Gefitinib 250 mg versus gefitinib 500 mg, Outcome 6 Nausea.
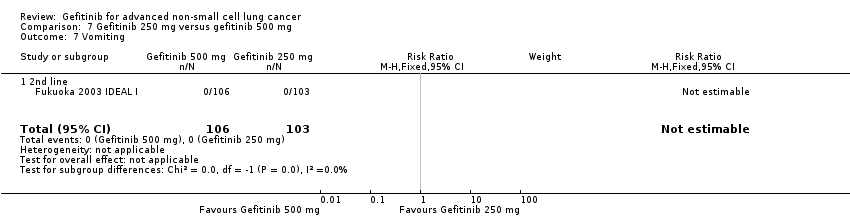
Comparison 7 Gefitinib 250 mg versus gefitinib 500 mg, Outcome 7 Vomiting.

Comparison 7 Gefitinib 250 mg versus gefitinib 500 mg, Outcome 8 Anorexia.

Comparison 7 Gefitinib 250 mg versus gefitinib 500 mg, Outcome 9 Asthenia.

Comparison 7 Gefitinib 250 mg versus gefitinib 500 mg, Outcome 10 Overall response rate.

Comparison 7 Gefitinib 250 mg versus gefitinib 500 mg, Outcome 11 Partial response.
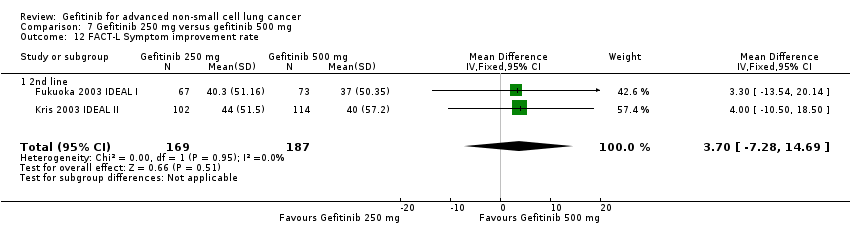
Comparison 7 Gefitinib 250 mg versus gefitinib 500 mg, Outcome 12 FACT‐L Symptom improvement rate.

Comparison 7 Gefitinib 250 mg versus gefitinib 500 mg, Outcome 13 TOI QOL improvement rate.

Comparison 8 Gefitinib versus gefitinib + chemotherapy, Outcome 1 HR Progression‐free survival.

Comparison 8 Gefitinib versus gefitinib + chemotherapy, Outcome 2 1‐year survival rate.
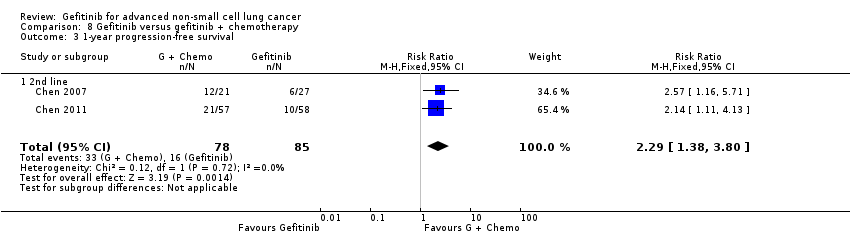
Comparison 8 Gefitinib versus gefitinib + chemotherapy, Outcome 3 1‐year progression‐free survival.
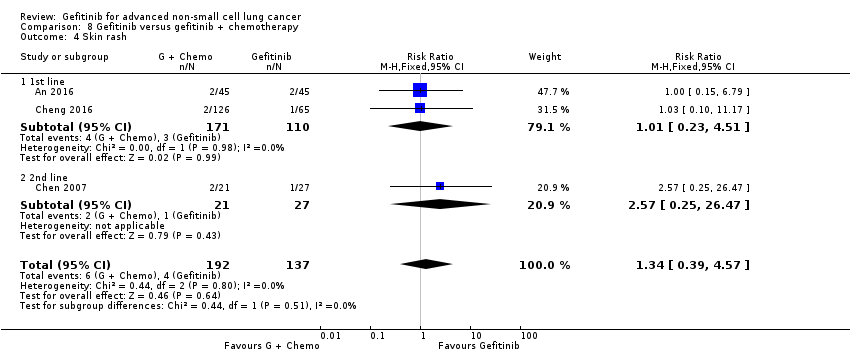
Comparison 8 Gefitinib versus gefitinib + chemotherapy, Outcome 4 Skin rash.

Comparison 8 Gefitinib versus gefitinib + chemotherapy, Outcome 5 Diarrhoea.
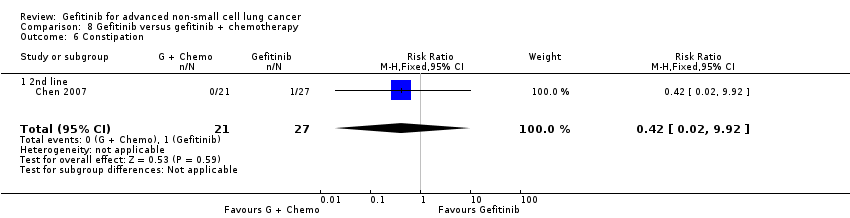
Comparison 8 Gefitinib versus gefitinib + chemotherapy, Outcome 6 Constipation.

Comparison 8 Gefitinib versus gefitinib + chemotherapy, Outcome 7 Fatigue.

Comparison 8 Gefitinib versus gefitinib + chemotherapy, Outcome 8 Leukopenia.

Comparison 8 Gefitinib versus gefitinib + chemotherapy, Outcome 9 Anaemia.

Comparison 8 Gefitinib versus gefitinib + chemotherapy, Outcome 10 Thrombocytopenia.

Comparison 8 Gefitinib versus gefitinib + chemotherapy, Outcome 11 Neutropenia.

Comparison 8 Gefitinib versus gefitinib + chemotherapy, Outcome 12 Increased ALT.

Comparison 8 Gefitinib versus gefitinib + chemotherapy, Outcome 13 Increased AST.

Comparison 8 Gefitinib versus gefitinib + chemotherapy, Outcome 14 Vomiting.

Comparison 8 Gefitinib versus gefitinib + chemotherapy, Outcome 15 Nausea.

Comparison 8 Gefitinib versus gefitinib + chemotherapy, Outcome 16 Overall response rate.

Comparison 8 Gefitinib versus gefitinib + chemotherapy, Outcome 17 Partial response.

Comparison 8 Gefitinib versus gefitinib + chemotherapy, Outcome 18 Stable disease.

Comparison 9 Gefitinib + chemotherapy versus chemotherapy, Outcome 1 HR Overall survival.

Comparison 9 Gefitinib + chemotherapy versus chemotherapy, Outcome 2 HR Progression‐free survival.

Comparison 9 Gefitinib + chemotherapy versus chemotherapy, Outcome 3 1‐year survival rate.

Comparison 9 Gefitinib + chemotherapy versus chemotherapy, Outcome 4 Skin rash.
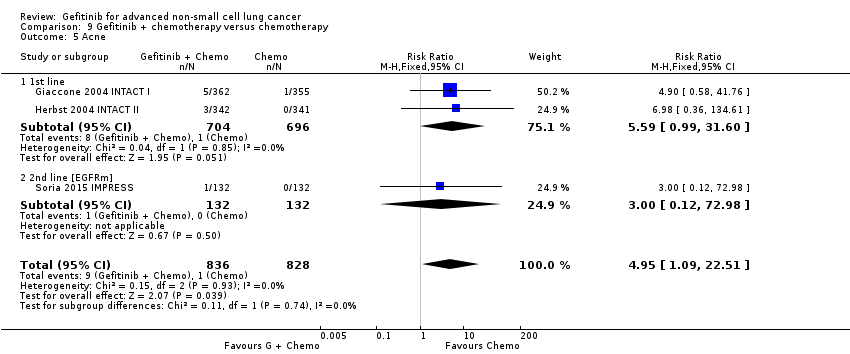
Comparison 9 Gefitinib + chemotherapy versus chemotherapy, Outcome 5 Acne.
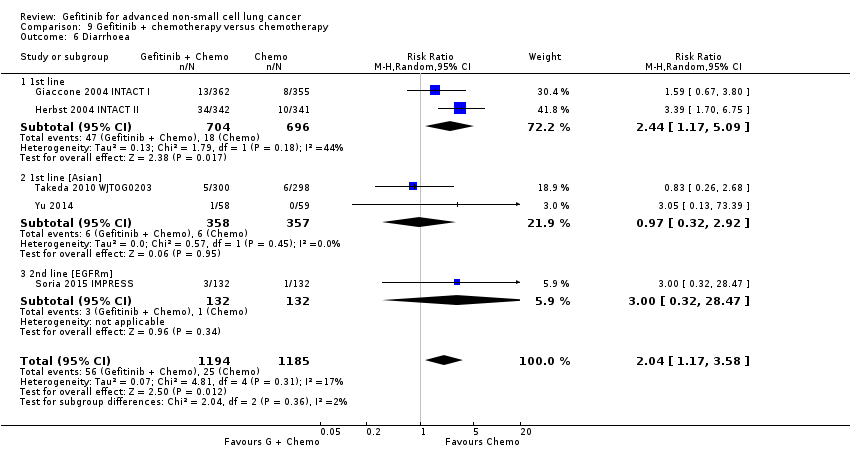
Comparison 9 Gefitinib + chemotherapy versus chemotherapy, Outcome 6 Diarrhoea.

Comparison 9 Gefitinib + chemotherapy versus chemotherapy, Outcome 7 Pruritus.

Comparison 9 Gefitinib + chemotherapy versus chemotherapy, Outcome 8 Vomiting.

Comparison 9 Gefitinib + chemotherapy versus chemotherapy, Outcome 9 Nausea.

Comparison 9 Gefitinib + chemotherapy versus chemotherapy, Outcome 10 Anorexia.

Comparison 9 Gefitinib + chemotherapy versus chemotherapy, Outcome 11 Asthenia.

Comparison 9 Gefitinib + chemotherapy versus chemotherapy, Outcome 12 Dyspnoea.

Comparison 9 Gefitinib + chemotherapy versus chemotherapy, Outcome 13 Anaemia.
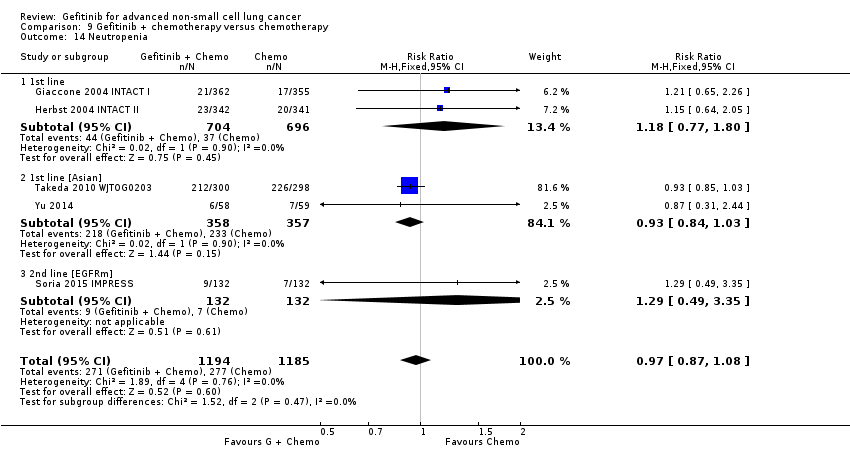
Comparison 9 Gefitinib + chemotherapy versus chemotherapy, Outcome 14 Neutropenia.

Comparison 9 Gefitinib + chemotherapy versus chemotherapy, Outcome 15 Leukopenia.

Comparison 9 Gefitinib + chemotherapy versus chemotherapy, Outcome 16 Overall response rate.
| Gefitinib compared to chemotherapy for first‐line treatment of advanced NSCLC | ||||||
| Patient or population: advanced NSCLC | ||||||
| Outcomes | Illustrative comparative risks* (95% CI) | Relative effect | No of participants | Quality of the evidence | Comments | |
| Assumed risk | Corresponding risk | |||||
| Chemotherapy | Gefitinib | |||||
| Overall survival (OS) | The mean OS ranged across control groups from 3.5 to 8 months | The mean OS in the intervention group ranged from 2.2 to 5.9 months | HR 0.98 (0.91 to 1.46) | 275 | ⊕⊕⊕⊝ | OS similar in the Asian (HR 0.94, 0.82 to 1.06) and EGFR mutation positive subgroups (HR 0.97, 0.77 to 1.21) |
| Progression‐free survival (PFS) | The PFS ranged across control groups from 2 to 2.9 months | The mean PFS in the intervention group ranged from 1.9 to 2.7 months | HR 1.19 (0.86 to 1.65) | 275 | ⊕⊕⊕⊝ | PFS improved with gefitinib in the Asian subgroup (HR 0.65, 0.43 to 0.98) and the EGFR mutation positive subgroup (HR 0.47, 0.36 to 0.61) |
| *The basis for the assumed risk (e.g. the median control group risk across studies) is provided in footnotes. The corresponding risk (and its 95% confidence interval) is based on the assumed risk in the comparison group and the relative effect of the intervention (and its 95% CI). | ||||||
| GRADE Working Group grades of evidence | ||||||
| 1We downgraded the quality of evidence by one level because of serious indirectness as one study included only elderly patients (> 70 years old). | ||||||
| Gefitinib compared to chemotherapy for second‐line treatment of advanced NSCLC | ||||||
| Patient or population: advanced NSCLC | ||||||
| Outcomes | Illustrative comparative risks* (95% CI) | Relative effect | No of participants | Quality of the evidence | Comments | |
| Assumed risk | Corresponding risk | |||||
| Chemotherapy | Gefitinib | |||||
| Overall survival (OS) | The mean OS ranged across control groups from 7.1 to 8 months | The mean OS in the intervention group ranged from 7.5 to 7.6 months | HR 1.02 (0.91 to 1.15) | 1607 | ⊕⊕⊕⊝ | OS similar in Asian patients (HR 0.94, 0.79 to 1.12) and EGFR mutation positive patients (HR 0.83, 0.41 to 1.66). |
| Progression‐free survival (PFS) | The mean PFS ranged across control groups from 2.7 to 3.4 months | The mean PFS in the intervention group ranged from 2.2 to 3 months | HR 1.04 (0.92 to 1.17) | 1607 | ⊕⊕⊕⊝ | PFS significantly improved in Asian patients (HR 0.71, 0.57 to 0.88) and in patients positive for EGFR mutation (HR 0.24, 0.12 to 0.47) (ranged from 2.7 to 4.1 months versus 4.5 to 7 months). |
| *The basis for the assumed risk (e.g. the median control group risk across studies) is provided in footnotes. The corresponding risk (and its 95% confidence interval) is based on the assumed risk in the comparison group and the relative effect of the intervention (and its 95% CI). | ||||||
| GRADE Working Group grades of evidence | ||||||
| 1We downgraded the quality of evidence by one level because of imprecision based on the wide confidence interval. | ||||||
| Gefitinib compared to chemotherapy for advanced NSCLC | |||||
| Patient or population: advanced NSCLC | |||||
| Outcomes | Illustrative comparative risks* (95% CI) | Relative effect | No of participants | Quality of the evidence | |
| Assumed risk | Corresponding risk | ||||
| Chemotherapy | Gefitinib | ||||
| Skin rash | Study population | RR 2.40 | 1858 | ⊕⊕⊕⊕ | |
| 9 per 1000 | 21 per 1000 | ||||
| Constipation | Study population | RR 0.41 | 1719 | ⊕⊕⊕⊕ | |
| 19 per 1000 | 8 per 1000 | ||||
| Fatigue | Study population | RR 0.16 | 275 | ⊕⊕⊕⊝ | |
| 65 per 1000 | 10 per 1000 | ||||
| Asthenia | Study population | RR 0.51 | 1773 | ⊕⊕⊕⊕ | |
| 79 per 1000 | 40 per 1000 | ||||
| Neurotoxicity | Study population | RR 0.07 | 1529 | ⊕⊕⊕⊕ | |
| 29 per 1000 | 2 per 1000 | ||||
| Neutropenia | Study population | RR 0.04 | 1857 | ⊕⊕⊕⊕ | |
| 505 per 1000 | 20 per 1000 | ||||
| Febrile neutropenia | Study population | RR 0.12 | 1768 | ⊕⊕⊕⊕ | |
| 92 per 1000 | 11 per 1000 | ||||
| *The basis for the assumed risk (e.g. the median control group risk across studies) is provided in footnotes. The corresponding risk (and its 95% confidence interval) is based on the assumed risk in the comparison group and the relative effect of the intervention (and its 95% CI). | |||||
| GRADE Working Group grades of evidence | |||||
| 1We downgraded the quality of evidence by one level because of serious indirectness as one study included only elderly patients (> 70 years old). | |||||
| Author/Year (Study name) | Journal | N | Comparison | Inclusion criteria | Phase | Asian | EGFR mutation | Line? |
| 1. Gefitinib versus placebo | ||||||||
| Goss 2009 (INSTEP) | JCO 27(13):2253‐2260 | 201 | Placebo | Poor PS | II | N | Subgroup | 1st line |
| Thatcher 2005 (ISEL) | Lancet 366:1527‐37 | 1692 | Placebo | — | III | Subset (Chang) | Subgroup (Hirsch) | 2nd line |
| Gaafar 2011 (EORTC08021) | Eur J Cancer (47):2331‐2340 | 173 | Placebo | Maintenance | III | N | N | Maintenance |
| Kelly 2008 (SWOGS0023) | JCO 26(15):2450‐2456 | 243 | Placebo | Consolidation | III | N | N | Maintenance |
| Zhang 2012 (INFORM) | Lancet Oncology 13:466‐475 | 296 | Placebo | Maintenance | III | Y | Subgroup | Maintenance |
| 2. Gefitinib versus chemotherapy | ||||||||
| Crino 2008 (INVITE) | JCO 26(26):4253‐4260 | 196 | Vinorelbine | Elderly patients | II | N | Subgroup | 1st line |
| Lou 2014 | Natl Med J China 94(30): 2337‐2341 | 51 | Carboplatin + paclitaxel | Asian | II | Y | N | 1st line |
| Morere 2010 (IFCT0301) | Lung Cancer 70:301‐307 | 85 | Docetaxel | Poor PS | II | N | N | 1st line |
| Han 2013 (First‐SIGNAL) | JCO 30(10): 1122‐1128 | 313 | Gemcitabine + cisplatin | — | III | Y | Planned Subgroup | 1st line |
| Mok 2009 (IPASS) | NEJM 361(10):947‐957 | 1217 | Carboplatin + paclitaxel | Asian, adenocarcinomas | III | Y | Subgroup | 1st line |
| Maemondo 2010 (NEJ002) | NEJM 362(25):2580‐2588 | 230 | Carboplatin + paclitaxel | Asian, EGFR mutation | III | Y | Y | 1st line |
| Mitsudomi 2010 (WJTOG3405) | Lancet Oncol 11:121‐128 | 177 | Cisplatin + docetaxel | Asian, EGFR mutation | III | Y | Y | 1st line |
| Yang 2014 | Eur J Cancer 50:2219‐2230 | 236 | Pemetrexed + cisplatin | Asian | III | Y | Subgroup | 1st line + maintenance |
| Cufer 2006 (SIGN) | Anti‐cancer Drugs 14:401‐409 | 141 | Docetaxel | Open‐label | II | N | N | 2nd line |
| Dai 2013 | Chin J Lung Cancer 16(8):405‐410 | 46 | Pemetrexed | Asian | II | Y | N | 2nd line |
| Kim 2016 | Cancer Res Treat 48(1):80‐87 | 95 | Pemetrexed | Asian | II | Y | N | 2nd/3rd line |
| Li 2010 | Chinese J Clin Onc 37:16‐18 | 98 | Docetaxel | Asian | II | Y | N | 2nd line |
| Kim 2008 (INTEREST) | Lancet 372:1809‐1818 | 1466 | Docetaxel | — | III | N | Subgroup (Doulliard) | 2nd line |
| Lee 2010 (ISTANA) | Clin Cancer Res 16(4):1307‐1314 | 161 | Docetaxel | Asian | III | Y | N | 2nd/3rd line |
| Maruyama 2008 (V‐15‐32) | JCO 26(26):4244‐4252 | 489 | Docetaxel | Asian | III | Y | Subgroup | 2nd/3rd line |
| Sun 2012 (KSCG‐LU08‐01) | Cancer 118:6234‐6242 | 141 | Pemetrexed | Adenocarcinoma, non‐smoker | III | Y | Subgroup | 2nd line |
| Ahn 2012 | Lung Cancer 77:346‐352 | 73 | Pemetrexed | Asian, never‐smokers | II | Y | N | Maintenance |
| Xu 2015 | Int J Clin Exp Med 8(4):6242‐6246 | 188 | Pemetrexed | Asian | II | Y | N | Maintenance |
| 3. Gefitinib 250 mg versus gefitinib 500 mg | ||||||||
| Fukuoka 2003 (IDEAL I) | JCO 21(12):2237‐2246 | 210 | G250 versus G500 | — | II | N | N | 2rd/3rd line |
| Kris 2003 (IDEAL II) | JAMA 290(16):2149‐2158 | 216 | G250 versus G500 | — | II | N | N | 3rd line |
| Xue 2015 | Int J Clin Exp Med 8(4):6242‐6246 | 188 | G250 versus G500 | Asian | II | Y | N | Maintenance |
| 4. Gefitinib versus gefitinib + chemotherapy | ||||||||
| An 2016 | Pathol Oncol Res 22:763‐768 | 90 | Gefitinib + Pemetrexed | Asian, EGFR mutation | II | Y | Y | 1st line |
| Cheng 2016 | JCO 34(27): 3258‐3266 | 191 | Gefitinib + Pemetrexed | Asian, EGFR mutation | II | Y | Y | 1st line |
| Chen 2007 | Cancer 109:1821‐8 | 48 | Gefitinib + Vinorelbine | Adenocarcinoma | II | N | Subgroup | 3rd line |
| Chen 2011 | J Thor Oncol 6:1110‐1116 | 115 | Gefitinib + Tegafur | Adenocarcinoma | II | Y | Subgroup | 2nd/3rd line |
| 5. Gefitinib + chemotherapy versus chemotherapy | ||||||||
| Giaccone 2004 (INTACT I) | JCO 22(5):777‐784 | 1093 | Gemcitabine + Cisplatin | — | III | N | N | 1st line |
| Herbst 2004 (INTACT II) | JCO 22(5):785‐794 | 1037 | Carboplatin + paclitaxel | — | III | N | N | 1st line |
| Takeda 2010 (WTOG0203) | JCO 28(5):753‐760 | 604 | Platinum doublet | — | III | Y | N | 1st line |
| Yu 2014 | Cancer Biology & Therapy 15:832‐839 | 117 | Pemetrexed + platinum | Asian | II | Y | N | 1st line |
| Soria 2015 (IMPRESS) | Lancet Oncology 16:990‐98 | 265 | Pemetrexed + cisplatin | EGFR mutation positive | III | N | Y | 2nd line |
| EGFR: epidermal growth factor receptor Journals: Cancer Res Treat: Cancer Research and Treatment | ||||||||
| Study | ORR (%) | PFS (months) | OS (months) | ||||||
| 1. Gefitinib versus placebo | Gefitinib | Control | P | Gefitinib | Control | P | Gefitinib | Control | P |
| 1st line | |||||||||
| Goss 2009 | 6 | 1.0 | NS | 1.43 | 1.37 | NS | 3.7 | 2.8 | NS |
| 2nd line | |||||||||
| Thatcher 2005 ISEL | 37.5 | 48.3 | NS | 3 | 2.6 | 0.0006 | 5.6 | 5.1 | 0.087 |
| Maintenance therapy | |||||||||
| Kelly 2008 SWOGS0023 | ‐ | ‐ | ‐ | 8.3 | 11.7 | NS | 23 | 35 | 0.013 |
| Gaafar 2011 EORTC08021 | 12 | 1 | 0.004 | 4.1 | 2.9 | 0.0015 | 10.9 | 9.4 | NS |
| 2. Gefitinib versus placebo (Asian population) | Gefitinib | Control | P | Gefitinib | Control | P | Gefitinib | Control | P |
| Chang 2006 ISEL | 12.4 | 2.1 | 0.01 | 4.4 | 2.2 | 0.008 | 9.5 | 5.5 | 0.01 |
| Zhang 2012 INFORM | 24 | 1 | 0.0001 | 4.8 | 2.6 | < 0.0001 | 18.7 | 16.0 | NS |
| 3. Gefitinib versus placebo (EGFR mutation positive) | Gefitinib | Control | P | Gefitinib | Control | P | Gefitinib | Control | P |
| Zhang 2012 INFORM | ‐ | ‐ | ‐ | 16.6 | 2.8 | 0.0063 | 46.87 | 20.97 | 0.036 |
| Gefitinib vs chemotherapy | |||||||||
| 4. General population | Gefitinib | Chemo | P | Gefitinib | Chemo | P | Gefitinib | Chemo | P |
| versus 1st line chemotherapy | |||||||||
| Crino 2008 INVITE | 3.1 | 5.1 | ‐ | 2.7 | 2.9 | NS | 5.9 | 8 | NS |
| Morere 2010 IFCT0301 | ‐ | ‐ | ‐ | 1.9 | 2 | 0.078 | 2.2 | 3.5 | 0.088 |
| Morere 2010 IFCT0301 (Adenocarcinoma) | ‐ | ‐ | ‐ | 1.9 | 2.1 | 0.272 | 2.3 | 4.4 | NS |
| versus 2nd line chemotherapy | |||||||||
| Cufer 2006 SIGN | 13.2 | 13.7 | NS | 7.5 | 7.1 | NS | 3 | 3.4 | NS |
| Kim 2008 INTEREST | 9.1 | 7.6 | NS | 2.2 | 2.7 | NS | 7.6 | 8 | NS |
| Kim 2008 INTEREST | ‐ | ‐ | ‐ | ‐ | ‐ | ‐ | 8.5 | 8.9 | NS |
| 5. Asian population | Gefitinib | Chemo | P | Gefitinib | Chemo | P | Gefitinib | Chemo | P |
| versus 1st line chemotherapy | |||||||||
| Lou 2014 | 36 | 42.3 | NS | 4.2 | 8.3 | NS | 14.4 | 15 | NS |
| Maemondo 2010 (EGFR mutation positive) | 73.7 | 30.7 | < 0.001 | 10.8 | 5.4 | < 0.001 | 30.5 | 23.6 | NS |
| Mitsudomi 2010 WJTOG (EGFR mutation positive) | 62.1 | 32.2 | < 0.0001 | 9.2 | 6.3 | < 0.0001 | ‐ | ‐ | ‐ |
| Mok 2009 IPASS | 43 | 32.2 | < 0.001 | 5.7 | 5.8 | NS | 18.6 | 17.3 | NS |
| Han 2012 First‐SIGNAL (adenocarcinoma) | 55.4 | 46 | NS | 5.8 | 6.4 | NS | 22.3 | 22.9 | NS |
| Yang 2014 (Asian) | 47.5 | 41.5 | NS | 9.63 | 8.38 | NS | 27.9 | 26.9 | NS |
| versus 2nd line chemotherapy | |||||||||
| Dai 2013 | 17.4 | 13 | NS | 4.4 | 3.1 | NS | ‐ | ‐ | ‐ |
| Kim 2016 | 8 | 13 | NS | 2 | 2 | NS | 8.5 | 8.5 | NS |
| Li 2010 | 22.4 | 18.8 | NS | ‐ | ‐ | ‐ | 7.1 | 6.9 | NS |
| Kim 2008 INTEREST (subgroup) | ‐ | ‐ | ‐ | ‐ | ‐ | ‐ | 10.4 | 12.2 | NS |
| Lee 2010 ISTANA | 28.1 | 7.6 | 0.0007 | 3.3 | 3.4 | NS | 14.1 | 12.2 | NS |
| Maruyama 2008 V‐15‐32 | 22.5 | 12.8 | 0.009 | 2 | 2 | NS | 11.5 | 14 | NS |
| Sun 2012 KCSG‐LU08‐01 (adenocarcinoma, subgroup) | 58.8 | 22.4 | < 0.001 | 9.0 | 3.0 | 0.0006 | 22.2 | 18.9 | NS |
| versus maintenance therapy | |||||||||
| Ahn 2012 (Asian) | 46 | 35 | NS | 9.95 | 6.83 | NS | ‐ | ‐ | ‐ |
| Xu 2015 (Asian) | 18.1 | 29.8 | NS | ‐ | ‐ | ‐ | ‐ | ‐ | ‐ |
| 6. EGFR mutation positive | Gefitinib | Chemo | P | Gefitinib | Chemo | P | Gefitinib | Chemo | P |
| versus 1st line chemotherapy | |||||||||
| Maemondo 2010 (EGFR mutation positive) | 73.7 | 30.7 | < 0.001 | 10.8 | 5.4 | < 0.001 | 30.5 | 23.6 | NS |
| Mitsudomi 2010 WJTOG (EGFR mutation positive) | 62.1 | 32.2 | < 0.0001 | 9.2 | 6.3 | < 0.0001 | ‐ | ‐ | ‐ |
| Mok 2009 IPASS (subgroup) | 71.2 | 47.3 | < 0.001 | ‐ | ‐ | ‐ | ‐ | ‐ | ‐ |
| Han 2012 First‐SIGNAL (subgroup) | 84.6 | 37.5 | 0.002 | ‐ | ‐ | ‐ | ‐ | ‐ | ‐ |
| Yang 2014 (subgroup) | 70.8 | 65.4 | NS | 16.62 | 12.91 | NS | 45.7 | 32.4 | 0.255 |
| versus 2nd line chemotherapy | |||||||||
| INTEREST Doulliard 2010 (subgroup) | 42.1 | 21.1 | 0.04 | 7 | 4.1 | 0.001 | 14.2 | 16.6 | NS |
| Maruyama 2008 (subgroup) | 67 | 46 | ‐ | ‐ | ‐ | ‐ | ‐ | ‐ | ‐ |
| Sun 2012 KCSG‐LU08‐01 (subgroup) | ‐ | ‐ | ‐ | 15.7 | 2.9 | 0.005 | ‐ | ‐ | ‐ |
| 7. Gefitinib 250 mg versus gefitinib 500 mg | 250 mg | 500 mg | P | 250 mg | 500 mg | P | 250 mg | 500 mg | P |
| 2nd+ line | |||||||||
| Fukuoka 2003 | 18.4 | 19 | NS | 2.7 | 2.8 | NS | 7.6 | 8 | NS |
| Kris 2004 | 12 | 9 | NS | ‐ | ‐ | ‐ | 7 | 6 | NS |
| Maintenance therapy | |||||||||
| Xue 2015 (Asian) | 12.5 | 12.5 | NS | ‐ | ‐ | ‐ | ‐ | ‐ | ‐ |
| 8. Gefitinib versus gefitinib + chemotherapy | Gefitinib | G + Chemo | P | Gefitinib | G + Chemo | P | Gefitinib | G + Chemo | P |
| 1st line | |||||||||
| An 2016 | 73.33 | 80 | NS | 14 | 18 | < 0.05 | 32 | 34 | NS |
| Cheng 2016 | 74 | 80 | NS | 10.9 | 15.8 | 0.014 | ‐ | ‐ | ‐ |
| 2nd+ line | |||||||||
| Chen 2007(Asian, adenocarcinoma) | 55.6 | 52.4 | NS | 7.1 | 12.8 | NS | 13.3 | 23.4 | NS |
| Chen 2011(Asian, adenocarcinoma) | 35 | 37 | NS | 5.3 | 8.3 | 0.04 | ‐ | ‐ | ‐ |
| Chen 2011 (EGFR mutation positive subgroup) | ‐ | ‐ | ‐ | 7.6 | 14.4 | 0.0061 | ‐ | ‐ | ‐ |
| 9. Gefitinib + chemotherapy versus chemotherapy | 250 mg + Chemo | Chemo | P | 250 mg + Chemo | Chemo | P | 250 mg + Chemo | Chemo | P |
| 1st line | |||||||||
| Giaccone 2004 | 51.2 | 47.2 | NS | 5.8 | 6 | NS | 9.9 | 10.9 | NS |
| Herbst 2004 | 30.4 | 28.7 | NS | 5.3 | 5 | NS | 9.8 | 9.9 | NS |
| Takeda 2010 (Asian) | 34.2 | 29.3 | NS | 4.3 | 4.6 | < 0.001 | 12.9 | 13.7 | NS |
| Yu 2014 (Asian) | 47.4 | 50 | NS | 7.9 | 7 | NS | 25.4 | 20.5 | NS |
| 2nd line | |||||||||
| Soria 2015 IMPRESS (EGFR mutation positive) | 32 | 34 | NS | 5.4 | 5.4 | NS | 14.8 | 17.2 | NS |
| Chemo: chemotherapy | |||||||||
| Outcome or subgroup title | No. of studies | No. of participants | Statistical method | Effect size |
| 1 HR Overall survival Show forest plot | 4 | Hazard Ratio (Random, 95% CI) | Subtotals only | |
| 1.1 G(250) vs P = 1st line | 1 | Hazard Ratio (Random, 95% CI) | 0.84 [0.62, 1.14] | |
| 1.2 G(250) vs P = 2nd line | 1 | Hazard Ratio (Random, 95% CI) | 0.89 [0.79, 1.01] | |
| 1.3 G(500) vs P = Maintenance | 2 | Hazard Ratio (Random, 95% CI) | 1.14 [0.61, 2.14] | |
| 2 HR Progression‐free survival Show forest plot | 4 | Hazard Ratio (Random, 95% CI) | Subtotals only | |
| 2.1 G(250) vs P = 1st line | 1 | Hazard Ratio (Random, 95% CI) | 0.82 [0.60, 1.12] | |
| 2.2 G(250) vs P = 2nd line | 1 | Hazard Ratio (Random, 95% CI) | 0.82 [0.75, 0.90] | |
| 2.3 G(500) vs P = Maintenance | 2 | Hazard Ratio (Random, 95% CI) | 0.70 [0.53, 0.91] | |
| 3 1‐year survival rate Show forest plot | 2 | Risk Ratio (M‐H, Fixed, 95% CI) | Subtotals only | |
| 3.1 G(250) vs P = 2nd line | 1 | 1439 | Risk Ratio (M‐H, Fixed, 95% CI) | 1.28 [1.05, 1.57] |
| 3.2 G(500) vs P = Maintenance | 1 | 243 | Risk Ratio (M‐H, Fixed, 95% CI) | 0.90 [0.78, 1.04] |
| 4 Skin rash Show forest plot | 3 | 2060 | Risk Ratio (M‐H, Fixed, 95% CI) | 7.92 [1.46, 43.03] |
| 4.1 G(250) vs P = 1st line | 1 | 201 | Risk Ratio (M‐H, Fixed, 95% CI) | 0.0 [0.0, 0.0] |
| 4.2 G(250) vs P = 2nd line | 1 | 1688 | Risk Ratio (M‐H, Fixed, 95% CI) | 8.98 [1.20, 67.13] |
| 4.3 G(250) vs P = Maintenance | 1 | 171 | Risk Ratio (M‐H, Fixed, 95% CI) | 5.06 [0.25, 103.82] |
| 5 Pruritus Show forest plot | 2 | 1889 | Risk Ratio (M‐H, Fixed, 95% CI) | 2.00 [0.22, 17.82] |
| 5.1 G(250) vs P = 1st line | 1 | 201 | Risk Ratio (M‐H, Fixed, 95% CI) | 0.0 [0.0, 0.0] |
| 5.2 G(250) vs P = 2nd line | 1 | 1688 | Risk Ratio (M‐H, Fixed, 95% CI) | 2.00 [0.22, 17.82] |
| 6 Diarrhoea Show forest plot | 3 | 2060 | Risk Ratio (M‐H, Fixed, 95% CI) | 2.48 [1.15, 5.35] |
| 6.1 G(250) vs P = 1st line | 1 | 201 | Risk Ratio (M‐H, Fixed, 95% CI) | 1.01 [0.21, 4.89] |
| 6.2 G(250) vs P = 2nd line | 1 | 1688 | Risk Ratio (M‐H, Fixed, 95% CI) | 3.09 [1.21, 7.91] |
| 6.3 G(250) vs P = Maintenance | 1 | 171 | Risk Ratio (M‐H, Fixed, 95% CI) | 3.03 [0.13, 73.47] |
| 7 Constipation Show forest plot | 1 | 201 | Risk Ratio (M‐H, Fixed, 95% CI) | 1.01 [0.06, 15.93] |
| 7.1 G(250) vs P = 1st line | 1 | 201 | Risk Ratio (M‐H, Fixed, 95% CI) | 1.01 [0.06, 15.93] |
| 8 Nausea Show forest plot | 2 | 1889 | Risk Ratio (M‐H, Random, 95% CI) | 0.65 [0.03, 12.44] |
| 8.1 G(250) vs P = 1st line | 1 | 201 | Risk Ratio (M‐H, Random, 95% CI) | 0.11 [0.01, 2.06] |
| 8.2 G(250) vs P = 2nd line | 1 | 1688 | Risk Ratio (M‐H, Random, 95% CI) | 2.25 [0.49, 10.36] |
| 9 Vomiting Show forest plot | 2 | 1859 | Risk Ratio (M‐H, Fixed, 95% CI) | 3.21 [0.83, 12.38] |
| 9.1 G(250) vs P = 2nd line | 1 | 1688 | Risk Ratio (M‐H, Fixed, 95% CI) | 3.24 [0.73, 14.33] |
| 9.2 G(250) vs P = Maintenance | 1 | 171 | Risk Ratio (M‐H, Fixed, 95% CI) | 3.03 [0.13, 73.47] |
| 10 Anorexia Show forest plot | 3 | 2060 | Risk Ratio (M‐H, Fixed, 95% CI) | 1.22 [0.64, 2.33] |
| 10.1 G(250) vs P = 1st line | 1 | 201 | Risk Ratio (M‐H, Fixed, 95% CI) | 5.05 [0.25, 103.87] |
| 10.2 G(250) vs P = 2nd line | 1 | 1688 | Risk Ratio (M‐H, Fixed, 95% CI) | 1.18 [0.59, 2.37] |
| 10.3 G(250) vs P = Maintenance | 1 | 171 | Risk Ratio (M‐H, Fixed, 95% CI) | 0.34 [0.01, 8.16] |
| 11 Fatigue Show forest plot | 2 | Risk Ratio (M‐H, Fixed, 95% CI) | Subtotals only | |
| 11.1 G(250) vs P = 1st line | 1 | 201 | Risk Ratio (M‐H, Fixed, 95% CI) | 0.76 [0.27, 2.10] |
| 11.2 G(250) vs P = Maintenance | 1 | 171 | Risk Ratio (M‐H, Fixed, 95% CI) | 4.05 [0.46, 35.47] |
| 12 Asthenia Show forest plot | 1 | Risk Ratio (M‐H, Fixed, 95% CI) | Subtotals only | |
| 12.1 G(250) vs P = 2nd line | 1 | 1688 | Risk Ratio (M‐H, Fixed, 95% CI) | 1.20 [0.66, 2.17] |
| 13 Respiratory tract infection Show forest plot | 2 | 1889 | Risk Ratio (M‐H, Random, 95% CI) | 0.53 [0.07, 3.83] |
| 13.1 G(250) vs P = 1st line | 1 | 201 | Risk Ratio (M‐H, Random, 95% CI) | 0.11 [0.01, 2.06] |
| 13.2 G(250) vs P = 2nd line | 1 | 1688 | Risk Ratio (M‐H, Random, 95% CI) | 1.00 [0.54, 1.84] |
| 14 Dyspnoea Show forest plot | 3 | 2060 | Risk Ratio (M‐H, Random, 95% CI) | 0.98 [0.59, 1.63] |
| 14.1 G(250) vs P = 1st line | 1 | 201 | Risk Ratio (M‐H, Random, 95% CI) | 1.85 [0.71, 4.81] |
| 14.2 G(250) vs P = 2nd line | 1 | 1688 | Risk Ratio (M‐H, Random, 95% CI) | 0.83 [0.49, 1.42] |
| 14.3 G(250) vs P = Maintenance | 1 | 171 | Risk Ratio (M‐H, Random, 95% CI) | 0.67 [0.20, 2.31] |
| 15 Anaemia Show forest plot | 1 | 201 | Risk Ratio (M‐H, Fixed, 95% CI) | 7.07 [0.37, 135.12] |
| 15.1 G(250) vs P = 1st line | 1 | 201 | Risk Ratio (M‐H, Fixed, 95% CI) | 7.07 [0.37, 135.12] |
| 16 Abdominal pain Show forest plot | 1 | 201 | Risk Ratio (M‐H, Fixed, 95% CI) | 0.51 [0.05, 5.48] |
| 16.1 G(250) vs P = 1st line | 1 | 201 | Risk Ratio (M‐H, Fixed, 95% CI) | 0.51 [0.05, 5.48] |
| 17 Increased ALT Show forest plot | 1 | 171 | Risk Ratio (M‐H, Fixed, 95% CI) | 9.11 [1.18, 70.32] |
| 17.1 G(250) vs P = Maintenance | 1 | 171 | Risk Ratio (M‐H, Fixed, 95% CI) | 9.11 [1.18, 70.32] |
| 18 Increased AST Show forest plot | 1 | 171 | Risk Ratio (M‐H, Fixed, 95% CI) | 7.08 [0.89, 56.34] |
| 18.1 G(250) vs P = Maintenance | 1 | 171 | Risk Ratio (M‐H, Fixed, 95% CI) | 7.08 [0.89, 56.34] |
| 19 Neutropenia Show forest plot | 1 | 171 | Risk Ratio (M‐H, Fixed, 95% CI) | 3.03 [0.13, 73.47] |
| 19.1 G(250) vs P = Maintenance | 1 | 171 | Risk Ratio (M‐H, Fixed, 95% CI) | 3.03 [0.13, 73.47] |
| 20 Anaemia Show forest plot | 1 | 171 | Risk Ratio (M‐H, Fixed, 95% CI) | 0.20 [0.01, 4.15] |
| 20.1 G(250) vs P = Maintenance | 1 | 171 | Risk Ratio (M‐H, Fixed, 95% CI) | 0.20 [0.01, 4.15] |
| 21 Thrombocytopaenia Show forest plot | 1 | 171 | Risk Ratio (M‐H, Fixed, 95% CI) | 3.03 [0.13, 73.47] |
| 21.1 G(250) vs P = Maintenance | 1 | 171 | Risk Ratio (M‐H, Fixed, 95% CI) | 3.03 [0.13, 73.47] |
| 22 Overall response rate Show forest plot | 3 | Risk Ratio (M‐H, Fixed, 95% CI) | Subtotals only | |
| 22.1 G(250) vs P = 1st line | 1 | 201 | Risk Ratio (M‐H, Fixed, 95% CI) | 6.06 [0.74, 49.43] |
| 22.2 G(250) vs P= 2nd line | 1 | 1439 | Risk Ratio (M‐H, Fixed, 95% CI) | 6.42 [2.82, 14.64] |
| 22.3 G(250) vs P = Maintenance | 1 | 173 | Risk Ratio (M‐H, Fixed, 95% CI) | 10.12 [1.32, 77.33] |
| 23 Disease control rate Show forest plot | 3 | Risk Ratio (M‐H, Fixed, 95% CI) | Subtotals only | |
| 23.1 G(250) vs P = 1st line | 1 | 201 | Risk Ratio (M‐H, Fixed, 95% CI) | 1.36 [0.86, 2.16] |
| 23.2 G(250) vs P = 2nd line | 1 | 1439 | Risk Ratio (M‐H, Fixed, 95% CI) | 1.24 [1.06, 1.44] |
| 23.3 G(250) vs P = Maintenance | 1 | 173 | Risk Ratio (M‐H, Fixed, 95% CI) | 1.21 [1.00, 1.46] |
| Outcome or subgroup title | No. of studies | No. of participants | Statistical method | Effect size |
| 1 HR Overall survival Show forest plot | 2 | Hazard Ratio (Fixed, 95% CI) | Subtotals only | |
| 1.1 G(250) vs P = 2nd line | 1 | Hazard Ratio (Fixed, 95% CI) | 0.66 [0.48, 0.91] | |
| 1.2 G(250) vs P = Maintenance | 1 | Hazard Ratio (Fixed, 95% CI) | 0.88 [0.68, 1.14] | |
| 2 HR Progression‐free survival Show forest plot | 2 | Hazard Ratio (Fixed, 95% CI) | Subtotals only | |
| 2.1 G(250) vs P = 2nd line | 1 | Hazard Ratio (Fixed, 95% CI) | 0.69 [0.52, 0.91] | |
| 2.2 G(250) vs P = Maintenance | 1 | Hazard Ratio (Fixed, 95% CI) | 0.42 [0.33, 0.54] | |
| 3 1‐year survival rate Show forest plot | 1 | Risk Ratio (M‐H, Fixed, 95% CI) | Subtotals only | |
| 3.1 G(250) vs P = 2nd line | 1 | 342 | Risk Ratio (M‐H, Fixed, 95% CI) | 1.75 [1.20, 2.55] |
| 4 Overall response rate Show forest plot | 2 | Risk Ratio (M‐H, Random, 95% CI) | Subtotals only | |
| 4.1 G(250) vs P = 2nd line | 1 | 306 | Risk Ratio (M‐H, Random, 95% CI) | 6.03 [1.46, 24.91] |
| 4.2 G(250) vs P = Maintenance | 1 | 296 | Risk Ratio (M‐H, Random, 95% CI) | 35.00 [4.86, 252.15] |
| Outcome or subgroup title | No. of studies | No. of participants | Statistical method | Effect size |
| 1 HR Overall survival Show forest plot | 1 | Hazard Ratio (Fixed, 95% CI) | Subtotals only | |
| 1.1 G(250) vs P = Maintenance | 1 | Hazard Ratio (Fixed, 95% CI) | 0.39 [0.15, 0.98] | |
| 2 HR Progression‐free survival Show forest plot | 1 | Hazard Ratio (Fixed, 95% CI) | Subtotals only | |
| 2.1 G(250) vs P = Maintenance | 1 | Hazard Ratio (Fixed, 95% CI) | 0.17 [0.07, 0.41] | |
| Outcome or subgroup title | No. of studies | No. of participants | Statistical method | Effect size |
| 1 HR Overall survival Show forest plot | 2 | Hazard Ratio (Fixed, 95% CI) | Subtotals only | |
| 1.1 G vs vinorelbine = 1st line | 1 | Hazard Ratio (Fixed, 95% CI) | 0.98 [0.66, 1.46] | |
| 1.2 G vs docetaxel = 2nd line | 1 | Hazard Ratio (Fixed, 95% CI) | 1.02 [0.91, 1.15] | |
| 2 HR Progression‐free survival Show forest plot | 2 | Hazard Ratio (Fixed, 95% CI) | Subtotals only | |
| 2.1 G vs vinorelbine = 1st line | 1 | Hazard Ratio (Fixed, 95% CI) | 1.19 [0.86, 1.65] | |
| 2.2 G vs docetaxel = 2nd line | 1 | Hazard Ratio (Fixed, 95% CI) | 1.04 [0.92, 1.17] | |
| 3 1‐year survival rate Show forest plot | 3 | 1741 | Risk Ratio (M‐H, Fixed, 95% CI) | 0.94 [0.82, 1.08] |
| 3.1 G vs vinorelbine = 1st line | 1 | 190 | Risk Ratio (M‐H, Fixed, 95% CI) | 1.02 [0.69, 1.52] |
| 3.2 G vs docetaxel = 1st line | 1 | 85 | Risk Ratio (M‐H, Fixed, 95% CI) | 0.39 [0.08, 1.90] |
| 3.3 G vs docetaxel = 2nd line | 1 | 1466 | Risk Ratio (M‐H, Fixed, 95% CI) | 0.94 [0.82, 1.09] |
| 4 Skin rash Show forest plot | 4 | 1858 | Risk Ratio (M‐H, Fixed, 95% CI) | 2.40 [1.08, 5.31] |
| 4.1 G vs vinorelbine = 1st line | 1 | 190 | Risk Ratio (M‐H, Fixed, 95% CI) | 5.11 [0.25, 104.94] |
| 4.2 G vs docetaxel = 1st line | 1 | 85 | Risk Ratio (M‐H, Fixed, 95% CI) | 0.49 [0.05, 5.19] |
| 4.3 G vs docetaxel = 2nd line | 2 | 1583 | Risk Ratio (M‐H, Fixed, 95% CI) | 2.82 [1.11, 7.13] |
| 5 Constipation Show forest plot | 3 | 1719 | Risk Ratio (M‐H, Fixed, 95% CI) | 0.41 [0.17, 0.97] |
| 5.1 G vs vinorelbine = 1st line | 1 | 190 | Risk Ratio (M‐H, Fixed, 95% CI) | 0.20 [0.01, 4.20] |
| 5.2 G vs docetaxel = 1st line | 1 | 85 | Risk Ratio (M‐H, Fixed, 95% CI) | 0.33 [0.01, 7.78] |
| 5.3 G vs docetaxel = 2nd line | 1 | 1444 | Risk Ratio (M‐H, Fixed, 95% CI) | 0.45 [0.17, 1.18] |
| 6 Fatigue Show forest plot | 2 | 275 | Risk Ratio (M‐H, Fixed, 95% CI) | 0.16 [0.03, 0.88] |
| 6.1 G vs vinorelbine = 1st line | 1 | 190 | Risk Ratio (M‐H, Fixed, 95% CI) | 0.07 [0.00, 1.18] |
| 6.2 G vs docetaxel = 1st line | 1 | 85 | Risk Ratio (M‐H, Fixed, 95% CI) | 0.49 [0.05, 5.19] |
| 7 Asthenia Show forest plot | 3 | 1773 | Risk Ratio (M‐H, Fixed, 95% CI) | 0.51 [0.35, 0.75] |
| 7.1 G vs vinorelbine = 1st line | 1 | 190 | Risk Ratio (M‐H, Fixed, 95% CI) | 0.15 [0.01, 2.79] |
| 7.2 G vs docetaxel = 2nd line | 2 | 1583 | Risk Ratio (M‐H, Fixed, 95% CI) | 0.53 [0.36, 0.78] |
| 8 Neurotoxicity Show forest plot | 2 | 1529 | Risk Ratio (M‐H, Fixed, 95% CI) | 0.07 [0.01, 0.34] |
| 8.1 G vs docetaxel = 1st line | 1 | 85 | Risk Ratio (M‐H, Fixed, 95% CI) | 0.09 [0.01, 1.56] |
| 8.2 G vs docetaxel = 2nd line | 1 | 1444 | Risk Ratio (M‐H, Fixed, 95% CI) | 0.06 [0.01, 0.43] |
| 9 Neutropenia Show forest plot | 4 | 1857 | Risk Ratio (M‐H, Fixed, 95% CI) | 0.04 [0.02, 0.06] |
| 9.1 G vs vinorelbine = 1st line | 1 | 190 | Risk Ratio (M‐H, Fixed, 95% CI) | 0.03 [0.00, 0.43] |
| 9.2 G vs docetaxel = 1st line | 1 | 85 | Risk Ratio (M‐H, Fixed, 95% CI) | 0.15 [0.04, 0.63] |
| 9.3 G vs docetaxel = 2nd line | 2 | 1582 | Risk Ratio (M‐H, Fixed, 95% CI) | 0.04 [0.02, 0.06] |
| 10 Leukopenia Show forest plot | 2 | 324 | Risk Ratio (M‐H, Fixed, 95% CI) | 0.03 [0.00, 0.22] |
| 10.1 G vs vinorelbine = 1st line | 1 | 190 | Risk Ratio (M‐H, Fixed, 95% CI) | 0.07 [0.00, 1.18] |
| 10.2 G vs docetaxel = 2nd line | 1 | 134 | Risk Ratio (M‐H, Fixed, 95% CI) | 0.02 [0.00, 0.32] |
| 11 Febrile neutropenia Show forest plot | 3 | 1768 | Risk Ratio (M‐H, Fixed, 95% CI) | 0.12 [0.06, 0.23] |
| 11.1 G vs vinorelbine = 1st line | 1 | 190 | Risk Ratio (M‐H, Fixed, 95% CI) | 0.07 [0.00, 1.18] |
| 11.2 G vs docetaxel = 2nd line | 2 | 1578 | Risk Ratio (M‐H, Fixed, 95% CI) | 0.13 [0.06, 0.24] |
| 12 Pruritus Show forest plot | 1 | 139 | Risk Ratio (M‐H, Fixed, 95% CI) | 5.22 [0.26, 106.74] |
| 12.1 G vs docetaxel = 2nd line | 1 | 139 | Risk Ratio (M‐H, Fixed, 95% CI) | 5.22 [0.26, 106.74] |
| 13 Diarrhoea Show forest plot | 4 | 1858 | Risk Ratio (M‐H, Fixed, 95% CI) | 0.81 [0.48, 1.34] |
| 13.1 G vs vinorelbine = 1st line | 1 | 190 | Risk Ratio (M‐H, Fixed, 95% CI) | 1.02 [0.26, 3.96] |
| 13.2 G vs docetaxel = 1st line | 1 | 85 | Risk Ratio (M‐H, Fixed, 95% CI) | 0.98 [0.14, 6.62] |
| 13.3 G vs docetaxel = 2nd line | 2 | 1583 | Risk Ratio (M‐H, Fixed, 95% CI) | 0.76 [0.43, 1.35] |
| 14 Vomiting Show forest plot | 2 | 1583 | Risk Ratio (M‐H, Fixed, 95% CI) | 0.55 [0.19, 1.63] |
| 14.1 G vs docetaxel = 2nd line | 2 | 1583 | Risk Ratio (M‐H, Fixed, 95% CI) | 0.55 [0.19, 1.63] |
| 15 Anorexia Show forest plot | 3 | 1719 | Risk Ratio (M‐H, Fixed, 95% CI) | 1.43 [0.61, 3.32] |
| 15.1 G vs vinorelbine = 1st line | 1 | 190 | Risk Ratio (M‐H, Fixed, 95% CI) | 1.02 [0.15, 7.10] |
| 15.2 G vs docetaxel = 1st line | 1 | 85 | Risk Ratio (M‐H, Fixed, 95% CI) | 0.0 [0.0, 0.0] |
| 15.3 G vs docetaxel = 2nd line | 1 | 1444 | Risk Ratio (M‐H, Fixed, 95% CI) | 1.54 [0.60, 3.95] |
| 16 Stomatitis Show forest plot | 1 | 1444 | Risk Ratio (M‐H, Fixed, 95% CI) | 0.14 [0.01, 2.71] |
| 16.1 G vs docetaxel = 2nd line | 1 | 1444 | Risk Ratio (M‐H, Fixed, 95% CI) | 0.14 [0.01, 2.71] |
| 17 Arthralgia/myalgia Show forest plot | 2 | 1529 | Risk Ratio (M‐H, Fixed, 95% CI) | 0.25 [0.03, 2.19] |
| 17.1 G vs docetaxel = 1st line | 1 | 85 | Risk Ratio (M‐H, Fixed, 95% CI) | 0.0 [0.0, 0.0] |
| 17.2 G vs docetaxel = 2nd line | 1 | 1444 | Risk Ratio (M‐H, Fixed, 95% CI) | 0.25 [0.03, 2.19] |
| 18 Peripheral oedema Show forest plot | 2 | 1634 | Risk Ratio (M‐H, Fixed, 95% CI) | 0.09 [0.00, 1.61] |
| 18.1 G vs vinorelbine = 1st line | 1 | 190 | Risk Ratio (M‐H, Fixed, 95% CI) | 0.0 [0.0, 0.0] |
| 18.2 G vs docetaxel = 2nd line | 1 | 1444 | Risk Ratio (M‐H, Fixed, 95% CI) | 0.09 [0.00, 1.61] |
| 19 Respiratory tract infection Show forest plot | 1 | 1444 | Risk Ratio (M‐H, Fixed, 95% CI) | 0.90 [0.52, 1.57] |
| 19.1 G vs docetaxel = 2nd line | 1 | 1444 | Risk Ratio (M‐H, Fixed, 95% CI) | 0.90 [0.52, 1.57] |
| 20 Dyspnoea Show forest plot | 3 | 1773 | Risk Ratio (M‐H, Fixed, 95% CI) | 0.82 [0.57, 1.16] |
| 20.1 G vs vinorelbine = 1st line | 1 | 190 | Risk Ratio (M‐H, Fixed, 95% CI) | 0.26 [0.03, 2.24] |
| 20.2 G vs docetaxel = 2nd line | 2 | 1583 | Risk Ratio (M‐H, Fixed, 95% CI) | 0.85 [0.59, 1.22] |
| 21 Cough Show forest plot | 2 | 1583 | Risk Ratio (M‐H, Fixed, 95% CI) | 1.18 [0.36, 3.84] |
| 21.1 G vs docetaxel = 2nd line | 2 | 1583 | Risk Ratio (M‐H, Fixed, 95% CI) | 1.18 [0.36, 3.84] |
| 22 Anaemia Show forest plot | 4 | 1853 | Risk Ratio (M‐H, Fixed, 95% CI) | 0.70 [0.36, 1.36] |
| 22.1 G vs vinorelbine = 1st line | 1 | 190 | Risk Ratio (M‐H, Fixed, 95% CI) | 0.34 [0.01, 8.25] |
| 22.2 G vs docetaxel = 1st line | 1 | 85 | Risk Ratio (M‐H, Fixed, 95% CI) | 0.14 [0.01, 2.62] |
| 22.3 G vs docetaxel = 2nd line | 2 | 1578 | Risk Ratio (M‐H, Fixed, 95% CI) | 0.86 [0.42, 1.75] |
| 23 Thrombocytopenia Show forest plot | 2 | 219 | Risk Ratio (M‐H, Fixed, 95% CI) | 3.0 [0.12, 72.35] |
| 23.1 G vs docetaxel = 1st line | 1 | 85 | Risk Ratio (M‐H, Fixed, 95% CI) | 0.0 [0.0, 0.0] |
| 23.2 G vs docetaxel = 2nd line | 1 | 134 | Risk Ratio (M‐H, Fixed, 95% CI) | 3.0 [0.12, 72.35] |
| 24 Hypokalaemia Show forest plot | 1 | 190 | Risk Ratio (M‐H, Fixed, 95% CI) | 1.02 [0.06, 16.09] |
| 24.1 G vs vinorelbine = 1st line | 1 | 190 | Risk Ratio (M‐H, Fixed, 95% CI) | 1.02 [0.06, 16.09] |
| 25 Pyrexia Show forest plot | 3 | 1773 | Risk Ratio (M‐H, Fixed, 95% CI) | 0.59 [0.14, 2.47] |
| 25.1 G vs vinorelbine = 1st line | 1 | 190 | Risk Ratio (M‐H, Fixed, 95% CI) | 1.02 [0.06, 16.09] |
| 25.2 G vs docetaxel = 2nd line | 2 | 1583 | Risk Ratio (M‐H, Fixed, 95% CI) | 0.49 [0.09, 2.67] |
| 26 Overall response rate Show forest plot | 2 | Risk Ratio (M‐H, Fixed, 95% CI) | Subtotals only | |
| 26.1 G vs docetaxel = 2nd line | 2 | 1607 | Risk Ratio (M‐H, Fixed, 95% CI) | 1.16 [0.85, 1.59] |
| 27 Disease control rate Show forest plot | 2 | Risk Ratio (M‐H, Fixed, 95% CI) | Subtotals only | |
| 27.1 G vs docetaxel = 1st line | 1 | 190 | Risk Ratio (M‐H, Fixed, 95% CI) | 0.82 [0.61, 1.10] |
| 27.2 G vs docetaxel = 2nd line | 1 | 141 | Risk Ratio (M‐H, Fixed, 95% CI) | 1.07 [0.82, 1.40] |
| 28 FACT‐L QOL improvement rate Show forest plot | 2 | 1656 | Mean Difference (IV, Fixed, 95% CI) | 10.50 [9.55, 11.45] |
| 28.1 G vs vinorelbine = 1st line | 1 | 190 | Mean Difference (IV, Fixed, 95% CI) | 13.4 [8.25, 18.55] |
| 28.2 G vs docetaxel = 2nd line | 1 | 1466 | Mean Difference (IV, Fixed, 95% CI) | 10.40 [9.43, 11.37] |
| 29 LCS QOL improvement rate Show forest plot | 2 | 1656 | Mean Difference (IV, Fixed, 95% CI) | 3.63 [3.08, 4.19] |
| 29.1 G vs vinorelbine = 1st line | 1 | 190 | Mean Difference (IV, Fixed, 95% CI) | 3.80 [2.42, 5.18] |
| 29.2 G vs docetaxel = 2nd line | 1 | 1466 | Mean Difference (IV, Fixed, 95% CI) | 3.60 [2.99, 4.21] |
| 30 TOI QOL improvement rate Show forest plot | 2 | 1656 | Mean Difference (IV, Random, 95% CI) | 9.87 [1.26, 18.48] |
| 30.1 G vs vinorelbine = 1st line | 1 | 190 | Mean Difference (IV, Random, 95% CI) | 16.60 [4.61, 28.59] |
| 30.2 G vs docetaxel = 2nd line | 1 | 1466 | Mean Difference (IV, Random, 95% CI) | 7.0 [5.97, 8.03] |
| 31 PSI QOL improvement rate Show forest plot | 1 | 190 | Mean Difference (IV, Fixed, 95% CI) | 5.60 [3.55, 7.65] |
| 31.1 G vs vinorelbine = 1st line | 1 | 190 | Mean Difference (IV, Fixed, 95% CI) | 5.60 [3.55, 7.65] |
| Outcome or subgroup title | No. of studies | No. of participants | Statistical method | Effect size |
| 1 HR Overall survival = 1st line Show forest plot | 4 | Hazard Ratio (Random, 95% CI) | 0.94 [0.82, 1.06] | |
| 1.1 G vs carboplatin + paclitaxel | 2 | Hazard Ratio (Random, 95% CI) | 1.09 [0.64, 1.84] | |
| 1.2 G vs gemcitabine + cisplatin | 1 | Hazard Ratio (Random, 95% CI) | 0.93 [0.72, 1.21] | |
| 1.3 G vs pemetrexed + cisplatin | 1 | Hazard Ratio (Random, 95% CI) | 0.94 [0.68, 1.30] | |
| 2 HR Overall survival = 2nd line Show forest plot | 3 | Hazard Ratio (Random, 95% CI) | 0.94 [0.79, 1.12] | |
| 2.1 G vs docetaxel | 2 | Hazard Ratio (Random, 95% CI) | 0.97 [0.80, 1.17] | |
| 2.2 G vs pemetrexed | 1 | Hazard Ratio (Random, 95% CI) | 0.80 [0.50, 1.28] | |
| 3 HR Overall survival = Maintenance Show forest plot | 1 | Hazard Ratio (Random, 95% CI) | 2.15 [0.83, 5.55] | |
| 3.1 G vs pemetrexed | 1 | Hazard Ratio (Random, 95% CI) | 2.15 [0.83, 5.55] | |
| 4 HR Progression‐free survival = 1st line Show forest plot | 5 | Hazard Ratio (Random, 95% CI) | 0.65 [0.43, 0.98] | |
| 4.1 G vs carboplatin + paclitaxel | 2 | Hazard Ratio (Random, 95% CI) | 0.48 [0.20, 1.15] | |
| 4.2 G vs cisplatin + docetaxel | 1 | Hazard Ratio (Random, 95% CI) | 0.49 [0.34, 0.71] | |
| 4.3 G vs gemcitabine + cisplatin | 1 | Hazard Ratio (Random, 95% CI) | 1.20 [0.95, 1.52] | |
| 4.4 G vs pemetrexed + cisplatin | 1 | Hazard Ratio (Random, 95% CI) | 0.85 [0.64, 1.14] | |
| 5 HR Progression‐free survival = 2nd line Show forest plot | 3 | Hazard Ratio (Random, 95% CI) | 0.71 [0.57, 0.88] | |
| 5.1 G vs docetaxel | 2 | Hazard Ratio (Random, 95% CI) | 0.78 [0.65, 0.94] | |
| 5.2 G vs pemetrexed | 1 | Hazard Ratio (Random, 95% CI) | 0.54 [0.37, 0.79] | |
| 6 HR Progression‐free survival = Maintenance Show forest plot | 1 | Hazard Ratio (Random, 95% CI) | 0.53 [0.27, 1.04] | |
| 6.1 G vs pemetrexed | 1 | Hazard Ratio (Random, 95% CI) | 0.53 [0.27, 1.04] | |
| 7 1‐year survival rate Show forest plot | 7 | Risk Ratio (M‐H, Fixed, 95% CI) | Subtotals only | |
| 7.1 1st line | 3 | 1754 | Risk Ratio (M‐H, Fixed, 95% CI) | 1.03 [0.97, 1.09] |
| 7.2 2nd line | 3 | 681 | Risk Ratio (M‐H, Fixed, 95% CI) | 0.94 [0.81, 1.11] |
| 7.3 Maintenance | 1 | 70 | Risk Ratio (M‐H, Fixed, 95% CI) | 0.79 [0.65, 0.98] |
| 8 Nausea Show forest plot | 10 | 2898 | Risk Ratio (M‐H, Fixed, 95% CI) | 0.34 [0.17, 0.64] |
| 8.1 1st line | 4 | 1912 | Risk Ratio (M‐H, Fixed, 95% CI) | 0.19 [0.06, 0.54] |
| 8.2 2nd line | 5 | 916 | Risk Ratio (M‐H, Fixed, 95% CI) | 0.59 [0.22, 1.60] |
| 8.3 Maintenance | 1 | 70 | Risk Ratio (M‐H, Fixed, 95% CI) | 0.53 [0.09, 2.98] |
| 9 Vomiting Show forest plot | 6 | 2447 | Risk Ratio (M‐H, Random, 95% CI) | 0.19 [0.05, 0.77] |
| 9.1 1st line | 3 | 1737 | Risk Ratio (M‐H, Random, 95% CI) | 0.08 [0.02, 0.29] |
| 9.2 2nd line | 2 | 640 | Risk Ratio (M‐H, Random, 95% CI) | 1.31 [0.30, 5.77] |
| 9.3 Maintenance | 1 | 70 | Risk Ratio (M‐H, Random, 95% CI) | 0.20 [0.02, 1.69] |
| 10 Anorexia Show forest plot | 10 | 2950 | Risk Ratio (M‐H, Fixed, 95% CI) | 0.36 [0.27, 0.49] |
| 10.1 1st line | 4 | 1964 | Risk Ratio (M‐H, Fixed, 95% CI) | 0.32 [0.23, 0.45] |
| 10.2 2nd line | 5 | 916 | Risk Ratio (M‐H, Fixed, 95% CI) | 0.53 [0.27, 1.02] |
| 10.3 Maintenance | 1 | 70 | Risk Ratio (M‐H, Fixed, 95% CI) | 0.79 [0.05, 12.20] |
| 11 Fatigue Show forest plot | 10 | 1960 | Risk Ratio (M‐H, Fixed, 95% CI) | 0.32 [0.22, 0.46] |
| 11.1 1st line | 4 | 943 | Risk Ratio (M‐H, Fixed, 95% CI) | 0.26 [0.17, 0.40] |
| 11.2 2nd line | 4 | 759 | Risk Ratio (M‐H, Fixed, 95% CI) | 0.26 [0.06, 1.03] |
| 11.3 Maintenance | 2 | 258 | Risk Ratio (M‐H, Fixed, 95% CI) | 1.09 [0.41, 2.89] |
| 12 Arthralgia/myalgia Show forest plot | 4 | 2063 | Risk Ratio (M‐H, Fixed, 95% CI) | 0.14 [0.03, 0.61] |
| 12.1 1st line | 2 | 1423 | Risk Ratio (M‐H, Fixed, 95% CI) | 0.14 [0.03, 0.61] |
| 12.2 2nd line | 2 | 640 | Risk Ratio (M‐H, Fixed, 95% CI) | 0.0 [0.0, 0.0] |
| 13 Asthenia Show forest plot | 4 | 1755 | Risk Ratio (M‐H, Fixed, 95% CI) | 0.22 [0.08, 0.58] |
| 13.1 1st line | 3 | 1598 | Risk Ratio (M‐H, Fixed, 95% CI) | 0.21 [0.07, 0.61] |
| 13.2 2nd line | 1 | 157 | Risk Ratio (M‐H, Fixed, 95% CI) | 0.31 [0.03, 2.94] |
| 14 Neurotoxicity Show forest plot | 4 | 1797 | Risk Ratio (M‐H, Fixed, 95% CI) | 0.07 [0.02, 0.24] |
| 14.1 1st line | 2 | 1505 | Risk Ratio (M‐H, Fixed, 95% CI) | 0.07 [0.02, 0.24] |
| 14.2 2nd line | 2 | 292 | Risk Ratio (M‐H, Fixed, 95% CI) | 0.0 [0.0, 0.0] |
| 15 Neutropenia Show forest plot | 10 | 3061 | Risk Ratio (M‐H, Random, 95% CI) | 0.11 [0.05, 0.27] |
| 15.1 1st line | 5 | 2139 | Risk Ratio (M‐H, Random, 95% CI) | 0.05 [0.03, 0.07] |
| 15.2 2nd line | 3 | 664 | Risk Ratio (M‐H, Random, 95% CI) | 0.12 [0.08, 0.18] |
| 15.3 Maintenance | 2 | 258 | Risk Ratio (M‐H, Random, 95% CI) | 1.20 [0.49, 2.96] |
| 16 Anaemia Show forest plot | 9 | 2538 | Risk Ratio (M‐H, Fixed, 95% CI) | 0.18 [0.12, 0.29] |
| 16.1 1st line | 5 | 2139 | Risk Ratio (M‐H, Fixed, 95% CI) | 0.16 [0.10, 0.26] |
| 16.2 2nd line | 2 | 141 | Risk Ratio (M‐H, Fixed, 95% CI) | 0.20 [0.02, 1.61] |
| 16.3 Maintenance | 2 | 258 | Risk Ratio (M‐H, Fixed, 95% CI) | 1.36 [0.24, 7.87] |
| 17 Leukopenia Show forest plot | 4 | 2086 | Risk Ratio (M‐H, Random, 95% CI) | 0.07 [0.02, 0.23] |
| 17.1 1st line | 3 | 1603 | Risk Ratio (M‐H, Random, 95% CI) | 0.04 [0.02, 0.08] |
| 17.2 2nd line | 1 | 483 | Risk Ratio (M‐H, Random, 95% CI) | 0.16 [0.09, 0.26] |
| 18 Thrombocytopenia Show forest plot | 7 | 1070 | Risk Ratio (M‐H, Fixed, 95% CI) | 0.32 [0.14, 0.72] |
| 18.1 1st line | 2 | 536 | Risk Ratio (M‐H, Fixed, 95% CI) | 0.14 [0.04, 0.51] |
| 18.2 2nd line | 3 | 276 | Risk Ratio (M‐H, Fixed, 95% CI) | 0.25 [0.03, 2.15] |
| 18.3 Maintenance | 2 | 258 | Risk Ratio (M‐H, Fixed, 95% CI) | 3.63 [0.42, 31.44] |
| 19 Febrile neutropenia Show forest plot | 2 | 1679 | Risk Ratio (M‐H, Fixed, 95% CI) | 0.09 [0.03, 0.28] |
| 19.1 1st line | 1 | 1196 | Risk Ratio (M‐H, Fixed, 95% CI) | 0.06 [0.01, 0.43] |
| 19.2 2nd line | 1 | 483 | Risk Ratio (M‐H, Fixed, 95% CI) | 0.12 [0.03, 0.49] |
| 20 Skin rash Show forest plot | 10 | 3174 | Risk Ratio (M‐H, Random, 95% CI) | 3.11 [1.28, 7.55] |
| 20.1 1st line | 5 | 2141 | Risk Ratio (M‐H, Random, 95% CI) | 5.09 [2.21, 11.72] |
| 20.2 2nd line | 3 | 775 | Risk Ratio (M‐H, Random, 95% CI) | 2.54 [0.46, 13.95] |
| 20.3 Maintenance | 2 | 258 | Risk Ratio (M‐H, Random, 95% CI) | 0.91 [0.24, 3.44] |
| 21 Diarrhoea Show forest plot | 10 | 3055 | Risk Ratio (M‐H, Fixed, 95% CI) | 2.79 [1.57, 4.94] |
| 21.1 1st line | 5 | 2139 | Risk Ratio (M‐H, Fixed, 95% CI) | 2.74 [1.43, 5.27] |
| 21.2 2nd line | 5 | 916 | Risk Ratio (M‐H, Fixed, 95% CI) | 2.93 [0.88, 9.73] |
| 22 Increased ALT Show forest plot | 7 | 1542 | Risk Ratio (M‐H, Fixed, 95% CI) | 10.03 [5.23, 19.26] |
| 22.1 1st line | 4 | 943 | Risk Ratio (M‐H, Fixed, 95% CI) | 11.66 [5.13, 26.49] |
| 22.2 2nd line | 2 | 529 | Risk Ratio (M‐H, Fixed, 95% CI) | 13.22 [3.18, 54.99] |
| 22.3 Maintenance | 1 | 70 | Risk Ratio (M‐H, Fixed, 95% CI) | 0.27 [0.01, 6.33] |
| 23 Increased AST Show forest plot | 4 | 762 | Risk Ratio (M‐H, Fixed, 95% CI) | 7.73 [2.78, 21.46] |
| 23.1 1st line | 3 | 716 | Risk Ratio (M‐H, Fixed, 95% CI) | 7.73 [2.78, 21.46] |
| 23.2 2nd line | 1 | 46 | Risk Ratio (M‐H, Fixed, 95% CI) | 0.0 [0.0, 0.0] |
| 24 Overall response rate Show forest plot | 14 | Risk Ratio (M‐H, Random, 95% CI) | Subtotals only | |
| 24.1 1st line | 6 | 2158 | Risk Ratio (M‐H, Random, 95% CI) | 1.43 [1.13, 1.82] |
| 24.2 2nd line | 6 | 921 | Risk Ratio (M‐H, Random, 95% CI) | 1.43 [0.92, 2.22] |
| 24.3 Maintenance | 2 | 258 | Risk Ratio (M‐H, Random, 95% CI) | 0.88 [0.41, 1.87] |
| 25 Stable disease Show forest plot | 9 | Risk Ratio (M‐H, Random, 95% CI) | Subtotals only | |
| 25.1 1st line | 5 | 941 | Risk Ratio (M‐H, Random, 95% CI) | 0.47 [0.34, 0.64] |
| 25.2 2nd line | 2 | 143 | Risk Ratio (M‐H, Random, 95% CI) | 1.08 [0.64, 1.82] |
| 25.3 Maintenance | 2 | 258 | Risk Ratio (M‐H, Random, 95% CI) | 0.64 [0.44, 0.93] |
| 26 Disease control rate Show forest plot | 9 | Risk Ratio (M‐H, Random, 95% CI) | Subtotals only | |
| 26.1 1st line | 5 | 1848 | Risk Ratio (M‐H, Random, 95% CI) | 0.99 [0.86, 1.13] |
| 26.2 2nd line | 3 | 528 | Risk Ratio (M‐H, Random, 95% CI) | 0.99 [0.78, 1.25] |
| 26.3 Maintenance | 1 | 188 | Risk Ratio (M‐H, Random, 95% CI) | 0.65 [0.49, 0.85] |
| 27 FACT‐L QOL improvement rate Show forest plot | 3 | 1670 | Mean Difference (IV, Fixed, 95% CI) | 9.50 [7.95, 11.05] |
| 27.1 1st line | 1 | 1151 | Mean Difference (IV, Fixed, 95% CI) | 0.0 [0.0, 0.0] |
| 27.2 2nd line | 2 | 519 | Mean Difference (IV, Fixed, 95% CI) | 9.50 [7.95, 11.05] |
| 28 LCS QOL improvement rate Show forest plot | 3 | 1748 | Mean Difference (IV, Fixed, 95% CI) | 2.30 [1.53, 3.07] |
| 28.1 1st line | 1 | 1151 | Mean Difference (IV, Fixed, 95% CI) | 0.0 [0.0, 0.0] |
| 28.2 2nd line | 2 | 597 | Mean Difference (IV, Fixed, 95% CI) | 2.30 [1.53, 3.07] |
| 29 TOI QOL improvement rate Show forest plot | 3 | 1670 | Mean Difference (IV, Fixed, 95% CI) | 11.8 [9.17, 14.43] |
| 29.1 1st line | 1 | 1151 | Mean Difference (IV, Fixed, 95% CI) | 0.0 [0.0, 0.0] |
| 29.2 2nd line | 2 | 519 | Mean Difference (IV, Fixed, 95% CI) | 11.8 [9.17, 14.43] |
| Outcome or subgroup title | No. of studies | No. of participants | Statistical method | Effect size |
| 1 HR Overall survival = 1st line Show forest plot | 5 | Hazard Ratio (Fixed, 95% CI) | 0.97 [0.77, 1.21] | |
| 1.1 Biomarker driven selection | 2 | Hazard Ratio (Fixed, 95% CI) | 0.98 [0.72, 1.33] | |
| 1.2 Clinical feature driven selection | 3 | Hazard Ratio (Fixed, 95% CI) | 0.95 [0.68, 1.33] | |
| 2 HR Overall survival = 2nd line Show forest plot | 1 | Hazard Ratio (Fixed, 95% CI) | 0.83 [0.41, 1.66] | |
| 2.1 G vs docetaxel | 1 | Hazard Ratio (Fixed, 95% CI) | 0.83 [0.41, 1.66] | |
| 3 HR Progression‐free survival = 1st line Show forest plot | 5 | Hazard Ratio (Random, 95% CI) | 0.47 [0.36, 0.61] | |
| 3.1 Biomarker driven selection | 2 | Hazard Ratio (Random, 95% CI) | 0.39 [0.26, 0.59] | |
| 3.2 Clinical feature driven selection | 3 | Hazard Ratio (Random, 95% CI) | 0.53 [0.41, 0.70] | |
| 4 HR Progression‐free survival = 2nd line Show forest plot | 2 | Hazard Ratio (Fixed, 95% CI) | 0.24 [0.12, 0.47] | |
| 4.1 G vs docetaxel | 1 | Hazard Ratio (Fixed, 95% CI) | 0.16 [0.05, 0.50] | |
| 4.2 G vs pemetrexed | 1 | Hazard Ratio (Fixed, 95% CI) | 0.30 [0.13, 0.70] | |
| 5 Overall response rate Show forest plot | 7 | 758 | Risk Ratio (M‐H, Random, 95% CI) | 1.71 [1.34, 2.19] |
| 5.1 First‐line biomarker driven selection | 2 | 347 | Risk Ratio (M‐H, Random, 95% CI) | 2.23 [1.75, 2.85] |
| 5.2 First‐line, clinical feature driven selection | 3 | 353 | Risk Ratio (M‐H, Random, 95% CI) | 1.45 [1.05, 1.99] |
| 5.3 2nd line | 2 | 58 | Risk Ratio (M‐H, Random, 95% CI) | 1.65 [0.88, 3.09] |
| 6 Stable disease Show forest plot | 3 | 397 | Risk Ratio (M‐H, Random, 95% CI) | 0.52 [0.28, 0.97] |
| 6.1 First‐line, biomarker driven selection | 2 | 347 | Risk Ratio (M‐H, Random, 95% CI) | 0.47 [0.22, 0.98] |
| 6.2 First‐line, clinical feature driven selection | 1 | 50 | Risk Ratio (M‐H, Random, 95% CI) | 0.87 [0.26, 2.85] |
| 7 Disease control rate Show forest plot | 5 | 2001 | Risk Ratio (M‐H, Random, 95% CI) | 1.05 [0.93, 1.19] |
| 7.1 First‐line, biomarker driven selection | 2 | 347 | Risk Ratio (M‐H, Random, 95% CI) | 1.15 [1.05, 1.26] |
| 7.2 First‐line, clinical feature driven selection | 2 | 1267 | Risk Ratio (M‐H, Random, 95% CI) | 0.93 [0.87, 0.99] |
| 7.3 Second‐line | 1 | 387 | Risk Ratio (M‐H, Random, 95% CI) | 1.03 [0.77, 1.36] |
| Outcome or subgroup title | No. of studies | No. of participants | Statistical method | Effect size |
| 1 1‐year survival rate Show forest plot | 2 | 424 | Risk Ratio (M‐H, Fixed, 95% CI) | 0.83 [0.61, 1.11] |
| 1.1 2nd line | 2 | 424 | Risk Ratio (M‐H, Fixed, 95% CI) | 0.83 [0.61, 1.11] |
| 2 Skin rash Show forest plot | 2 | 290 | Risk Ratio (M‐H, Fixed, 95% CI) | 8.13 [1.51, 43.72] |
| 2.1 2nd line | 1 | 209 | Risk Ratio (M‐H, Fixed, 95% CI) | 6.80 [0.85, 54.32] |
| 2.2 Maintenance | 1 | 81 | Risk Ratio (M‐H, Fixed, 95% CI) | 10.41 [0.61, 176.21] |
| 3 Acne Show forest plot | 1 | 209 | Risk Ratio (M‐H, Fixed, 95% CI) | 4.86 [0.24, 100.02] |
| 3.1 2nd line | 1 | 209 | Risk Ratio (M‐H, Fixed, 95% CI) | 4.86 [0.24, 100.02] |
| 4 Pruritus Show forest plot | 1 | 209 | Risk Ratio (M‐H, Fixed, 95% CI) | 2.92 [0.12, 70.77] |
| 4.1 2nd line | 1 | 209 | Risk Ratio (M‐H, Fixed, 95% CI) | 2.92 [0.12, 70.77] |
| 5 Diarrhoea Show forest plot | 3 | 521 | Risk Ratio (M‐H, Fixed, 95% CI) | 8.36 [1.58, 44.34] |
| 5.1 2nd line | 3 | 521 | Risk Ratio (M‐H, Fixed, 95% CI) | 8.36 [1.58, 44.34] |
| 6 Nausea Show forest plot | 1 | 209 | Risk Ratio (M‐H, Fixed, 95% CI) | 0.97 [0.06, 15.33] |
| 6.1 2nd line | 1 | 209 | Risk Ratio (M‐H, Fixed, 95% CI) | 0.97 [0.06, 15.33] |
| 7 Vomiting Show forest plot | 1 | 209 | Risk Ratio (M‐H, Fixed, 95% CI) | 0.0 [0.0, 0.0] |
| 7.1 2nd line | 1 | 209 | Risk Ratio (M‐H, Fixed, 95% CI) | 0.0 [0.0, 0.0] |
| 8 Anorexia Show forest plot | 1 | 209 | Risk Ratio (M‐H, Fixed, 95% CI) | 2.92 [0.12, 70.77] |
| 8.1 2nd line | 1 | 209 | Risk Ratio (M‐H, Fixed, 95% CI) | 2.92 [0.12, 70.77] |
| 9 Asthenia Show forest plot | 1 | 209 | Risk Ratio (M‐H, Fixed, 95% CI) | 2.92 [0.12, 70.77] |
| 9.1 2nd line | 1 | 209 | Risk Ratio (M‐H, Fixed, 95% CI) | 2.92 [0.12, 70.77] |
| 10 Overall response rate Show forest plot | 3 | Risk Ratio (M‐H, Fixed, 95% CI) | Subtotals only | |
| 10.1 2nd line | 2 | 424 | Risk Ratio (M‐H, Fixed, 95% CI) | 0.92 [0.58, 1.46] |
| 10.2 Maintenance | 1 | 96 | Risk Ratio (M‐H, Fixed, 95% CI) | 1.0 [0.35, 2.88] |
| 11 Partial response Show forest plot | 1 | 216 | Risk Ratio (M‐H, Fixed, 95% CI) | 0.75 [0.34, 1.65] |
| 11.1 2nd line | 1 | 216 | Risk Ratio (M‐H, Fixed, 95% CI) | 0.75 [0.34, 1.65] |
| 12 FACT‐L Symptom improvement rate Show forest plot | 2 | 356 | Mean Difference (IV, Fixed, 95% CI) | 3.70 [‐7.28, 14.69] |
| 12.1 2nd line | 2 | 356 | Mean Difference (IV, Fixed, 95% CI) | 3.70 [‐7.28, 14.69] |
| 13 TOI QOL improvement rate Show forest plot | 2 | 424 | Mean Difference (IV, Fixed, 95% CI) | 7.38 [‐2.30, 17.05] |
| 13.1 2nd line | 2 | 424 | Mean Difference (IV, Fixed, 95% CI) | 7.38 [‐2.30, 17.05] |
| Outcome or subgroup title | No. of studies | No. of participants | Statistical method | Effect size |
| 1 HR Progression‐free survival Show forest plot | 2 | Hazard Ratio (Random, 95% CI) | Subtotals only | |
| 1.1 1st line | 1 | Hazard Ratio (Random, 95% CI) | 0.69 [0.49, 0.96] | |
| 1.2 2nd line | 1 | Hazard Ratio (Random, 95% CI) | 0.65 [0.43, 0.97] | |
| 2 1‐year survival rate Show forest plot | 2 | 163 | Risk Ratio (M‐H, Fixed, 95% CI) | 1.15 [0.92, 1.43] |
| 2.1 2nd line | 2 | 163 | Risk Ratio (M‐H, Fixed, 95% CI) | 1.15 [0.92, 1.43] |
| 3 1‐year progression‐free survival Show forest plot | 2 | 163 | Risk Ratio (M‐H, Fixed, 95% CI) | 2.29 [1.38, 3.80] |
| 3.1 2nd line | 2 | 163 | Risk Ratio (M‐H, Fixed, 95% CI) | 2.29 [1.38, 3.80] |
| 4 Skin rash Show forest plot | 3 | 329 | Risk Ratio (M‐H, Fixed, 95% CI) | 1.34 [0.39, 4.57] |
| 4.1 1st line | 2 | 281 | Risk Ratio (M‐H, Fixed, 95% CI) | 1.01 [0.23, 4.51] |
| 4.2 2nd line | 1 | 48 | Risk Ratio (M‐H, Fixed, 95% CI) | 2.57 [0.25, 26.47] |
| 5 Diarrhoea Show forest plot | 3 | 329 | Risk Ratio (M‐H, Fixed, 95% CI) | 1.16 [0.21, 6.34] |
| 5.1 1st line | 2 | 281 | Risk Ratio (M‐H, Fixed, 95% CI) | 1.16 [0.21, 6.34] |
| 5.2 2nd line | 1 | 48 | Risk Ratio (M‐H, Fixed, 95% CI) | 0.0 [0.0, 0.0] |
| 6 Constipation Show forest plot | 1 | 48 | Risk Ratio (M‐H, Fixed, 95% CI) | 0.42 [0.02, 9.92] |
| 6.1 2nd line | 1 | 48 | Risk Ratio (M‐H, Fixed, 95% CI) | 0.42 [0.02, 9.92] |
| 7 Fatigue Show forest plot | 3 | 329 | Risk Ratio (M‐H, Fixed, 95% CI) | 2.68 [0.60, 11.90] |
| 7.1 1st line | 2 | 281 | Risk Ratio (M‐H, Fixed, 95% CI) | 2.68 [0.60, 11.90] |
| 7.2 2nd line | 1 | 48 | Risk Ratio (M‐H, Fixed, 95% CI) | 0.0 [0.0, 0.0] |
| 8 Leukopenia Show forest plot | 2 | 138 | Risk Ratio (M‐H, Fixed, 95% CI) | 1.50 [0.48, 4.70] |
| 8.1 1st line | 1 | 90 | Risk Ratio (M‐H, Fixed, 95% CI) | 1.25 [0.36, 4.35] |
| 8.2 2nd line | 1 | 48 | Risk Ratio (M‐H, Fixed, 95% CI) | 3.82 [0.16, 89.24] |
| 9 Anaemia Show forest plot | 3 | 329 | Risk Ratio (M‐H, Fixed, 95% CI) | 3.22 [0.66, 15.72] |
| 9.1 1st line | 2 | 281 | Risk Ratio (M‐H, Fixed, 95% CI) | 3.06 [0.49, 19.15] |
| 9.2 2nd line | 1 | 48 | Risk Ratio (M‐H, Fixed, 95% CI) | 3.82 [0.16, 89.24] |
| 10 Thrombocytopenia Show forest plot | 2 | 138 | Risk Ratio (M‐H, Fixed, 95% CI) | 0.0 [0.0, 0.0] |
| 10.1 1st line | 1 | 90 | Risk Ratio (M‐H, Fixed, 95% CI) | 0.0 [0.0, 0.0] |
| 10.2 2nd line | 1 | 48 | Risk Ratio (M‐H, Fixed, 95% CI) | 0.0 [0.0, 0.0] |
| 11 Neutropenia Show forest plot | 3 | 329 | Risk Ratio (M‐H, Fixed, 95% CI) | 1.47 [0.71, 3.02] |
| 11.1 1st line | 2 | 281 | Risk Ratio (M‐H, Fixed, 95% CI) | 1.36 [0.65, 2.88] |
| 11.2 2nd line | 1 | 48 | Risk Ratio (M‐H, Fixed, 95% CI) | 3.82 [0.16, 89.24] |
| 12 Increased ALT Show forest plot | 2 | 281 | Risk Ratio (M‐H, Fixed, 95% CI) | 2.57 [1.09, 6.04] |
| 12.1 1st line | 2 | 281 | Risk Ratio (M‐H, Fixed, 95% CI) | 2.57 [1.09, 6.04] |
| 13 Increased AST Show forest plot | 2 | 281 | Risk Ratio (M‐H, Fixed, 95% CI) | 1.47 [0.56, 3.88] |
| 13.1 1st line | 2 | 281 | Risk Ratio (M‐H, Fixed, 95% CI) | 1.47 [0.56, 3.88] |
| 14 Vomiting Show forest plot | 1 | 191 | Risk Ratio (M‐H, Fixed, 95% CI) | 1.56 [0.06, 37.74] |
| 14.1 1st line | 1 | 191 | Risk Ratio (M‐H, Fixed, 95% CI) | 1.56 [0.06, 37.74] |
| 15 Nausea Show forest plot | 1 | 191 | Risk Ratio (M‐H, Fixed, 95% CI) | 1.56 [0.06, 37.74] |
| 15.1 1st line | 1 | 191 | Risk Ratio (M‐H, Fixed, 95% CI) | 1.56 [0.06, 37.74] |
| 16 Overall response rate Show forest plot | 2 | 281 | Risk Ratio (M‐H, Fixed, 95% CI) | 1.02 [0.89, 1.17] |
| 16.1 1st line | 2 | 281 | Risk Ratio (M‐H, Fixed, 95% CI) | 1.02 [0.89, 1.17] |
| 17 Partial response Show forest plot | 4 | 444 | Risk Ratio (M‐H, Fixed, 95% CI) | 1.01 [0.88, 1.16] |
| 17.1 1st line | 2 | 281 | Risk Ratio (M‐H, Fixed, 95% CI) | 1.01 [0.88, 1.16] |
| 17.2 2nd line | 2 | 163 | Risk Ratio (M‐H, Fixed, 95% CI) | 1.02 [0.71, 1.47] |
| 18 Stable disease Show forest plot | 4 | 444 | Risk Ratio (M‐H, Fixed, 95% CI) | 0.97 [0.69, 1.37] |
| 18.1 1st line | 2 | 281 | Risk Ratio (M‐H, Fixed, 95% CI) | 0.67 [0.39, 1.16] |
| 18.2 2nd line | 2 | 163 | Risk Ratio (M‐H, Fixed, 95% CI) | 1.30 [0.84, 2.03] |
| Outcome or subgroup title | No. of studies | No. of participants | Statistical method | Effect size |
| 1 HR Overall survival Show forest plot | 3 | Hazard Ratio (Fixed, 95% CI) | Subtotals only | |
| 1.1 1st line [Asian] | 2 | Hazard Ratio (Fixed, 95% CI) | 0.86 [0.72, 1.02] | |
| 1.2 2nd line [EGFRm] | 1 | Hazard Ratio (Fixed, 95% CI) | 1.62 [1.05, 2.50] | |
| 2 HR Progression‐free survival Show forest plot | 3 | Hazard Ratio (Fixed, 95% CI) | Subtotals only | |
| 2.1 1st line [Asian] | 2 | Hazard Ratio (Fixed, 95% CI) | 0.69 [0.62, 0.77] | |
| 2.2 2nd line [EGFRm] | 1 | Hazard Ratio (Fixed, 95% CI) | 0.86 [0.65, 1.13] | |
| 3 1‐year survival rate Show forest plot | 2 | 1411 | Risk Ratio (M‐H, Fixed, 95% CI) | 0.95 [0.84, 1.08] |
| 3.1 1st line | 2 | 1411 | Risk Ratio (M‐H, Fixed, 95% CI) | 0.95 [0.84, 1.08] |
| 4 Skin rash Show forest plot | 5 | 2379 | Risk Ratio (M‐H, Fixed, 95% CI) | 2.98 [1.54, 5.77] |
| 4.1 1st line | 2 | 1400 | Risk Ratio (M‐H, Fixed, 95% CI) | 2.64 [1.23, 5.63] |
| 4.2 1st line [Asian] | 2 | 715 | Risk Ratio (M‐H, Fixed, 95% CI) | 4.23 [1.08, 16.54] |
| 4.3 2nd line [EGFRm] | 1 | 264 | Risk Ratio (M‐H, Fixed, 95% CI) | 0.0 [0.0, 0.0] |
| 5 Acne Show forest plot | 3 | 1664 | Risk Ratio (M‐H, Fixed, 95% CI) | 4.95 [1.09, 22.51] |
| 5.1 1st line | 2 | 1400 | Risk Ratio (M‐H, Fixed, 95% CI) | 5.59 [0.99, 31.60] |
| 5.2 2nd line [EGFRm] | 1 | 264 | Risk Ratio (M‐H, Fixed, 95% CI) | 3.0 [0.12, 72.98] |
| 6 Diarrhoea Show forest plot | 5 | 2379 | Risk Ratio (M‐H, Random, 95% CI) | 2.04 [1.17, 3.58] |
| 6.1 1st line | 2 | 1400 | Risk Ratio (M‐H, Random, 95% CI) | 2.44 [1.17, 5.09] |
| 6.2 1st line [Asian] | 2 | 715 | Risk Ratio (M‐H, Random, 95% CI) | 0.97 [0.32, 2.92] |
| 6.3 2nd line [EGFRm] | 1 | 264 | Risk Ratio (M‐H, Random, 95% CI) | 3.0 [0.32, 28.47] |
| 7 Pruritus Show forest plot | 2 | 1400 | Risk Ratio (M‐H, Fixed, 95% CI) | 1.99 [0.18, 21.89] |
| 7.1 1st line | 2 | 1400 | Risk Ratio (M‐H, Fixed, 95% CI) | 1.99 [0.18, 21.89] |
| 8 Vomiting Show forest plot | 5 | 2379 | Risk Ratio (M‐H, Fixed, 95% CI) | 1.24 [0.81, 1.89] |
| 8.1 1st line | 2 | 1400 | Risk Ratio (M‐H, Fixed, 95% CI) | 1.05 [0.53, 2.06] |
| 8.2 1st line [Asian] | 2 | 715 | Risk Ratio (M‐H, Fixed, 95% CI) | 1.28 [0.70, 2.32] |
| 8.3 2nd line [EGFRm] | 1 | 264 | Risk Ratio (M‐H, Fixed, 95% CI) | 2.0 [0.51, 7.83] |
| 9 Nausea Show forest plot | 5 | 2379 | Risk Ratio (M‐H, Fixed, 95% CI) | 0.82 [0.58, 1.17] |
| 9.1 1st line | 2 | 1400 | Risk Ratio (M‐H, Fixed, 95% CI) | 1.06 [0.51, 2.18] |
| 9.2 1st line [Asian] | 2 | 715 | Risk Ratio (M‐H, Fixed, 95% CI) | 0.74 [0.48, 1.14] |
| 9.3 2nd line [EGFRm] | 1 | 264 | Risk Ratio (M‐H, Fixed, 95% CI) | 0.83 [0.26, 2.66] |
| 10 Anorexia Show forest plot | 5 | 2379 | Risk Ratio (M‐H, Fixed, 95% CI) | 0.82 [0.55, 1.20] |
| 10.1 1st line | 2 | 1400 | Risk Ratio (M‐H, Fixed, 95% CI) | 1.98 [0.36, 10.76] |
| 10.2 1st line [Asian] | 2 | 715 | Risk Ratio (M‐H, Fixed, 95% CI) | 0.80 [0.53, 1.20] |
| 10.3 2nd line [EGFRm] | 1 | 264 | Risk Ratio (M‐H, Fixed, 95% CI) | 0.33 [0.04, 3.16] |
| 11 Asthenia Show forest plot | 3 | 1664 | Risk Ratio (M‐H, Random, 95% CI) | 0.80 [0.21, 2.99] |
| 11.1 1st line | 2 | 1400 | Risk Ratio (M‐H, Random, 95% CI) | 0.90 [0.10, 7.76] |
| 11.2 2nd line [EGFRm] | 1 | 264 | Risk Ratio (M‐H, Random, 95% CI) | 0.5 [0.09, 2.68] |
| 12 Dyspnoea Show forest plot | 2 | 947 | Risk Ratio (M‐H, Fixed, 95% CI) | 1.00 [0.25, 3.96] |
| 12.1 1st line | 1 | 683 | Risk Ratio (M‐H, Fixed, 95% CI) | 1.99 [0.18, 21.89] |
| 12.2 2nd line [EGFRm] | 1 | 264 | Risk Ratio (M‐H, Fixed, 95% CI) | 0.67 [0.11, 3.93] |
| 13 Anaemia Show forest plot | 3 | 979 | Risk Ratio (M‐H, Fixed, 95% CI) | 0.74 [0.53, 1.03] |
| 13.1 1st line [Asian] | 2 | 715 | Risk Ratio (M‐H, Fixed, 95% CI) | 0.63 [0.44, 0.90] |
| 13.2 2nd line [EGFRm] | 1 | 264 | Risk Ratio (M‐H, Fixed, 95% CI) | 2.2 [0.79, 6.16] |
| 14 Neutropenia Show forest plot | 5 | 2379 | Risk Ratio (M‐H, Fixed, 95% CI) | 0.97 [0.87, 1.08] |
| 14.1 1st line | 2 | 1400 | Risk Ratio (M‐H, Fixed, 95% CI) | 1.18 [0.77, 1.80] |
| 14.2 1st line [Asian] | 2 | 715 | Risk Ratio (M‐H, Fixed, 95% CI) | 0.93 [0.84, 1.03] |
| 14.3 2nd line [EGFRm] | 1 | 264 | Risk Ratio (M‐H, Fixed, 95% CI) | 1.29 [0.49, 3.35] |
| 15 Leukopenia Show forest plot | 4 | 2262 | Risk Ratio (M‐H, Fixed, 95% CI) | 1.08 [0.89, 1.31] |
| 15.1 1st line | 2 | 1400 | Risk Ratio (M‐H, Fixed, 95% CI) | 1.17 [0.61, 2.26] |
| 15.2 1st line [Asian] | 1 | 598 | Risk Ratio (M‐H, Fixed, 95% CI) | 1.06 [0.87, 1.30] |
| 15.3 2nd line [EGFRm] | 1 | 264 | Risk Ratio (M‐H, Fixed, 95% CI) | 1.0 [0.21, 4.86] |
| 16 Overall response rate Show forest plot | 5 | 2314 | Risk Ratio (M‐H, Fixed, 95% CI) | 1.08 [0.97, 1.20] |
| 16.1 1st line | 2 | 1343 | Risk Ratio (M‐H, Fixed, 95% CI) | 1.07 [0.94, 1.22] |
| 16.2 1st line [Asian] | 2 | 706 | Risk Ratio (M‐H, Fixed, 95% CI) | 1.14 [0.93, 1.40] |
| 16.3 2nd line [EGFRm] | 1 | 265 | Risk Ratio (M‐H, Fixed, 95% CI) | 0.93 [0.66, 1.31] |