Gefitinib para el cáncer de pulmón de células no pequeñas avanzado
Resumen
Antecedentes
La función del gefitinib en el tratamiento del cáncer de pulmón de células no pequeñas (CPCNP) avanzado ha evolucionado. Se realizó una revisión sistemática para evaluar la evidencia disponible de todos los ensayos aleatorios.
Objetivos
Determinar la efectividad y la seguridad del gefitinib como tratamiento de primera línea, de segunda línea o de mantenimiento para el CPCNP avanzado.
Métodos de búsqueda
Se hicieron búsquedas en CENTRAL, MEDLINE y Embase desde su inicio hasta 17 febrero 2017. Se buscó manualmente en las actas de congresos relevantes, los registros de ensayos clínicos y las listas de referencias de los artículos recuperados.
Criterios de selección
Se incluyeron los ensayos que evaluaron gefitinib, solo o en combinación con otro tratamiento, en comparación con placebo u otros tratamientos, como tratamiento de primera línea o de líneas sucesivas en pacientes con CPCNP, con la exclusión del uso compasivo.
Obtención y análisis de los datos
Se utilizó la metodología Cochrane estándar. Dos autores de la revisión evaluaron de forma independiente los resultados de búsqueda para seleccionar aquellos con buena calidad metodológica. Todos los análisis se realizaron por intención de tratar. Se registraron los siguientes datos de resultado: supervivencia general, supervivencia libre de progresión, toxicidad, respuesta tumoral y calidad de vida. También se obtuvieron datos de los siguientes subgrupos: Grupo étnico asiático y mutación positiva para el factor de crecimiento epidérmico (EGFR por sus siglas en inglés).
Resultados principales
Se incluyeron 35 ensayos controlados aleatorios (ECA) elegibles, que examinaron a 12 089 pacientes.
Población general
El gefitinib no mejoró estadísticamente la supervivencia general en comparación con placebo o quimioterapia en los contextos de primera o segunda línea. El gefitinib de segunda línea prolongó el tiempo hasta el fracaso del tratamiento (TFT) (cociente de riesgos instantáneos [CRI] 0,82; intervalo de confianza [IC] del 95%: 0,75 a 0,90; p < 0,0001) en comparación con placebo. El gefitinib como mantenimiento mejoró la supervivencia libre de progresión (CRI 0,70; IC del 95%: 0,53 a 0,91; p = 0,007) después del tratamiento de primera línea.
Estudios en pacientes del grupo étnico asiático o que realizaron análisis de subgrupos
El gefitinib de segunda línea prolongó la supervivencia general en comparación con placebo (CRI 0,66; IC del 95%: 0,48 a 0,91; P = 0,01). En el contexto de primera línea, la supervivencia libre de progresión mejoró con gefitinib en comparación con quimioterapia sola (CRI 0,65; IC del 95%: 0,43 a 0,98; P = 0,04, evidencia de calidad moderada). El gefitinib administrado en combinación con un régimen de quimioterapia mejoró la supervivencia libre de progresión versus gefitinib solo o quimioterapia sola (CRI 0,69; IC del 95%: 0,49 a 0,96; P = 0,03; CRI 0,69; IC del 95%: 0,62 a 0,77; P < 0,00001, respectivamente). En el contexto de segunda línea, la supervivencia libre de progresión fue superior en los pacientes que recibieron gefitinib en comparación con placebo o quimioterapia (CRI 0,69; IC del 95%: 0,52 a 0,91; P = 0,009; CRI 0,71; IC del 95%: 0,57 a 0,88; P = 0,002; evidencia de calidad moderada, respectivamente). El gefitinib combinado con quimioterapia en el contexto de segunda línea fue superior a gefitinib solo (CRI 0,65; IC del 95%: 0,43 a 0,97; P = 0,04). Como tratamiento de mantenimiento, gefitinib mejoró la supervivencia libre de progresión en comparación con placebo (CRI 0,42; IC del 95%: 0,33 a 0,54; P < 0,00001).
Pacientes con tumores positivos a mutaciones del EGFR
Los estudios en pacientes con tumores positivos a mutaciones del EGFR mostraron una mejoría en la supervivencia libre de progresión a favor de gefitinib en comparación con quimioterapia de primera línea y de segunda línea (CRI 0,47; IC del 95%: 0,36 a 0,61; P < 0,00001; CRI 0,24; IC del 95%: 0,12 a 0,47; P < 0,0001, respectivamente). El gefitinib como tratamiento de mantenimiento después de quimioterapia mejoró la supervivencia general y libre de progresión (CRI 0,39; IC del 95%: 0,15 a 0,98; P = 0,05; CRI 0,17; IC del 95%: 0,07 a 0,41; p < 0,0001, respectivamente) en un estudio de fase III en el que se le comparó con placebo.
Los efectos tóxicos de gefitinib incluyeron erupción cutánea, diarrea y trastornos de las transaminasas hepáticas. Los efectos tóxicos de la quimioterapia incluyeron anemia, neutropenia y neurotoxicidad.
En cuanto a la calidad de vida, gefitinib mejoró la Functional Assessment of Cancer Therapy‐Lung (FACT‐L) (diferencia de medias estandarizada [DME] 10,50; IC del 95%: 9,55 a 11,45; p < 0,000001), subescala cáncer de pulmón (DME 3,63; IC del 95%: 3,08 a 4,19; p < 0,00001) y las puntuaciones del Trial Outcome Index (DME 9,87; IC del 95%: 1,26 a 18,48; p < 0,00001), en comparación con quimioterapia.
Conclusiones de los autores
Esta revisión sistemática indica que gefitinib, en comparación con quimioterapia de primera o segunda línea o con tratamiento de mantenimiento estándar, probablemente tiene un efecto beneficioso sobre la supervivencia libre de progresión y la calidad de vida en poblaciones de pacientes seleccionadas, en particular los que presentan tumores con mutaciones sensibilizadoras al EGFR.
Los pacientes con mutaciones del EGFR vivieron más tiempo cuando se les administró gefitinib de mantenimiento que cuando recibieron placebo.
Un estudio realizó un análisis de subgrupos y mostró que el gefitinib mejoró la supervivencia general en comparación con placebo en el contexto de segunda línea en pacientes del grupo étnico asiático. Los otros estudios no detectaron efectos beneficiosos sobre la supervivencia general. Los datos analizados en esta revisión fueron muy heterogéneos. La cantidad de datos que fue posible agrupar fue limitada, en gran parte debido a las variaciones en los diseños de los estudios. El riesgo de sesgo en la mayoría de los estudios fue moderado; algunos estudios no abordaron adecuadamente los posibles sesgos de selección, desgaste e informe. Esta heterogeneidad puede tener un impacto en la aplicabilidad de los resultados
La combinación de gefitinib con quimioterapia parece ser superior para mejorar la supervivencia libre de progresión comparado con el gefitinib o la quimioterapia solos; sin embargo, se necesitan más datos y estudios de fase III en estos contextos.
El gefitinib tiene un perfil de toxicidad favorable en comparación con los regímenes de quimioterapia actuales. Aunque no hubo mejoría en la supervivencia general, el gefitinib se compara favorablemente con la quimioterapia citotóxica en pacientes con mutaciones del EGFR, con una prolongación de la supervivencia libre de progresión y un perfil menor de efectos secundarios.
PICOs
Resumen en términos sencillos
Una comparación del gefitinib con ningún tratamiento o quimioterapia para el cáncer de pulmón de células no pequeñas
Pregunta de la revisión
¿Los pacientes con cáncer de pulmón de células no pequeñas viven más tiempo si se le administra gefitinib?
Antecedentes
El cáncer de pulmón de células no pequeñas (el tipo más frecuente de cáncer de pulmón) es una causa importante de muerte debido al cáncer en todo el mundo. A los pacientes diagnosticadas con cáncer de pulmón avanzado se les puede ofrecer quimioterapia.
Se ha encontrado que algunos cánceres de pulmón tienen una mutación genética, que es una alteración en la secuencia cromosómica dentro de las células. Esta mutación afecta al receptor del factor de crecimiento epidérmico (EGFR), que es un interruptor situado en la superficie de la célula que da lugar al crecimiento no controlado y la diseminación. Gefitinib es un fármaco que tiene como blanco las células con mutaciones del EGFR, por lo que detiene su crecimiento. Los estudios han encontrado que esta mutación se encuentra con mayor frecuencia en pacientes que no son fumadores, femeninos, con herencia asiática y con adenocarcinoma (un tipo de cáncer de pulmón).
Características de los estudios
Se buscaron ensayos relevantes hasta 17 febrero 2017. Hubo un total de 35 estudios realizados entre 2000 y 2017, que evaluaron a 12 089 participantes de varios países, incluidos América del Norte, Europa y Asia.
Resultados clave
Esta revisión indicó que los pacientes con cáncer de pulmón avanzado no viven más tiempo cuando se tratan con gefitinib en comparación con ningún otro tratamiento o quimioterapia. En pacientes con cáncer de pulmón que ha empeorado después del tratamiento inicial, gefitinib puede prolongar el tiempo antes de que el cáncer progrese aún más, pero solo en un grupo seleccionado de pacientes del grupo étnico asiático o con mutaciones del EGFR. La combinación de gefitinib con quimioterapia probablemente aumenta el tiempo hasta la progresión del cáncer en comparación con el gefitinib o quimioterapia solos. En los pacientes positivos a la mutación del EGFR que están estables después de la quimioterapia, el gefitinib mantenido mostró una mejoría en la supervivencia en comparación con placebo.
Los efectos secundarios graves, como los recuentos bajos de glóbulos rojos y blancos y los síntomas nerviosos, ocurrieron con mayor frecuencia en los pacientes que recibieron quimioterapia en comparación con los que recibieron gefitinib. Los efectos secundarios causados por gefitinib incluyeron erupción cutánea, diarrea y disfunción hepática.
La calidad de vida puede mejorar con gefitinib en comparación con quimioterapia.
Calidad de la evidencia
Cuando se compara gefitinib como tratamiento de primera y segunda línea con quimioterapia, la calidad de la evidencia se disminuyó a moderada para los resultados supervivencia general y supervivencia libre de progresión porque los resultados no fueron precisos y pueden no ser aplicables a todos los pacientes debido a la inclusión de una población con más de 70 años de edad solamente. Sin embargo, la calidad de la evidencia cuando se compararon los efectos tóxicos de gefitinib con quimioterapia fue alta.
Conclusiones de los autores
Summary of findings
| Gefitinib compared to chemotherapy for first‐line treatment of advanced NSCLC | ||||||
| Patient or population: advanced NSCLC | ||||||
| Outcomes | Illustrative comparative risks* (95% CI) | Relative effect | No of participants | Quality of the evidence | Comments | |
| Assumed risk | Corresponding risk | |||||
| Chemotherapy | Gefitinib | |||||
| Overall survival (OS) | The mean OS ranged across control groups from 3.5 to 8 months | The mean OS in the intervention group ranged from 2.2 to 5.9 months | HR 0.98 (0.91 to 1.46) | 275 | ⊕⊕⊕⊝ | OS similar in the Asian (HR 0.94, 0.82 to 1.06) and EGFR mutation positive subgroups (HR 0.97, 0.77 to 1.21) |
| Progression‐free survival (PFS) | The PFS ranged across control groups from 2 to 2.9 months | The mean PFS in the intervention group ranged from 1.9 to 2.7 months | HR 1.19 (0.86 to 1.65) | 275 | ⊕⊕⊕⊝ | PFS improved with gefitinib in the Asian subgroup (HR 0.65, 0.43 to 0.98) and the EGFR mutation positive subgroup (HR 0.47, 0.36 to 0.61) |
| *The basis for the assumed risk (e.g. the median control group risk across studies) is provided in footnotes. The corresponding risk (and its 95% confidence interval) is based on the assumed risk in the comparison group and the relative effect of the intervention (and its 95% CI). | ||||||
| GRADE Working Group grades of evidence | ||||||
| 1We downgraded the quality of evidence by one level because of serious indirectness as one study included only elderly patients (> 70 years old). | ||||||
| Gefitinib compared to chemotherapy for second‐line treatment of advanced NSCLC | ||||||
| Patient or population: advanced NSCLC | ||||||
| Outcomes | Illustrative comparative risks* (95% CI) | Relative effect | No of participants | Quality of the evidence | Comments | |
| Assumed risk | Corresponding risk | |||||
| Chemotherapy | Gefitinib | |||||
| Overall survival (OS) | The mean OS ranged across control groups from 7.1 to 8 months | The mean OS in the intervention group ranged from 7.5 to 7.6 months | HR 1.02 (0.91 to 1.15) | 1607 | ⊕⊕⊕⊝ | OS similar in Asian patients (HR 0.94, 0.79 to 1.12) and EGFR mutation positive patients (HR 0.83, 0.41 to 1.66). |
| Progression‐free survival (PFS) | The mean PFS ranged across control groups from 2.7 to 3.4 months | The mean PFS in the intervention group ranged from 2.2 to 3 months | HR 1.04 (0.92 to 1.17) | 1607 | ⊕⊕⊕⊝ | PFS significantly improved in Asian patients (HR 0.71, 0.57 to 0.88) and in patients positive for EGFR mutation (HR 0.24, 0.12 to 0.47) (ranged from 2.7 to 4.1 months versus 4.5 to 7 months). |
| *The basis for the assumed risk (e.g. the median control group risk across studies) is provided in footnotes. The corresponding risk (and its 95% confidence interval) is based on the assumed risk in the comparison group and the relative effect of the intervention (and its 95% CI). | ||||||
| GRADE Working Group grades of evidence | ||||||
| 1We downgraded the quality of evidence by one level because of imprecision based on the wide confidence interval. | ||||||
| Gefitinib compared to chemotherapy for advanced NSCLC | |||||
| Patient or population: advanced NSCLC | |||||
| Outcomes | Illustrative comparative risks* (95% CI) | Relative effect | No of participants | Quality of the evidence | |
| Assumed risk | Corresponding risk | ||||
| Chemotherapy | Gefitinib | ||||
| Skin rash | Study population | RR 2.40 | 1858 | ⊕⊕⊕⊕ | |
| 9 per 1000 | 21 per 1000 | ||||
| Constipation | Study population | RR 0.41 | 1719 | ⊕⊕⊕⊕ | |
| 19 per 1000 | 8 per 1000 | ||||
| Fatigue | Study population | RR 0.16 | 275 | ⊕⊕⊕⊝ | |
| 65 per 1000 | 10 per 1000 | ||||
| Asthenia | Study population | RR 0.51 | 1773 | ⊕⊕⊕⊕ | |
| 79 per 1000 | 40 per 1000 | ||||
| Neurotoxicity | Study population | RR 0.07 | 1529 | ⊕⊕⊕⊕ | |
| 29 per 1000 | 2 per 1000 | ||||
| Neutropenia | Study population | RR 0.04 | 1857 | ⊕⊕⊕⊕ | |
| 505 per 1000 | 20 per 1000 | ||||
| Febrile neutropenia | Study population | RR 0.12 | 1768 | ⊕⊕⊕⊕ | |
| 92 per 1000 | 11 per 1000 | ||||
| *The basis for the assumed risk (e.g. the median control group risk across studies) is provided in footnotes. The corresponding risk (and its 95% confidence interval) is based on the assumed risk in the comparison group and the relative effect of the intervention (and its 95% CI). | |||||
| GRADE Working Group grades of evidence | |||||
| 1We downgraded the quality of evidence by one level because of serious indirectness as one study included only elderly patients (> 70 years old). | |||||
Antecedentes
Descripción de la afección
El cáncer de pulmón de células no pequeñas (CPCNP) representa el 14% de todas las muertes relacionadas con el cáncer y es con mucho la principal causa de muerte debido al cáncer entre los hombres y las mujeres. En los Estados Unidos, se prevé que se diagnosticarán cerca de 234 030 nuevos casos de CPCNP, y que 154 050 muertes se deberán a CPCNP en 2018 (ACS 2018). La tasa de supervivencia de los pacientes con diagnóstico de CPCNP variará según el grado (estadio) del cáncer. Los pacientes con CPCNP localmente avanzado (estadio III o más) tienen una tasa de supervivencia a los cinco años del 5% al 36%, y las estimaciones de la supervivencia varían según el estadio al momento del diagnóstico (ACS 2018). El tratamiento activo del CPCNP consiste en cirugía, radioterapia y quimioterapia, administradas como tratamientos únicos o en combinación. Aunque se han producido adelantos médicos terapéuticos importantes en fechas recientes, no han sido suficientes para afectar de forma significativa las tasas altas de mortalidad y morbilidad asociadas con el cáncer de pulmón.
La patogenia de las neoplasias pulmonares es multifactorial, aunque en su mayoría se puede atribuir directamente a la exposición al humo del tabaco. El CPCNP que aparece en los fumadores tiene un espectro de anomalías moleculares diferente del de los no fumadores, lo que indica diferencias en la etiología, la patogenia y posiblemente el pronóstico. Las mutaciones de los genes supresores tumorales como el p53 y el retinoblastoma, la estimulación de los proto‐oncogenes como K‐ras, c‐myc y c‐raf, y la producción de factores de crecimiento autocrinos son algunos de los posibles mecanismos patógenos descritos hasta el presente en el desarrollo del cáncer de pulmón. Estudios de investigación recientes han identificado dos controladores oncogénicos, la mutación del receptor del factor de crecimiento epidérmico (EGFR) y la fusión EML4/ALK, para los que existen tratamientos dirigidos disponibles.
Descripción de la intervención
La familia de genes del receptor del factor de crecimiento epidérmico (EGFR) codifica una molécula transmembrana que se expresa ampliamente y aparece con frecuencia en los tumores sólidos. La sobreexpresión del EGFR se ha asociado con la patogenia, la proliferación, la invasión y las metástasis de diversos tumores sólidos, que incluyen el CPCNP. El EGFR se sobreexpresa en alrededor del 40% al 80% de los casos documentados de CPCNP y alrededor del 88% de los casos de CPCNP primario avanzado (Smith 2005).
Los inhibidores de la tirosina quinasa (ITK) se unen al dominio intracelular de la tirosina quinasa y pueden inhibir la señalización subsiguiente del EGFR. La inhibición de la tirosina quinasa puede, por lo tanto, bloquear la propagación de las células cancerosas mediada por el EGFR. Los ITK se pueden clasificar como reversibles o irreversibles, y como selectivos contra EGFR o activos contra otros miembros de la familia de receptores. En el cáncer de pulmón se han identificado mutaciones somáticas en la región del EGFR que codifica el dominio de tirosina quinasa del receptor (exones 18 a 21). Dichas mutaciones ocurren con mayor frecuencia en los pacientes con CPCNP que presentan subtipo adenocarcinoma, las mujeres, los pacientes asiáticos y los que nunca han fumado (Kosaka 2004; Paez 2004). Las mutaciones del EGFR se asocian con un aumento de la señalización del factor de crecimiento y con un aumento de la respuesta a los inhibidores de la tirosina quinasa (Mok 2011).
De qué manera podría funcionar la intervención
Gefitinib (Iressa, ZD 1839) es una anilinoquinazolina activa por vía oral que inhibe selectiva y reversiblemente la actividad intracelular de la tirosina quinasa del EGFR. Dos ensayos clínicos aleatorios de fase II grandes evaluaron la eficacia y la seguridad de la monoterapia con gefitinib en pacientes con CPCNP localmente avanzado o metastásico en los que fracasaron los regímenes anteriores de quimioterapia (Fukuoka 2003 IDEAL I; Kris 2003 IDEAL II). Ninguno mostró un efecto beneficioso agregado en cuanto a la supervivencia, el tiempo hasta la progresión ni las tasas de respuesta en comparación con la quimioterapia estándar sola. Sin embargo, estos ensayos de monoterapia demostraron un perfil de seguridad favorable. Un ensayo de fase III que comparó gefitinib con placebo en pacientes con CPCNP avanzado que habían recibido quimioterapia anterior mostró una mejoría en la supervivencia libre de progresión, pero no una prolongación de la supervivencia general (Thatcher 2005 ISEL). Desde estos primeros ensayos, varios ensayos controlados aleatorios (ECA) han examinado la efectividad de gefitinib versus placebo o quimioterapia, o en combinación con quimioterapia en ámbitos de tratamiento de primera y segunda línea. Varios estudios también han examinado su función como tratamiento de mantenimiento después del tratamiento en pacientes con CPCNP avanzado.
Por qué es importante realizar esta revisión
Aún no se ha establecido la efectividad clínica precisa de gefitinib en varias situaciones clínicas. Esta revisión reunirá toda la evidencia actual de su efectividad para guiar el tratamiento clínico y analizar los riesgos y efectos beneficiosos del tratamiento en pacientes con CPCNP.
Objetivos
Determinar la efectividad y la seguridad del gefitinib como tratamiento de primera línea, de segunda línea o de mantenimiento para el CPCNP avanzado.
Métodos
Criterios de inclusión de estudios para esta revisión
Tipos de estudios
Se consideraron todos los ensayos clínicos controlados aleatorios publicados y no publicados, de fase II y fase III, de gefitinib como tratamiento de primera o segunda línea o de mantenimiento para el CPCNP avanzado. Se incluyó cualquier ensayo controlado con placebo y ensayos que utilizaron comparadores. Se prefirieron los ensayos con asignación aleatoria y doble ciego, así como el análisis por intención de tratar. Se excluyeron los estudios cruzados, los estudios cuasialeatorios y los que investigaron el uso compasivo de gefitinib.
Tipos de participantes
Los ensayos elegibles incluyeron participantes adultos de 18 años de edad o más, de cualquier sexo, con CPCNP histológica o citológicamente confirmado (en estadio IIIB/IV) no curable con cirugía.
Tipos de intervenciones
Se consideró cualquier administración de gefitinib para el CPCNP avanzado. Lo anterior incluyó la administración de cualquier dosis de gefitinib como tratamiento de primera o segunda línea o tratamiento de mantenimiento:
-
Gefitinib a cualquier dosis comparado con placebo o el mejor tratamiento médico de apoyo.
-
Gefitinib a cualquier dosis comparado con agentes quimioterapéuticos.
-
Gefitinib a una dosis específica versus gefitinib a una dosis diferente.
-
Gefitinib versus gefitinib combinado con un régimen de quimioterapia.
-
Gefitinib a cualquier dosis en combinación con agentes quimioterapéuticos versus los mismos agentes quimioterapéuticos solos.
-
Gefitinib a cualquier dosis en combinación con agentes quimioterapéuticos versus una combinación diferente de agentes quimioterapéuticos.
Tipos de medida de resultado
Resultados primarios
-
Supervivencia general (SG), evaluada a partir de la fecha de la asignación al azar hasta la fecha de la muerte del paciente (tiempo transcurrido hasta la muerte).
-
Supervivencia libre de progresión (SLP):
-
Medida a partir de la fecha de la asignación al azar hasta la fecha de la progresión objetiva de la enfermedad, según los criterios Response Evaluation Criteria in Solid Tumours (RECIST), la versión revisada de la International Union Against Cancer/WHO (Therasse 2000).
-
Tiempo hasta el fracaso del tratamiento (TFT) medido a partir de la fecha de la asignación al azar hasta la fecha de interrupción del estudio (por cualquier motivo). Lo anterior se puede informar en lugar de la SLP en algunos estudios.
-
-
Toxicidad (calificada según los National Cancer Institute Common Toxicity Criteria o los criterios de la Organización Mundial de la Salud (NCI CTCAE 2010).
-
Sin embargo, se aceptó cualquier definición utilizada en los ensayos individuales. Un cociente de riesgos (CR) significativamente mayor de 1 (CR > 1) es una respuesta positiva a favor de gefitinib.
-
Resultados secundarios
-
Mediana de la supervivencia general (SG) y la supervivencia libre de progresión (SLP).
-
Tasa de supervivencia al año (TS1a).
-
Respuesta tumoral, definida según los criterios RECIST (Therasse 2000):
-
Respuesta completa (RC), definida como la desaparición de todas las lesiones objetivo.
-
Respuesta parcial (RP), definida como al menos una disminución del 30% en la suma del diámetro máximo de las lesiones objetivo.
-
Tasa de respuesta general (TRG), tomada como la suma de la tasa de respuesta completa (RC) y las tasas de respuesta parcial (RP).
-
Enfermedad estable (EE), definida como ninguna disminución suficiente para calificarla como respuesta parcial ni aumento suficiente para calificarla como enfermedad progresiva.
-
Tasa de control de la enfermedad (TCE), definida como la suma de la TRG y la tasa de EE. Lo anterior representa todas las lesiones que han respondido al tratamiento o se han estabilizado como resultado del tratamiento.
-
-
Calidad de vida (CdV) y respuesta de los síntomas medida con el instrumento de calidad de vida Functional Assessment of Cancer Therapy‐Lung (FACT‐L), la subescala de cáncer de pulmón (LCS por sus siglas en inglés), el Trial Outcome Index (TOI) y el Pulmonary Symptom Index (Cella 1995).
Results
Description of studies
Results of the search
The search strategy yielded 5703 studies or abstracts of which 127 studies were possibly eligible. Of these, we included 62 publications in this review, representing 35 primary studies and 27 publications that presented data from their respective primary studies. Fifty‐six were published in abstract form only and we found the remaining nine studies to be ineligible (Figure 1).

Study flow diagram for searches 1966‐2017.
(EGFR: epidermal growth factor receptor)
Included studies
We included a total of 35 separate primary studies in this review and these trials randomised a total of 12,089 patients. Seventeen of the eligible studies were multicentre, phase III trials (Gaafar 2011 EORTC08021; Giaccone 2004 INTACT I; Han 2012 First SIGNAL; Herbst 2004 INTACT II; Kelly 2008 SWOG S0023; Kim 2008 INTEREST; Lee 2010 ISTANA; Maemondo 2010 NEJ002; Maruyama 2008 V‐15‐32; Mitsudomi 2010 WJTOG3405; Mok 2009 IPASS; Soria 2015 IMPRESS; Sun 2012 KCSG‐LU08‐01; Takeda 2010 WJTOG0203; Thatcher 2005 ISEL; Yang 2014; Zhang 2012 INFORM). The remaining 18 were phase II studies (Ahn 2012; An 2016; Chen 2007; Chen 2011; Cheng 2016; Crino 2008 INVITE; Cufer 2006 SIGN; Dai 2013; Fukuoka 2003 IDEAL I; Goss 2009 INSTEP; Kim 2016; Kris 2003 IDEAL II; Li 2010; Lou 2014; Morere 2010 IFCT‐0301; Xu 2015; Xue 2015; Yu 2014). A summary of the 35 included primary studies is presented in Table 1. An additional 14 publications analysed data from their respective primary studies (Bell 2005; Boye 2016; Cella 2005; Chang 2006; Douillard 2010; Fukuoka 2011; Hirsch 2006; Herbst 2005; Inoue 2013; Oizumi 2012; Sekine 2009; Thongprasert 2011; Yamamoto 2010; Yang 2015). If we used data from these secondary studies, we did not duplicate with data from the respective primary studies and vice versa.
| Author/Year (Study name) | Journal | N | Comparison | Inclusion criteria | Phase | Asian | EGFR mutation | Line? |
| 1. Gefitinib versus placebo | ||||||||
| Goss 2009 (INSTEP) | JCO 27(13):2253‐2260 | 201 | Placebo | Poor PS | II | N | Subgroup | 1st line |
| Thatcher 2005 (ISEL) | Lancet 366:1527‐37 | 1692 | Placebo | — | III | Subset (Chang) | Subgroup (Hirsch) | 2nd line |
| Gaafar 2011 (EORTC08021) | Eur J Cancer (47):2331‐2340 | 173 | Placebo | Maintenance | III | N | N | Maintenance |
| Kelly 2008 (SWOGS0023) | JCO 26(15):2450‐2456 | 243 | Placebo | Consolidation | III | N | N | Maintenance |
| Zhang 2012 (INFORM) | Lancet Oncology 13:466‐475 | 296 | Placebo | Maintenance | III | Y | Subgroup | Maintenance |
| 2. Gefitinib versus chemotherapy | ||||||||
| Crino 2008 (INVITE) | JCO 26(26):4253‐4260 | 196 | Vinorelbine | Elderly patients | II | N | Subgroup | 1st line |
| Lou 2014 | Natl Med J China 94(30): 2337‐2341 | 51 | Carboplatin + paclitaxel | Asian | II | Y | N | 1st line |
| Morere 2010 (IFCT0301) | Lung Cancer 70:301‐307 | 85 | Docetaxel | Poor PS | II | N | N | 1st line |
| Han 2013 (First‐SIGNAL) | JCO 30(10): 1122‐1128 | 313 | Gemcitabine + cisplatin | — | III | Y | Planned Subgroup | 1st line |
| Mok 2009 (IPASS) | NEJM 361(10):947‐957 | 1217 | Carboplatin + paclitaxel | Asian, adenocarcinomas | III | Y | Subgroup | 1st line |
| Maemondo 2010 (NEJ002) | NEJM 362(25):2580‐2588 | 230 | Carboplatin + paclitaxel | Asian, EGFR mutation | III | Y | Y | 1st line |
| Mitsudomi 2010 (WJTOG3405) | Lancet Oncol 11:121‐128 | 177 | Cisplatin + docetaxel | Asian, EGFR mutation | III | Y | Y | 1st line |
| Yang 2014 | Eur J Cancer 50:2219‐2230 | 236 | Pemetrexed + cisplatin | Asian | III | Y | Subgroup | 1st line + maintenance |
| Cufer 2006 (SIGN) | Anti‐cancer Drugs 14:401‐409 | 141 | Docetaxel | Open‐label | II | N | N | 2nd line |
| Dai 2013 | Chin J Lung Cancer 16(8):405‐410 | 46 | Pemetrexed | Asian | II | Y | N | 2nd line |
| Kim 2016 | Cancer Res Treat 48(1):80‐87 | 95 | Pemetrexed | Asian | II | Y | N | 2nd/3rd line |
| Li 2010 | Chinese J Clin Onc 37:16‐18 | 98 | Docetaxel | Asian | II | Y | N | 2nd line |
| Kim 2008 (INTEREST) | Lancet 372:1809‐1818 | 1466 | Docetaxel | — | III | N | Subgroup (Doulliard) | 2nd line |
| Lee 2010 (ISTANA) | Clin Cancer Res 16(4):1307‐1314 | 161 | Docetaxel | Asian | III | Y | N | 2nd/3rd line |
| Maruyama 2008 (V‐15‐32) | JCO 26(26):4244‐4252 | 489 | Docetaxel | Asian | III | Y | Subgroup | 2nd/3rd line |
| Sun 2012 (KSCG‐LU08‐01) | Cancer 118:6234‐6242 | 141 | Pemetrexed | Adenocarcinoma, non‐smoker | III | Y | Subgroup | 2nd line |
| Ahn 2012 | Lung Cancer 77:346‐352 | 73 | Pemetrexed | Asian, never‐smokers | II | Y | N | Maintenance |
| Xu 2015 | Int J Clin Exp Med 8(4):6242‐6246 | 188 | Pemetrexed | Asian | II | Y | N | Maintenance |
| 3. Gefitinib 250 mg versus gefitinib 500 mg | ||||||||
| Fukuoka 2003 (IDEAL I) | JCO 21(12):2237‐2246 | 210 | G250 versus G500 | — | II | N | N | 2rd/3rd line |
| Kris 2003 (IDEAL II) | JAMA 290(16):2149‐2158 | 216 | G250 versus G500 | — | II | N | N | 3rd line |
| Xue 2015 | Int J Clin Exp Med 8(4):6242‐6246 | 188 | G250 versus G500 | Asian | II | Y | N | Maintenance |
| 4. Gefitinib versus gefitinib + chemotherapy | ||||||||
| An 2016 | Pathol Oncol Res 22:763‐768 | 90 | Gefitinib + Pemetrexed | Asian, EGFR mutation | II | Y | Y | 1st line |
| Cheng 2016 | JCO 34(27): 3258‐3266 | 191 | Gefitinib + Pemetrexed | Asian, EGFR mutation | II | Y | Y | 1st line |
| Chen 2007 | Cancer 109:1821‐8 | 48 | Gefitinib + Vinorelbine | Adenocarcinoma | II | N | Subgroup | 3rd line |
| Chen 2011 | J Thor Oncol 6:1110‐1116 | 115 | Gefitinib + Tegafur | Adenocarcinoma | II | Y | Subgroup | 2nd/3rd line |
| 5. Gefitinib + chemotherapy versus chemotherapy | ||||||||
| Giaccone 2004 (INTACT I) | JCO 22(5):777‐784 | 1093 | Gemcitabine + Cisplatin | — | III | N | N | 1st line |
| Herbst 2004 (INTACT II) | JCO 22(5):785‐794 | 1037 | Carboplatin + paclitaxel | — | III | N | N | 1st line |
| Takeda 2010 (WTOG0203) | JCO 28(5):753‐760 | 604 | Platinum doublet | — | III | Y | N | 1st line |
| Yu 2014 | Cancer Biology & Therapy 15:832‐839 | 117 | Pemetrexed + platinum | Asian | II | Y | N | 1st line |
| Soria 2015 (IMPRESS) | Lancet Oncology 16:990‐98 | 265 | Pemetrexed + cisplatin | EGFR mutation positive | III | N | Y | 2nd line |
EGFR: epidermal growth factor receptor
N: number of patients included
PS: performance status
Journals:
Cancer Res Treat: Cancer Research and Treatment
Chin J Lung Cancer: Chinese Journal of Lung Cancer
Chinese J Clin Onc: Chinese Journal of Clinical Oncology
Clin Cancer Res: Clinical Cancer Research
Eur J Cancer: European Journal of Cancer
Int J Clin Exp Med: International Journal of Clinical and Experimental Medicine
J Thor Oncol: Journal of Thoracic Oncology
JCO: Journal of Clinical Oncology
Natl Med J China: National Medical Journal of China
NMEJ: New England Journal of Medicine
Pathol Oncol Res: Pathology and Oncology Research
The duration of gefitinib therapy varied between studies. Most studies continued therapy until there was disease progression, unacceptable toxicity or withdrawal. Two studies administered gefitinib for six or eight weeks (Chen 2007; Morere 2010 IFCT‐0301). The shortest reported median duration of treatment was 50 days (Goss 2009 INSTEP) and the longest 308 days (Maemondo 2010 NEJ002).
Please refer to the Characteristics of included studies for full details of included studies. Study characteristics have also been summarised in Table 1.
The various comparisons can be seen in the Data and analyses section.
1. Gefitinib at any dose compared with placebo or best supportive care for NSCLC
-
General population (Comparison 1)
Three phase III studies (Gaafar 2011 EORTC08021; Kelly 2008 SWOG S0023; Thatcher 2005 ISEL) and a single phase II study (Goss 2009 INSTEP) compared gefitinib with placebo. The ISEL (Thatcher 2005 ISEL), INSTEP (Goss 2009 INSTEP), EORTC 08021 (Gaafar 2011 EORTC08021) and SWOGS0023 (Kelly 2008 SWOG S0023) trials examined survival outcomes, objective response rates and toxicity in the general population. The INSTEP study randomised chemotherapy‐naive patients to 250 mg of gefitinib or placebo as first‐line therapy. The ISEL study studied its effects as second‐line therapy in advanced NSCLC. Detailed subgroup analysis was conducted in the ISEL population and subsequently published. These two studies are also presented below as subgroup analyses (Chang 2006; Hirsch 2006). Subgroups were assessed for evidence by subgroup interactions, thus ensuring that outcomes were indeed different. Pre‐planned subgroup analysis of patients of Asian ethnicity was presented in Chang 2006 and analysis of molecular predictors of outcome was presented in Hirsch 2006. The SWOGS0023 and EORTC08021 studies assessed the effect of gefitinib versus placebo as maintenance therapy after initial treatment. In the SWOG study, patients were included after receiving concurrent cisplatin/etoposide chemotherapy with thoracic radiation (45 Gy, 1.8 Gy per fraction). The EORTC08021 trial included patients not progressing after first‐line platinum doublet chemotherapy. We studied a total of 2605 patients in this group.
-
Asian population (Comparison 2)
The INFORM study assessed the use of gefitinib as maintenance therapy in an East Asian patient group (Zhang 2012 INFORM). These patients had achieved disease control after first‐line platinum‐based chemotherapy. Chang 2006 selected only ISEL patients who were of Asian ethnicity. This subgroup represented 20% of the original ISEL population, a total of 342 patients. We included a total of 638 patients in this group.
-
EGFR mutation positive population (Comparison 3)
Zhang 2012 INFORM performed planned subgroup analysis on EGFR mutation positive patients and 30 of 79 (38%) tissue tumour samples were positive for EGFR mutations. Hirsch 2006 analysed ISEL tumour biopsy samples to examine the relationships between biomarkers and clinical outcome after gefitinib administration. Two‐hundred and fifteen of 1692 patients (12.7%) in the ISEL trial were assessable for mutation detection. Of these, 26 (12.1%) patients were positive for EGFR mutations. Other biomarkers examined included EGFR gene copy number, EGFR and p‐Akt protein expression and KRAS and BRAF mutations. Data from these other biomarkers are beyond the scope of this review.
2. Gefitinib at any dose compared with other chemotherapeutic agents
We included 18 primary studies in this analysis (Ahn 2012; Crino 2008 INVITE; Cufer 2006 SIGN; Dai 2013; Han 2012 First SIGNAL; Kim 2008 INTEREST; Kim 2016; Lee 2010 ISTANA; Li 2010; Lou 2014; Maemondo 2010 NEJ002; Maruyama 2008 V‐15‐32; Mitsudomi 2010 WJTOG3405; Mok 2009 IPASS; Morere 2010 IFCT‐0301; Sun 2012 KCSG‐LU08‐01; Xu 2015; Yang 2014). Nine of these studies were multicentre, randomised, phase III trials.
These 18 primary studies randomised a total of 5400 patients.
-
General population (Comparison 4)
Four studies, SIGN (Cufer 2006 SIGN), INTEREST (Kim 2008 INTEREST), INVITE (Crino 2008 INVITE) and IFCT‐0301 (Morere 2010 IFCT‐0301), compared gefitinib with chemotherapy in 1888 patients and data from these are presented in Comparison 4. Two studies compared gefitinib with first‐line chemotherapy (Crino 2008 INVITE; Morere 2010 IFCT‐0301) and the other two studies compared it with second‐line chemotherapy (Cufer 2006 SIGN; Kim 2008 INTEREST). 'Iressa in NSCLC versus Vinorelbine Investigation in the Elderly' (INVITE) was a randomised, multicentre, phase II trial that compared gefitinib with vinorelbine as first‐line therapy in elderly patients (Crino 2008 INVITE). IFCT‐0301 compared gefitinib, gemcitabine and docetaxel in chemotherapy‐naive patients with a performance status of 2 or 3 (Morere 2010 IFCT‐0301). SIGN (Second‐line Indication of Gefitinib in NSCLC) was a phase II, randomised study comparing gefitinib with docetaxel as second‐line therapy (Cufer 2006 SIGN). INTEREST (Iressa NSCLC Trial Evaluating Response and Survival again Taxotere) was a phase III trial, which assessed the non‐inferiority of gefitinib to docetaxel as second‐line therapy (Kim 2008 INTEREST). Douillard 2010 performed a preplanned secondary analysis to investigate the relationship between biomarkers and clinical outcomes in the INTEREST population. We included a total of 1888 patients in this group.
-
Asian population (Comparison 5)
Fourteen studies selected Asian patients only (Ahn 2012; Dai 2013; Han 2012 First SIGNAL; Kim 2016; Lee 2010 ISTANA; Li 2010; Lou 2014; Maruyama 2008 V‐15‐32; Mok 2009 IPASS; Mitsudomi 2010 WJTOG3405; Maemondo 2010 NEJ002; Sun 2012 KCSG‐LU08‐01; Xu 2015; Yang 2014), of which all except six (Ahn 2012; Dai 2013; Kim 2016; Li 2010; Lou 2014; Xu 2015) were phase III studies. We included a total of 3512 patients in this group.
First‐line studies
Five phase III studies (Han 2012 First SIGNAL; Maemondo 2010 NEJ002; Mitsudomi 2010 WJTOG3405; Mok 2009 IPASS; Yang 2014) and one phase II study (Lou 2014) compared gefitinib with first‐line chemotherapy. IPASS compared gefitinib with carboplatin‐paclitaxel, but in Asian patients with adenocarcinoma who were light or never‐smokers (Mok 2009 IPASS). Maemondo 2010 NEJ002 randomised Asian chemotherapy‐naive patients with EGFR mutations to receive gefitinib or carboplatin‐paclitaxel. WJTOG3405 compared gefitinib with cisplatin plus docetaxel in Asian patients with EGFR mutations (Mitsudomi 2010 WJTOG3405). First‐SIGNAL compared first‐line gefitinib with gemcitabine plus cisplatin in Asian never‐smokers with lung adenocarcinoma (Han 2012 First SIGNAL). The phase III study by Yang 2014 compared first‐line pemetrexed and cisplatin followed by gefitinib maintenance therapy with gefitinib monotherapy alone in Asian non‐smoking patients. Patients were randomised at trial entry to either gefitinib or pemetrexed plus cisplatin chemotherapy. Patients in both arms then continued with maintenance gefitinib. Data were analysed in the intention‐to‐treat population and only data from the first phase of the study were included in this analysis. In the phase II study by Lou 2014, gefitinib was compared with carboplatin and paclitaxel in Asian patients who were either non‐smokers or light ex‐smokers.
We analysed a total of 2224 patients from the six studies in this group.
Second‐line studies
Three phase III studies (Lee 2010 ISTANA; Maruyama 2008 V‐15‐32; Sun 2012 KCSG‐LU08‐01) and three phase II studies (Dai 2013; Kim 2016; Li 2010) compared gefitinib with second‐line chemotherapy. ISTANA (Lee 2010 ISTANA), V‐15‐32 (Maruyama 2008 V‐15‐32) and the phase II study by Li 2010 included patients of Asian ethnicity but where mutation status was not always known, and compared gefitinib with docetaxel. KCSG‐LU08‐01 (Sun 2012 KCSG‐LU08‐01), Dai 2013 and Kim 2016 selected Asian patients with unknown EGFR status and compared gefitinib with second‐line pemetrexed. Secondary studies published by Sekine 2009 and Yamamoto 2010 conducted analyses on quality of life and disease control respectively in the V‐15‐32 trial.
We analysed a total of 1030 patients from the six studies in this group.
Maintenance studies
Two phase II studies compared the role of gefitinib as maintenance to chemotherapy. Ahn 2012 randomised Asian non‐smokers not progressing after first‐line pemetrexed‐cisplatin, to receive either gefitinib or pemetrexed ± cisplatin, in a two‐staged study design. Xu 2015 compared single‐agent pemetrexed with gefitinib in Asian patients not progressing after four to eight cycles of first‐line chemotherapy.
We analysed 258 patients in this group.
-
EGFR mutation positive population (Comparison 6)
Nine studies were included in this group, six of which were first‐line studies (Crino 2008 INVITE; Han 2012 First SIGNAL; Maemondo 2010 NEJ002; Mitsudomi 2010 WJTOG3405; Mok 2009 IPASS; Yang 2014) and three of which were second‐line studies (Kim 2008 INTEREST; Maruyama 2008 V‐15‐32; Sun 2012 KCSG‐LU08‐01).
We included a total of 879 patients in this group.
Two phase III studies selected patients of Asian ethnicity who were also positive for EGFR mutations and compared gefitinib with first‐line carboplatin and paclitaxel or cisplatin and docetaxel respectively (Maemondo 2010 NEJ002; Mitsudomi 2010 WJTOG3405). In contrast, the IPASS (Mok 2009 IPASS) and First‐SIGNAL (Han 2012 First SIGNAL) studies selected Asian patients with adenocarcinomas, and conducted planned subgroup analyses on the EGFR mutation positive patients. IPASS compared first‐line gefitinib with carboplatin and paclitaxel and First‐SIGNAL compared gefitinib with gemcitabine and cisplatin. Yang 2014 conducted a post‐hoc analysis of EGFR mutation positive patients and compared first‐line pemetrexed and cisplatin followed by gefitinib maintenance with gefitinib alone. The INVITE phase II study in elderly patients that compared first‐line gefitinib with vinorelbine also conducted analysis of EGFR mutation positive patients but this study did not include any data that could be pooled (Crino 2008 INVITE).
We analysed a total of 802 patients in this group.
A further three phase III studies compared second‐line gefitinib with chemotherapy and conducted subgroup analyses in the EGFR mutation positive patients (Kim 2008 INTEREST; Maruyama 2008 V‐15‐32; Sun 2012 KCSG‐LU08‐01). INTEREST and V‐15‐32 compared gefitinib with docetaxel and KCSG‐LU08‐01 compared gefitinib with pemetrexed in this second‐line setting. The INTEREST study also analysed other biomarkers, such as EGFR gene copy number, EGFR protein expression and KRAS mutations, in addition to EGFR mutations. One study did not publish data that could be pooled (Maruyama 2008 V‐15‐32) and thus we included a total of 77 patients in this group.
3. Gefitinib at a specific dose versus a different dose (Comparison 7)
Three phase II studies compared the effect of two different doses of gefitinib, 250 mg and 500 mg in 527 patients (Fukuoka 2003 IDEAL I; Kris 2003 IDEAL II; Xue 2015). IDEAL I (Fukuoka 2003 IDEAL I) and IDEAL II (Kris 2003 IDEAL II) were multicentre, randomised, double‐blind, phase II studies that evaluated two doses of gefitinib (250 mg/day and 500 mg/day) as second‐ or third‐line therapy.
We analysed 431 patients in this group.
The third study randomised 96 patients who were stable after one month of gefitinib (250 mg/day) to either 250 mg/day or 500 mg/day as maintenance therapy (Xue 2015).
4. Gefitinib versus gefitinib combined with a chemotherapy regimen (Comparison 8)
Four studies compared gefitinib alone or in combination with chemotherapy. Two recently published studies examined the addition of chemotherapy to gefitinib versus gefitinib alone in the first‐line setting. A small study by An 2016 recruited 90 East Asian patients with an EGFR mutation and randomised them to receive gefitinib or gefitinib plus pemetrexed (500 mg/m2). In this study, pemetrexed or placebo was administered via intravenous infusion on day 1 of a 21‐day cycle. Gefitinib 250 mg was administered on days 2 to 16. A multicentre, phase II study by Cheng 2016 also compared gefitinib with and without pemetrexed as first‐line therapy. This study recruited 191 East Asian patients from China, Japan, Korea and Taiwan with advanced non‐squamous NSCLC with an activating EGFR mutation. Patients either received gefitinib 250 mg per day or gefitinib plus pemetrexed (500 mg/m2) infusion on day 1 of a 21‐day cycle.
We included a total of 281 patients in this group.
Chen 2007 compared 250 mg of daily oral gefitinib with gefitinib plus vinorelbine (15 mg/m2) every two weeks in 48 patients of Asian ethnicity with stage IV adenocarcinoma who had failed at least two lines of chemotherapy. Chen 2011 compared gefitinib alone with the combination of gefitinib plus tegafur (100 mg)/uracil (224 mg) in 115 Taiwanese patients with stage IIIB or IV adenocarcinoma who had failed first‐line chemotherapy.
We included a total of 163 patients in this group.
5. Gefitinib at any dose in combination with other chemotherapeutic agents versus the same chemotherapy agents alone (Comparison 9)
Five studies examined survival outcomes, objective response rates and toxicity (Giaccone 2004 INTACT I; Herbst 2004 INTACT II; Soria 2015 IMPRESS; Takeda 2010 WJTOG0203; Yu 2014). Overall, we included a total of 3110 patients.
INTACT I (Giaccone 2004 INTACT I) and INTACT II (Herbst 2004 INTACT II) were large, multicentre trials that examined the effect of the addition of two different doses of gefitinib to a chemotherapy regimen with the chemotherapy alone in chemotherapy‐naive patients. INTACT I compared the effect of the addition of gefitinib to a chemotherapy regimen that included gemcitabine and cisplatin and INTACT II a paclitaxel and carboplatin regime. WJTOG0203 compared the addition of 250 mg of gefitinib to platinum‐doublet chemotherapy in chemotherapy‐naive Japanese patients (Takeda 2010 WJTOG0203). In this study, patients were randomised to receive platinum doublet chemotherapy (Arm A) or platinum‐doublet chemotherapy for three cycles followed by gefitinib until disease progression (Arm B). The phase II study by Yu 2014 examined the addition of gefitinib to a first‐line pemetrexed and cisplatin chemotherapy schedule in Asian patients who were non‐smokers or light ex‐smokers.
In this group, we included 2845 patients.
The IMPRESS study was a phase III, multicentre study conducted across Europe and the Asia‐Pacific region (Soria 2015 IMPRESS). This study selected patients with EGFR mutation positive advanced NSCLC who had failed first‐line therapy with gefitinib. This study compared second‐line gefitinib plus chemotherapy (cisplatin and pemetrexed) with placebo plus the same chemotherapy regimen (cisplatin and pemetrexed). Two hundred and sixty‐five patients were included in this trial.
6. Gefitinib at any dose in combination with other chemotherapeutic agents versus a different combination of chemotherapeutic agent (Comparison 10)
No studies compared gefitinib in combination with a chemotherapeutic regime with a different regime of agents.
Data for all endpoints were not available in all published reports. A summary of efficacy and survival data is presented in Table 2.
| Study | ORR (%) | PFS (months) | OS (months) | ||||||
| 1. Gefitinib versus placebo | Gefitinib | Control | P | Gefitinib | Control | P | Gefitinib | Control | P |
| 1st line | |||||||||
| Goss 2009 | 6 | 1.0 | NS | 1.43 | 1.37 | NS | 3.7 | 2.8 | NS |
| 2nd line | |||||||||
| Thatcher 2005 ISEL | 37.5 | 48.3 | NS | 3 | 2.6 | 0.0006 | 5.6 | 5.1 | 0.087 |
| Maintenance therapy | |||||||||
| Kelly 2008 SWOGS0023 | ‐ | ‐ | ‐ | 8.3 | 11.7 | NS | 23 | 35 | 0.013 |
| Gaafar 2011 EORTC08021 | 12 | 1 | 0.004 | 4.1 | 2.9 | 0.0015 | 10.9 | 9.4 | NS |
| 2. Gefitinib versus placebo (Asian population) | Gefitinib | Control | P | Gefitinib | Control | P | Gefitinib | Control | P |
| Chang 2006 ISEL | 12.4 | 2.1 | 0.01 | 4.4 | 2.2 | 0.008 | 9.5 | 5.5 | 0.01 |
| Zhang 2012 INFORM | 24 | 1 | 0.0001 | 4.8 | 2.6 | < 0.0001 | 18.7 | 16.0 | NS |
| 3. Gefitinib versus placebo (EGFR mutation positive) | Gefitinib | Control | P | Gefitinib | Control | P | Gefitinib | Control | P |
| Zhang 2012 INFORM | ‐ | ‐ | ‐ | 16.6 | 2.8 | 0.0063 | 46.87 | 20.97 | 0.036 |
| Gefitinib vs chemotherapy | |||||||||
| 4. General population | Gefitinib | Chemo | P | Gefitinib | Chemo | P | Gefitinib | Chemo | P |
| versus 1st line chemotherapy | |||||||||
| Crino 2008 INVITE | 3.1 | 5.1 | ‐ | 2.7 | 2.9 | NS | 5.9 | 8 | NS |
| Morere 2010 IFCT0301 | ‐ | ‐ | ‐ | 1.9 | 2 | 0.078 | 2.2 | 3.5 | 0.088 |
| Morere 2010 IFCT0301 (Adenocarcinoma) | ‐ | ‐ | ‐ | 1.9 | 2.1 | 0.272 | 2.3 | 4.4 | NS |
| versus 2nd line chemotherapy | |||||||||
| Cufer 2006 SIGN | 13.2 | 13.7 | NS | 7.5 | 7.1 | NS | 3 | 3.4 | NS |
| Kim 2008 INTEREST | 9.1 | 7.6 | NS | 2.2 | 2.7 | NS | 7.6 | 8 | NS |
| Kim 2008 INTEREST | ‐ | ‐ | ‐ | ‐ | ‐ | ‐ | 8.5 | 8.9 | NS |
| 5. Asian population | Gefitinib | Chemo | P | Gefitinib | Chemo | P | Gefitinib | Chemo | P |
| versus 1st line chemotherapy | |||||||||
| Lou 2014 | 36 | 42.3 | NS | 4.2 | 8.3 | NS | 14.4 | 15 | NS |
| Maemondo 2010 (EGFR mutation positive) | 73.7 | 30.7 | < 0.001 | 10.8 | 5.4 | < 0.001 | 30.5 | 23.6 | NS |
| Mitsudomi 2010 WJTOG (EGFR mutation positive) | 62.1 | 32.2 | < 0.0001 | 9.2 | 6.3 | < 0.0001 | ‐ | ‐ | ‐ |
| Mok 2009 IPASS | 43 | 32.2 | < 0.001 | 5.7 | 5.8 | NS | 18.6 | 17.3 | NS |
| Han 2012 First‐SIGNAL (adenocarcinoma) | 55.4 | 46 | NS | 5.8 | 6.4 | NS | 22.3 | 22.9 | NS |
| Yang 2014 (Asian) | 47.5 | 41.5 | NS | 9.63 | 8.38 | NS | 27.9 | 26.9 | NS |
| versus 2nd line chemotherapy | |||||||||
| Dai 2013 | 17.4 | 13 | NS | 4.4 | 3.1 | NS | ‐ | ‐ | ‐ |
| Kim 2016 | 8 | 13 | NS | 2 | 2 | NS | 8.5 | 8.5 | NS |
| Li 2010 | 22.4 | 18.8 | NS | ‐ | ‐ | ‐ | 7.1 | 6.9 | NS |
| Kim 2008 INTEREST (subgroup) | ‐ | ‐ | ‐ | ‐ | ‐ | ‐ | 10.4 | 12.2 | NS |
| Lee 2010 ISTANA | 28.1 | 7.6 | 0.0007 | 3.3 | 3.4 | NS | 14.1 | 12.2 | NS |
| Maruyama 2008 V‐15‐32 | 22.5 | 12.8 | 0.009 | 2 | 2 | NS | 11.5 | 14 | NS |
| Sun 2012 KCSG‐LU08‐01 (adenocarcinoma, subgroup) | 58.8 | 22.4 | < 0.001 | 9.0 | 3.0 | 0.0006 | 22.2 | 18.9 | NS |
| versus maintenance therapy | |||||||||
| Ahn 2012 (Asian) | 46 | 35 | NS | 9.95 | 6.83 | NS | ‐ | ‐ | ‐ |
| Xu 2015 (Asian) | 18.1 | 29.8 | NS | ‐ | ‐ | ‐ | ‐ | ‐ | ‐ |
| 6. EGFR mutation positive | Gefitinib | Chemo | P | Gefitinib | Chemo | P | Gefitinib | Chemo | P |
| versus 1st line chemotherapy | |||||||||
| Maemondo 2010 (EGFR mutation positive) | 73.7 | 30.7 | < 0.001 | 10.8 | 5.4 | < 0.001 | 30.5 | 23.6 | NS |
| Mitsudomi 2010 WJTOG (EGFR mutation positive) | 62.1 | 32.2 | < 0.0001 | 9.2 | 6.3 | < 0.0001 | ‐ | ‐ | ‐ |
| Mok 2009 IPASS (subgroup) | 71.2 | 47.3 | < 0.001 | ‐ | ‐ | ‐ | ‐ | ‐ | ‐ |
| Han 2012 First‐SIGNAL (subgroup) | 84.6 | 37.5 | 0.002 | ‐ | ‐ | ‐ | ‐ | ‐ | ‐ |
| Yang 2014 (subgroup) | 70.8 | 65.4 | NS | 16.62 | 12.91 | NS | 45.7 | 32.4 | 0.255 |
| versus 2nd line chemotherapy | |||||||||
| INTEREST Doulliard 2010 (subgroup) | 42.1 | 21.1 | 0.04 | 7 | 4.1 | 0.001 | 14.2 | 16.6 | NS |
| Maruyama 2008 (subgroup) | 67 | 46 | ‐ | ‐ | ‐ | ‐ | ‐ | ‐ | ‐ |
| Sun 2012 KCSG‐LU08‐01 (subgroup) | ‐ | ‐ | ‐ | 15.7 | 2.9 | 0.005 | ‐ | ‐ | ‐ |
| 7. Gefitinib 250 mg versus gefitinib 500 mg | 250 mg | 500 mg | P | 250 mg | 500 mg | P | 250 mg | 500 mg | P |
| 2nd+ line | |||||||||
| Fukuoka 2003 | 18.4 | 19 | NS | 2.7 | 2.8 | NS | 7.6 | 8 | NS |
| Kris 2004 | 12 | 9 | NS | ‐ | ‐ | ‐ | 7 | 6 | NS |
| Maintenance therapy | |||||||||
| Xue 2015 (Asian) | 12.5 | 12.5 | NS | ‐ | ‐ | ‐ | ‐ | ‐ | ‐ |
| 8. Gefitinib versus gefitinib + chemotherapy | Gefitinib | G + Chemo | P | Gefitinib | G + Chemo | P | Gefitinib | G + Chemo | P |
| 1st line | |||||||||
| An 2016 | 73.33 | 80 | NS | 14 | 18 | < 0.05 | 32 | 34 | NS |
| Cheng 2016 | 74 | 80 | NS | 10.9 | 15.8 | 0.014 | ‐ | ‐ | ‐ |
| 2nd+ line | |||||||||
| Chen 2007(Asian, adenocarcinoma) | 55.6 | 52.4 | NS | 7.1 | 12.8 | NS | 13.3 | 23.4 | NS |
| Chen 2011(Asian, adenocarcinoma) | 35 | 37 | NS | 5.3 | 8.3 | 0.04 | ‐ | ‐ | ‐ |
| Chen 2011 (EGFR mutation positive subgroup) | ‐ | ‐ | ‐ | 7.6 | 14.4 | 0.0061 | ‐ | ‐ | ‐ |
| 9. Gefitinib + chemotherapy versus chemotherapy | 250 mg + Chemo | Chemo | P | 250 mg + Chemo | Chemo | P | 250 mg + Chemo | Chemo | P |
| 1st line | |||||||||
| Giaccone 2004 | 51.2 | 47.2 | NS | 5.8 | 6 | NS | 9.9 | 10.9 | NS |
| Herbst 2004 | 30.4 | 28.7 | NS | 5.3 | 5 | NS | 9.8 | 9.9 | NS |
| Takeda 2010 (Asian) | 34.2 | 29.3 | NS | 4.3 | 4.6 | < 0.001 | 12.9 | 13.7 | NS |
| Yu 2014 (Asian) | 47.4 | 50 | NS | 7.9 | 7 | NS | 25.4 | 20.5 | NS |
| 2nd line | |||||||||
| Soria 2015 IMPRESS (EGFR mutation positive) | 32 | 34 | NS | 5.4 | 5.4 | NS | 14.8 | 17.2 | NS |
Chemo: chemotherapy
G: gefitinib
NS: non‐significant
ORR: overall response rate
OS: overall survival
PFS: progression‐free survival
Risk of bias in included studies
We included trials that met our inclusion criteria. We checked all data extracted for accuracy and final database entries. We resolved any discrepancies through discussion. Overall, the risk of bias in the 35 included studies was moderate. The results of the 'Risk of bias' assessment are depicted graphically in Figure 2.
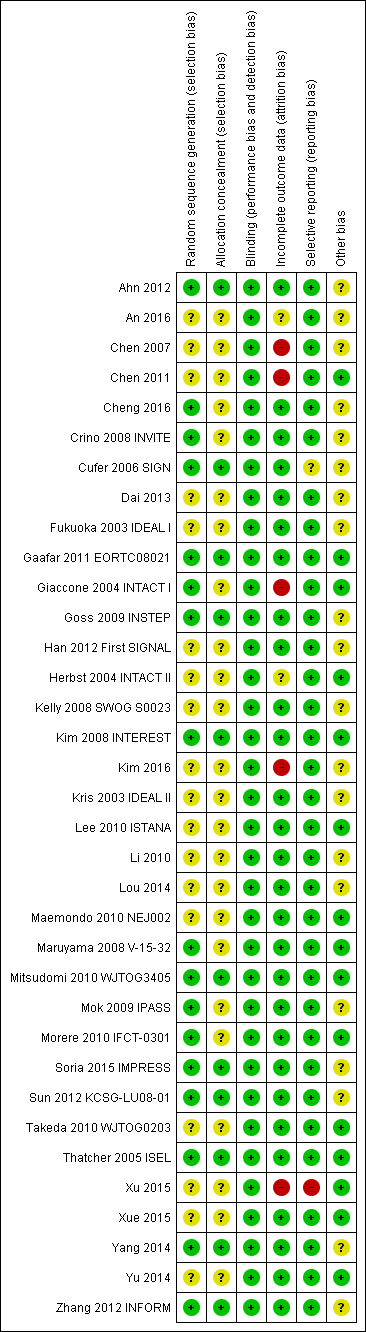
'Risk of bias' summary: review authors' judgements about each risk of bias item for each included study.
Allocation
Sequence generation
Seventeen of the 35 included studies reported adequate sequence generation (Ahn 2012; Cheng 2016; Crino 2008 INVITE; Cufer 2006 SIGN; Gaafar 2011 EORTC08021; Giaccone 2004 INTACT I; Goss 2009 INSTEP; Kim 2008 INTEREST; Maruyama 2008 V‐15‐32; Mitsudomi 2010 WJTOG3405; Mok 2009 IPASS; Morere 2010 IFCT‐0301; Soria 2015 IMPRESS; Sun 2012 KCSG‐LU08‐01; Thatcher 2005 ISEL; Yang 2014; Zhang 2012 INFORM). The remaining 18 studies were all described as randomised, but none provided any further information and so we classified them as having an uncertain risk of bias (An 2016; Chen 2007; Chen 2011; Dai 2013; Fukuoka 2003 IDEAL I; Han 2012 First SIGNAL; Herbst 2004 INTACT II; Kelly 2008 SWOG S0023; Kim 2016; Kris 2003 IDEAL II; Lee 2010 ISTANA; Li 2010; Lou 2014; Maemondo 2010 NEJ002; Takeda 2010 WJTOG0203; Xu 2015; Xue 2015; Yu 2014).
Allocation concealment
Allocation concealment was adequate in 11 of the included studies (Ahn 2012; Cufer 2006 SIGN; Gaafar 2011 EORTC08021; Goss 2009 INSTEP; Kim 2008 INTEREST; Mitsudomi 2010 WJTOG3405; Soria 2015 IMPRESS; Sun 2012 KCSG‐LU08‐01; Thatcher 2005 ISEL; Yang 2014; Zhang 2012 INFORM). Most of these studies used a minimisation method or centralised allocation procedure. The remaining studies did not report whether allocation was concealed and so are possibly at risk of bias.
Blinding
Of the 35 included trials, we judged blinding to be adequate in all studies. Eight studies blinded participants and investigators using an identical placebo (Fukuoka 2003 IDEAL I; Gaafar 2011 EORTC08021; Giaccone 2004 INTACT I; Goss 2009 INSTEP; Soria 2015 IMPRESS; Thatcher 2005 ISEL; Yang 2014; Zhang 2012 INFORM). The remaining 27 studies were unblinded or open‐label (for example comparing gefitinib with intravenous chemotherapy), but we judged that this would not affect the measured outcomes.
Incomplete outcome data
The majority of studies adequately addressed incomplete outcome data. Of the 35 included trials, 28 had a low risk of bias from incomplete outcome data. Studies cited reasons such as death, disease progression and drug toxicity for dropouts. Five phase II studies did not address withdrawals or patients lost to follow‐up and thus are potentially at high risk of bias (Chen 2007; Chen 2011; Giaccone 2004 INTACT I; Kim 2016; Xu 2015). Two studies did not provide adequate outcome data and so are at a risk of bias from incomplete outcome data analysis (An 2016;Herbst 2004 INTACT II).
Selective reporting
We judged 33 of the 35 included studies as at low risk of reporting bias. One study reported an outcome (progression‐free survival) that was not pre‐specified (Cufer 2006 SIGN). We judged this as an unclear risk of bias. Another study did not report an outcome that was prespecified in the methods ("survival time"), with no reason provided for this in the paper (Xu 2015). We judged this as a high risk of bias
Other potential sources of bias
Three trials were stopped early (Kelly 2008 SWOG S0023; Maemondo 2010 NEJ002; Mitsudomi 2010 WJTOG3405), which may be another source of bias. The SWOGS0023 study was stopped because an unplanned interim analysis concluded that the alternate hypothesis of improved survival would not be met. The NEJ002 and WJTOG3405 studies were concluded early following the presentation of contemporary data showing a progression‐free survival benefit in EGFR mutated patients. These studies were then closed to accrual.
We judged the remaining studies as having an unclear risk of bias listed due to conflicts of interest, in particular pharmaceutical funding or significant affiliations, or because they did not adequately declare any conflicts of interest (Ahn 2012; An 2016; Chen 2007; Cheng 2016; Crino 2008 INVITE; Cufer 2006 SIGN; Dai 2013; Fukuoka 2003 IDEAL I; Goss 2009 INSTEP; Han 2012 First SIGNAL; Kelly 2008 SWOG S0023; Kim 2008 INTEREST; Kim 2016; Kris 2003 IDEAL II; Li 2010; Mok 2009 IPASS; Soria 2015 IMPRESS; Sun 2012 KCSG‐LU08‐01; Yang 2014; Zhang 2012 INFORM).
Effects of interventions
See: Summary of findings for the main comparison Gefitinib compared to chemotherapy for first‐line treatment of advanced NSCLC; Summary of findings 2 Gefitinib compared to chemotherapy for second‐line treatment of advanced NSCLC; Summary of findings 3 Gefitinib compared to chemotherapy for advanced NSCLC ‐ toxicity
See: summary of findings Table for the main comparison ('Gefitinib compared to chemotherapy for first‐line treatment of advanced NSCLC'); summary of findings Table 2 ('Gefitinib compared to chemotherapy for second‐line treatment of advanced NSCLC'); summary of findings Table 3 ('Gefitinib compared to chemotherapy for advanced NSCLC ‐ toxicity').
1. Gefitinib versus placebo or best supportive care
Survival
See Analysis 1.1; Analysis 1.2; Analysis 1.3.
Four studies compared gefitinib with placebo in a general population (Gaafar 2011 EORTC08021; Goss 2009 INSTEP; Kelly 2008 SWOG S0023; Thatcher 2005 ISEL). The data presented examines the effect of gefitinib compared with placebo in the first‐line, second‐line and maintenance settings. Total pooling of data was not conducted for first‐ or second‐line therapy as only single studies were included. Pooling of data was only possible for maintenance treatment, as two studies were included (Gaafar 2011 EORTC08021; Kelly 2008 SWOG S0023). Gefitinib did not improve overall survival when compared with placebo, either when administered as first‐line (Goss 2009 INSTEP; hazard ratio (HR) 0.84, 95% confidence interval (CI) 0.62 to 1.14, P = 0.27), second‐line (Thatcher 2005 ISEL; HR 0.89, 95% CI 0.79 to 1.01, P = 0.06) or maintenance therapy (Gaafar 2011 EORTC08021; Kelly 2008 SWOG S0023; pooled HR 1.14, 95% CI 0.61 to 2.14, P = 0.69, I2 = 85%, random‐effects model).
One‐year survival rates were improved by administration of gefitinib versus placebo as second‐line therapy (risk ratio (RR) 1.28, 95% CI 1.05 to 1.57, P = 0.02), but not as maintenance therapy (RR 0.90, 95% CI 0.78 to 1.04, P = 0.15). Progression‐free survival was not improved when gefitinib was compared with placebo as first‐line therapy and median progression‐free survival was reported as 1.4 months in both groups (HR 0.82, 95% CI 0.60 to 1.12, P = 0.21). Time to treatment failure was improved in favour of gefitinib as second‐line therapy, with a HR of 0.82 (95% CI 0.75 to 0.90, P < 0.0001): median progression‐free survival was 3 months with gefitinib, 2.6 months with placebo. Maintenance use of gefitinib after first‐line treatment improved progression‐free survival (HR 0.70, 95% CI 0.53 to 0.91, P = 0.007, I2 = 32%).
Toxicity
See Analysis 1.4; Analysis 1.6.
We have pooled reported toxicity data from three studies in this comparison so as to examine the differences in toxicity between gefitinib and placebo or best supportive care (Gaafar 2011 EORTC08021; Goss 2009 INSTEP; Thatcher 2005 ISEL). Administration of gefitinib was significantly associated with Common Toxicity Criteria (CTC) grade 3 to 4 events such as skin rash (RR 7.92, 95% CI 1.46 to 43.03, P = 0.02, I2 = 0%) and diarrhoea (RR 2.48, 95% CI 1.15 to 5.35, P = 0.02, I2 = 0%). One study reported a statistically significant increase in alanine aminotransferase (ALT) with gefitinib (RR 9.11, 95% CI 1.18 to 70.32, P = 0.03). The risk of all other adverse events was either not estimable or not significantly different between the two groups.
Efficacy
See Analysis 1.22; Analysis 1.23.
Response was reported in only three of the four included studies (Gaafar 2011 EORTC08021; Goss 2009 INSTEP; Thatcher 2005 ISEL). We did not pool the data as the INSTEP study compared gefitinib with placebo as first‐line therapy, ISEL did so as second‐line therapy and the EORTC08021 trial as maintenance therapy. As first‐line therapy, gefitinib did not improve the overall response rate (RR 6.06, 95% CI 0.74 to 49.43, P = 0.09) or the disease control rate (RR 1.36, 95% CI 0.86 to 2.16, P = 0.19). This was reported as an overall response rate of 6% and 1% in the gefitinib and placebo groups, respectively, and the disease control rate was 31% and 23%, respectively. As second‐line therapy, the overall response rate was higher for gefitinib‐treated cases than for placebo (RR 6.42, 95% CI 2.82 to 14.64, P < 0.00001) and the disease control rate was also significantly higher for gefitinib (RR 1.24, 95% CI 1.06 to 1.44, P = 0.006). The overall response rate was 8% in the gefitinib group and 1% in the placebo group, and the disease control rate was 40% and 32%, respectively. Similarly, gefitinib improved the overall response rate and the disease control rate when used as maintenance therapy (RR 10.12, 95% CI 1.32 to 77.33, P = 0.03; RR 1.21, 95% CI 1.00 to 1.46, P = 0.05, respectively).
Quality of life and symptom improvement scores
Thatcher 2005 ISEL reported that the addition of gefitinib to "best supportive care" produced no significant changes in the quality of life subscale of the Functional Assessment of Cancer Therapy‐Lung (FACT‐L) questionnaire when compared with best supportive care alone. Gefitinib was associated with a statistically significant improvement in the symptom score (mean change from baseline ‐0.86 to ‐1.38; P = 0.019), but this did not meet predefined criteria. As described by Cella 2002, for changes in disease‐related symptoms to be classed as clinically relevant, the score must increase by two points. Goss 2009 INSTEP reported improvements in FACT‐L quality of life, FACT‐L Trial Outcome Index (TOI), lung cancer subscale (LCS) and Pulmonary Symptom Index (PSI) that were statistically non‐significant.
Subgroup analysis: Asian population
See Analysis 2.1; Analysis 2.2; Analysis 2.3; Analysis 2.4.
The INFORM study prospectively recruited patients of East Asian ethnic origin without disease progression after first‐line chemotherapy (Zhang 2012 INFORM). Pre‐planned subgroup analysis in the ISEL trial found marked heterogeneity in survival between patient groups (Thatcher 2005 ISEL).
The ISEL study conducted a subgroup analysis in 342 patients of Asian ethnicity who were enrolled in the ISEL trial. Two hundred and thirty‐five patients received second‐line gefitinib and 107 received placebo. Pre‐planned analysis reported that gefitinib significantly improved overall survival (HR 0.66, 95% CI 0.48 to 0.91, P = 0.01), the one‐year survival rate (RR 1.75, 95% CI 1.20 to 2.55, P = 0.004) and progression‐free survival (HR 0.69, 95% CI 0.52 to 0.91, P = 0.009) compared to placebo. Median overall survival was 9.5 months for gefitinib compared with 5.5 months for placebo. Covariate analysis of demographic subgroups further demonstrated a survival advantage across multiple subgroups. Overall survival in this Asian subgroup of patients was also greater in never‐smokers (HR 0.37, 95% CI 0.21 to 0.64, P = 0.0004) compared with smokers (HR 0.85, 95% CI 0.58 to 1.25, P = 0.40); females (HR 0.46, 95% CI 0.26 to 0.79, P = 0.0045) compared with males (HR 0.80, 95% CI 0.54 to 1.18, P = 0.26); and patients with adenocarcinoma (HR 0.66, 95% CI 0.45 to 0.97, P = 0.04) compared with non‐adenocarcinoma (HR 0.86, 95% CI 0.50 to 1.47, P = 0.58). Objective response rates were higher in Asian patients treated with gefitinib compared with placebo (RR 6.03, 95% CI 1.46 to 24.91, P = 0.01).
The INFORM study showed that gefitinib in the maintenance setting did not improve overall survival (HR 0.88, 95% CI 0.68 to 1.14, P = 0.335). However, gefitinib improved progression‐free survival over placebo (HR 0.42, 95% CI 0.33 to 0.54, P < 0.00001), and median progression‐free survival was improved from 2.6 months to 4.8 months. The objective response rate was greater with gefitinib (RR 35.00, 95% CI 4.86 to 252.15, P = 0.0004). There was no difference in reported toxicities.
Quality of life improvement rates were higher in those administered gefitinib compared with placebo, as measured by FACT‐L (improvement rates 55% versus 24%, P < 0.001), TOI (51% versus 21%, P < 0.001) and LCS (50% versus 22%, P < 0.001) in the INFORM study (Zhang 2012 INFORM). Gefitinib also increased the time‐to‐worsening of quality of life when compared with placebo (FACT‐L: 2.8 months versus 1.4 months, P = 0.019; TOI: 3.5 months versus 1.4 months P = 0.006; LCS: 2.8 months versus 1.4 months P = 0.028). The relationship between the change in quality of life score and prognosis was also analysed in the INFORM study. Patients with an improvement in quality of life had significantly longer progression‐free survival and overall survival when compared with those that had a stable or worsened quality of life (FACT‐L: 9.4 months versus 2.8 months versus 2.7 months, P < 0.001 and 25.4 months versus 19.9 months versus 14.4 months, P = 0.003, respectively).
Subgroup analysis: biomarker
See Analysis 3.1; Analysis 3.2.
Subgroup analysis of patients from the ISEL trial reported that the overall response rate was higher in patients with epidermal growth factor receptor (EGFR) mutations (37.5%; 6 of 16 patients) than those who were EGFR mutation negative (2.6%; 3 of 116 patients).
The INFORM study reported improved overall survival in 30 patients with EGFR mutations (HR 0.39, 95% CI 0.15 to 0.98, P = 0.036) with median overall survival improving from 20.97 months to 46.87 months when given gefitinib versus placebo. Whilst this subgroup only contained a very small number of patients, the study was able to show that gefitinib doubled the median overall survival. However, those with no detectable EGFR mutation or an unknown EGFR mutation status did not benefit from gefitinib maintenance therapy (HR 1.27, 95% CI 0.7 to 2.3, P = 0.431; HR 0.92, 95% CI 0.68 to 1.25, P = 0.603, respectively).
Progression‐free survival was also improved with gefitinib (HR 0.17, 95% CI 0.07 to 0.41, P < 0.0001) over placebo. Median progression‐free survival improved from 2.8 months to 16.6 months in this subgroup analysis of the INFORM trial.
2. Gefitinib versus chemotherapy
Survival
See Analysis 4.1; Analysis 4.2; Analysis 4.3.
Gefitinib versus first‐line chemotherapy
As first‐line therapy, only one study reported hazard ratios for survival (Crino 2008 INVITE). Gefitinib did not prolong overall survival (HR 0.98, 95% CI 0.66 to 1.46, P = 0.92, moderate quality of evidence) or progression‐free survival (HR 1.19, 95% CI 0.86 to 1.65, P = 0.30, moderate quality of evidence) when compared with vinorelbine in this general population of patients aged at least 70 years. This study selected patients over the age of 70 years old, therefore this limits the applicability of the data to other patients and thus we downgraded the quality of evidence to moderate.
Two studies reported selected survival outcomes comparing gefitinib with first‐line chemotherapy (Crino 2008 INVITE; Morere 2010 IFCT‐0301). When we pooled data from these two studies there was no difference in one‐year survival rates between gefitinib and first‐line chemotherapy (RR 0.93, 95% CI 0.63 to 1.38, P = 0.73, I2 = 26%). Median overall survival ranged from 2.2 to 5.9 months and 3.5 to 8 months in the gefitinib and chemotherapy groups, respectively. Median progression‐free survival ranged from 1.9 to 2.7 months and 2.0 to 2.9 months in the gefitinib and chemotherapy groups, respectively.
Gefitinib versus second‐line chemotherapy
The SIGN and INTEREST studies compared gefitinib with docetaxel as second‐line therapy (Cufer 2006 SIGN; Kim 2008 INTEREST). Only Kim 2008 INTEREST reported survival outcomes and neither overall survival (HR 1.02, 95% CI 0.91 to 1.15, P = 0.74, moderate quality of evidence) nor progression‐free survival (HR 1.04, 95% CI 0.92 to 1.17, P = 0.51, moderate quality of evidence) were prolonged by gefitinib. Median overall survival ranged from 7.5 to 7.6 months and 7.1 to 8 months in the gefitinib and chemotherapy groups, respectively. There was no difference in the one‐year survival rate (RR 0.94, 95% CI 0.82 to 1.09, P = 0.44). Median progression‐free survival in the non‐selected population ranged from 2.2 to 3 months and 2.7 to 3.4 months in the gefitinib and chemotherapy groups, respectively.
Cufer 2006 SIGN randomised patients to either second‐line gefitinib or docetaxel, however the trial was not formally powered to detect any statistical differences for any endpoint. We judged this to be at risk of serious imprecision and thus downgraded it one level.
Toxicity
See Analysis 4.4; Analysis 4.5; Analysis 4.6; Analysis 4.7; Analysis 4.8; Analysis 4.9; Analysis 4.10; Analysis 4.11.
We combined data to compare the toxicity profile of gefitinib with chemotherapy for first‐ and second‐line therapy to assess the overall effect in both groups. Data from Cufer 2006 SIGN, Crino 2008 INVITE, Kim 2008 INTEREST and Morere 2010 IFCT‐0301 were included. Gefitinib was generally better tolerated than chemotherapy. Gefitinib was associated with an increased risk of skin rash when compared with chemotherapy (RR 2.40, 95% CI 1.08 to 5.31, P = 0.03, I2 = 4.7%, high quality of evidence). Gefitinib was associated with a decreased risk of constipation (RR 0.41, 95% CI 0.17 to 0.97, P = 0.04, I2 = 0%, high quality of evidence), fatigue (RR 0.16, 95% CI 0.03 to 0.88, P = 0.04, I2 = 8.2%, moderate quality of evidence), asthenia (RR 0.51, 95% CI 0.35 to 0.75, P = 0.0007, I2 = 0%, high quality of evidence), neurotoxicity (RR 0.07, 95% CI 0.01 to 0.34, P = 0.001, I2 = 0%, high quality of evidence), neutropenia (RR 0.04, 95% CI 0.02 to 0.06, P < 0.00001, I2 = 43.1%, high quality of evidence), leukopenia (RR 0.03, 95% CI 0.00 to 0.22, P = 0.0005, I2 = 0%, high quality of evidence) and febrile neutropenia (RR 0.12, 95% CI 0.06 to 0.23, P < 0.00001, I2 = 0%, high quality of evidence). There were no differences between groups for any other measured adverse side effects including pruritus, diarrhoea, vomiting, anorexia, stomatitis, arthralgia, peripheral oedema, respiratory tract infection, dyspnoea, cough, anaemia, thrombocytopenia, hypokalaemia or pyrexia.
We assessed most of the toxicity outcomes as high‐quality evidence. We downgraded one outcome, fatigue, to a moderate quality of evidence as the study by Crino 2008 INVITE enrolled only 190 patients who were older than 70 years old, thus there was a risk of serious indirectness.
Efficacy
See Analysis 4.26; Analysis 4.27.
Only one first‐line study presented data on disease control rates and there was no reported improvement when administering gefitinib versus vinorelbine (RR 0.82, 95% CI 0.61 to 1.10, P = 0.19) (Crino 2008 INVITE). Disease control rates were 43.3% and 53.5% for gefitinib and chemotherapy, respectively. Two second‐line studies reported efficacy data (Cufer 2006 SIGN; Kim 2008 INTEREST). Pooled data showed that there was no improvement in overall response rate when comparing gefitinib and docetaxel as second‐line therapy (RR 1.16, 95% CI 0.85 to 1.59, P = 0.35, I2 = 0%). Overall response rates were 9% to 13% for both the gefitinib and chemotherapy groups.
Quality of life and symptom improvement scores
See Analysis 4.28; Analysis 4.29; Analysis 4.30; Analysis 4.31.
We pooled data from the INVITE (Crino 2008 INVITE) and INTEREST (Kim 2008 INTEREST) studies. Patients who received gefitinib reported statistically significant improvements in quality of life as assessed by scores on the FACT‐L (standardised mean difference (SMD) 10.50, 95% CI 9.55 to 11.45, P < 0.00001, I2 = 21%), LCS (SMD 3.63, 95% CI 3.08 to 4.19, P < 0.00001, I2 = 0%) and TOI (SMD 9.87, 95% CI 1.26 to 18.48, P = 0.02, I2 = 59%). One study also described an improvement in PSI scores (SMD 5.60, 95% CI 3.55 to 7.65, P < 0.00001) in patients who received gefitinib (Crino 2008 INVITE).
Subgroup analysis: Asian population
Survival
See Analysis 5.1; Analysis 5.2; Analysis 5.3; Analysis 5.4; Analysis 5.5; Analysis 5.6; Analysis 5.7.
Gefitinib versus first‐line chemotherapy
Five phase III studies compared gefitinib with first‐line platinum doublet chemotherapy (Han 2012 First SIGNAL; Maemondo 2010 NEJ002; Mitsudomi 2010 WJTOG3405; Mok 2009 IPASS; Yang 2014). The IPASS (Mok 2009 IPASS) and NEJ002 (Maemondo 2010 NEJ002) studies compared gefitinib with carboplatin‐paclitaxel. The WJTOG3405 study compared gefitinib with cisplatin‐docetaxel (Mitsudomi 2010 WJTOG3405). The First‐SIGNAL study compared gefitinib with gemcitabine‐cisplatin (Han 2012 First SIGNAL). The study by Yang 2014 compared gefitinib monotherapy with pemetrexed‐cisplatin followed by gefitinib maintenance.
Pooled analysis showed that gefitinib did not improve overall survival (HR 0.94, 95% CI 0.82 to 1.06, P = 0.31, I2 = 0%) or the one‐year survival rate (RR 1.03, 95% C 0.97 to 1.09, P = 0.33, I2 = 1%). One study reported median overall survival as 22 months in both groups. Progression‐free survival was higher in the gefitinib group than in the chemotherapy group (HR 0.65, 95% CI 0.43 to 0.98, P = 0.04, I2 = 93%). Median progression‐free survival ranged from 5.5 to 6.4 months with chemotherapy to 5.7 to 10.4 months with gefitinib. Please refer to Figure 3 for the pooled progression‐free survival data from first‐line studies that included Asian patients.
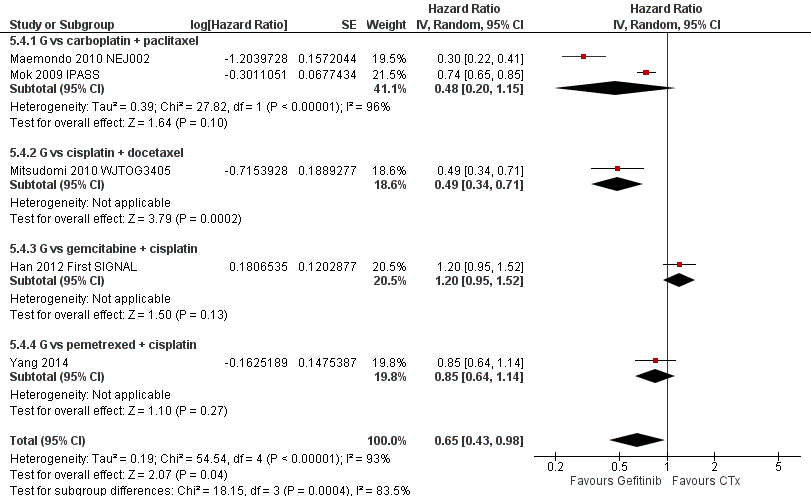
Progression‐free survival: Gefitinib versus first‐line chemotherapy in an Asian population (Analysis 5.4).
Gefitinib versus second‐line chemotherapy
Two phase III studies compared gefitinib with second‐line docetaxel in patients of Asian ethnicity (Lee 2010 ISTANA; Maruyama 2008 V‐15‐32) and one phase III study compared gefitinib with pemetrexed (Sun 2012 KCSG‐LU08‐01). In pooled analysis of these three trials, there was no benefit on either overall survival or the one‐year survival rate for gefitinib over second‐line chemotherapy (HR 0.94, 95% CI 0.79 to 1.12, P = 0.50, I2 = 0%; RR 0.94, 95% CI 0.81 to 1.11, P = 0.48, I2 = 0%, respectively). Progression‐free survival was prolonged (HR 0.71, 95% CI 0.57 to 0.88, P = 0.002, I2 = 40%; see Figure 4) in favour of gefitinib. Median progression‐free survival was 2 to 6.8 months with second‐line chemotherapy, and 2 to 10 months with gefitinib in the second‐line setting.

Progression‐free survival: Gefitinib versus second‐line chemotherapy in an Asian population (Analysis 5.5).
Gefitinib versus maintenance chemotherapy
Two phase II studies compared maintenance gefitinib with chemotherapy, however only one of them presented survival data (Ahn 2012). There was no difference in overall survival (HR 2.15, 95% CI 0.83 to 5.55, P = 0.11) or progression‐free survival (HR 0.53, 95% CI 0.27 to 1.04, P = 0.06) between the gefitinib and chemotherapy treatment arms. There was an improved one‐year survival rate (RR 0.79, 95% CI 0.65 to 0.98, P = 0.03) with maintenance gefitinib over chemotherapy.
Toxicity
See Analysis 5.8; Analysis 5.9; Analysis 5.10; Analysis 5.11; Analysis 5.12; Analysis 5.13; Analysis 5.14; Analysis 5.15; Analysis 5.16; Analysis 5.17; Analysis 5.18; Analysis 5.19; Analysis 5.20; Analysis 5.21; Analysis 5.22; Analysis 5.23.
Gefitinib was generally well tolerated in this population. We pooled toxicity data from all studies. Compared to chemotherapy, the gefitinib group reported fewer adverse side effects such as nausea (RR 0.34, 95% CI 0.17 to 0.64, P = 0.001, I2 = 0%), vomiting (RR 0.19, 95% CI 0.05 to 0.77, P = 0.02, I2 = 56%, random‐effects model), anorexia (RR 0.36, 95% CI 0.27 to 0.49, P < 0.00001, I2 = 18%), fatigue (RR 0.32, 95% CI 0.22 to 0.46, P < 0.00001, I2 = 50%), arthralgia (RR 0.14, 95% CI 0.03 to 0.61, P = 0.009, I2 = 0%), asthenia (RR 0.22, 95% CI 0.08 to 0.58, P = 0.002, I2 = 13%), neurotoxicity (RR 0.07, 95% CI 0.02 to 0.24, P < 0.0001, I2 = 0%), neutropenia (RR 0.11, 95% CI 0.05 to 0.27, P < 0.00001, I2 = 82%, random‐effects model), anaemia (RR 0.18, 95% CI 0.12 to 0.29, P < 0.00001, I2 = 4%), leukopenia (RR 0.07, 95% CI 0.02 to 0.23, P < 0.00001, I2 = 77%, random‐effects model), thrombocytopaenia (RR 0.32, 95% CI 0.14 to 0.72, P = 0.006, I2 = 22%) and febrile neutropenia (RR 0.09, 95% CI 0.03 to 0.28, P < 0.0001, I2 = 0%). Other side effects were seen more frequently in the gefitinib group. Skin rash (RR 3.11, 95% CI 1.28 to 7.55, P = 0.01, I2 = 60%, random‐effects model), diarrhoea (RR 2.79, 95% CI 1.57 to 4.94, P = 0.0005, I2 = 0%), increased alanine aminotransferase (ALT) (RR 10.03, 95% CI 5.23 to 19.26, P < 0.00001, I2 = 37%) and increased aspartate transaminase (AST) (RR 7.73, 95% CI 2.78 to 21.46, P < 0.0001, I2 = 0%) were more frequent in gefitinib‐treated cases.
Efficacy
See Analysis 5.24; Analysis 5.25; Analysis 5.26.
Objective response rates were higher in the gefitinib group when compared with first‐line chemotherapy (RR 1.43, 95% CI 1.13 to 1.82, P = 0.003, I2 = 76%, random‐effects model). The overall response rate ranged from 43% to 62.1% in the gefitinib group and 30.7% to 32.2% in the chemotherapy group. There was no effect on the disease control rate (RR 0.99, 95% CI 0.86 to 1.13, P = 0.86, I2 = 80%, random‐effects model): 73% to 94% and 78% to 81%, respectively.
The overall response rate was not significantly improved in the gefitinib group compared with second‐line chemotherapy (RR 1.43, 95% CI 0.92 to 2.22, P = 0.11, I2 = 46%). Two studies found that overall response rates were poor overall, but the gefitinib group performed better (23% to 28%) than the second‐line chemotherapy group (8% to 13%) (Lee 2010 ISTANA; Maruyama 2008 V‐15‐32). The disease control rate (RR 0.99, 95% CI 0.78 to 1.25, P = 0.92, I2 = 46%) was statistically similar for both groups (34% and 33%, respectively).
Pooled data from two maintenance studies found that gefitinib improved the stable disease rate and the disease control rate (RR 0.64, 95% CI 0.44 to 0.93, P = 0.02; RR 0.65, 95% CI 0.49 to 0.85, P = 0.002, respectively). There was no improvement in the overall response rate with maintenance gefitinib (RR 0.88, 95% CI 0.41 to 1.87, P = 0.06, I2 = 73%, random‐effects model).
Quality of life and symptom improvement scores
Three studies explored the impact of gefitinib versus chemotherapy on quality of life, but unfortunately the data could not be pooled (Lee 2010 ISTANA; Maruyama 2008 V‐15‐32; Mok 2009 IPASS). All three studies reported significantly improved quality of life in patients who received gefitinib as measured by the Trial Outcome Index (TOI). Mok 2009 IPASS and Maruyama 2008 V‐15‐32 stated that improvements as measured by FACT‐L were significant, but none recorded significant improvements on the lung cancer subscale (LCS).
Subgroup analysis: EGFR mutation positive population
Survival
See Analysis 6.1; Analysis 6.2; Analysis 6.3; Analysis 6.4.
Gefitinib versus first‐line chemotherapy
Five studies compared gefitinib with first‐line chemotherapy. Two of these studies selected patients with EGFR mutations (Maemondo 2010 NEJ002; Mitsudomi 2010 WJTOG3405), and the others selected patients based on clinical features and conducted subgroup analyses on patients positive for EGFR mutations (Han 2012 First SIGNAL; Mok 2009 IPASS; Yang 2014). We have separately analysed studies that selected EGFR mutants and those that selected patients based on clinical features then conducted subgroup analyses and progression‐free survival results are presented in Figure 5.
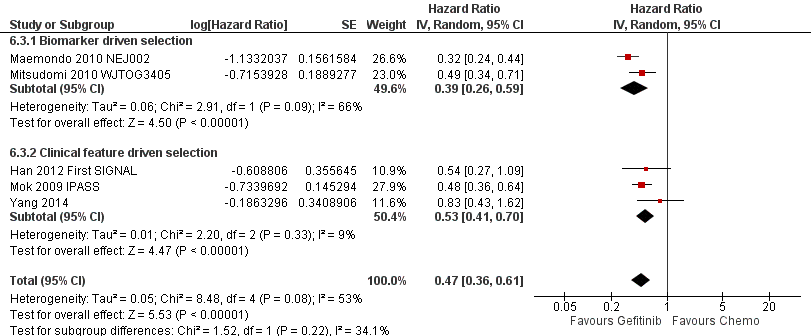
Progression‐free survival: Gefitinib versus first‐line chemotherapy in an EGFR mutation positive population (Analysis 6.3).
The two biomarker driven studies did not show any improvement in overall survival (HR 0.98, 95% CI 0.72 to 1.33, P = 0.90, I2 = 54%). Progression‐free survival was significantly increased with gefitinib compared with first‐line chemotherapy (HR 0.39, 95% CI 0.26 to 0.59, P < 0.00001, I2 = 66%, random‐effects model).
Three phase III studies conducted subgroup analyses in EGFR mutation positive patients. There was no improvement in overall survival (HR 0.95, 95% CI 0.68 to 1.33, P = 0.75, I2 = 20%). However, there was a statistically significant improvement in progression‐free survival (HR 0.53, 95% CI 0.41 to 0.70, P < 0.00001, I2 = 9%).
Pooled analysis of all first‐line studies that examined EGFR mutation positive patients showed that there was no difference in overall survival (HR 0.97, 95% CI 0.77 to 1.21, P = 0.76, I2 = 15%). However, pooled data from these five studies showed that gefitinib was able to prolong progression‐free survival when compared with first‐line chemotherapy (HR 0.47, 95% CI 0.36 to 0.61, P < 0.00001, I2 = 53%, random‐effects model), with median progression‐free survival improving from 5.5 to 6.3 months in the chemotherapy group to 9.2 to 10.4 months in the gefitinib group.
Gefitinib versus second‐line chemotherapy
When comparing gefitinib with second‐line chemotherapy, data were available from two studies (Kim 2008 INTEREST; Sun 2012 KCSG‐LU08‐01). This showed that gefitinib did not improve overall survival (HR 0.83, 95% CI 0.41 to 1.66, P = 0.60). There was a statistically significant improvement in progression‐free survival (HR 0.24, 95% CI 0.12 to 0.47, P < 0.0001, I2 = 0%) in EGFR mutation positive patients. Progression‐free survival for this analysis is presented in Figure 6.

Progression‐free survival: Gefitinib versus second‐line chemotherapy in an EGFR mutation positive population (Analysis 6.4).
Efficacy
See Analysis 6.5; Analysis 6.6; Analysis 6.7.
Gefitinib versus first‐line chemotherapy
Pooled analysis comparing first‐line gefitinib with chemotherapy showed that the overall response rate was significantly improved in favour of gefitinib. The two studies that selected patients with EGFR mutations (Maemondo 2010 NEJ002; Mitsudomi 2010 WJTOG3405), as well as the phase III studies that conducted subgroup analyses on EGFR mutation positive patients found significant improvements in overall response rate (RR 2.23, 95% CI 1.75 to 2.85, P < 0.00001, I2 = 0% and RR 1.45, 95% CI 1.05 to 1.99, P = 0.02, I2 = 53%, random‐effects model, respectively). Pooled analysis of all studies showed that first‐line gefitinib improved the overall response rate over chemotherapy (RR 1.73, 95% CI 1.29 to 2.31, P = 0.002, I2 = 70%, random‐effects model) and overall response rates ranged from 62% to 76% in the gefitinib group, compared with 31% to 47% in the first‐line chemotherapy group. The stable disease rate was improved in favour of first‐line chemotherapy (RR 0.52, 95% CI 0.28 to 0.97, P = 0.04, I2 = 66%, random‐effects model) but there was no difference in the disease control rate (RR 1.06, 95% CI 0.91 to 1.22, P = 0.46, I2 = 82%, random‐effects model).
Gefitinib versus second‐line chemotherapy
Gefitinib as second‐line therapy did not result in a significant difference in overall response rate (RR 1.65, 95% CI 0.88 to 3.09, P = 0.12). Overall response rates were reported as 67% in the gefitinib group and 46% in the chemotherapy group.
3. Gefitinib at a specific dose versus gefitinib at a different dose
Survival
See Analysis 7.1.
Two multicentre, randomised, double‐blind, phase II studies evaluated differing doses of gefitinib (250 mg and 500 mg) in the second‐line setting (Fukuoka 2003 IDEAL I; Kris 2003 IDEAL II). There was no significant effect on one‐year survival (RR 0.83, 95% CI 0.61 to 1.11, P = 0.21, I2 = 0%). HRs were not available for meta‐analysis. Median overall survival ranged from 7 to 7.6 months in patients given 250 mg, and 6 to 8 months in those given 500 mg of gefitinib. Median progression‐free survival ranged from 2.7 to 7 months and from 2.8 to 6 months in patients given 250 mg and 500 mg, respectively.
One study examined the effect of a higher dose of gefitinib in patients that had been stable after one month of 250 mg/day dosing of gefitinib (Xue 2015). In this study, there was no difference in progression‐free or overall survival with a higher dose of gefitinib (500 mg/day versus 250 mg/day: median progression‐free survival 5.30 months versus 6.23 months, P = 0.167; median overall survival 13.70 months versus 18.87 months, P = 0.156).
Toxicity
See Analysis 7.2; Analysis 7.3; Analysis 7.4; Analysis 7.5; Analysis 7.6; Analysis 7.7; Analysis 7.8; Analysis 7.9.
Data from all three studies were available for pooling (Fukuoka 2003 IDEAL I; Kris 2003 IDEAL II; Xue 2015). A gefitinib dose of 500 mg had a marginally worse toxicity profile when compared with the lower dose of 250 mg. This higher dose was associated with an increased rate of diarrhoea (RR 8.36, 95% CI 1.58 to 44.34, P = 0.01, I2 = 0%) and skin rash (RR 8.13, 95% CI 1.51 to 43.72, P = 0.01, I2 = 0%). Other reported side effects such as pruritus, acne, vomiting, anorexia, asthenia, neutropenia, leukopenia and dyspnoea were not significantly different between doses.
Efficacy
See Analysis 7.10; Analysis 7.11.
Pooled analysis of two studies found no significant difference in overall response rate (RR 0.92, 95% CI 0.58 to 1.46, P = 0.72, I2 = 0%) between doses (Fukuoka 2003 IDEAL I; Kris 2003 IDEAL II). Overall response rates in the 250mg arm were reported as 18% and 12% in the IDEAL I and IDEAL II trials respectively, compared with ORR rates of 19% and 9% respectively, in patients receiving 500mg of gefitinib. Complete and partial response rates were only reported individually in the IDEAL I paper, and were 10% and 18.1%, respectively.
A higher dose of gefitinib as maintenance treatment did not improve the overall response rate (12.5% versus 12.5%, P = 1) (Xue 2015).
Quality of life and symptom improvement scores
See Analysis 7.12; Analysis 7.13.
Two studies reported changes in quality of life and symptom improvement scores (Fukuoka 2003 IDEAL I; Kris 2003 IDEAL II).
Quality of life improvements were also measured using the Trial Outcome Index (TOI), a summary score of the physical and functional domains of FACT‐L and the lung cancer subscale (a validated subscale of the FACT‐L questionnaire). No statistically significant difference was found between 250 mg and 500 mg of gefitinib in the rate of change of the FACT‐L and TOI scales (SMD 3.70, 95% CI ‐7.28 to 14.69; P = 0.51, I2 = 0% and SMD 7.38, 95% CI ‐2.30 to 17.05; P = 0.14, I2 = 0%, respectively). Unfortunately, extractable data from the published papers were inconsistently reported and thus not all data were pooled for analysis.
Data from the IDEAL II study further correlated symptom improvement with objective response and survival. When given a dose of 250 mg of gefitinib, all patients who experienced a partial response also experienced symptom improvement. Patients with stable or progressive disease who experienced symptom improvement also had a longer median survival time compared to those in the same tumour progression category without symptom improvement.
Subgroup analysis
Both studies performed subgroup analyses.
Fukuoka 2003 IDEAL I found that the objective tumour response rate was higher for Japanese patients versus non‐Japanese patients (27.5% versus 10.4%; odds ratio (OR) 3.27; P = 0.0023). A planned subgroup multivariate analysis revealed seven factors that predicted response in Japanese patients: baseline lung cancer subscale, body mass index, performance status, prior radiotherapy, histology, prior immuno/hormonal therapy and gender. After accounting for all the baseline imbalances, the odds ratio indicated that Japanese patients had response rates 1.64 times that of non‐Japanese patients, but this was not considered statistically significant.
Kris 2003 IDEAL II reported observation of symptom improvement and radiographic responses in all patient subgroups. Multivariate analysis identified female gender to be predictive of both symptom improvement and radiographic responses.
Symptom improvement was rapid, with a median time to onset of less than two weeks: 10 days in the 250 mg group (95% CI 8 to 22 days) and 9 days (95% CI 9 to 16 days) in the 500 mg group.
It was also reported that patients receiving third‐, fourth‐ and fifth‐line and above therapy had similar rates of symptom improvement both for 250 mg and 500 mg doses of gefitinib. Post‐hoc analysis showed that RRs for symptom improvement for the subgroup of patients who had previously received a platinum and taxane were 24% at 250 mg and 28% at 500 mg and for patients who had previously received platinum and docetaxel, 24% and 26% for the 250 mg and 500 mg groups, respectively.
4. Gefitinib versus gefitinib plus chemotherapy
Survival
See Analysis 8.1; Analysis 8.2; Analysis 8.3.
In the first‐line setting, two studies compared gefitinib alone with gefitinib plus pemetrexed (An 2016; Cheng 2016). One study reported no difference in median survival between the gefitinib and gefitinib plus chemotherapy group (32 months versus 34 months respectively) (An 2016). The other study did not present survival data (Cheng 2016). There was, however, a statistically significant improvement in progression‐free survival in favour of gefitinib plus chemotherapy over gefitinib alone (HR 0.69, 95% CI 0.49 to 0.96; P = 0.03; median progression‐free survival 12.6 months versus 18.3 months) (Cheng 2016).
In the second‐line or greater setting, median overall survival improved from 13.3 months (Chen 2007) and 18.3 months (Chen 2011) to 23.4 months and 23.6 months, respectively. This improvement was not statistically significant. Combining gefitinib with either vinorelbine or tegafur/uracil did not improve the one‐year survival rate (RR 1.15, 95% CI 0.92 to 1.43; P = 0.22; I2 = 43%). Gefitinib plus chemotherapy improved one‐year progression‐free survival (RR 2.29, 95% CI 1.38 to 3.80; P = 0.001). However, the HR for progression‐free survival was only presented in Chen 2011 (HR 0.65, 95% CI 0.43 to 0.97; P = 0.04: median progression‐free survival improved from 7.1 months (Chen 2007) and 5.3 months (Chen 2011) to 12.8 months and 8.3 months, respectively).
Toxicity
See Analysis 8.4; Analysis 8.5; Analysis 8.6; Analysis 8.7; Analysis 8.8; Analysis 8.9; Analysis 8.10; Analysis 8.11; Analysis 8.12; Analysis 8.13; Analysis 8.14; Analysis 8.15.
We pooled toxicity data from three studies (An 2016; Chen 2007; Cheng 2016). Both regimens were well tolerated with no significant difference in rates of skin rash, diarrhoea, constipation, fatigue, blood counts, nausea or vomiting.
Pooled data from both first‐line studies did show that the addition of pemetrexed chemotherapy to gefitinib resulted in higher rates of raised ALT (RR 2.57, 95% CI 1.09 to 6.04; P = 0.03; I2 = 63%) but not AST (RR 1.47, 95% CI 0.56 to 3.88; P = 0.44; I2 = 0%).
Efficacy
See Analysis 8.16; Analysis 8.17; Analysis 8.18.
When comparing gefitinib alone to gefitinib plus chemotherapy as first‐line therapy, there was no improvement in overall response rate (RR 1.02, 95% CI 0.89 to 1.17; P = 0.73; I2 = 26%) or rate of stable disease (RR 0.67, 95% CI 0.39 to 1.16; P = 0.16; I2 = 0%).
In the second‐line setting, the addition of chemotherapy to gefitinib did not result in an improvement in either partial radiological response (RR 1.02, 95% CI 0.71 to 1.47; P = 0.92; I2 = 0%) or stable disease (RR 1.30, 95% CI 0.84 to 2.03; P = 0.24; I2 = 16%).
5. Gefitinib plus chemotherapy versus chemotherapy
Survival
See Analysis 9.1; Analysis 9.2; Analysis 9.3.
Meta‐analysis of two phase II, first‐line trials examining 1411 patients showed that the addition of gefitinib (250 mg/day) to a chemotherapy regimen in chemotherapy‐naive patients did not change the one‐year survival rate (RR 0.95, 95% CI 0.84 to 1.08, P = 0.44, I2 = 0%) (Giaccone 2004 INTACT I; Herbst 2004 INTACT II).
Two trials compared the addition of first‐line gefitinib to chemotherapy with chemotherapy alone in Asian patients only (Takeda 2010 WJTOG0203; Yu 2014). There was no improvement in overall survival (HR 0.86, 95% CI 0.72 to 1.02, P = 0.08, I2 = 0%), however there was a statistically significant improvement in progression‐free survival (HR 0.69, 95% CI 0.62 to 0.77, P < 0.00001, I2 = 18%).
A single phase III trial recruited only EGFR mutation positive patients who had failed prior first‐line gefitinib, and the addition of gefitinib to chemotherapy did not improve progression‐free survival (HR 0.86, 95% CI 0.65 to 1.13, P = 0.28) (Soria 2015 IMPRESS). Overall survival appeared to be better in the chemotherapy alone group (HR 1.62, 95% CI 1.05 to 2.50, P = 0.03).
Toxicity
See Analysis 9.4; Analysis 9.5; Analysis 9.6.
Pooled data from all five trials showed that the addition of gefitinib to a chemotherapeutic regimen resulted in increased rates of skin rash (RR 2.98, 95% CI 1.54 to 5.77, P = 0.001, I2 = 28%), acne (RR 4.95, 95% CI 1.09 to 22.51, P = 0.04, I2 = 0%) and diarrhoea (RR 2.04, 95% CI 1.17 to 3.58, P = 0.01, I2 = 17%). Other measured side effects such as pruritus, vomiting, nausea, anorexia, asthenia, dyspnoea, anaemia, neutropenia and leukopenia were not significantly increased.
Efficacy
See Analysis 9.16.
In the first‐line setting, the addition of gefitinib to chemotherapy did not effect the overall response rate in either the unselected population (RR 1.07, 95% CI 0.94 to 1.22, P = 0.28, I2 = 0%) or the Asian population (RR 1.14, 95% CI 0.93 to 1.40, P = 0.20, I2 = 0%). The overall response rate ranged from 30% to 51% in the gefitinib plus chemotherapy group and 29% to 50% in the chemotherapy group.
There was also no improvement in the overall response rate in the second‐line setting (RR 0.93, 95% CI 0.66 to 1.31, P = 0.66, I2 = 0%), and the overall response rate was 32% in the gefitinib plus chemotherapy group and 34% in the chemotherapy alone group.
Quality of life and symptom improvement scores
In the first‐line setting, the WJTOG0203 study reported a disease‐related symptoms assessment (Takeda 2010 WJTOG0203). Sequential administration of gefitinib was reported to provide better symptom control, however these differences were not statistically significant. The adjusted mean of initial summed scores of the lung cancer subscale were 20.3 for Arm A and 20.6 for Arm B. The adjusted lung cancer subscale scores at 12 and 18 weeks were 21 and 20.9 for Arm A and 21.8 and 21.2 for Arm B, respectively.
In the second‐line setting, the IMPRESS study reported that the improvements in quality of life were no different when gefitinib plus chemotherapy was compared to placebo plus chemotherapy as measured by the Trial Outcome Index (TOI) (29% versus 30.2%, respectively), FACT‐L (35.5% versus 38%, respectively) or lung cancer subscale (43.5% versus 42.6%, respectively) (Soria 2015 IMPRESS). There was also no difference in the time to worsening of health‐related quality of life as measured by the TOI, FACT‐L and lung cancer subscale.
These data could not be pooled for meta‐analysis.
Subgroup analysis
A planned exploratory subgroup analysis in Japanese patients of overall survival by histological group reported that patients with adenocarcinoma that were given sequential gefitinib had better outcomes than patients given chemotherapy alone (n = 467; progression‐free survival: HR 0.79, 95% CI 0.65 to 0.98, P = 0.03; overall survival: HR 0.60, 95% CI 0.50 to 0.73, P < 0.001) (Takeda 2010 WJTOG0203). There was no difference in overall survival or progression‐free survival in those with non‐adenocarcinoma (overall survival: HR 1.24, 95% CI 0.85 to 1.79, P = 0.25 and progression‐free survival: HR 1.14, 95% CI 0.80 to 1.62, P = 0.47). This study also reported that smokers also experienced improved survival with sequential gefitinib (HR 0.79, 95% CI 0.64 to 0.98), as opposed to non‐smokers (HR 0.94, 95% CI 0.66 to 1.33), however P values were not published.
Discusión
Este metanálisis examinó los datos publicados sobre la efectividad y la seguridad del gefitinib en pacientes con cáncer de pulmón de células no pequeñas (CPCNP). Se realizó una búsqueda exhaustiva en bases de datos electrónicas y búsquedas manuales, y 35 estudios aleatorios cumplieron los criterios de inclusión. Algunos fueron ensayos abiertos con diseño de fase II y fue posible agrupar los datos de manera limitada debido a las diferencias metodológicas entre los estudios.
Resumen de los resultados principales
En esta revisión se incluyó un total de 35 estudios.
Cinco estudios compararon gefitinib con placebo: un estudio como tratamiento de primera línea, un estudio como segunda línea y tres estudios en el contexto de mantenimiento. El gefitinib no mejoró la supervivencia en el contexto de primera línea en una población general de pacientes con CPCNP. El estudio ISEL encontró que gefitinib como tratamiento de segunda línea pudo reducir el riesgo de progresión de la enfermedad en 18%, y mejorar la tasa de respuesta objetiva del 1% al 6% en comparación con placebo (Thatcher 2005 ISEL). Tres estudios compararon gefitinib con placebo en el contexto de mantenimiento. El gefitinib redujo el riesgo de progresión de la enfermedad en 31%.
En pacientes del grupo étnico asiático, el análisis de subgrupos preplanificado en el estudio ISEL encontró que gefitinib como tratamiento de segunda línea mejoró la supervivencia general y libre de enfermedad en 34% y 31%, respectivamente (Chang 2006). El estudio INFORM comparó gefitinib con placebo en el contexto de mantenimiento y con pacientes seleccionados del grupo étnico asiático (Zhang 2012 INFORM). Este estudio encontró que el gefitinib prolongó la supervivencia libre de progresión en 58% y la tasa de respuesta general mejoró del 1% al 24%. El análisis de la calidad de vida del estudio INFORM también mostró que las tasas de mejoría medidas con la Functional Assessment of Cancer Therapy‐Lung (FACT‐L), el Trial Outcome Index (TOI) y la subescala cáncer de pulmón fueron mayores en los pacientes que recibieron gefitinib como tratamiento de mantenimiento. Estos pacientes también tuvieron un tiempo hasta el empeoramiento mayor en las puntuaciones de la calidad de vida.
En pacientes positivos para la mutación del receptor del factor de crecimiento epidérmico (EGFR), el análisis de subgrupos del estudio INFORM mostró una mejoría en la mediana de la supervivencia general de 21 hasta 47 meses y el gefitinib de mantenimiento redujo el riesgo de muerte en 61% (Zhang 2012 INFORM). Gefitinib de mantenimiento también mejoró la supervivencia libre de progresión desde 2,8 meses a 16,6 meses.
Varios estudios de fase II y III compararon gefitinib con quimioterapia. Dieciocho estudios aleatorios han examinado la efectividad de gefitinib en comparación con los regímenes de quimioterapia recomendados. El metanálisis de cuatro estudios no logró demostrar algún efecto beneficioso sobre la supervivencia ni la tasa de respuesta en una población general (evidencia de calidad moderada). (Consultar el Resumen de hallazgos para la comparación principal y el Resumen de hallazgos 2). La calidad de vida fue significativamente mejor en los pacientes con gefitinib que en los que recibieron quimioterapia, y gefitinib fue significativamente menos tóxico y, por lo general, bien tolerado en comparación con la quimioterapia (evidencia de alta calidad), según los resultados de otros estudios. La erupción cutánea, la diarrea y el aumento de las transaminasas hepáticas fueron más frecuentes en el grupo de gefitinib, pero otros efectos secundarios significativos como la neutropenia, la anemia, la leucopenia y la neutropenia febril fueron menos frecuentes. (Por favor, consultar el Resumen de los hallazgos 3).
Catorce ensayos incluyeron pacientes exclusivamente del grupo étnico asiático, y algunos otros de manera adicional seleccionaron a los pacientes por el estado de mutación del EGFR o por criterios clínicos que es probable que hayan reforzado las mutaciones del EGFR. Gefitinib mejoró la tasa de respuesta general en 43% y la supervivencia libre de progresión en 35% en comparación con la quimioterapia de primera línea, pero lo anterior no se tradujo en una mejoría en la supervivencia general. La comparación de gefitinib con quimioterapia de segunda línea encontró que la supervivencia libre de progresión mejoró en 29% pero no hubo efectos sobre la supervivencia general ni la tasa de respuesta general. El efecto del grupo étnico asiático es complicado y puede ser motivo de confusión debido a las tasas mayores de mutación del EGFR y del biomarcador predictivo biológicamente verosímil característico de las mutaciones del EGFR. Dos ensayos compararon gefitinib de mantenimiento con quimioterapia de mantenimiento. No hubo diferencias en la supervivencia general ni en la supervivencia libre de progresión, pero gefitinib pudo mejorar la tasa de supervivencia al año en 21% y la tasa de control de la enfermedad en 35%. La erupción cutánea, la diarrea y las transaminasas hepáticas elevadas fueron más frecuentes en los pacientes tratados con gefitinib; sin embargo, los efectos secundarios adversos graves como los trastornos hematológicos, la neurotoxicidad, las náuseas, la anorexia, la fatiga y la artralgia fueron mucho más frecuentes en el grupo de quimioterapia.
Ocho estudios seleccionaron los pacientes con tumores que expresaban mutaciones del EGFR para la comparación o realizaron análisis de subgrupos en estos pacientes. La administración de gefitinib en el contexto de primera línea mejoró la supervivencia libre de progresión en comparación con la quimioterapia doble con platino. Los estudios que seleccionaron a los pacientes con mutaciones del EGFR exclusivamente pudieron mostrar una mejoría del 61% en la supervivencia libre de progresión en comparación con la quimioterapia de primera línea. Dos estudios reclutaron a pacientes con características clínicas que es probable que respondieran favorablemente a gefitinib, y mostraron una mejoría del 51% en la supervivencia libre de progresión después del análisis de subgrupos de los pacientes positivos a mutaciones del EGFR. El gefitinib también mejoró la tasa de respuesta general en 73% en comparación con la quimioterapia de primera línea. Sin embargo, ninguno pudo demostrar una mejoría en la supervivencia general, posiblemente debido a las tasas altas de cruzamiento. Cuando se comparó gefitinib con quimioterapia de segunda línea se observó una mejoría similar en la supervivencia libre de progresión del 76%. No hubo repercusión sobre la supervivencia general ni la tasa de respuesta general.
El aumento de la dosis de gefitinib de 250 mg/día a 500 mg/día no produjo efectos beneficiosos adicionales en la supervivencia ni la tasa de respuesta en tres ensayos de fase II. Sin embargo, esta mayor dosis se asoció con mayor toxicidad.
Dos estudios de fase II compararon pemetrexed más gefitinib con gefitinib solo como tratamiento de primera línea. La supervivencia libre de progresión mejoró en 31%, con una mediana de la mejoría de 12,6 meses a 18,3 meses. Sin embargo, hubo mayores tasas de ALT en este brazo de tratamiento. Todos los otros efectos tóxicos fueron similares. Los dos estudios que compararon gefitinib más quimioterapia con gefitinib solo en el contexto de segunda línea mostraron una mejor supervivencia libre de progresión al año cuando se agregó quimioterapia a gefitinib.
Cinco estudios mostraron que el agregado de gefitinib a un régimen de quimioterapia en comparación con quimioterapia sola no tuvo efectos beneficiosos sobre la supervivencia. En pacientes del grupo étnico asiático, dos estudios mostraron que gefitinib más quimioterapia como primera línea mejoró la supervivencia libre de progresión en 31% en comparación con quimioterapia sola. Un estudio de fase III comparó gefitinib más quimioterapia con quimioterapia sola y encontró que la supervivencia mejoró a favor de la quimioterapia sola. Todos los pacientes de este estudio fueron positivos a mutaciones del EGFR, pero habían tenido fracaso del tratamiento de primera línea anteriormente con gefitinib.
Un resumen de los resultados de eficacia se presenta en la Tabla 2.
Compleción y aplicabilidad general de las pruebas
Gran parte de los datos analizados en esta revisión son anteriores a la evaluación sistemática del estado de mutación del EGFR en el CPCNP. En la actualidad esta prueba se realiza de forma sistemática en muchos países antes de comenzar el tratamiento, y ahora el estado de mutación del EGFR guía las opciones terapéuticas. Gefitinib ya se ha registrado en los países occidentales para el tratamiento del CPCNP con mutaciones activadoras del EGFR. Las opciones de tratamiento para los pacientes con CPCNP han evolucionado rápidamente y, aunque algunos de los datos de esta revisión se pueden considerar históricos, todavía proporcionan el fundamento para erigir los estudios en curso que examinan la relación entre la efectividad del gefitinib y el momento de su uso con otras formas de tratamiento.
Los criterios de inclusión para seleccionar los pacientes de estos estudios pueden haber perjudicado su capacidad de proporcionar resultados estadísticamente significativos. Por ejemplo, algunos estudios seleccionaron los pacientes con enfermedad muy resistente al tratamiento, que pueden haber tenido menores probabilidades de responder a cualquier tratamiento adicional. Algunos estudios seleccionaron para inclusión a pacientes que nunca habían recibido quimioterapia (Giaccone 2004 INTACT I; Herbst 2004 INTACT II), mientras que otros incluyeron pacientes que habían recibido al menos un régimen previo de quimioterapia con platino (Kris 2003 IDEAL II; Fukuoka 2003 IDEAL I). Thatcher 2005 ISEL seleccionó pacientes que presentaron recidiva o enfermedad progresiva durante el tratamiento o en el transcurso de 90 días desde la última dosis de quimioterapia.
En algunos estudios a los pacientes que progresaron con cierto tratamiento se les permitió cambiar al brazo de comparación. Lo anterior se informó en algunos estudios (p.ej. Mok 2009 IPASS) y en algunos los datos no se tuvieron en cuenta en consecuencia (p.ej. Mitsudomi 2010 WJTOG3405). La repercusión de este cruzamiento es difícil de analizar y puede contribuir a la falta de efectos beneficiosos sobre la supervivencia que se observó en estos estudios de fase III grandes.
En la presente revisión se analizaron los pacientes positivos a mutaciones del EGFR, y se encontró que gefitinib mejoró la supervivencia libre de progresión en comparación con la quimioterapia de primera y segunda línea y con placebo en el contexto de mantenimiento. Sin embargo, los pacientes con CPCNP con EGFR tipo salvaje no se incluyeron de manera formal en este metanálisis. Estudios como Zhou 2014 CTONG 0806 se excluyeron de este metanálisis porque solo seleccionaron CPCNP con EGFR tipo salvaje. Este estudio mostró que la quimioterapia con pemetrexed de segunda línea fue superior a gefitinib en cuanto a la supervivencia libre de progresión, pero también se observó una tendencia hacia una mejor supervivencia general. Por lo tanto, lo anterior destaca la importancia de determinar el estado de mutación del EGFR en los pacientes con CPCNP avanzado, ya que este resultado guiará las decisiones de tratamiento adicional.
Los pacientes con CPCNP progresivo que no han logrado responder a la quimioterapia de primera línea tienen un pronóstico muy deficiente y a menudo presentan síntomas graves. Una dificultad con los metanálisis de los datos de la calidad de vida es que los resultados no se informan de manera sistemática en los artículos publicados, lo que limita el agrupamiento de los datos. Algunos estudios informaron cambios en la FACT‐L y la subescala de cáncer de pulmón que alcanzó los criterios predeterminados se significación clínica (Cella 2005; Kris 2003 IDEAL II), mientras que otros no pudieron mostrar mejoría (Fukuoka 2003 IDEAL I; Thatcher 2005 ISEL). Cella 2005 informó una correlación entre la mejoría de los síntomas, la respuesta objetiva y la supervivencia, y encontró que el 30% de los pacientes mostraron una mejoría en la calidad de vida que se correlacionó con la respuesta tumoral. Kris 2003 IDEAL II informó que los síntomas mejoraron en el 96% de los pacientes con respuestas radiográficas parciales. El análisis preplanificado de subgrupos en Thatcher 2005 ISEL encontró que gefitinib se asoció con una mejoría significativa en la puntuación de los síntomas en comparación con placebo en los pacientes que nunca fumaron y en los de origen asiático.
Calidad de la evidencia
Las tablas de "Riesgo de sesgo" han permitido una evaluación metódica y minuciosa de la calidad de la evidencia. En esta revisión se incluyeron 35 ensayos controlados aleatorios (ECA) que asignaron al azar a 12 089 pacientes. (Por favor, consultar Figura 2). Los ensayos incluidos en este metanálisis en general tuvieron bajo riesgo de sesgo de selección y de desgaste. Desafortunadamente, las diferencias en el informe de resultados como los tiempos de supervivencia, y la falta de curvas de supervivencia, hizo que solo fuera posible incluir en los análisis los datos extraíbles. La duración del tratamiento con gefitinib y la duración del seguimiento también pueden haber afectado los resultados en estos ECA. A pesar de estas limitaciones, los ECA incluidos fueron generalmente consistentes con sus resultados.
En los estudios que compararon gefitinib con quimioterapia de primera línea, la calidad de la evidencia se consideró moderada. Un estudio reclutó pacientes de edad avanzada (más de 70 años de edad), por lo que la calidad de la evidencia se disminuyó porque puede haber un riesgo grave de indireccionalidad (Crino 2008 INVITE). Cuando se comparó gefitinib con quimioterapia de segunda línea, también se consideró que la calidad de la evidencia fue moderada porque un estudio no tuvo poder estadístico suficiente para detectar diferencias en las variables principales de evaluación, por lo que tuvo riesgo grave de imprecisión (Cufer 2006 SIGN). Cuando se consideraron los resultados de toxicidad, en general la calidad de los datos fue alta, excepto para la fatiga, que se consideró evidencia de calidad moderada. La calidad de este resultado se disminuyó un nivel porque se consideró que el estudio tuvo riesgo grave de indireccionalidad porque solo reclutó pacientes mayores de 70 años de edad (Crino 2008 INVITE).
Acuerdos y desacuerdos con otros estudios o revisiones
Dos metanálisis publicados también examinaron el efecto de gefitinib en el CPCNP. El primero, Ibrahim 2010, informó sobre siete estudios que incluyeron pacientes que nunca habían recibido quimioterapia (Crino 2008 INVITE; Giaccone 2004 INTACT I; Goss 2009 INSTEP; Herbst 2004 INTACT II; Kelly 2008 SWOG S0023; Mok 2009 IPASS; Takeda 2010 WJTOG0203), y analizó 2545 y 1939 pacientes en los brazos de gefitinib y control. Los mismos siete estudios también cumplieron los criterios de inclusión para esta revisión; Sin embargo, la presente revisión incluyó 17 estudios adicionales que analizaron la administración de gefitinib como tratamiento de segunda o tercera línea y de mantenimiento. Los autores no pudieron mostrar un efecto beneficioso en la tasa de respuesta objetiva, la supervivencia libre de progresión ni en la supervivencia general en esta población general. En un subgrupo pequeño de pacientes con mutaciones del EGFR, se mostró que gefitinib mejoró de forma significativa la tasa de respuesta general (odds ratio [OR] 2,81; IC del 95%: 1,71 a 4,62; P < 0,0001). Este efecto beneficioso no se asoció con ventajas en la supervivencia libre de progresión ni general en ese grupo. Solo tres de los siete estudios incluidos informaron sobre la calidad de vida y mostraron una mejoría cuantificable y estadísticamente significativa medida con la FACT‐L.
El segundo metanálisis, Jiang 2011, comparó gefitinib con docetaxel como tratamiento de segunda línea. Se incluyeron cuatro estudios, todos los cuales también se incluyeron en esta revisión (Cufer 2006 SIGN; Kim 2008 INTEREST; Lee 2010 ISTANA; Maruyama 2008 V‐15‐32). En total 2247 pacientes recibieron gefitinib o docetaxel como tratamiento de segunda línea. También se encontraron resultados similares en este metanálisis. Hubo una mejoría en la tasa de respuesta general con gefitinib en comparación con docetaxel (cociente de riesgos [CR] 1,58; IC del 95%: 1,02 a 2,45; p = 0,04) y en la calidad de vida medida con la FACT‐L y los cuestionarios TOI (CR 1,55; IC del 95%: 1,27 a 1,88; P < 0,001; CR 1,86; IC del 95%: 1,43 a 2,42; P < 0,001, respectivamente). No hubo efectos beneficiosos sobre la supervivencia general ni sobre la supervivencia libre de progresión.
Estas dos revisiones sistemáticas presentaron resultados similares a los de este metanálisis.
Los pacientes con tumores con mutaciones del EGFR obtienen beneficios del tratamiento con gefitinib. Se ha mostrado que en pacientes del grupo étnico asiático con tumores con mutaciones del EGFR, la supervivencia libre de progresión y la tasa de respuesta general fueron significativamente mejores con la administración de gefitinib como tratamiento de primera línea; sin embargo, no hubo efectos sobre la supervivencia general, debido quizás al cruzamiento entre las intervenciones de los estudios.
Es probable que una interacción entre el grupo étnico, el estado de mutación del EGFR y otras características clínicas sea un factor de confusión en el análisis directo de los factores predictivos de una respuesta a gefitinib. También es más probable que los pacientes con ascendencia asiática, no fumadores o con histología de adenocarcinoma tengan tumores con mutaciones del EGFR.
Hay evidencia creciente que justifica el uso de marcadores moleculares en la práctica clínica y el estado de mutación del EGFR parece ser una variable predictiva significativa del efecto beneficioso en cuanto a la supervivencia libre de progresión y la respuesta a gefitinib. Otros marcadores del estado del EGFR como la expresión proteica del EGFR y el número de copias de genes del EGFR parecen estar relacionados con las mutaciones del EGFR, pero aún es necesario establecer los criterios para la interpretación. Se requieren estudios de investigación adicionales sobre el muestreo óptimo, los métodos para probar las mutaciones y el espectro predictivo preciso de las mutaciones del EGFR.
Study flow diagram for searches 1966‐2017.
(EGFR: epidermal growth factor receptor)
'Risk of bias' summary: review authors' judgements about each risk of bias item for each included study.
Progression‐free survival: Gefitinib versus first‐line chemotherapy in an Asian population (Analysis 5.4).
Progression‐free survival: Gefitinib versus second‐line chemotherapy in an Asian population (Analysis 5.5).
Progression‐free survival: Gefitinib versus first‐line chemotherapy in an EGFR mutation positive population (Analysis 6.3).
Progression‐free survival: Gefitinib versus second‐line chemotherapy in an EGFR mutation positive population (Analysis 6.4).

Comparison 1 Gefitinib versus placebo, Outcome 1 HR Overall survival.
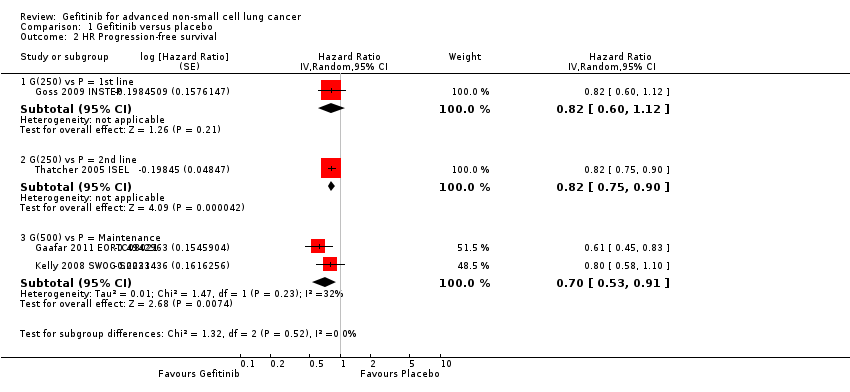
Comparison 1 Gefitinib versus placebo, Outcome 2 HR Progression‐free survival.

Comparison 1 Gefitinib versus placebo, Outcome 3 1‐year survival rate.

Comparison 1 Gefitinib versus placebo, Outcome 4 Skin rash.
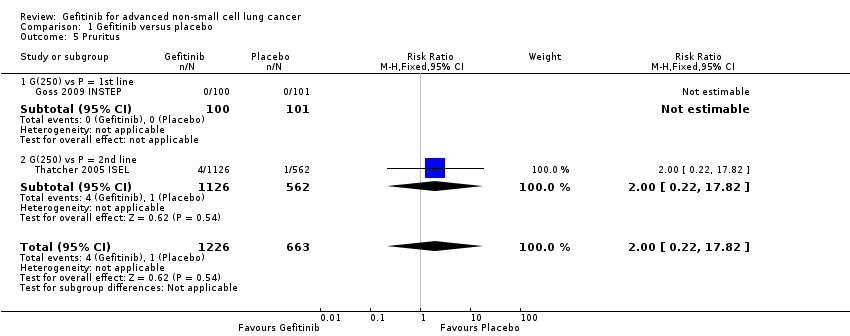
Comparison 1 Gefitinib versus placebo, Outcome 5 Pruritus.

Comparison 1 Gefitinib versus placebo, Outcome 6 Diarrhoea.

Comparison 1 Gefitinib versus placebo, Outcome 7 Constipation.

Comparison 1 Gefitinib versus placebo, Outcome 8 Nausea.
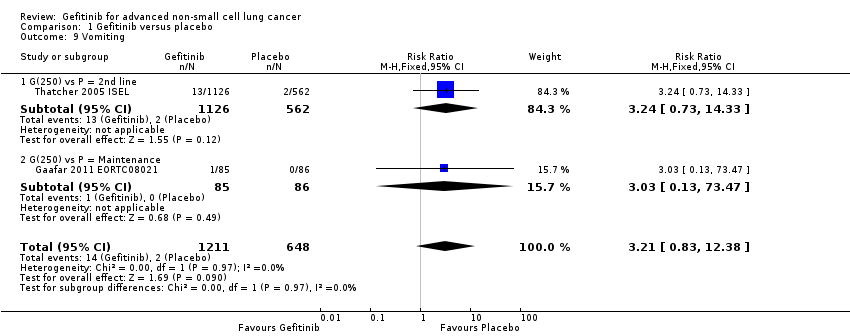
Comparison 1 Gefitinib versus placebo, Outcome 9 Vomiting.
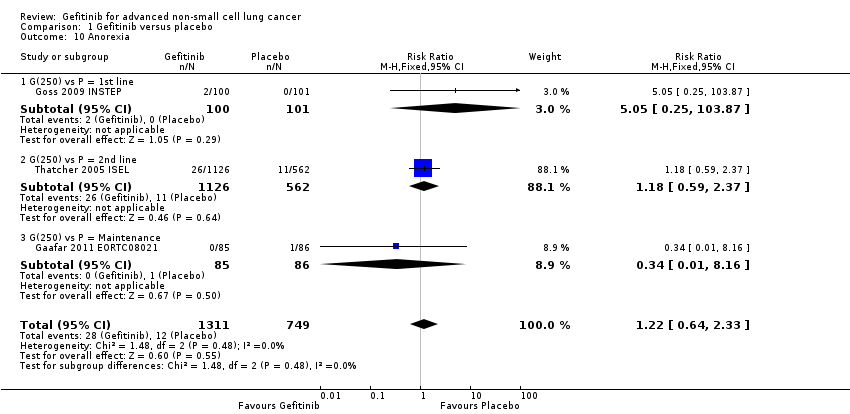
Comparison 1 Gefitinib versus placebo, Outcome 10 Anorexia.
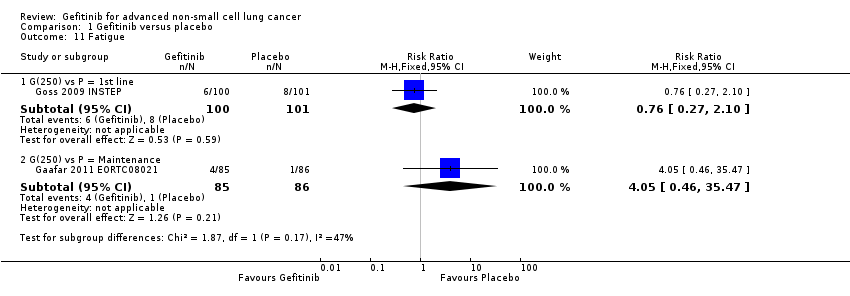
Comparison 1 Gefitinib versus placebo, Outcome 11 Fatigue.

Comparison 1 Gefitinib versus placebo, Outcome 12 Asthenia.

Comparison 1 Gefitinib versus placebo, Outcome 13 Respiratory tract infection.

Comparison 1 Gefitinib versus placebo, Outcome 14 Dyspnoea.

Comparison 1 Gefitinib versus placebo, Outcome 15 Anaemia.

Comparison 1 Gefitinib versus placebo, Outcome 16 Abdominal pain.

Comparison 1 Gefitinib versus placebo, Outcome 17 Increased ALT.

Comparison 1 Gefitinib versus placebo, Outcome 18 Increased AST.

Comparison 1 Gefitinib versus placebo, Outcome 19 Neutropenia.
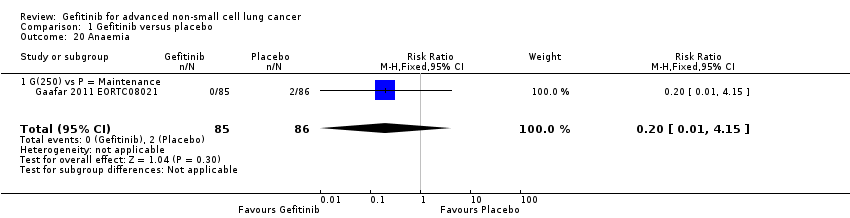
Comparison 1 Gefitinib versus placebo, Outcome 20 Anaemia.

Comparison 1 Gefitinib versus placebo, Outcome 21 Thrombocytopaenia.
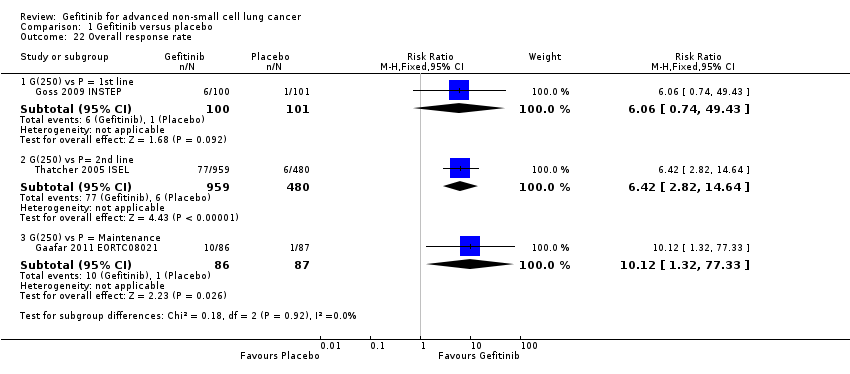
Comparison 1 Gefitinib versus placebo, Outcome 22 Overall response rate.
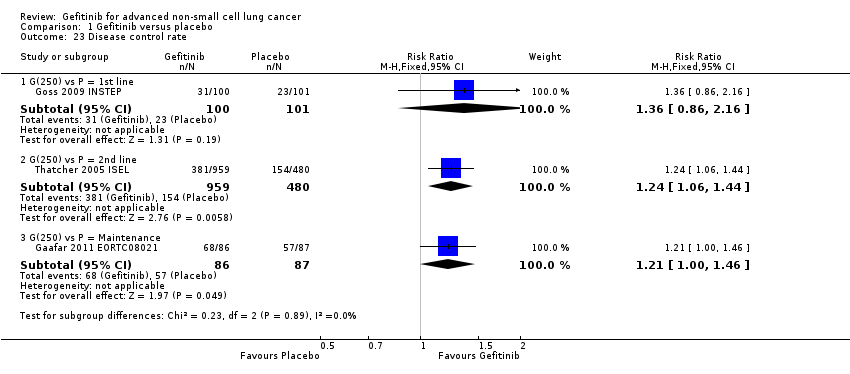
Comparison 1 Gefitinib versus placebo, Outcome 23 Disease control rate.

Comparison 2 Gefitinib versus placebo (Asian subgroup), Outcome 1 HR Overall survival.
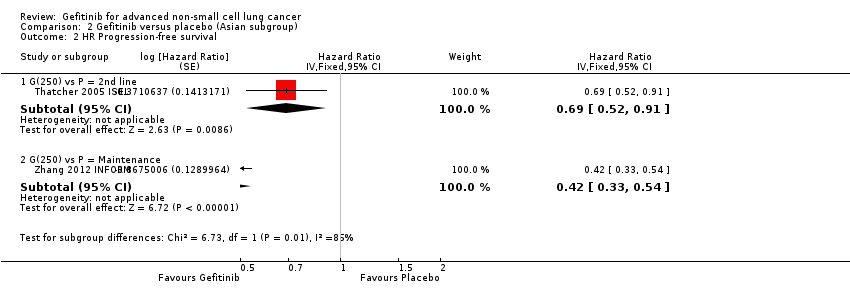
Comparison 2 Gefitinib versus placebo (Asian subgroup), Outcome 2 HR Progression‐free survival.

Comparison 2 Gefitinib versus placebo (Asian subgroup), Outcome 3 1‐year survival rate.

Comparison 2 Gefitinib versus placebo (Asian subgroup), Outcome 4 Overall response rate.

Comparison 3 Gefitinib versus placebo (biomarker subgroup), Outcome 1 HR Overall survival.
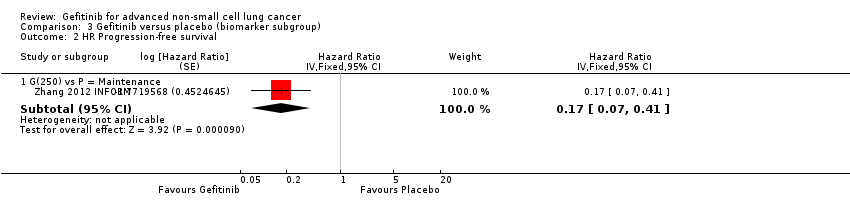
Comparison 3 Gefitinib versus placebo (biomarker subgroup), Outcome 2 HR Progression‐free survival.
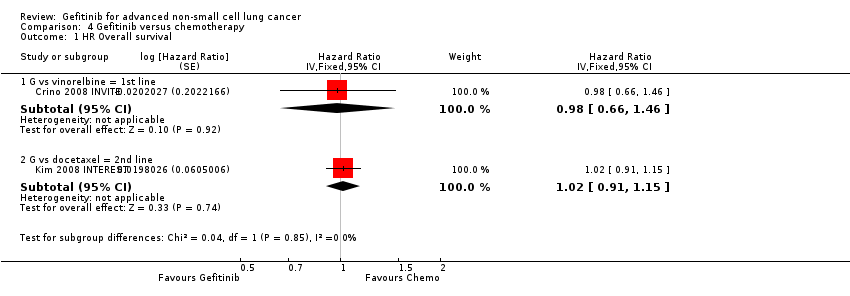
Comparison 4 Gefitinib versus chemotherapy, Outcome 1 HR Overall survival.

Comparison 4 Gefitinib versus chemotherapy, Outcome 2 HR Progression‐free survival.

Comparison 4 Gefitinib versus chemotherapy, Outcome 3 1‐year survival rate.

Comparison 4 Gefitinib versus chemotherapy, Outcome 4 Skin rash.

Comparison 4 Gefitinib versus chemotherapy, Outcome 5 Constipation.

Comparison 4 Gefitinib versus chemotherapy, Outcome 6 Fatigue.

Comparison 4 Gefitinib versus chemotherapy, Outcome 7 Asthenia.

Comparison 4 Gefitinib versus chemotherapy, Outcome 8 Neurotoxicity.

Comparison 4 Gefitinib versus chemotherapy, Outcome 9 Neutropenia.

Comparison 4 Gefitinib versus chemotherapy, Outcome 10 Leukopenia.
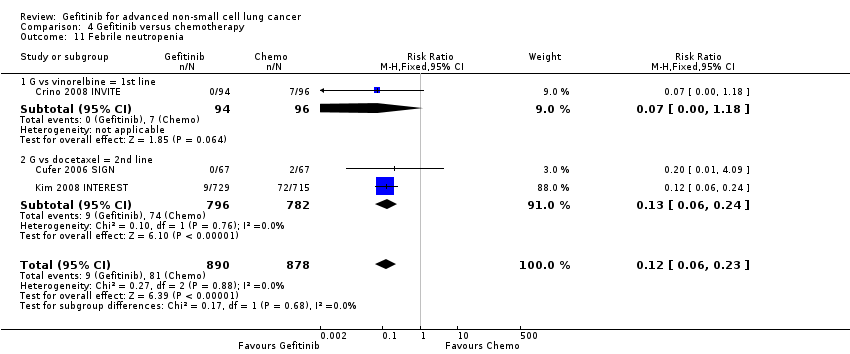
Comparison 4 Gefitinib versus chemotherapy, Outcome 11 Febrile neutropenia.

Comparison 4 Gefitinib versus chemotherapy, Outcome 12 Pruritus.
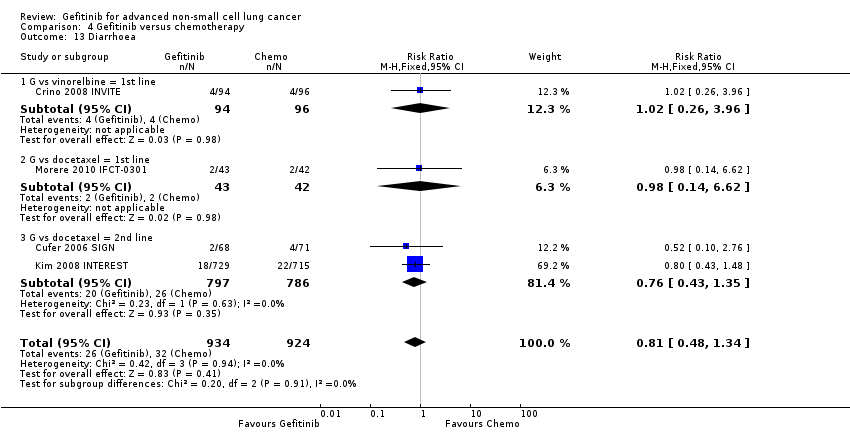
Comparison 4 Gefitinib versus chemotherapy, Outcome 13 Diarrhoea.

Comparison 4 Gefitinib versus chemotherapy, Outcome 14 Vomiting.

Comparison 4 Gefitinib versus chemotherapy, Outcome 15 Anorexia.

Comparison 4 Gefitinib versus chemotherapy, Outcome 16 Stomatitis.
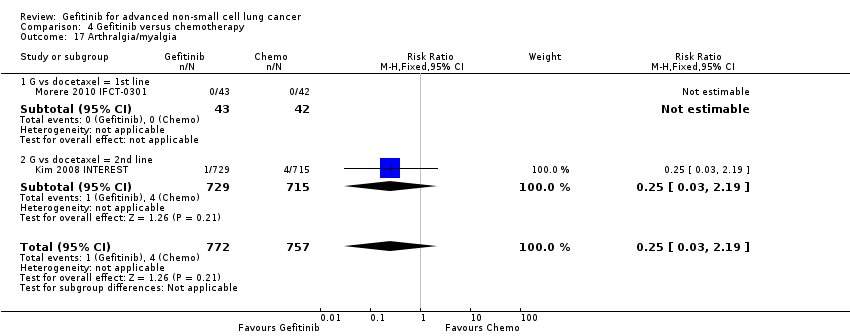
Comparison 4 Gefitinib versus chemotherapy, Outcome 17 Arthralgia/myalgia.

Comparison 4 Gefitinib versus chemotherapy, Outcome 18 Peripheral oedema.

Comparison 4 Gefitinib versus chemotherapy, Outcome 19 Respiratory tract infection.

Comparison 4 Gefitinib versus chemotherapy, Outcome 20 Dyspnoea.
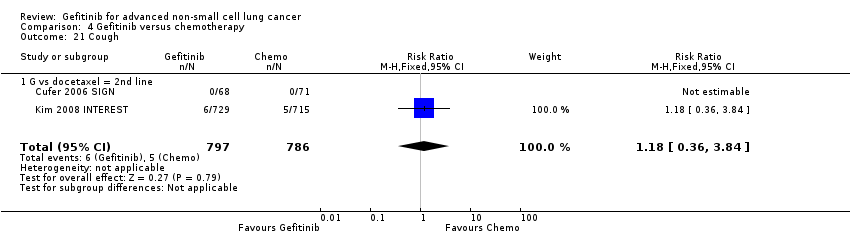
Comparison 4 Gefitinib versus chemotherapy, Outcome 21 Cough.

Comparison 4 Gefitinib versus chemotherapy, Outcome 22 Anaemia.

Comparison 4 Gefitinib versus chemotherapy, Outcome 23 Thrombocytopenia.

Comparison 4 Gefitinib versus chemotherapy, Outcome 24 Hypokalaemia.

Comparison 4 Gefitinib versus chemotherapy, Outcome 25 Pyrexia.

Comparison 4 Gefitinib versus chemotherapy, Outcome 26 Overall response rate.
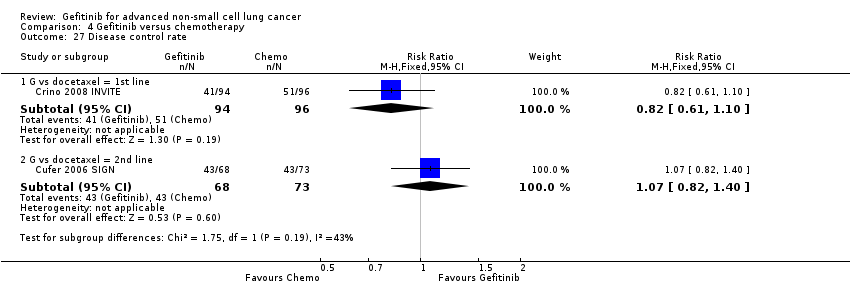
Comparison 4 Gefitinib versus chemotherapy, Outcome 27 Disease control rate.
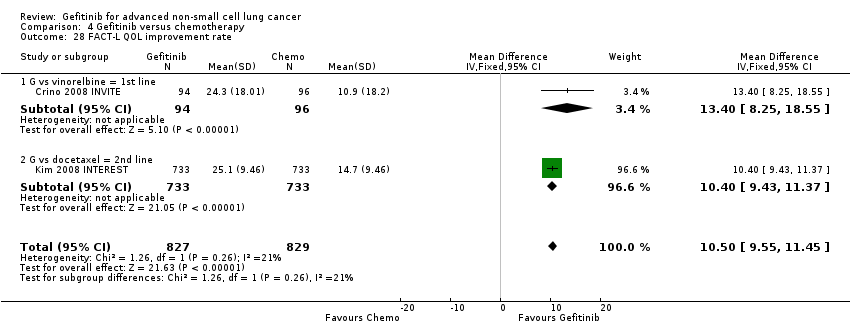
Comparison 4 Gefitinib versus chemotherapy, Outcome 28 FACT‐L QOL improvement rate.

Comparison 4 Gefitinib versus chemotherapy, Outcome 29 LCS QOL improvement rate.
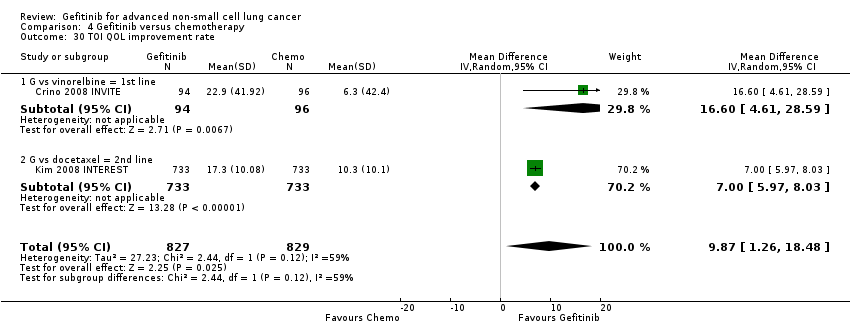
Comparison 4 Gefitinib versus chemotherapy, Outcome 30 TOI QOL improvement rate.

Comparison 4 Gefitinib versus chemotherapy, Outcome 31 PSI QOL improvement rate.

Comparison 5 Gefitinib versus chemotherapy (Asian subgroup), Outcome 1 HR Overall survival = 1st line.

Comparison 5 Gefitinib versus chemotherapy (Asian subgroup), Outcome 2 HR Overall survival = 2nd line.

Comparison 5 Gefitinib versus chemotherapy (Asian subgroup), Outcome 3 HR Overall survival = Maintenance.
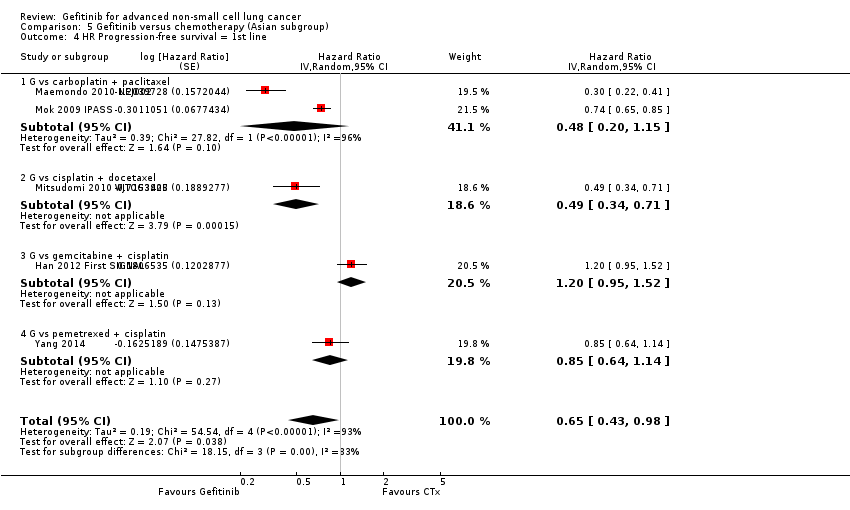
Comparison 5 Gefitinib versus chemotherapy (Asian subgroup), Outcome 4 HR Progression‐free survival = 1st line.

Comparison 5 Gefitinib versus chemotherapy (Asian subgroup), Outcome 5 HR Progression‐free survival = 2nd line.
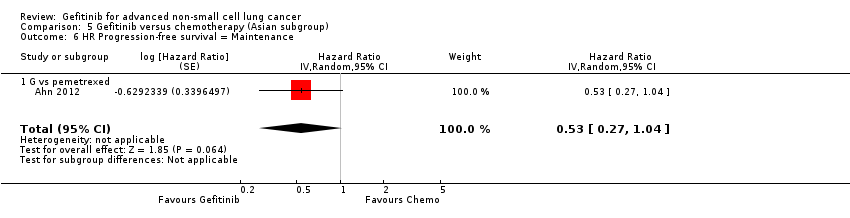
Comparison 5 Gefitinib versus chemotherapy (Asian subgroup), Outcome 6 HR Progression‐free survival = Maintenance.

Comparison 5 Gefitinib versus chemotherapy (Asian subgroup), Outcome 7 1‐year survival rate.

Comparison 5 Gefitinib versus chemotherapy (Asian subgroup), Outcome 8 Nausea.

Comparison 5 Gefitinib versus chemotherapy (Asian subgroup), Outcome 9 Vomiting.

Comparison 5 Gefitinib versus chemotherapy (Asian subgroup), Outcome 10 Anorexia.
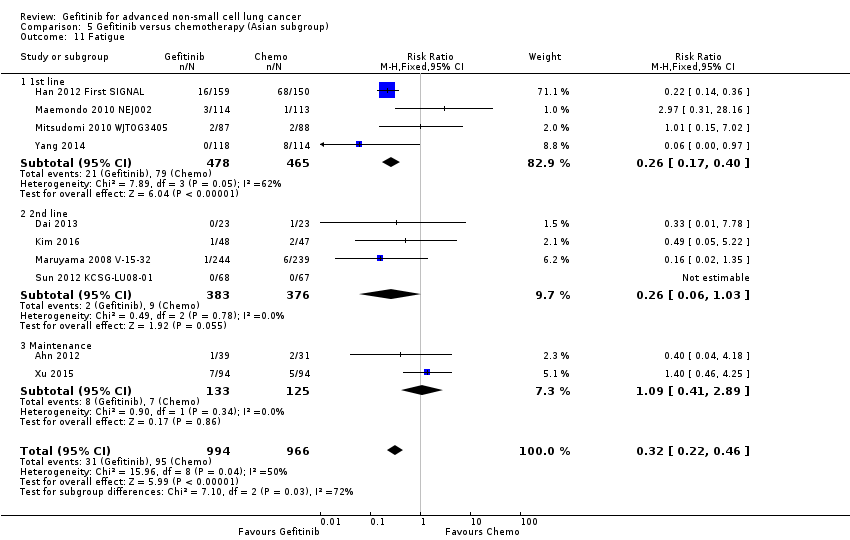
Comparison 5 Gefitinib versus chemotherapy (Asian subgroup), Outcome 11 Fatigue.

Comparison 5 Gefitinib versus chemotherapy (Asian subgroup), Outcome 12 Arthralgia/myalgia.

Comparison 5 Gefitinib versus chemotherapy (Asian subgroup), Outcome 13 Asthenia.

Comparison 5 Gefitinib versus chemotherapy (Asian subgroup), Outcome 14 Neurotoxicity.

Comparison 5 Gefitinib versus chemotherapy (Asian subgroup), Outcome 15 Neutropenia.
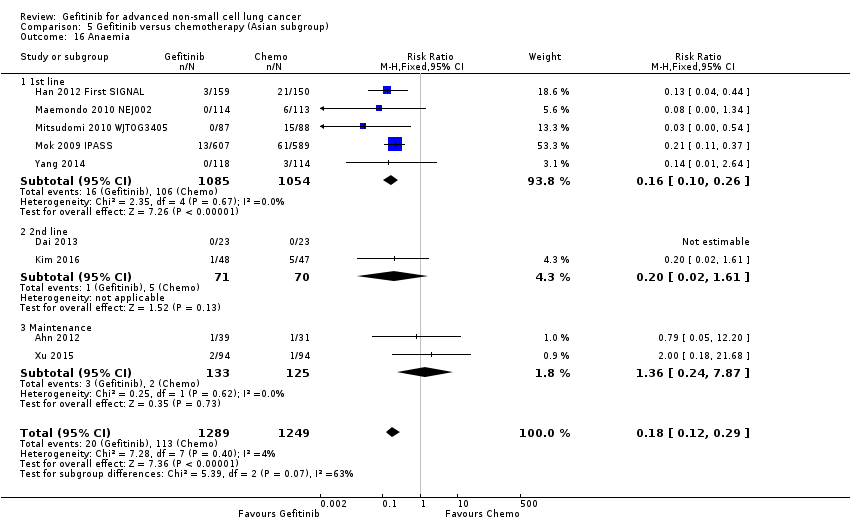
Comparison 5 Gefitinib versus chemotherapy (Asian subgroup), Outcome 16 Anaemia.

Comparison 5 Gefitinib versus chemotherapy (Asian subgroup), Outcome 17 Leukopenia.
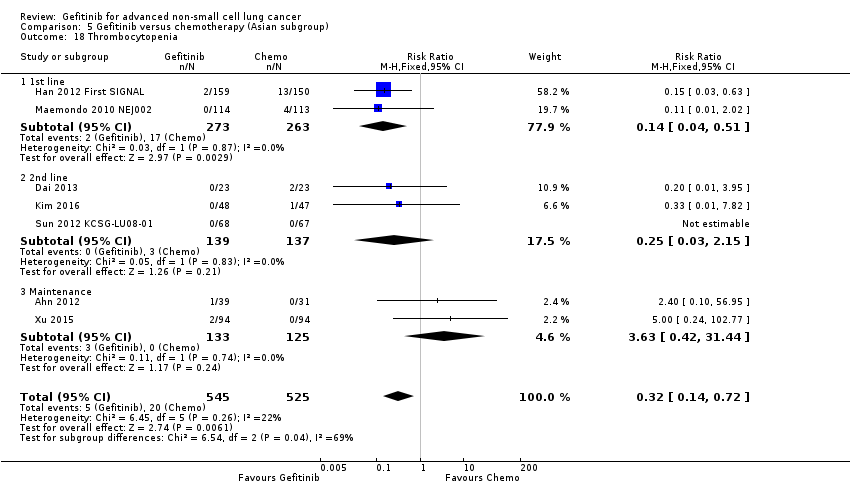
Comparison 5 Gefitinib versus chemotherapy (Asian subgroup), Outcome 18 Thrombocytopenia.

Comparison 5 Gefitinib versus chemotherapy (Asian subgroup), Outcome 19 Febrile neutropenia.

Comparison 5 Gefitinib versus chemotherapy (Asian subgroup), Outcome 20 Skin rash.
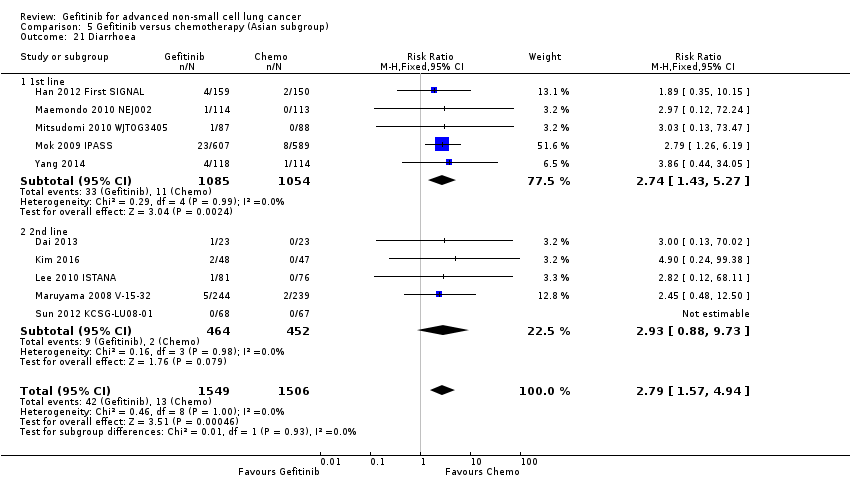
Comparison 5 Gefitinib versus chemotherapy (Asian subgroup), Outcome 21 Diarrhoea.
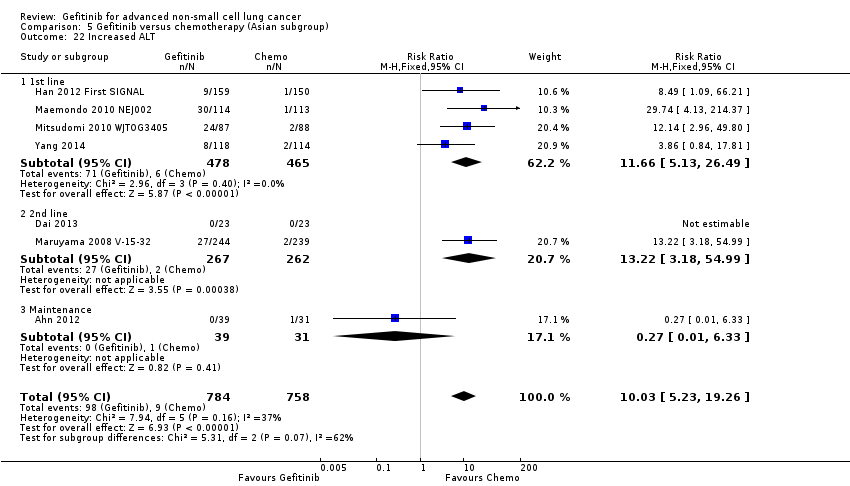
Comparison 5 Gefitinib versus chemotherapy (Asian subgroup), Outcome 22 Increased ALT.

Comparison 5 Gefitinib versus chemotherapy (Asian subgroup), Outcome 23 Increased AST.
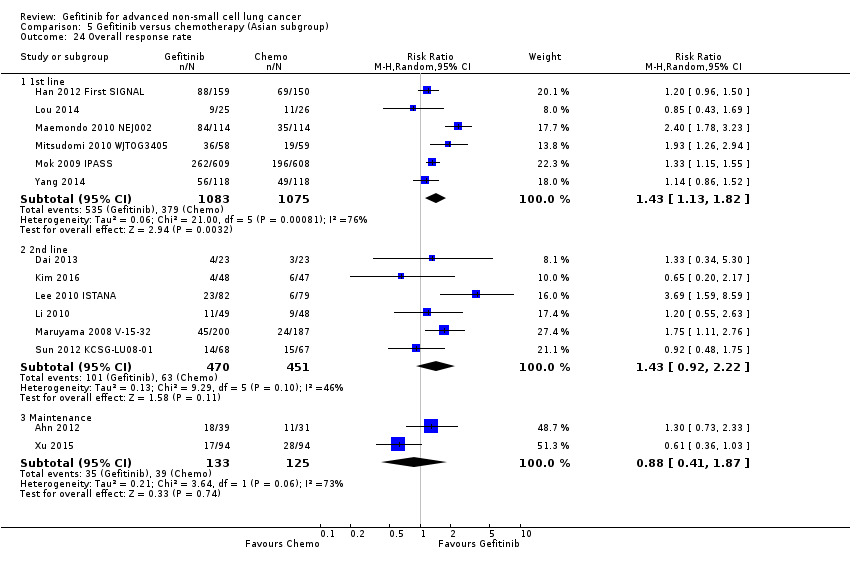
Comparison 5 Gefitinib versus chemotherapy (Asian subgroup), Outcome 24 Overall response rate.

Comparison 5 Gefitinib versus chemotherapy (Asian subgroup), Outcome 25 Stable disease.

Comparison 5 Gefitinib versus chemotherapy (Asian subgroup), Outcome 26 Disease control rate.
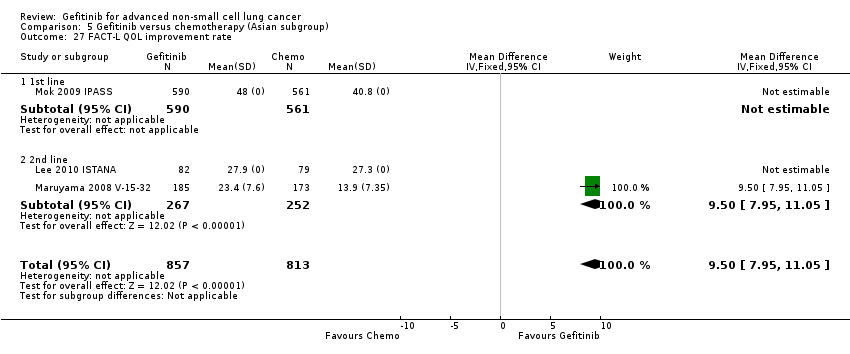
Comparison 5 Gefitinib versus chemotherapy (Asian subgroup), Outcome 27 FACT‐L QOL improvement rate.

Comparison 5 Gefitinib versus chemotherapy (Asian subgroup), Outcome 28 LCS QOL improvement rate.

Comparison 5 Gefitinib versus chemotherapy (Asian subgroup), Outcome 29 TOI QOL improvement rate.

Comparison 6 Gefitinib versus chemotherapy (EGFR mutation), Outcome 1 HR Overall survival = 1st line.

Comparison 6 Gefitinib versus chemotherapy (EGFR mutation), Outcome 2 HR Overall survival = 2nd line.

Comparison 6 Gefitinib versus chemotherapy (EGFR mutation), Outcome 3 HR Progression‐free survival = 1st line.

Comparison 6 Gefitinib versus chemotherapy (EGFR mutation), Outcome 4 HR Progression‐free survival = 2nd line.
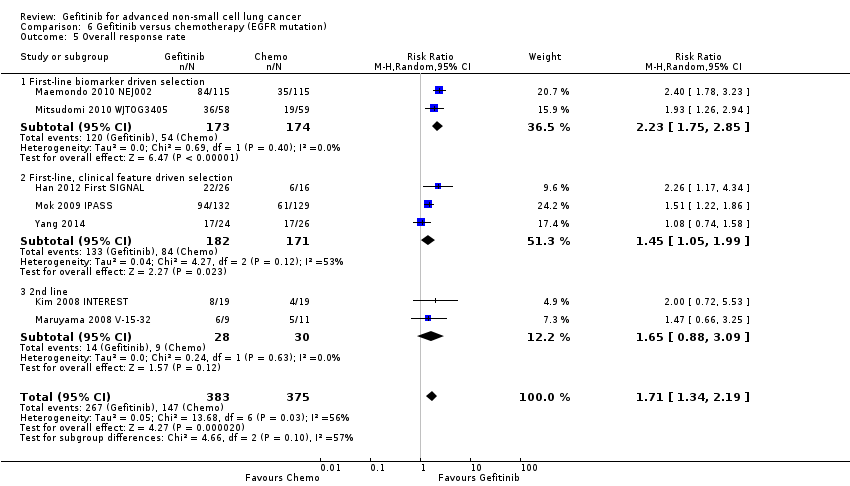
Comparison 6 Gefitinib versus chemotherapy (EGFR mutation), Outcome 5 Overall response rate.

Comparison 6 Gefitinib versus chemotherapy (EGFR mutation), Outcome 6 Stable disease.

Comparison 6 Gefitinib versus chemotherapy (EGFR mutation), Outcome 7 Disease control rate.
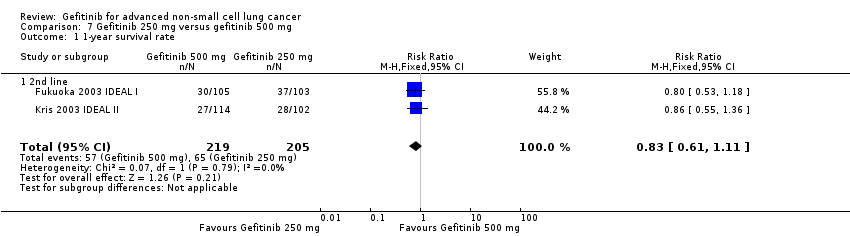
Comparison 7 Gefitinib 250 mg versus gefitinib 500 mg, Outcome 1 1‐year survival rate.

Comparison 7 Gefitinib 250 mg versus gefitinib 500 mg, Outcome 2 Skin rash.
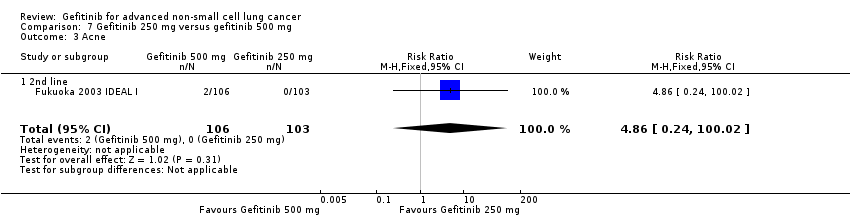
Comparison 7 Gefitinib 250 mg versus gefitinib 500 mg, Outcome 3 Acne.

Comparison 7 Gefitinib 250 mg versus gefitinib 500 mg, Outcome 4 Pruritus.

Comparison 7 Gefitinib 250 mg versus gefitinib 500 mg, Outcome 5 Diarrhoea.
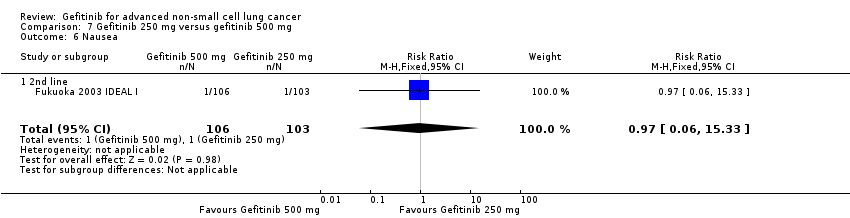
Comparison 7 Gefitinib 250 mg versus gefitinib 500 mg, Outcome 6 Nausea.

Comparison 7 Gefitinib 250 mg versus gefitinib 500 mg, Outcome 7 Vomiting.
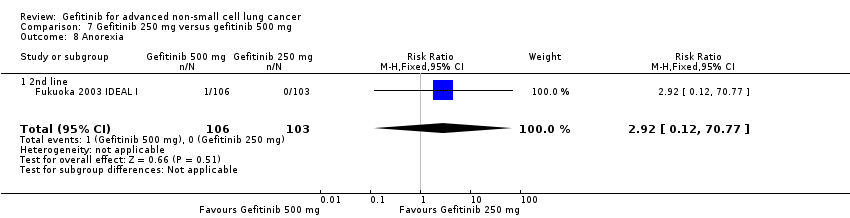
Comparison 7 Gefitinib 250 mg versus gefitinib 500 mg, Outcome 8 Anorexia.

Comparison 7 Gefitinib 250 mg versus gefitinib 500 mg, Outcome 9 Asthenia.

Comparison 7 Gefitinib 250 mg versus gefitinib 500 mg, Outcome 10 Overall response rate.

Comparison 7 Gefitinib 250 mg versus gefitinib 500 mg, Outcome 11 Partial response.

Comparison 7 Gefitinib 250 mg versus gefitinib 500 mg, Outcome 12 FACT‐L Symptom improvement rate.

Comparison 7 Gefitinib 250 mg versus gefitinib 500 mg, Outcome 13 TOI QOL improvement rate.
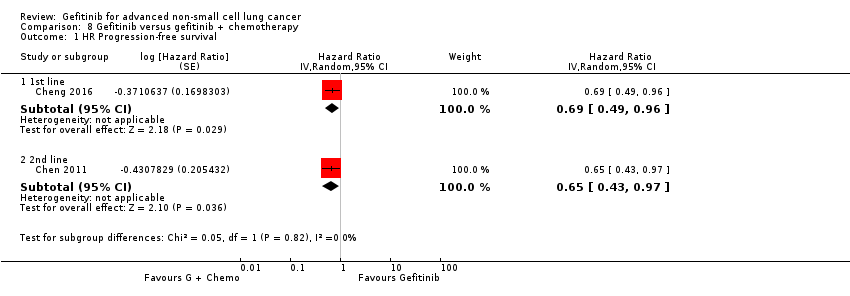
Comparison 8 Gefitinib versus gefitinib + chemotherapy, Outcome 1 HR Progression‐free survival.
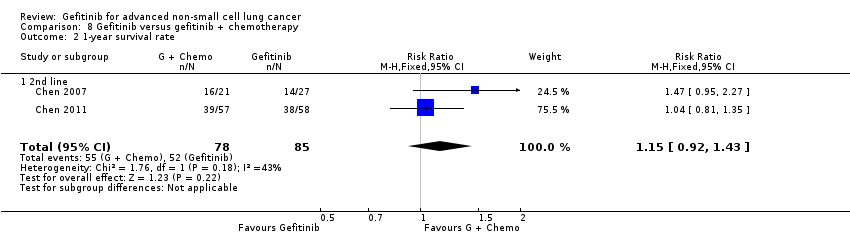
Comparison 8 Gefitinib versus gefitinib + chemotherapy, Outcome 2 1‐year survival rate.

Comparison 8 Gefitinib versus gefitinib + chemotherapy, Outcome 3 1‐year progression‐free survival.
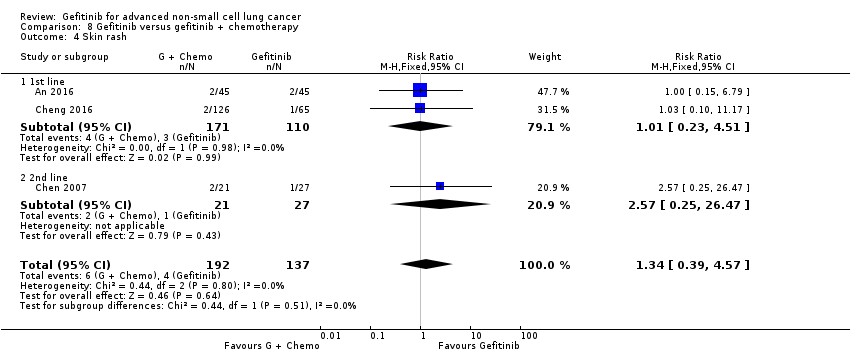
Comparison 8 Gefitinib versus gefitinib + chemotherapy, Outcome 4 Skin rash.

Comparison 8 Gefitinib versus gefitinib + chemotherapy, Outcome 5 Diarrhoea.

Comparison 8 Gefitinib versus gefitinib + chemotherapy, Outcome 6 Constipation.
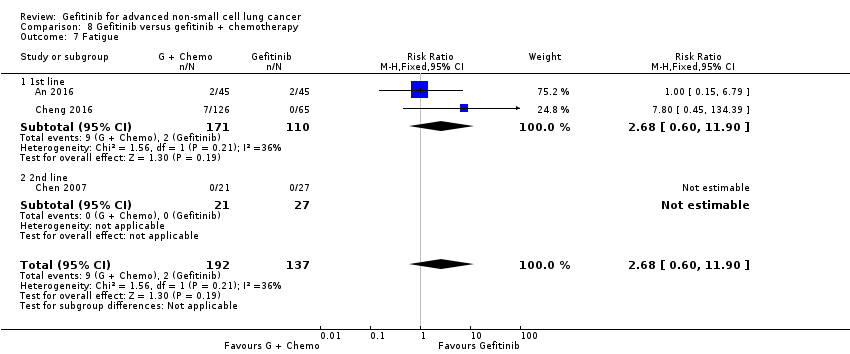
Comparison 8 Gefitinib versus gefitinib + chemotherapy, Outcome 7 Fatigue.

Comparison 8 Gefitinib versus gefitinib + chemotherapy, Outcome 8 Leukopenia.

Comparison 8 Gefitinib versus gefitinib + chemotherapy, Outcome 9 Anaemia.

Comparison 8 Gefitinib versus gefitinib + chemotherapy, Outcome 10 Thrombocytopenia.
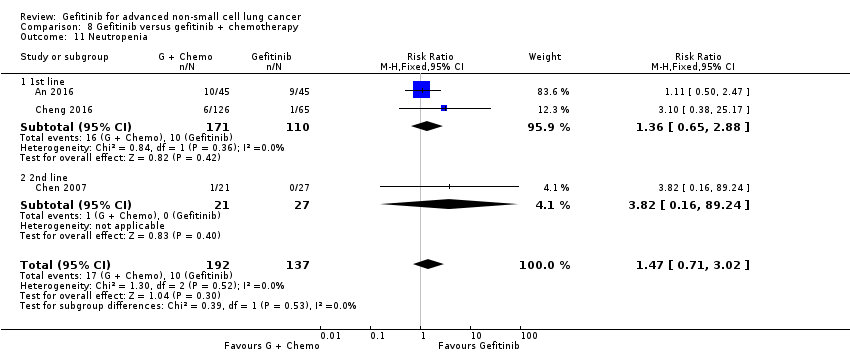
Comparison 8 Gefitinib versus gefitinib + chemotherapy, Outcome 11 Neutropenia.

Comparison 8 Gefitinib versus gefitinib + chemotherapy, Outcome 12 Increased ALT.
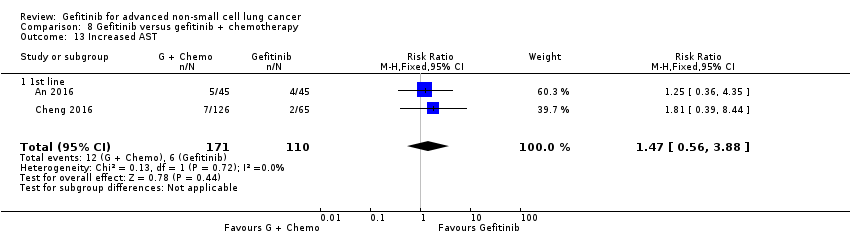
Comparison 8 Gefitinib versus gefitinib + chemotherapy, Outcome 13 Increased AST.
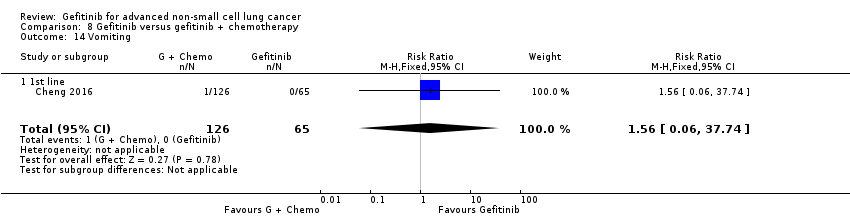
Comparison 8 Gefitinib versus gefitinib + chemotherapy, Outcome 14 Vomiting.

Comparison 8 Gefitinib versus gefitinib + chemotherapy, Outcome 15 Nausea.

Comparison 8 Gefitinib versus gefitinib + chemotherapy, Outcome 16 Overall response rate.

Comparison 8 Gefitinib versus gefitinib + chemotherapy, Outcome 17 Partial response.

Comparison 8 Gefitinib versus gefitinib + chemotherapy, Outcome 18 Stable disease.

Comparison 9 Gefitinib + chemotherapy versus chemotherapy, Outcome 1 HR Overall survival.
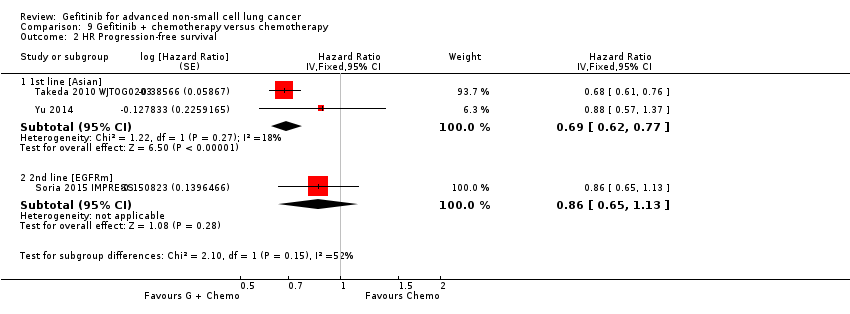
Comparison 9 Gefitinib + chemotherapy versus chemotherapy, Outcome 2 HR Progression‐free survival.

Comparison 9 Gefitinib + chemotherapy versus chemotherapy, Outcome 3 1‐year survival rate.

Comparison 9 Gefitinib + chemotherapy versus chemotherapy, Outcome 4 Skin rash.

Comparison 9 Gefitinib + chemotherapy versus chemotherapy, Outcome 5 Acne.

Comparison 9 Gefitinib + chemotherapy versus chemotherapy, Outcome 6 Diarrhoea.

Comparison 9 Gefitinib + chemotherapy versus chemotherapy, Outcome 7 Pruritus.

Comparison 9 Gefitinib + chemotherapy versus chemotherapy, Outcome 8 Vomiting.

Comparison 9 Gefitinib + chemotherapy versus chemotherapy, Outcome 9 Nausea.
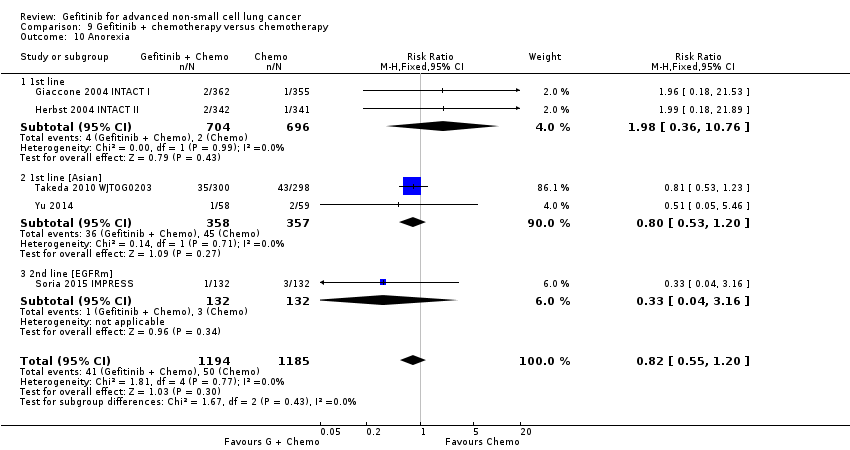
Comparison 9 Gefitinib + chemotherapy versus chemotherapy, Outcome 10 Anorexia.
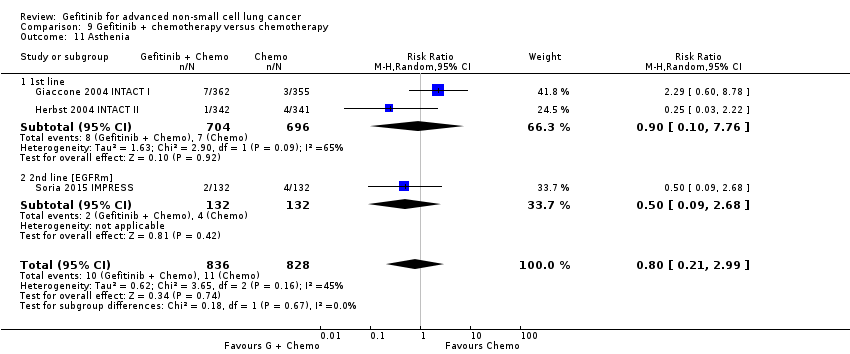
Comparison 9 Gefitinib + chemotherapy versus chemotherapy, Outcome 11 Asthenia.
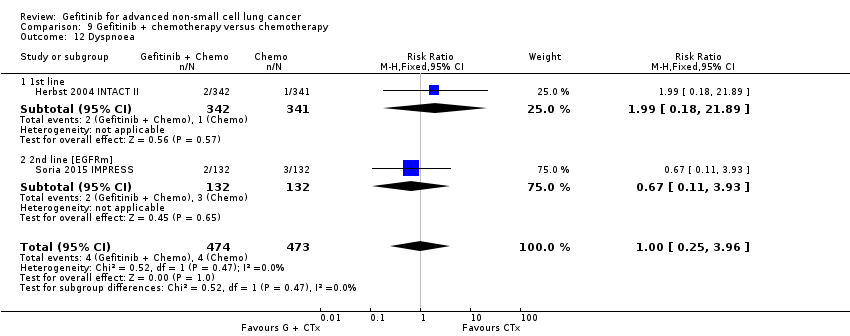
Comparison 9 Gefitinib + chemotherapy versus chemotherapy, Outcome 12 Dyspnoea.

Comparison 9 Gefitinib + chemotherapy versus chemotherapy, Outcome 13 Anaemia.

Comparison 9 Gefitinib + chemotherapy versus chemotherapy, Outcome 14 Neutropenia.
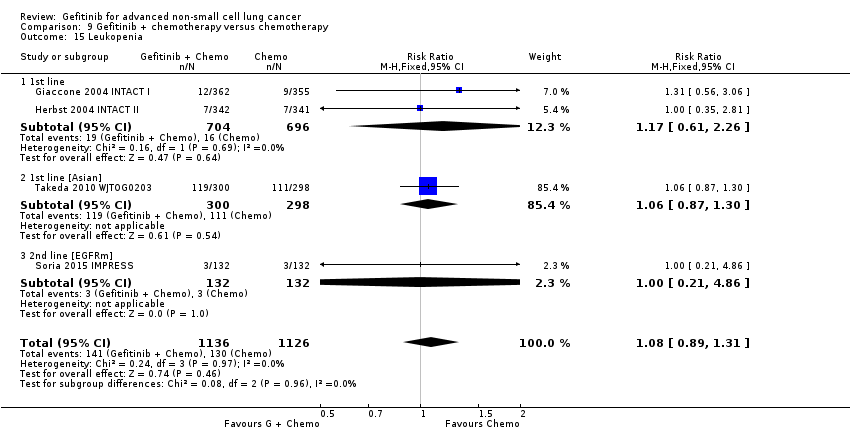
Comparison 9 Gefitinib + chemotherapy versus chemotherapy, Outcome 15 Leukopenia.

Comparison 9 Gefitinib + chemotherapy versus chemotherapy, Outcome 16 Overall response rate.
| Gefitinib compared to chemotherapy for first‐line treatment of advanced NSCLC | ||||||
| Patient or population: advanced NSCLC | ||||||
| Outcomes | Illustrative comparative risks* (95% CI) | Relative effect | No of participants | Quality of the evidence | Comments | |
| Assumed risk | Corresponding risk | |||||
| Chemotherapy | Gefitinib | |||||
| Overall survival (OS) | The mean OS ranged across control groups from 3.5 to 8 months | The mean OS in the intervention group ranged from 2.2 to 5.9 months | HR 0.98 (0.91 to 1.46) | 275 | ⊕⊕⊕⊝ | OS similar in the Asian (HR 0.94, 0.82 to 1.06) and EGFR mutation positive subgroups (HR 0.97, 0.77 to 1.21) |
| Progression‐free survival (PFS) | The PFS ranged across control groups from 2 to 2.9 months | The mean PFS in the intervention group ranged from 1.9 to 2.7 months | HR 1.19 (0.86 to 1.65) | 275 | ⊕⊕⊕⊝ | PFS improved with gefitinib in the Asian subgroup (HR 0.65, 0.43 to 0.98) and the EGFR mutation positive subgroup (HR 0.47, 0.36 to 0.61) |
| *The basis for the assumed risk (e.g. the median control group risk across studies) is provided in footnotes. The corresponding risk (and its 95% confidence interval) is based on the assumed risk in the comparison group and the relative effect of the intervention (and its 95% CI). | ||||||
| GRADE Working Group grades of evidence | ||||||
| 1We downgraded the quality of evidence by one level because of serious indirectness as one study included only elderly patients (> 70 years old). | ||||||
| Gefitinib compared to chemotherapy for second‐line treatment of advanced NSCLC | ||||||
| Patient or population: advanced NSCLC | ||||||
| Outcomes | Illustrative comparative risks* (95% CI) | Relative effect | No of participants | Quality of the evidence | Comments | |
| Assumed risk | Corresponding risk | |||||
| Chemotherapy | Gefitinib | |||||
| Overall survival (OS) | The mean OS ranged across control groups from 7.1 to 8 months | The mean OS in the intervention group ranged from 7.5 to 7.6 months | HR 1.02 (0.91 to 1.15) | 1607 | ⊕⊕⊕⊝ | OS similar in Asian patients (HR 0.94, 0.79 to 1.12) and EGFR mutation positive patients (HR 0.83, 0.41 to 1.66). |
| Progression‐free survival (PFS) | The mean PFS ranged across control groups from 2.7 to 3.4 months | The mean PFS in the intervention group ranged from 2.2 to 3 months | HR 1.04 (0.92 to 1.17) | 1607 | ⊕⊕⊕⊝ | PFS significantly improved in Asian patients (HR 0.71, 0.57 to 0.88) and in patients positive for EGFR mutation (HR 0.24, 0.12 to 0.47) (ranged from 2.7 to 4.1 months versus 4.5 to 7 months). |
| *The basis for the assumed risk (e.g. the median control group risk across studies) is provided in footnotes. The corresponding risk (and its 95% confidence interval) is based on the assumed risk in the comparison group and the relative effect of the intervention (and its 95% CI). | ||||||
| GRADE Working Group grades of evidence | ||||||
| 1We downgraded the quality of evidence by one level because of imprecision based on the wide confidence interval. | ||||||
| Gefitinib compared to chemotherapy for advanced NSCLC | |||||
| Patient or population: advanced NSCLC | |||||
| Outcomes | Illustrative comparative risks* (95% CI) | Relative effect | No of participants | Quality of the evidence | |
| Assumed risk | Corresponding risk | ||||
| Chemotherapy | Gefitinib | ||||
| Skin rash | Study population | RR 2.40 | 1858 | ⊕⊕⊕⊕ | |
| 9 per 1000 | 21 per 1000 | ||||
| Constipation | Study population | RR 0.41 | 1719 | ⊕⊕⊕⊕ | |
| 19 per 1000 | 8 per 1000 | ||||
| Fatigue | Study population | RR 0.16 | 275 | ⊕⊕⊕⊝ | |
| 65 per 1000 | 10 per 1000 | ||||
| Asthenia | Study population | RR 0.51 | 1773 | ⊕⊕⊕⊕ | |
| 79 per 1000 | 40 per 1000 | ||||
| Neurotoxicity | Study population | RR 0.07 | 1529 | ⊕⊕⊕⊕ | |
| 29 per 1000 | 2 per 1000 | ||||
| Neutropenia | Study population | RR 0.04 | 1857 | ⊕⊕⊕⊕ | |
| 505 per 1000 | 20 per 1000 | ||||
| Febrile neutropenia | Study population | RR 0.12 | 1768 | ⊕⊕⊕⊕ | |
| 92 per 1000 | 11 per 1000 | ||||
| *The basis for the assumed risk (e.g. the median control group risk across studies) is provided in footnotes. The corresponding risk (and its 95% confidence interval) is based on the assumed risk in the comparison group and the relative effect of the intervention (and its 95% CI). | |||||
| GRADE Working Group grades of evidence | |||||
| 1We downgraded the quality of evidence by one level because of serious indirectness as one study included only elderly patients (> 70 years old). | |||||
| Author/Year (Study name) | Journal | N | Comparison | Inclusion criteria | Phase | Asian | EGFR mutation | Line? |
| 1. Gefitinib versus placebo | ||||||||
| Goss 2009 (INSTEP) | JCO 27(13):2253‐2260 | 201 | Placebo | Poor PS | II | N | Subgroup | 1st line |
| Thatcher 2005 (ISEL) | Lancet 366:1527‐37 | 1692 | Placebo | — | III | Subset (Chang) | Subgroup (Hirsch) | 2nd line |
| Gaafar 2011 (EORTC08021) | Eur J Cancer (47):2331‐2340 | 173 | Placebo | Maintenance | III | N | N | Maintenance |
| Kelly 2008 (SWOGS0023) | JCO 26(15):2450‐2456 | 243 | Placebo | Consolidation | III | N | N | Maintenance |
| Zhang 2012 (INFORM) | Lancet Oncology 13:466‐475 | 296 | Placebo | Maintenance | III | Y | Subgroup | Maintenance |
| 2. Gefitinib versus chemotherapy | ||||||||
| Crino 2008 (INVITE) | JCO 26(26):4253‐4260 | 196 | Vinorelbine | Elderly patients | II | N | Subgroup | 1st line |
| Lou 2014 | Natl Med J China 94(30): 2337‐2341 | 51 | Carboplatin + paclitaxel | Asian | II | Y | N | 1st line |
| Morere 2010 (IFCT0301) | Lung Cancer 70:301‐307 | 85 | Docetaxel | Poor PS | II | N | N | 1st line |
| Han 2013 (First‐SIGNAL) | JCO 30(10): 1122‐1128 | 313 | Gemcitabine + cisplatin | — | III | Y | Planned Subgroup | 1st line |
| Mok 2009 (IPASS) | NEJM 361(10):947‐957 | 1217 | Carboplatin + paclitaxel | Asian, adenocarcinomas | III | Y | Subgroup | 1st line |
| Maemondo 2010 (NEJ002) | NEJM 362(25):2580‐2588 | 230 | Carboplatin + paclitaxel | Asian, EGFR mutation | III | Y | Y | 1st line |
| Mitsudomi 2010 (WJTOG3405) | Lancet Oncol 11:121‐128 | 177 | Cisplatin + docetaxel | Asian, EGFR mutation | III | Y | Y | 1st line |
| Yang 2014 | Eur J Cancer 50:2219‐2230 | 236 | Pemetrexed + cisplatin | Asian | III | Y | Subgroup | 1st line + maintenance |
| Cufer 2006 (SIGN) | Anti‐cancer Drugs 14:401‐409 | 141 | Docetaxel | Open‐label | II | N | N | 2nd line |
| Dai 2013 | Chin J Lung Cancer 16(8):405‐410 | 46 | Pemetrexed | Asian | II | Y | N | 2nd line |
| Kim 2016 | Cancer Res Treat 48(1):80‐87 | 95 | Pemetrexed | Asian | II | Y | N | 2nd/3rd line |
| Li 2010 | Chinese J Clin Onc 37:16‐18 | 98 | Docetaxel | Asian | II | Y | N | 2nd line |
| Kim 2008 (INTEREST) | Lancet 372:1809‐1818 | 1466 | Docetaxel | — | III | N | Subgroup (Doulliard) | 2nd line |
| Lee 2010 (ISTANA) | Clin Cancer Res 16(4):1307‐1314 | 161 | Docetaxel | Asian | III | Y | N | 2nd/3rd line |
| Maruyama 2008 (V‐15‐32) | JCO 26(26):4244‐4252 | 489 | Docetaxel | Asian | III | Y | Subgroup | 2nd/3rd line |
| Sun 2012 (KSCG‐LU08‐01) | Cancer 118:6234‐6242 | 141 | Pemetrexed | Adenocarcinoma, non‐smoker | III | Y | Subgroup | 2nd line |
| Ahn 2012 | Lung Cancer 77:346‐352 | 73 | Pemetrexed | Asian, never‐smokers | II | Y | N | Maintenance |
| Xu 2015 | Int J Clin Exp Med 8(4):6242‐6246 | 188 | Pemetrexed | Asian | II | Y | N | Maintenance |
| 3. Gefitinib 250 mg versus gefitinib 500 mg | ||||||||
| Fukuoka 2003 (IDEAL I) | JCO 21(12):2237‐2246 | 210 | G250 versus G500 | — | II | N | N | 2rd/3rd line |
| Kris 2003 (IDEAL II) | JAMA 290(16):2149‐2158 | 216 | G250 versus G500 | — | II | N | N | 3rd line |
| Xue 2015 | Int J Clin Exp Med 8(4):6242‐6246 | 188 | G250 versus G500 | Asian | II | Y | N | Maintenance |
| 4. Gefitinib versus gefitinib + chemotherapy | ||||||||
| An 2016 | Pathol Oncol Res 22:763‐768 | 90 | Gefitinib + Pemetrexed | Asian, EGFR mutation | II | Y | Y | 1st line |
| Cheng 2016 | JCO 34(27): 3258‐3266 | 191 | Gefitinib + Pemetrexed | Asian, EGFR mutation | II | Y | Y | 1st line |
| Chen 2007 | Cancer 109:1821‐8 | 48 | Gefitinib + Vinorelbine | Adenocarcinoma | II | N | Subgroup | 3rd line |
| Chen 2011 | J Thor Oncol 6:1110‐1116 | 115 | Gefitinib + Tegafur | Adenocarcinoma | II | Y | Subgroup | 2nd/3rd line |
| 5. Gefitinib + chemotherapy versus chemotherapy | ||||||||
| Giaccone 2004 (INTACT I) | JCO 22(5):777‐784 | 1093 | Gemcitabine + Cisplatin | — | III | N | N | 1st line |
| Herbst 2004 (INTACT II) | JCO 22(5):785‐794 | 1037 | Carboplatin + paclitaxel | — | III | N | N | 1st line |
| Takeda 2010 (WTOG0203) | JCO 28(5):753‐760 | 604 | Platinum doublet | — | III | Y | N | 1st line |
| Yu 2014 | Cancer Biology & Therapy 15:832‐839 | 117 | Pemetrexed + platinum | Asian | II | Y | N | 1st line |
| Soria 2015 (IMPRESS) | Lancet Oncology 16:990‐98 | 265 | Pemetrexed + cisplatin | EGFR mutation positive | III | N | Y | 2nd line |
| EGFR: epidermal growth factor receptor Journals: Cancer Res Treat: Cancer Research and Treatment | ||||||||
| Study | ORR (%) | PFS (months) | OS (months) | ||||||
| 1. Gefitinib versus placebo | Gefitinib | Control | P | Gefitinib | Control | P | Gefitinib | Control | P |
| 1st line | |||||||||
| Goss 2009 | 6 | 1.0 | NS | 1.43 | 1.37 | NS | 3.7 | 2.8 | NS |
| 2nd line | |||||||||
| Thatcher 2005 ISEL | 37.5 | 48.3 | NS | 3 | 2.6 | 0.0006 | 5.6 | 5.1 | 0.087 |
| Maintenance therapy | |||||||||
| Kelly 2008 SWOGS0023 | ‐ | ‐ | ‐ | 8.3 | 11.7 | NS | 23 | 35 | 0.013 |
| Gaafar 2011 EORTC08021 | 12 | 1 | 0.004 | 4.1 | 2.9 | 0.0015 | 10.9 | 9.4 | NS |
| 2. Gefitinib versus placebo (Asian population) | Gefitinib | Control | P | Gefitinib | Control | P | Gefitinib | Control | P |
| Chang 2006 ISEL | 12.4 | 2.1 | 0.01 | 4.4 | 2.2 | 0.008 | 9.5 | 5.5 | 0.01 |
| Zhang 2012 INFORM | 24 | 1 | 0.0001 | 4.8 | 2.6 | < 0.0001 | 18.7 | 16.0 | NS |
| 3. Gefitinib versus placebo (EGFR mutation positive) | Gefitinib | Control | P | Gefitinib | Control | P | Gefitinib | Control | P |
| Zhang 2012 INFORM | ‐ | ‐ | ‐ | 16.6 | 2.8 | 0.0063 | 46.87 | 20.97 | 0.036 |
| Gefitinib vs chemotherapy | |||||||||
| 4. General population | Gefitinib | Chemo | P | Gefitinib | Chemo | P | Gefitinib | Chemo | P |
| versus 1st line chemotherapy | |||||||||
| Crino 2008 INVITE | 3.1 | 5.1 | ‐ | 2.7 | 2.9 | NS | 5.9 | 8 | NS |
| Morere 2010 IFCT0301 | ‐ | ‐ | ‐ | 1.9 | 2 | 0.078 | 2.2 | 3.5 | 0.088 |
| Morere 2010 IFCT0301 (Adenocarcinoma) | ‐ | ‐ | ‐ | 1.9 | 2.1 | 0.272 | 2.3 | 4.4 | NS |
| versus 2nd line chemotherapy | |||||||||
| Cufer 2006 SIGN | 13.2 | 13.7 | NS | 7.5 | 7.1 | NS | 3 | 3.4 | NS |
| Kim 2008 INTEREST | 9.1 | 7.6 | NS | 2.2 | 2.7 | NS | 7.6 | 8 | NS |
| Kim 2008 INTEREST | ‐ | ‐ | ‐ | ‐ | ‐ | ‐ | 8.5 | 8.9 | NS |
| 5. Asian population | Gefitinib | Chemo | P | Gefitinib | Chemo | P | Gefitinib | Chemo | P |
| versus 1st line chemotherapy | |||||||||
| Lou 2014 | 36 | 42.3 | NS | 4.2 | 8.3 | NS | 14.4 | 15 | NS |
| Maemondo 2010 (EGFR mutation positive) | 73.7 | 30.7 | < 0.001 | 10.8 | 5.4 | < 0.001 | 30.5 | 23.6 | NS |
| Mitsudomi 2010 WJTOG (EGFR mutation positive) | 62.1 | 32.2 | < 0.0001 | 9.2 | 6.3 | < 0.0001 | ‐ | ‐ | ‐ |
| Mok 2009 IPASS | 43 | 32.2 | < 0.001 | 5.7 | 5.8 | NS | 18.6 | 17.3 | NS |
| Han 2012 First‐SIGNAL (adenocarcinoma) | 55.4 | 46 | NS | 5.8 | 6.4 | NS | 22.3 | 22.9 | NS |
| Yang 2014 (Asian) | 47.5 | 41.5 | NS | 9.63 | 8.38 | NS | 27.9 | 26.9 | NS |
| versus 2nd line chemotherapy | |||||||||
| Dai 2013 | 17.4 | 13 | NS | 4.4 | 3.1 | NS | ‐ | ‐ | ‐ |
| Kim 2016 | 8 | 13 | NS | 2 | 2 | NS | 8.5 | 8.5 | NS |
| Li 2010 | 22.4 | 18.8 | NS | ‐ | ‐ | ‐ | 7.1 | 6.9 | NS |
| Kim 2008 INTEREST (subgroup) | ‐ | ‐ | ‐ | ‐ | ‐ | ‐ | 10.4 | 12.2 | NS |
| Lee 2010 ISTANA | 28.1 | 7.6 | 0.0007 | 3.3 | 3.4 | NS | 14.1 | 12.2 | NS |
| Maruyama 2008 V‐15‐32 | 22.5 | 12.8 | 0.009 | 2 | 2 | NS | 11.5 | 14 | NS |
| Sun 2012 KCSG‐LU08‐01 (adenocarcinoma, subgroup) | 58.8 | 22.4 | < 0.001 | 9.0 | 3.0 | 0.0006 | 22.2 | 18.9 | NS |
| versus maintenance therapy | |||||||||
| Ahn 2012 (Asian) | 46 | 35 | NS | 9.95 | 6.83 | NS | ‐ | ‐ | ‐ |
| Xu 2015 (Asian) | 18.1 | 29.8 | NS | ‐ | ‐ | ‐ | ‐ | ‐ | ‐ |
| 6. EGFR mutation positive | Gefitinib | Chemo | P | Gefitinib | Chemo | P | Gefitinib | Chemo | P |
| versus 1st line chemotherapy | |||||||||
| Maemondo 2010 (EGFR mutation positive) | 73.7 | 30.7 | < 0.001 | 10.8 | 5.4 | < 0.001 | 30.5 | 23.6 | NS |
| Mitsudomi 2010 WJTOG (EGFR mutation positive) | 62.1 | 32.2 | < 0.0001 | 9.2 | 6.3 | < 0.0001 | ‐ | ‐ | ‐ |
| Mok 2009 IPASS (subgroup) | 71.2 | 47.3 | < 0.001 | ‐ | ‐ | ‐ | ‐ | ‐ | ‐ |
| Han 2012 First‐SIGNAL (subgroup) | 84.6 | 37.5 | 0.002 | ‐ | ‐ | ‐ | ‐ | ‐ | ‐ |
| Yang 2014 (subgroup) | 70.8 | 65.4 | NS | 16.62 | 12.91 | NS | 45.7 | 32.4 | 0.255 |
| versus 2nd line chemotherapy | |||||||||
| INTEREST Doulliard 2010 (subgroup) | 42.1 | 21.1 | 0.04 | 7 | 4.1 | 0.001 | 14.2 | 16.6 | NS |
| Maruyama 2008 (subgroup) | 67 | 46 | ‐ | ‐ | ‐ | ‐ | ‐ | ‐ | ‐ |
| Sun 2012 KCSG‐LU08‐01 (subgroup) | ‐ | ‐ | ‐ | 15.7 | 2.9 | 0.005 | ‐ | ‐ | ‐ |
| 7. Gefitinib 250 mg versus gefitinib 500 mg | 250 mg | 500 mg | P | 250 mg | 500 mg | P | 250 mg | 500 mg | P |
| 2nd+ line | |||||||||
| Fukuoka 2003 | 18.4 | 19 | NS | 2.7 | 2.8 | NS | 7.6 | 8 | NS |
| Kris 2004 | 12 | 9 | NS | ‐ | ‐ | ‐ | 7 | 6 | NS |
| Maintenance therapy | |||||||||
| Xue 2015 (Asian) | 12.5 | 12.5 | NS | ‐ | ‐ | ‐ | ‐ | ‐ | ‐ |
| 8. Gefitinib versus gefitinib + chemotherapy | Gefitinib | G + Chemo | P | Gefitinib | G + Chemo | P | Gefitinib | G + Chemo | P |
| 1st line | |||||||||
| An 2016 | 73.33 | 80 | NS | 14 | 18 | < 0.05 | 32 | 34 | NS |
| Cheng 2016 | 74 | 80 | NS | 10.9 | 15.8 | 0.014 | ‐ | ‐ | ‐ |
| 2nd+ line | |||||||||
| Chen 2007(Asian, adenocarcinoma) | 55.6 | 52.4 | NS | 7.1 | 12.8 | NS | 13.3 | 23.4 | NS |
| Chen 2011(Asian, adenocarcinoma) | 35 | 37 | NS | 5.3 | 8.3 | 0.04 | ‐ | ‐ | ‐ |
| Chen 2011 (EGFR mutation positive subgroup) | ‐ | ‐ | ‐ | 7.6 | 14.4 | 0.0061 | ‐ | ‐ | ‐ |
| 9. Gefitinib + chemotherapy versus chemotherapy | 250 mg + Chemo | Chemo | P | 250 mg + Chemo | Chemo | P | 250 mg + Chemo | Chemo | P |
| 1st line | |||||||||
| Giaccone 2004 | 51.2 | 47.2 | NS | 5.8 | 6 | NS | 9.9 | 10.9 | NS |
| Herbst 2004 | 30.4 | 28.7 | NS | 5.3 | 5 | NS | 9.8 | 9.9 | NS |
| Takeda 2010 (Asian) | 34.2 | 29.3 | NS | 4.3 | 4.6 | < 0.001 | 12.9 | 13.7 | NS |
| Yu 2014 (Asian) | 47.4 | 50 | NS | 7.9 | 7 | NS | 25.4 | 20.5 | NS |
| 2nd line | |||||||||
| Soria 2015 IMPRESS (EGFR mutation positive) | 32 | 34 | NS | 5.4 | 5.4 | NS | 14.8 | 17.2 | NS |
| Chemo: chemotherapy | |||||||||
| Outcome or subgroup title | No. of studies | No. of participants | Statistical method | Effect size |
| 1 HR Overall survival Show forest plot | 4 | Hazard Ratio (Random, 95% CI) | Subtotals only | |
| 1.1 G(250) vs P = 1st line | 1 | Hazard Ratio (Random, 95% CI) | 0.84 [0.62, 1.14] | |
| 1.2 G(250) vs P = 2nd line | 1 | Hazard Ratio (Random, 95% CI) | 0.89 [0.79, 1.01] | |
| 1.3 G(500) vs P = Maintenance | 2 | Hazard Ratio (Random, 95% CI) | 1.14 [0.61, 2.14] | |
| 2 HR Progression‐free survival Show forest plot | 4 | Hazard Ratio (Random, 95% CI) | Subtotals only | |
| 2.1 G(250) vs P = 1st line | 1 | Hazard Ratio (Random, 95% CI) | 0.82 [0.60, 1.12] | |
| 2.2 G(250) vs P = 2nd line | 1 | Hazard Ratio (Random, 95% CI) | 0.82 [0.75, 0.90] | |
| 2.3 G(500) vs P = Maintenance | 2 | Hazard Ratio (Random, 95% CI) | 0.70 [0.53, 0.91] | |
| 3 1‐year survival rate Show forest plot | 2 | Risk Ratio (M‐H, Fixed, 95% CI) | Subtotals only | |
| 3.1 G(250) vs P = 2nd line | 1 | 1439 | Risk Ratio (M‐H, Fixed, 95% CI) | 1.28 [1.05, 1.57] |
| 3.2 G(500) vs P = Maintenance | 1 | 243 | Risk Ratio (M‐H, Fixed, 95% CI) | 0.90 [0.78, 1.04] |
| 4 Skin rash Show forest plot | 3 | 2060 | Risk Ratio (M‐H, Fixed, 95% CI) | 7.92 [1.46, 43.03] |
| 4.1 G(250) vs P = 1st line | 1 | 201 | Risk Ratio (M‐H, Fixed, 95% CI) | 0.0 [0.0, 0.0] |
| 4.2 G(250) vs P = 2nd line | 1 | 1688 | Risk Ratio (M‐H, Fixed, 95% CI) | 8.98 [1.20, 67.13] |
| 4.3 G(250) vs P = Maintenance | 1 | 171 | Risk Ratio (M‐H, Fixed, 95% CI) | 5.06 [0.25, 103.82] |
| 5 Pruritus Show forest plot | 2 | 1889 | Risk Ratio (M‐H, Fixed, 95% CI) | 2.00 [0.22, 17.82] |
| 5.1 G(250) vs P = 1st line | 1 | 201 | Risk Ratio (M‐H, Fixed, 95% CI) | 0.0 [0.0, 0.0] |
| 5.2 G(250) vs P = 2nd line | 1 | 1688 | Risk Ratio (M‐H, Fixed, 95% CI) | 2.00 [0.22, 17.82] |
| 6 Diarrhoea Show forest plot | 3 | 2060 | Risk Ratio (M‐H, Fixed, 95% CI) | 2.48 [1.15, 5.35] |
| 6.1 G(250) vs P = 1st line | 1 | 201 | Risk Ratio (M‐H, Fixed, 95% CI) | 1.01 [0.21, 4.89] |
| 6.2 G(250) vs P = 2nd line | 1 | 1688 | Risk Ratio (M‐H, Fixed, 95% CI) | 3.09 [1.21, 7.91] |
| 6.3 G(250) vs P = Maintenance | 1 | 171 | Risk Ratio (M‐H, Fixed, 95% CI) | 3.03 [0.13, 73.47] |
| 7 Constipation Show forest plot | 1 | 201 | Risk Ratio (M‐H, Fixed, 95% CI) | 1.01 [0.06, 15.93] |
| 7.1 G(250) vs P = 1st line | 1 | 201 | Risk Ratio (M‐H, Fixed, 95% CI) | 1.01 [0.06, 15.93] |
| 8 Nausea Show forest plot | 2 | 1889 | Risk Ratio (M‐H, Random, 95% CI) | 0.65 [0.03, 12.44] |
| 8.1 G(250) vs P = 1st line | 1 | 201 | Risk Ratio (M‐H, Random, 95% CI) | 0.11 [0.01, 2.06] |
| 8.2 G(250) vs P = 2nd line | 1 | 1688 | Risk Ratio (M‐H, Random, 95% CI) | 2.25 [0.49, 10.36] |
| 9 Vomiting Show forest plot | 2 | 1859 | Risk Ratio (M‐H, Fixed, 95% CI) | 3.21 [0.83, 12.38] |
| 9.1 G(250) vs P = 2nd line | 1 | 1688 | Risk Ratio (M‐H, Fixed, 95% CI) | 3.24 [0.73, 14.33] |
| 9.2 G(250) vs P = Maintenance | 1 | 171 | Risk Ratio (M‐H, Fixed, 95% CI) | 3.03 [0.13, 73.47] |
| 10 Anorexia Show forest plot | 3 | 2060 | Risk Ratio (M‐H, Fixed, 95% CI) | 1.22 [0.64, 2.33] |
| 10.1 G(250) vs P = 1st line | 1 | 201 | Risk Ratio (M‐H, Fixed, 95% CI) | 5.05 [0.25, 103.87] |
| 10.2 G(250) vs P = 2nd line | 1 | 1688 | Risk Ratio (M‐H, Fixed, 95% CI) | 1.18 [0.59, 2.37] |
| 10.3 G(250) vs P = Maintenance | 1 | 171 | Risk Ratio (M‐H, Fixed, 95% CI) | 0.34 [0.01, 8.16] |
| 11 Fatigue Show forest plot | 2 | Risk Ratio (M‐H, Fixed, 95% CI) | Subtotals only | |
| 11.1 G(250) vs P = 1st line | 1 | 201 | Risk Ratio (M‐H, Fixed, 95% CI) | 0.76 [0.27, 2.10] |
| 11.2 G(250) vs P = Maintenance | 1 | 171 | Risk Ratio (M‐H, Fixed, 95% CI) | 4.05 [0.46, 35.47] |
| 12 Asthenia Show forest plot | 1 | Risk Ratio (M‐H, Fixed, 95% CI) | Subtotals only | |
| 12.1 G(250) vs P = 2nd line | 1 | 1688 | Risk Ratio (M‐H, Fixed, 95% CI) | 1.20 [0.66, 2.17] |
| 13 Respiratory tract infection Show forest plot | 2 | 1889 | Risk Ratio (M‐H, Random, 95% CI) | 0.53 [0.07, 3.83] |
| 13.1 G(250) vs P = 1st line | 1 | 201 | Risk Ratio (M‐H, Random, 95% CI) | 0.11 [0.01, 2.06] |
| 13.2 G(250) vs P = 2nd line | 1 | 1688 | Risk Ratio (M‐H, Random, 95% CI) | 1.00 [0.54, 1.84] |
| 14 Dyspnoea Show forest plot | 3 | 2060 | Risk Ratio (M‐H, Random, 95% CI) | 0.98 [0.59, 1.63] |
| 14.1 G(250) vs P = 1st line | 1 | 201 | Risk Ratio (M‐H, Random, 95% CI) | 1.85 [0.71, 4.81] |
| 14.2 G(250) vs P = 2nd line | 1 | 1688 | Risk Ratio (M‐H, Random, 95% CI) | 0.83 [0.49, 1.42] |
| 14.3 G(250) vs P = Maintenance | 1 | 171 | Risk Ratio (M‐H, Random, 95% CI) | 0.67 [0.20, 2.31] |
| 15 Anaemia Show forest plot | 1 | 201 | Risk Ratio (M‐H, Fixed, 95% CI) | 7.07 [0.37, 135.12] |
| 15.1 G(250) vs P = 1st line | 1 | 201 | Risk Ratio (M‐H, Fixed, 95% CI) | 7.07 [0.37, 135.12] |
| 16 Abdominal pain Show forest plot | 1 | 201 | Risk Ratio (M‐H, Fixed, 95% CI) | 0.51 [0.05, 5.48] |
| 16.1 G(250) vs P = 1st line | 1 | 201 | Risk Ratio (M‐H, Fixed, 95% CI) | 0.51 [0.05, 5.48] |
| 17 Increased ALT Show forest plot | 1 | 171 | Risk Ratio (M‐H, Fixed, 95% CI) | 9.11 [1.18, 70.32] |
| 17.1 G(250) vs P = Maintenance | 1 | 171 | Risk Ratio (M‐H, Fixed, 95% CI) | 9.11 [1.18, 70.32] |
| 18 Increased AST Show forest plot | 1 | 171 | Risk Ratio (M‐H, Fixed, 95% CI) | 7.08 [0.89, 56.34] |
| 18.1 G(250) vs P = Maintenance | 1 | 171 | Risk Ratio (M‐H, Fixed, 95% CI) | 7.08 [0.89, 56.34] |
| 19 Neutropenia Show forest plot | 1 | 171 | Risk Ratio (M‐H, Fixed, 95% CI) | 3.03 [0.13, 73.47] |
| 19.1 G(250) vs P = Maintenance | 1 | 171 | Risk Ratio (M‐H, Fixed, 95% CI) | 3.03 [0.13, 73.47] |
| 20 Anaemia Show forest plot | 1 | 171 | Risk Ratio (M‐H, Fixed, 95% CI) | 0.20 [0.01, 4.15] |
| 20.1 G(250) vs P = Maintenance | 1 | 171 | Risk Ratio (M‐H, Fixed, 95% CI) | 0.20 [0.01, 4.15] |
| 21 Thrombocytopaenia Show forest plot | 1 | 171 | Risk Ratio (M‐H, Fixed, 95% CI) | 3.03 [0.13, 73.47] |
| 21.1 G(250) vs P = Maintenance | 1 | 171 | Risk Ratio (M‐H, Fixed, 95% CI) | 3.03 [0.13, 73.47] |
| 22 Overall response rate Show forest plot | 3 | Risk Ratio (M‐H, Fixed, 95% CI) | Subtotals only | |
| 22.1 G(250) vs P = 1st line | 1 | 201 | Risk Ratio (M‐H, Fixed, 95% CI) | 6.06 [0.74, 49.43] |
| 22.2 G(250) vs P= 2nd line | 1 | 1439 | Risk Ratio (M‐H, Fixed, 95% CI) | 6.42 [2.82, 14.64] |
| 22.3 G(250) vs P = Maintenance | 1 | 173 | Risk Ratio (M‐H, Fixed, 95% CI) | 10.12 [1.32, 77.33] |
| 23 Disease control rate Show forest plot | 3 | Risk Ratio (M‐H, Fixed, 95% CI) | Subtotals only | |
| 23.1 G(250) vs P = 1st line | 1 | 201 | Risk Ratio (M‐H, Fixed, 95% CI) | 1.36 [0.86, 2.16] |
| 23.2 G(250) vs P = 2nd line | 1 | 1439 | Risk Ratio (M‐H, Fixed, 95% CI) | 1.24 [1.06, 1.44] |
| 23.3 G(250) vs P = Maintenance | 1 | 173 | Risk Ratio (M‐H, Fixed, 95% CI) | 1.21 [1.00, 1.46] |
| Outcome or subgroup title | No. of studies | No. of participants | Statistical method | Effect size |
| 1 HR Overall survival Show forest plot | 2 | Hazard Ratio (Fixed, 95% CI) | Subtotals only | |
| 1.1 G(250) vs P = 2nd line | 1 | Hazard Ratio (Fixed, 95% CI) | 0.66 [0.48, 0.91] | |
| 1.2 G(250) vs P = Maintenance | 1 | Hazard Ratio (Fixed, 95% CI) | 0.88 [0.68, 1.14] | |
| 2 HR Progression‐free survival Show forest plot | 2 | Hazard Ratio (Fixed, 95% CI) | Subtotals only | |
| 2.1 G(250) vs P = 2nd line | 1 | Hazard Ratio (Fixed, 95% CI) | 0.69 [0.52, 0.91] | |
| 2.2 G(250) vs P = Maintenance | 1 | Hazard Ratio (Fixed, 95% CI) | 0.42 [0.33, 0.54] | |
| 3 1‐year survival rate Show forest plot | 1 | Risk Ratio (M‐H, Fixed, 95% CI) | Subtotals only | |
| 3.1 G(250) vs P = 2nd line | 1 | 342 | Risk Ratio (M‐H, Fixed, 95% CI) | 1.75 [1.20, 2.55] |
| 4 Overall response rate Show forest plot | 2 | Risk Ratio (M‐H, Random, 95% CI) | Subtotals only | |
| 4.1 G(250) vs P = 2nd line | 1 | 306 | Risk Ratio (M‐H, Random, 95% CI) | 6.03 [1.46, 24.91] |
| 4.2 G(250) vs P = Maintenance | 1 | 296 | Risk Ratio (M‐H, Random, 95% CI) | 35.00 [4.86, 252.15] |
| Outcome or subgroup title | No. of studies | No. of participants | Statistical method | Effect size |
| 1 HR Overall survival Show forest plot | 1 | Hazard Ratio (Fixed, 95% CI) | Subtotals only | |
| 1.1 G(250) vs P = Maintenance | 1 | Hazard Ratio (Fixed, 95% CI) | 0.39 [0.15, 0.98] | |
| 2 HR Progression‐free survival Show forest plot | 1 | Hazard Ratio (Fixed, 95% CI) | Subtotals only | |
| 2.1 G(250) vs P = Maintenance | 1 | Hazard Ratio (Fixed, 95% CI) | 0.17 [0.07, 0.41] | |
| Outcome or subgroup title | No. of studies | No. of participants | Statistical method | Effect size |
| 1 HR Overall survival Show forest plot | 2 | Hazard Ratio (Fixed, 95% CI) | Subtotals only | |
| 1.1 G vs vinorelbine = 1st line | 1 | Hazard Ratio (Fixed, 95% CI) | 0.98 [0.66, 1.46] | |
| 1.2 G vs docetaxel = 2nd line | 1 | Hazard Ratio (Fixed, 95% CI) | 1.02 [0.91, 1.15] | |
| 2 HR Progression‐free survival Show forest plot | 2 | Hazard Ratio (Fixed, 95% CI) | Subtotals only | |
| 2.1 G vs vinorelbine = 1st line | 1 | Hazard Ratio (Fixed, 95% CI) | 1.19 [0.86, 1.65] | |
| 2.2 G vs docetaxel = 2nd line | 1 | Hazard Ratio (Fixed, 95% CI) | 1.04 [0.92, 1.17] | |
| 3 1‐year survival rate Show forest plot | 3 | 1741 | Risk Ratio (M‐H, Fixed, 95% CI) | 0.94 [0.82, 1.08] |
| 3.1 G vs vinorelbine = 1st line | 1 | 190 | Risk Ratio (M‐H, Fixed, 95% CI) | 1.02 [0.69, 1.52] |
| 3.2 G vs docetaxel = 1st line | 1 | 85 | Risk Ratio (M‐H, Fixed, 95% CI) | 0.39 [0.08, 1.90] |
| 3.3 G vs docetaxel = 2nd line | 1 | 1466 | Risk Ratio (M‐H, Fixed, 95% CI) | 0.94 [0.82, 1.09] |
| 4 Skin rash Show forest plot | 4 | 1858 | Risk Ratio (M‐H, Fixed, 95% CI) | 2.40 [1.08, 5.31] |
| 4.1 G vs vinorelbine = 1st line | 1 | 190 | Risk Ratio (M‐H, Fixed, 95% CI) | 5.11 [0.25, 104.94] |
| 4.2 G vs docetaxel = 1st line | 1 | 85 | Risk Ratio (M‐H, Fixed, 95% CI) | 0.49 [0.05, 5.19] |
| 4.3 G vs docetaxel = 2nd line | 2 | 1583 | Risk Ratio (M‐H, Fixed, 95% CI) | 2.82 [1.11, 7.13] |
| 5 Constipation Show forest plot | 3 | 1719 | Risk Ratio (M‐H, Fixed, 95% CI) | 0.41 [0.17, 0.97] |
| 5.1 G vs vinorelbine = 1st line | 1 | 190 | Risk Ratio (M‐H, Fixed, 95% CI) | 0.20 [0.01, 4.20] |
| 5.2 G vs docetaxel = 1st line | 1 | 85 | Risk Ratio (M‐H, Fixed, 95% CI) | 0.33 [0.01, 7.78] |
| 5.3 G vs docetaxel = 2nd line | 1 | 1444 | Risk Ratio (M‐H, Fixed, 95% CI) | 0.45 [0.17, 1.18] |
| 6 Fatigue Show forest plot | 2 | 275 | Risk Ratio (M‐H, Fixed, 95% CI) | 0.16 [0.03, 0.88] |
| 6.1 G vs vinorelbine = 1st line | 1 | 190 | Risk Ratio (M‐H, Fixed, 95% CI) | 0.07 [0.00, 1.18] |
| 6.2 G vs docetaxel = 1st line | 1 | 85 | Risk Ratio (M‐H, Fixed, 95% CI) | 0.49 [0.05, 5.19] |
| 7 Asthenia Show forest plot | 3 | 1773 | Risk Ratio (M‐H, Fixed, 95% CI) | 0.51 [0.35, 0.75] |
| 7.1 G vs vinorelbine = 1st line | 1 | 190 | Risk Ratio (M‐H, Fixed, 95% CI) | 0.15 [0.01, 2.79] |
| 7.2 G vs docetaxel = 2nd line | 2 | 1583 | Risk Ratio (M‐H, Fixed, 95% CI) | 0.53 [0.36, 0.78] |
| 8 Neurotoxicity Show forest plot | 2 | 1529 | Risk Ratio (M‐H, Fixed, 95% CI) | 0.07 [0.01, 0.34] |
| 8.1 G vs docetaxel = 1st line | 1 | 85 | Risk Ratio (M‐H, Fixed, 95% CI) | 0.09 [0.01, 1.56] |
| 8.2 G vs docetaxel = 2nd line | 1 | 1444 | Risk Ratio (M‐H, Fixed, 95% CI) | 0.06 [0.01, 0.43] |
| 9 Neutropenia Show forest plot | 4 | 1857 | Risk Ratio (M‐H, Fixed, 95% CI) | 0.04 [0.02, 0.06] |
| 9.1 G vs vinorelbine = 1st line | 1 | 190 | Risk Ratio (M‐H, Fixed, 95% CI) | 0.03 [0.00, 0.43] |
| 9.2 G vs docetaxel = 1st line | 1 | 85 | Risk Ratio (M‐H, Fixed, 95% CI) | 0.15 [0.04, 0.63] |
| 9.3 G vs docetaxel = 2nd line | 2 | 1582 | Risk Ratio (M‐H, Fixed, 95% CI) | 0.04 [0.02, 0.06] |
| 10 Leukopenia Show forest plot | 2 | 324 | Risk Ratio (M‐H, Fixed, 95% CI) | 0.03 [0.00, 0.22] |
| 10.1 G vs vinorelbine = 1st line | 1 | 190 | Risk Ratio (M‐H, Fixed, 95% CI) | 0.07 [0.00, 1.18] |
| 10.2 G vs docetaxel = 2nd line | 1 | 134 | Risk Ratio (M‐H, Fixed, 95% CI) | 0.02 [0.00, 0.32] |
| 11 Febrile neutropenia Show forest plot | 3 | 1768 | Risk Ratio (M‐H, Fixed, 95% CI) | 0.12 [0.06, 0.23] |
| 11.1 G vs vinorelbine = 1st line | 1 | 190 | Risk Ratio (M‐H, Fixed, 95% CI) | 0.07 [0.00, 1.18] |
| 11.2 G vs docetaxel = 2nd line | 2 | 1578 | Risk Ratio (M‐H, Fixed, 95% CI) | 0.13 [0.06, 0.24] |
| 12 Pruritus Show forest plot | 1 | 139 | Risk Ratio (M‐H, Fixed, 95% CI) | 5.22 [0.26, 106.74] |
| 12.1 G vs docetaxel = 2nd line | 1 | 139 | Risk Ratio (M‐H, Fixed, 95% CI) | 5.22 [0.26, 106.74] |
| 13 Diarrhoea Show forest plot | 4 | 1858 | Risk Ratio (M‐H, Fixed, 95% CI) | 0.81 [0.48, 1.34] |
| 13.1 G vs vinorelbine = 1st line | 1 | 190 | Risk Ratio (M‐H, Fixed, 95% CI) | 1.02 [0.26, 3.96] |
| 13.2 G vs docetaxel = 1st line | 1 | 85 | Risk Ratio (M‐H, Fixed, 95% CI) | 0.98 [0.14, 6.62] |
| 13.3 G vs docetaxel = 2nd line | 2 | 1583 | Risk Ratio (M‐H, Fixed, 95% CI) | 0.76 [0.43, 1.35] |
| 14 Vomiting Show forest plot | 2 | 1583 | Risk Ratio (M‐H, Fixed, 95% CI) | 0.55 [0.19, 1.63] |
| 14.1 G vs docetaxel = 2nd line | 2 | 1583 | Risk Ratio (M‐H, Fixed, 95% CI) | 0.55 [0.19, 1.63] |
| 15 Anorexia Show forest plot | 3 | 1719 | Risk Ratio (M‐H, Fixed, 95% CI) | 1.43 [0.61, 3.32] |
| 15.1 G vs vinorelbine = 1st line | 1 | 190 | Risk Ratio (M‐H, Fixed, 95% CI) | 1.02 [0.15, 7.10] |
| 15.2 G vs docetaxel = 1st line | 1 | 85 | Risk Ratio (M‐H, Fixed, 95% CI) | 0.0 [0.0, 0.0] |
| 15.3 G vs docetaxel = 2nd line | 1 | 1444 | Risk Ratio (M‐H, Fixed, 95% CI) | 1.54 [0.60, 3.95] |
| 16 Stomatitis Show forest plot | 1 | 1444 | Risk Ratio (M‐H, Fixed, 95% CI) | 0.14 [0.01, 2.71] |
| 16.1 G vs docetaxel = 2nd line | 1 | 1444 | Risk Ratio (M‐H, Fixed, 95% CI) | 0.14 [0.01, 2.71] |
| 17 Arthralgia/myalgia Show forest plot | 2 | 1529 | Risk Ratio (M‐H, Fixed, 95% CI) | 0.25 [0.03, 2.19] |
| 17.1 G vs docetaxel = 1st line | 1 | 85 | Risk Ratio (M‐H, Fixed, 95% CI) | 0.0 [0.0, 0.0] |
| 17.2 G vs docetaxel = 2nd line | 1 | 1444 | Risk Ratio (M‐H, Fixed, 95% CI) | 0.25 [0.03, 2.19] |
| 18 Peripheral oedema Show forest plot | 2 | 1634 | Risk Ratio (M‐H, Fixed, 95% CI) | 0.09 [0.00, 1.61] |
| 18.1 G vs vinorelbine = 1st line | 1 | 190 | Risk Ratio (M‐H, Fixed, 95% CI) | 0.0 [0.0, 0.0] |
| 18.2 G vs docetaxel = 2nd line | 1 | 1444 | Risk Ratio (M‐H, Fixed, 95% CI) | 0.09 [0.00, 1.61] |
| 19 Respiratory tract infection Show forest plot | 1 | 1444 | Risk Ratio (M‐H, Fixed, 95% CI) | 0.90 [0.52, 1.57] |
| 19.1 G vs docetaxel = 2nd line | 1 | 1444 | Risk Ratio (M‐H, Fixed, 95% CI) | 0.90 [0.52, 1.57] |
| 20 Dyspnoea Show forest plot | 3 | 1773 | Risk Ratio (M‐H, Fixed, 95% CI) | 0.82 [0.57, 1.16] |
| 20.1 G vs vinorelbine = 1st line | 1 | 190 | Risk Ratio (M‐H, Fixed, 95% CI) | 0.26 [0.03, 2.24] |
| 20.2 G vs docetaxel = 2nd line | 2 | 1583 | Risk Ratio (M‐H, Fixed, 95% CI) | 0.85 [0.59, 1.22] |
| 21 Cough Show forest plot | 2 | 1583 | Risk Ratio (M‐H, Fixed, 95% CI) | 1.18 [0.36, 3.84] |
| 21.1 G vs docetaxel = 2nd line | 2 | 1583 | Risk Ratio (M‐H, Fixed, 95% CI) | 1.18 [0.36, 3.84] |
| 22 Anaemia Show forest plot | 4 | 1853 | Risk Ratio (M‐H, Fixed, 95% CI) | 0.70 [0.36, 1.36] |
| 22.1 G vs vinorelbine = 1st line | 1 | 190 | Risk Ratio (M‐H, Fixed, 95% CI) | 0.34 [0.01, 8.25] |
| 22.2 G vs docetaxel = 1st line | 1 | 85 | Risk Ratio (M‐H, Fixed, 95% CI) | 0.14 [0.01, 2.62] |
| 22.3 G vs docetaxel = 2nd line | 2 | 1578 | Risk Ratio (M‐H, Fixed, 95% CI) | 0.86 [0.42, 1.75] |
| 23 Thrombocytopenia Show forest plot | 2 | 219 | Risk Ratio (M‐H, Fixed, 95% CI) | 3.0 [0.12, 72.35] |
| 23.1 G vs docetaxel = 1st line | 1 | 85 | Risk Ratio (M‐H, Fixed, 95% CI) | 0.0 [0.0, 0.0] |
| 23.2 G vs docetaxel = 2nd line | 1 | 134 | Risk Ratio (M‐H, Fixed, 95% CI) | 3.0 [0.12, 72.35] |
| 24 Hypokalaemia Show forest plot | 1 | 190 | Risk Ratio (M‐H, Fixed, 95% CI) | 1.02 [0.06, 16.09] |
| 24.1 G vs vinorelbine = 1st line | 1 | 190 | Risk Ratio (M‐H, Fixed, 95% CI) | 1.02 [0.06, 16.09] |
| 25 Pyrexia Show forest plot | 3 | 1773 | Risk Ratio (M‐H, Fixed, 95% CI) | 0.59 [0.14, 2.47] |
| 25.1 G vs vinorelbine = 1st line | 1 | 190 | Risk Ratio (M‐H, Fixed, 95% CI) | 1.02 [0.06, 16.09] |
| 25.2 G vs docetaxel = 2nd line | 2 | 1583 | Risk Ratio (M‐H, Fixed, 95% CI) | 0.49 [0.09, 2.67] |
| 26 Overall response rate Show forest plot | 2 | Risk Ratio (M‐H, Fixed, 95% CI) | Subtotals only | |
| 26.1 G vs docetaxel = 2nd line | 2 | 1607 | Risk Ratio (M‐H, Fixed, 95% CI) | 1.16 [0.85, 1.59] |
| 27 Disease control rate Show forest plot | 2 | Risk Ratio (M‐H, Fixed, 95% CI) | Subtotals only | |
| 27.1 G vs docetaxel = 1st line | 1 | 190 | Risk Ratio (M‐H, Fixed, 95% CI) | 0.82 [0.61, 1.10] |
| 27.2 G vs docetaxel = 2nd line | 1 | 141 | Risk Ratio (M‐H, Fixed, 95% CI) | 1.07 [0.82, 1.40] |
| 28 FACT‐L QOL improvement rate Show forest plot | 2 | 1656 | Mean Difference (IV, Fixed, 95% CI) | 10.50 [9.55, 11.45] |
| 28.1 G vs vinorelbine = 1st line | 1 | 190 | Mean Difference (IV, Fixed, 95% CI) | 13.4 [8.25, 18.55] |
| 28.2 G vs docetaxel = 2nd line | 1 | 1466 | Mean Difference (IV, Fixed, 95% CI) | 10.40 [9.43, 11.37] |
| 29 LCS QOL improvement rate Show forest plot | 2 | 1656 | Mean Difference (IV, Fixed, 95% CI) | 3.63 [3.08, 4.19] |
| 29.1 G vs vinorelbine = 1st line | 1 | 190 | Mean Difference (IV, Fixed, 95% CI) | 3.80 [2.42, 5.18] |
| 29.2 G vs docetaxel = 2nd line | 1 | 1466 | Mean Difference (IV, Fixed, 95% CI) | 3.60 [2.99, 4.21] |
| 30 TOI QOL improvement rate Show forest plot | 2 | 1656 | Mean Difference (IV, Random, 95% CI) | 9.87 [1.26, 18.48] |
| 30.1 G vs vinorelbine = 1st line | 1 | 190 | Mean Difference (IV, Random, 95% CI) | 16.60 [4.61, 28.59] |
| 30.2 G vs docetaxel = 2nd line | 1 | 1466 | Mean Difference (IV, Random, 95% CI) | 7.0 [5.97, 8.03] |
| 31 PSI QOL improvement rate Show forest plot | 1 | 190 | Mean Difference (IV, Fixed, 95% CI) | 5.60 [3.55, 7.65] |
| 31.1 G vs vinorelbine = 1st line | 1 | 190 | Mean Difference (IV, Fixed, 95% CI) | 5.60 [3.55, 7.65] |
| Outcome or subgroup title | No. of studies | No. of participants | Statistical method | Effect size |
| 1 HR Overall survival = 1st line Show forest plot | 4 | Hazard Ratio (Random, 95% CI) | 0.94 [0.82, 1.06] | |
| 1.1 G vs carboplatin + paclitaxel | 2 | Hazard Ratio (Random, 95% CI) | 1.09 [0.64, 1.84] | |
| 1.2 G vs gemcitabine + cisplatin | 1 | Hazard Ratio (Random, 95% CI) | 0.93 [0.72, 1.21] | |
| 1.3 G vs pemetrexed + cisplatin | 1 | Hazard Ratio (Random, 95% CI) | 0.94 [0.68, 1.30] | |
| 2 HR Overall survival = 2nd line Show forest plot | 3 | Hazard Ratio (Random, 95% CI) | 0.94 [0.79, 1.12] | |
| 2.1 G vs docetaxel | 2 | Hazard Ratio (Random, 95% CI) | 0.97 [0.80, 1.17] | |
| 2.2 G vs pemetrexed | 1 | Hazard Ratio (Random, 95% CI) | 0.80 [0.50, 1.28] | |
| 3 HR Overall survival = Maintenance Show forest plot | 1 | Hazard Ratio (Random, 95% CI) | 2.15 [0.83, 5.55] | |
| 3.1 G vs pemetrexed | 1 | Hazard Ratio (Random, 95% CI) | 2.15 [0.83, 5.55] | |
| 4 HR Progression‐free survival = 1st line Show forest plot | 5 | Hazard Ratio (Random, 95% CI) | 0.65 [0.43, 0.98] | |
| 4.1 G vs carboplatin + paclitaxel | 2 | Hazard Ratio (Random, 95% CI) | 0.48 [0.20, 1.15] | |
| 4.2 G vs cisplatin + docetaxel | 1 | Hazard Ratio (Random, 95% CI) | 0.49 [0.34, 0.71] | |
| 4.3 G vs gemcitabine + cisplatin | 1 | Hazard Ratio (Random, 95% CI) | 1.20 [0.95, 1.52] | |
| 4.4 G vs pemetrexed + cisplatin | 1 | Hazard Ratio (Random, 95% CI) | 0.85 [0.64, 1.14] | |
| 5 HR Progression‐free survival = 2nd line Show forest plot | 3 | Hazard Ratio (Random, 95% CI) | 0.71 [0.57, 0.88] | |
| 5.1 G vs docetaxel | 2 | Hazard Ratio (Random, 95% CI) | 0.78 [0.65, 0.94] | |
| 5.2 G vs pemetrexed | 1 | Hazard Ratio (Random, 95% CI) | 0.54 [0.37, 0.79] | |
| 6 HR Progression‐free survival = Maintenance Show forest plot | 1 | Hazard Ratio (Random, 95% CI) | 0.53 [0.27, 1.04] | |
| 6.1 G vs pemetrexed | 1 | Hazard Ratio (Random, 95% CI) | 0.53 [0.27, 1.04] | |
| 7 1‐year survival rate Show forest plot | 7 | Risk Ratio (M‐H, Fixed, 95% CI) | Subtotals only | |
| 7.1 1st line | 3 | 1754 | Risk Ratio (M‐H, Fixed, 95% CI) | 1.03 [0.97, 1.09] |
| 7.2 2nd line | 3 | 681 | Risk Ratio (M‐H, Fixed, 95% CI) | 0.94 [0.81, 1.11] |
| 7.3 Maintenance | 1 | 70 | Risk Ratio (M‐H, Fixed, 95% CI) | 0.79 [0.65, 0.98] |
| 8 Nausea Show forest plot | 10 | 2898 | Risk Ratio (M‐H, Fixed, 95% CI) | 0.34 [0.17, 0.64] |
| 8.1 1st line | 4 | 1912 | Risk Ratio (M‐H, Fixed, 95% CI) | 0.19 [0.06, 0.54] |
| 8.2 2nd line | 5 | 916 | Risk Ratio (M‐H, Fixed, 95% CI) | 0.59 [0.22, 1.60] |
| 8.3 Maintenance | 1 | 70 | Risk Ratio (M‐H, Fixed, 95% CI) | 0.53 [0.09, 2.98] |
| 9 Vomiting Show forest plot | 6 | 2447 | Risk Ratio (M‐H, Random, 95% CI) | 0.19 [0.05, 0.77] |
| 9.1 1st line | 3 | 1737 | Risk Ratio (M‐H, Random, 95% CI) | 0.08 [0.02, 0.29] |
| 9.2 2nd line | 2 | 640 | Risk Ratio (M‐H, Random, 95% CI) | 1.31 [0.30, 5.77] |
| 9.3 Maintenance | 1 | 70 | Risk Ratio (M‐H, Random, 95% CI) | 0.20 [0.02, 1.69] |
| 10 Anorexia Show forest plot | 10 | 2950 | Risk Ratio (M‐H, Fixed, 95% CI) | 0.36 [0.27, 0.49] |
| 10.1 1st line | 4 | 1964 | Risk Ratio (M‐H, Fixed, 95% CI) | 0.32 [0.23, 0.45] |
| 10.2 2nd line | 5 | 916 | Risk Ratio (M‐H, Fixed, 95% CI) | 0.53 [0.27, 1.02] |
| 10.3 Maintenance | 1 | 70 | Risk Ratio (M‐H, Fixed, 95% CI) | 0.79 [0.05, 12.20] |
| 11 Fatigue Show forest plot | 10 | 1960 | Risk Ratio (M‐H, Fixed, 95% CI) | 0.32 [0.22, 0.46] |
| 11.1 1st line | 4 | 943 | Risk Ratio (M‐H, Fixed, 95% CI) | 0.26 [0.17, 0.40] |
| 11.2 2nd line | 4 | 759 | Risk Ratio (M‐H, Fixed, 95% CI) | 0.26 [0.06, 1.03] |
| 11.3 Maintenance | 2 | 258 | Risk Ratio (M‐H, Fixed, 95% CI) | 1.09 [0.41, 2.89] |
| 12 Arthralgia/myalgia Show forest plot | 4 | 2063 | Risk Ratio (M‐H, Fixed, 95% CI) | 0.14 [0.03, 0.61] |
| 12.1 1st line | 2 | 1423 | Risk Ratio (M‐H, Fixed, 95% CI) | 0.14 [0.03, 0.61] |
| 12.2 2nd line | 2 | 640 | Risk Ratio (M‐H, Fixed, 95% CI) | 0.0 [0.0, 0.0] |
| 13 Asthenia Show forest plot | 4 | 1755 | Risk Ratio (M‐H, Fixed, 95% CI) | 0.22 [0.08, 0.58] |
| 13.1 1st line | 3 | 1598 | Risk Ratio (M‐H, Fixed, 95% CI) | 0.21 [0.07, 0.61] |
| 13.2 2nd line | 1 | 157 | Risk Ratio (M‐H, Fixed, 95% CI) | 0.31 [0.03, 2.94] |
| 14 Neurotoxicity Show forest plot | 4 | 1797 | Risk Ratio (M‐H, Fixed, 95% CI) | 0.07 [0.02, 0.24] |
| 14.1 1st line | 2 | 1505 | Risk Ratio (M‐H, Fixed, 95% CI) | 0.07 [0.02, 0.24] |
| 14.2 2nd line | 2 | 292 | Risk Ratio (M‐H, Fixed, 95% CI) | 0.0 [0.0, 0.0] |
| 15 Neutropenia Show forest plot | 10 | 3061 | Risk Ratio (M‐H, Random, 95% CI) | 0.11 [0.05, 0.27] |
| 15.1 1st line | 5 | 2139 | Risk Ratio (M‐H, Random, 95% CI) | 0.05 [0.03, 0.07] |
| 15.2 2nd line | 3 | 664 | Risk Ratio (M‐H, Random, 95% CI) | 0.12 [0.08, 0.18] |
| 15.3 Maintenance | 2 | 258 | Risk Ratio (M‐H, Random, 95% CI) | 1.20 [0.49, 2.96] |
| 16 Anaemia Show forest plot | 9 | 2538 | Risk Ratio (M‐H, Fixed, 95% CI) | 0.18 [0.12, 0.29] |
| 16.1 1st line | 5 | 2139 | Risk Ratio (M‐H, Fixed, 95% CI) | 0.16 [0.10, 0.26] |
| 16.2 2nd line | 2 | 141 | Risk Ratio (M‐H, Fixed, 95% CI) | 0.20 [0.02, 1.61] |
| 16.3 Maintenance | 2 | 258 | Risk Ratio (M‐H, Fixed, 95% CI) | 1.36 [0.24, 7.87] |
| 17 Leukopenia Show forest plot | 4 | 2086 | Risk Ratio (M‐H, Random, 95% CI) | 0.07 [0.02, 0.23] |
| 17.1 1st line | 3 | 1603 | Risk Ratio (M‐H, Random, 95% CI) | 0.04 [0.02, 0.08] |
| 17.2 2nd line | 1 | 483 | Risk Ratio (M‐H, Random, 95% CI) | 0.16 [0.09, 0.26] |
| 18 Thrombocytopenia Show forest plot | 7 | 1070 | Risk Ratio (M‐H, Fixed, 95% CI) | 0.32 [0.14, 0.72] |
| 18.1 1st line | 2 | 536 | Risk Ratio (M‐H, Fixed, 95% CI) | 0.14 [0.04, 0.51] |
| 18.2 2nd line | 3 | 276 | Risk Ratio (M‐H, Fixed, 95% CI) | 0.25 [0.03, 2.15] |
| 18.3 Maintenance | 2 | 258 | Risk Ratio (M‐H, Fixed, 95% CI) | 3.63 [0.42, 31.44] |
| 19 Febrile neutropenia Show forest plot | 2 | 1679 | Risk Ratio (M‐H, Fixed, 95% CI) | 0.09 [0.03, 0.28] |
| 19.1 1st line | 1 | 1196 | Risk Ratio (M‐H, Fixed, 95% CI) | 0.06 [0.01, 0.43] |
| 19.2 2nd line | 1 | 483 | Risk Ratio (M‐H, Fixed, 95% CI) | 0.12 [0.03, 0.49] |
| 20 Skin rash Show forest plot | 10 | 3174 | Risk Ratio (M‐H, Random, 95% CI) | 3.11 [1.28, 7.55] |
| 20.1 1st line | 5 | 2141 | Risk Ratio (M‐H, Random, 95% CI) | 5.09 [2.21, 11.72] |
| 20.2 2nd line | 3 | 775 | Risk Ratio (M‐H, Random, 95% CI) | 2.54 [0.46, 13.95] |
| 20.3 Maintenance | 2 | 258 | Risk Ratio (M‐H, Random, 95% CI) | 0.91 [0.24, 3.44] |
| 21 Diarrhoea Show forest plot | 10 | 3055 | Risk Ratio (M‐H, Fixed, 95% CI) | 2.79 [1.57, 4.94] |
| 21.1 1st line | 5 | 2139 | Risk Ratio (M‐H, Fixed, 95% CI) | 2.74 [1.43, 5.27] |
| 21.2 2nd line | 5 | 916 | Risk Ratio (M‐H, Fixed, 95% CI) | 2.93 [0.88, 9.73] |
| 22 Increased ALT Show forest plot | 7 | 1542 | Risk Ratio (M‐H, Fixed, 95% CI) | 10.03 [5.23, 19.26] |
| 22.1 1st line | 4 | 943 | Risk Ratio (M‐H, Fixed, 95% CI) | 11.66 [5.13, 26.49] |
| 22.2 2nd line | 2 | 529 | Risk Ratio (M‐H, Fixed, 95% CI) | 13.22 [3.18, 54.99] |
| 22.3 Maintenance | 1 | 70 | Risk Ratio (M‐H, Fixed, 95% CI) | 0.27 [0.01, 6.33] |
| 23 Increased AST Show forest plot | 4 | 762 | Risk Ratio (M‐H, Fixed, 95% CI) | 7.73 [2.78, 21.46] |
| 23.1 1st line | 3 | 716 | Risk Ratio (M‐H, Fixed, 95% CI) | 7.73 [2.78, 21.46] |
| 23.2 2nd line | 1 | 46 | Risk Ratio (M‐H, Fixed, 95% CI) | 0.0 [0.0, 0.0] |
| 24 Overall response rate Show forest plot | 14 | Risk Ratio (M‐H, Random, 95% CI) | Subtotals only | |
| 24.1 1st line | 6 | 2158 | Risk Ratio (M‐H, Random, 95% CI) | 1.43 [1.13, 1.82] |
| 24.2 2nd line | 6 | 921 | Risk Ratio (M‐H, Random, 95% CI) | 1.43 [0.92, 2.22] |
| 24.3 Maintenance | 2 | 258 | Risk Ratio (M‐H, Random, 95% CI) | 0.88 [0.41, 1.87] |
| 25 Stable disease Show forest plot | 9 | Risk Ratio (M‐H, Random, 95% CI) | Subtotals only | |
| 25.1 1st line | 5 | 941 | Risk Ratio (M‐H, Random, 95% CI) | 0.47 [0.34, 0.64] |
| 25.2 2nd line | 2 | 143 | Risk Ratio (M‐H, Random, 95% CI) | 1.08 [0.64, 1.82] |
| 25.3 Maintenance | 2 | 258 | Risk Ratio (M‐H, Random, 95% CI) | 0.64 [0.44, 0.93] |
| 26 Disease control rate Show forest plot | 9 | Risk Ratio (M‐H, Random, 95% CI) | Subtotals only | |
| 26.1 1st line | 5 | 1848 | Risk Ratio (M‐H, Random, 95% CI) | 0.99 [0.86, 1.13] |
| 26.2 2nd line | 3 | 528 | Risk Ratio (M‐H, Random, 95% CI) | 0.99 [0.78, 1.25] |
| 26.3 Maintenance | 1 | 188 | Risk Ratio (M‐H, Random, 95% CI) | 0.65 [0.49, 0.85] |
| 27 FACT‐L QOL improvement rate Show forest plot | 3 | 1670 | Mean Difference (IV, Fixed, 95% CI) | 9.50 [7.95, 11.05] |
| 27.1 1st line | 1 | 1151 | Mean Difference (IV, Fixed, 95% CI) | 0.0 [0.0, 0.0] |
| 27.2 2nd line | 2 | 519 | Mean Difference (IV, Fixed, 95% CI) | 9.50 [7.95, 11.05] |
| 28 LCS QOL improvement rate Show forest plot | 3 | 1748 | Mean Difference (IV, Fixed, 95% CI) | 2.30 [1.53, 3.07] |
| 28.1 1st line | 1 | 1151 | Mean Difference (IV, Fixed, 95% CI) | 0.0 [0.0, 0.0] |
| 28.2 2nd line | 2 | 597 | Mean Difference (IV, Fixed, 95% CI) | 2.30 [1.53, 3.07] |
| 29 TOI QOL improvement rate Show forest plot | 3 | 1670 | Mean Difference (IV, Fixed, 95% CI) | 11.8 [9.17, 14.43] |
| 29.1 1st line | 1 | 1151 | Mean Difference (IV, Fixed, 95% CI) | 0.0 [0.0, 0.0] |
| 29.2 2nd line | 2 | 519 | Mean Difference (IV, Fixed, 95% CI) | 11.8 [9.17, 14.43] |
| Outcome or subgroup title | No. of studies | No. of participants | Statistical method | Effect size |
| 1 HR Overall survival = 1st line Show forest plot | 5 | Hazard Ratio (Fixed, 95% CI) | 0.97 [0.77, 1.21] | |
| 1.1 Biomarker driven selection | 2 | Hazard Ratio (Fixed, 95% CI) | 0.98 [0.72, 1.33] | |
| 1.2 Clinical feature driven selection | 3 | Hazard Ratio (Fixed, 95% CI) | 0.95 [0.68, 1.33] | |
| 2 HR Overall survival = 2nd line Show forest plot | 1 | Hazard Ratio (Fixed, 95% CI) | 0.83 [0.41, 1.66] | |
| 2.1 G vs docetaxel | 1 | Hazard Ratio (Fixed, 95% CI) | 0.83 [0.41, 1.66] | |
| 3 HR Progression‐free survival = 1st line Show forest plot | 5 | Hazard Ratio (Random, 95% CI) | 0.47 [0.36, 0.61] | |
| 3.1 Biomarker driven selection | 2 | Hazard Ratio (Random, 95% CI) | 0.39 [0.26, 0.59] | |
| 3.2 Clinical feature driven selection | 3 | Hazard Ratio (Random, 95% CI) | 0.53 [0.41, 0.70] | |
| 4 HR Progression‐free survival = 2nd line Show forest plot | 2 | Hazard Ratio (Fixed, 95% CI) | 0.24 [0.12, 0.47] | |
| 4.1 G vs docetaxel | 1 | Hazard Ratio (Fixed, 95% CI) | 0.16 [0.05, 0.50] | |
| 4.2 G vs pemetrexed | 1 | Hazard Ratio (Fixed, 95% CI) | 0.30 [0.13, 0.70] | |
| 5 Overall response rate Show forest plot | 7 | 758 | Risk Ratio (M‐H, Random, 95% CI) | 1.71 [1.34, 2.19] |
| 5.1 First‐line biomarker driven selection | 2 | 347 | Risk Ratio (M‐H, Random, 95% CI) | 2.23 [1.75, 2.85] |
| 5.2 First‐line, clinical feature driven selection | 3 | 353 | Risk Ratio (M‐H, Random, 95% CI) | 1.45 [1.05, 1.99] |
| 5.3 2nd line | 2 | 58 | Risk Ratio (M‐H, Random, 95% CI) | 1.65 [0.88, 3.09] |
| 6 Stable disease Show forest plot | 3 | 397 | Risk Ratio (M‐H, Random, 95% CI) | 0.52 [0.28, 0.97] |
| 6.1 First‐line, biomarker driven selection | 2 | 347 | Risk Ratio (M‐H, Random, 95% CI) | 0.47 [0.22, 0.98] |
| 6.2 First‐line, clinical feature driven selection | 1 | 50 | Risk Ratio (M‐H, Random, 95% CI) | 0.87 [0.26, 2.85] |
| 7 Disease control rate Show forest plot | 5 | 2001 | Risk Ratio (M‐H, Random, 95% CI) | 1.05 [0.93, 1.19] |
| 7.1 First‐line, biomarker driven selection | 2 | 347 | Risk Ratio (M‐H, Random, 95% CI) | 1.15 [1.05, 1.26] |
| 7.2 First‐line, clinical feature driven selection | 2 | 1267 | Risk Ratio (M‐H, Random, 95% CI) | 0.93 [0.87, 0.99] |
| 7.3 Second‐line | 1 | 387 | Risk Ratio (M‐H, Random, 95% CI) | 1.03 [0.77, 1.36] |
| Outcome or subgroup title | No. of studies | No. of participants | Statistical method | Effect size |
| 1 1‐year survival rate Show forest plot | 2 | 424 | Risk Ratio (M‐H, Fixed, 95% CI) | 0.83 [0.61, 1.11] |
| 1.1 2nd line | 2 | 424 | Risk Ratio (M‐H, Fixed, 95% CI) | 0.83 [0.61, 1.11] |
| 2 Skin rash Show forest plot | 2 | 290 | Risk Ratio (M‐H, Fixed, 95% CI) | 8.13 [1.51, 43.72] |
| 2.1 2nd line | 1 | 209 | Risk Ratio (M‐H, Fixed, 95% CI) | 6.80 [0.85, 54.32] |
| 2.2 Maintenance | 1 | 81 | Risk Ratio (M‐H, Fixed, 95% CI) | 10.41 [0.61, 176.21] |
| 3 Acne Show forest plot | 1 | 209 | Risk Ratio (M‐H, Fixed, 95% CI) | 4.86 [0.24, 100.02] |
| 3.1 2nd line | 1 | 209 | Risk Ratio (M‐H, Fixed, 95% CI) | 4.86 [0.24, 100.02] |
| 4 Pruritus Show forest plot | 1 | 209 | Risk Ratio (M‐H, Fixed, 95% CI) | 2.92 [0.12, 70.77] |
| 4.1 2nd line | 1 | 209 | Risk Ratio (M‐H, Fixed, 95% CI) | 2.92 [0.12, 70.77] |
| 5 Diarrhoea Show forest plot | 3 | 521 | Risk Ratio (M‐H, Fixed, 95% CI) | 8.36 [1.58, 44.34] |
| 5.1 2nd line | 3 | 521 | Risk Ratio (M‐H, Fixed, 95% CI) | 8.36 [1.58, 44.34] |
| 6 Nausea Show forest plot | 1 | 209 | Risk Ratio (M‐H, Fixed, 95% CI) | 0.97 [0.06, 15.33] |
| 6.1 2nd line | 1 | 209 | Risk Ratio (M‐H, Fixed, 95% CI) | 0.97 [0.06, 15.33] |
| 7 Vomiting Show forest plot | 1 | 209 | Risk Ratio (M‐H, Fixed, 95% CI) | 0.0 [0.0, 0.0] |
| 7.1 2nd line | 1 | 209 | Risk Ratio (M‐H, Fixed, 95% CI) | 0.0 [0.0, 0.0] |
| 8 Anorexia Show forest plot | 1 | 209 | Risk Ratio (M‐H, Fixed, 95% CI) | 2.92 [0.12, 70.77] |
| 8.1 2nd line | 1 | 209 | Risk Ratio (M‐H, Fixed, 95% CI) | 2.92 [0.12, 70.77] |
| 9 Asthenia Show forest plot | 1 | 209 | Risk Ratio (M‐H, Fixed, 95% CI) | 2.92 [0.12, 70.77] |
| 9.1 2nd line | 1 | 209 | Risk Ratio (M‐H, Fixed, 95% CI) | 2.92 [0.12, 70.77] |
| 10 Overall response rate Show forest plot | 3 | Risk Ratio (M‐H, Fixed, 95% CI) | Subtotals only | |
| 10.1 2nd line | 2 | 424 | Risk Ratio (M‐H, Fixed, 95% CI) | 0.92 [0.58, 1.46] |
| 10.2 Maintenance | 1 | 96 | Risk Ratio (M‐H, Fixed, 95% CI) | 1.0 [0.35, 2.88] |
| 11 Partial response Show forest plot | 1 | 216 | Risk Ratio (M‐H, Fixed, 95% CI) | 0.75 [0.34, 1.65] |
| 11.1 2nd line | 1 | 216 | Risk Ratio (M‐H, Fixed, 95% CI) | 0.75 [0.34, 1.65] |
| 12 FACT‐L Symptom improvement rate Show forest plot | 2 | 356 | Mean Difference (IV, Fixed, 95% CI) | 3.70 [‐7.28, 14.69] |
| 12.1 2nd line | 2 | 356 | Mean Difference (IV, Fixed, 95% CI) | 3.70 [‐7.28, 14.69] |
| 13 TOI QOL improvement rate Show forest plot | 2 | 424 | Mean Difference (IV, Fixed, 95% CI) | 7.38 [‐2.30, 17.05] |
| 13.1 2nd line | 2 | 424 | Mean Difference (IV, Fixed, 95% CI) | 7.38 [‐2.30, 17.05] |
| Outcome or subgroup title | No. of studies | No. of participants | Statistical method | Effect size |
| 1 HR Progression‐free survival Show forest plot | 2 | Hazard Ratio (Random, 95% CI) | Subtotals only | |
| 1.1 1st line | 1 | Hazard Ratio (Random, 95% CI) | 0.69 [0.49, 0.96] | |
| 1.2 2nd line | 1 | Hazard Ratio (Random, 95% CI) | 0.65 [0.43, 0.97] | |
| 2 1‐year survival rate Show forest plot | 2 | 163 | Risk Ratio (M‐H, Fixed, 95% CI) | 1.15 [0.92, 1.43] |
| 2.1 2nd line | 2 | 163 | Risk Ratio (M‐H, Fixed, 95% CI) | 1.15 [0.92, 1.43] |
| 3 1‐year progression‐free survival Show forest plot | 2 | 163 | Risk Ratio (M‐H, Fixed, 95% CI) | 2.29 [1.38, 3.80] |
| 3.1 2nd line | 2 | 163 | Risk Ratio (M‐H, Fixed, 95% CI) | 2.29 [1.38, 3.80] |
| 4 Skin rash Show forest plot | 3 | 329 | Risk Ratio (M‐H, Fixed, 95% CI) | 1.34 [0.39, 4.57] |
| 4.1 1st line | 2 | 281 | Risk Ratio (M‐H, Fixed, 95% CI) | 1.01 [0.23, 4.51] |
| 4.2 2nd line | 1 | 48 | Risk Ratio (M‐H, Fixed, 95% CI) | 2.57 [0.25, 26.47] |
| 5 Diarrhoea Show forest plot | 3 | 329 | Risk Ratio (M‐H, Fixed, 95% CI) | 1.16 [0.21, 6.34] |
| 5.1 1st line | 2 | 281 | Risk Ratio (M‐H, Fixed, 95% CI) | 1.16 [0.21, 6.34] |
| 5.2 2nd line | 1 | 48 | Risk Ratio (M‐H, Fixed, 95% CI) | 0.0 [0.0, 0.0] |
| 6 Constipation Show forest plot | 1 | 48 | Risk Ratio (M‐H, Fixed, 95% CI) | 0.42 [0.02, 9.92] |
| 6.1 2nd line | 1 | 48 | Risk Ratio (M‐H, Fixed, 95% CI) | 0.42 [0.02, 9.92] |
| 7 Fatigue Show forest plot | 3 | 329 | Risk Ratio (M‐H, Fixed, 95% CI) | 2.68 [0.60, 11.90] |
| 7.1 1st line | 2 | 281 | Risk Ratio (M‐H, Fixed, 95% CI) | 2.68 [0.60, 11.90] |
| 7.2 2nd line | 1 | 48 | Risk Ratio (M‐H, Fixed, 95% CI) | 0.0 [0.0, 0.0] |
| 8 Leukopenia Show forest plot | 2 | 138 | Risk Ratio (M‐H, Fixed, 95% CI) | 1.50 [0.48, 4.70] |
| 8.1 1st line | 1 | 90 | Risk Ratio (M‐H, Fixed, 95% CI) | 1.25 [0.36, 4.35] |
| 8.2 2nd line | 1 | 48 | Risk Ratio (M‐H, Fixed, 95% CI) | 3.82 [0.16, 89.24] |
| 9 Anaemia Show forest plot | 3 | 329 | Risk Ratio (M‐H, Fixed, 95% CI) | 3.22 [0.66, 15.72] |
| 9.1 1st line | 2 | 281 | Risk Ratio (M‐H, Fixed, 95% CI) | 3.06 [0.49, 19.15] |
| 9.2 2nd line | 1 | 48 | Risk Ratio (M‐H, Fixed, 95% CI) | 3.82 [0.16, 89.24] |
| 10 Thrombocytopenia Show forest plot | 2 | 138 | Risk Ratio (M‐H, Fixed, 95% CI) | 0.0 [0.0, 0.0] |
| 10.1 1st line | 1 | 90 | Risk Ratio (M‐H, Fixed, 95% CI) | 0.0 [0.0, 0.0] |
| 10.2 2nd line | 1 | 48 | Risk Ratio (M‐H, Fixed, 95% CI) | 0.0 [0.0, 0.0] |
| 11 Neutropenia Show forest plot | 3 | 329 | Risk Ratio (M‐H, Fixed, 95% CI) | 1.47 [0.71, 3.02] |
| 11.1 1st line | 2 | 281 | Risk Ratio (M‐H, Fixed, 95% CI) | 1.36 [0.65, 2.88] |
| 11.2 2nd line | 1 | 48 | Risk Ratio (M‐H, Fixed, 95% CI) | 3.82 [0.16, 89.24] |
| 12 Increased ALT Show forest plot | 2 | 281 | Risk Ratio (M‐H, Fixed, 95% CI) | 2.57 [1.09, 6.04] |
| 12.1 1st line | 2 | 281 | Risk Ratio (M‐H, Fixed, 95% CI) | 2.57 [1.09, 6.04] |
| 13 Increased AST Show forest plot | 2 | 281 | Risk Ratio (M‐H, Fixed, 95% CI) | 1.47 [0.56, 3.88] |
| 13.1 1st line | 2 | 281 | Risk Ratio (M‐H, Fixed, 95% CI) | 1.47 [0.56, 3.88] |
| 14 Vomiting Show forest plot | 1 | 191 | Risk Ratio (M‐H, Fixed, 95% CI) | 1.56 [0.06, 37.74] |
| 14.1 1st line | 1 | 191 | Risk Ratio (M‐H, Fixed, 95% CI) | 1.56 [0.06, 37.74] |
| 15 Nausea Show forest plot | 1 | 191 | Risk Ratio (M‐H, Fixed, 95% CI) | 1.56 [0.06, 37.74] |
| 15.1 1st line | 1 | 191 | Risk Ratio (M‐H, Fixed, 95% CI) | 1.56 [0.06, 37.74] |
| 16 Overall response rate Show forest plot | 2 | 281 | Risk Ratio (M‐H, Fixed, 95% CI) | 1.02 [0.89, 1.17] |
| 16.1 1st line | 2 | 281 | Risk Ratio (M‐H, Fixed, 95% CI) | 1.02 [0.89, 1.17] |
| 17 Partial response Show forest plot | 4 | 444 | Risk Ratio (M‐H, Fixed, 95% CI) | 1.01 [0.88, 1.16] |
| 17.1 1st line | 2 | 281 | Risk Ratio (M‐H, Fixed, 95% CI) | 1.01 [0.88, 1.16] |
| 17.2 2nd line | 2 | 163 | Risk Ratio (M‐H, Fixed, 95% CI) | 1.02 [0.71, 1.47] |
| 18 Stable disease Show forest plot | 4 | 444 | Risk Ratio (M‐H, Fixed, 95% CI) | 0.97 [0.69, 1.37] |
| 18.1 1st line | 2 | 281 | Risk Ratio (M‐H, Fixed, 95% CI) | 0.67 [0.39, 1.16] |
| 18.2 2nd line | 2 | 163 | Risk Ratio (M‐H, Fixed, 95% CI) | 1.30 [0.84, 2.03] |
| Outcome or subgroup title | No. of studies | No. of participants | Statistical method | Effect size |
| 1 HR Overall survival Show forest plot | 3 | Hazard Ratio (Fixed, 95% CI) | Subtotals only | |
| 1.1 1st line [Asian] | 2 | Hazard Ratio (Fixed, 95% CI) | 0.86 [0.72, 1.02] | |
| 1.2 2nd line [EGFRm] | 1 | Hazard Ratio (Fixed, 95% CI) | 1.62 [1.05, 2.50] | |
| 2 HR Progression‐free survival Show forest plot | 3 | Hazard Ratio (Fixed, 95% CI) | Subtotals only | |
| 2.1 1st line [Asian] | 2 | Hazard Ratio (Fixed, 95% CI) | 0.69 [0.62, 0.77] | |
| 2.2 2nd line [EGFRm] | 1 | Hazard Ratio (Fixed, 95% CI) | 0.86 [0.65, 1.13] | |
| 3 1‐year survival rate Show forest plot | 2 | 1411 | Risk Ratio (M‐H, Fixed, 95% CI) | 0.95 [0.84, 1.08] |
| 3.1 1st line | 2 | 1411 | Risk Ratio (M‐H, Fixed, 95% CI) | 0.95 [0.84, 1.08] |
| 4 Skin rash Show forest plot | 5 | 2379 | Risk Ratio (M‐H, Fixed, 95% CI) | 2.98 [1.54, 5.77] |
| 4.1 1st line | 2 | 1400 | Risk Ratio (M‐H, Fixed, 95% CI) | 2.64 [1.23, 5.63] |
| 4.2 1st line [Asian] | 2 | 715 | Risk Ratio (M‐H, Fixed, 95% CI) | 4.23 [1.08, 16.54] |
| 4.3 2nd line [EGFRm] | 1 | 264 | Risk Ratio (M‐H, Fixed, 95% CI) | 0.0 [0.0, 0.0] |
| 5 Acne Show forest plot | 3 | 1664 | Risk Ratio (M‐H, Fixed, 95% CI) | 4.95 [1.09, 22.51] |
| 5.1 1st line | 2 | 1400 | Risk Ratio (M‐H, Fixed, 95% CI) | 5.59 [0.99, 31.60] |
| 5.2 2nd line [EGFRm] | 1 | 264 | Risk Ratio (M‐H, Fixed, 95% CI) | 3.0 [0.12, 72.98] |
| 6 Diarrhoea Show forest plot | 5 | 2379 | Risk Ratio (M‐H, Random, 95% CI) | 2.04 [1.17, 3.58] |
| 6.1 1st line | 2 | 1400 | Risk Ratio (M‐H, Random, 95% CI) | 2.44 [1.17, 5.09] |
| 6.2 1st line [Asian] | 2 | 715 | Risk Ratio (M‐H, Random, 95% CI) | 0.97 [0.32, 2.92] |
| 6.3 2nd line [EGFRm] | 1 | 264 | Risk Ratio (M‐H, Random, 95% CI) | 3.0 [0.32, 28.47] |
| 7 Pruritus Show forest plot | 2 | 1400 | Risk Ratio (M‐H, Fixed, 95% CI) | 1.99 [0.18, 21.89] |
| 7.1 1st line | 2 | 1400 | Risk Ratio (M‐H, Fixed, 95% CI) | 1.99 [0.18, 21.89] |
| 8 Vomiting Show forest plot | 5 | 2379 | Risk Ratio (M‐H, Fixed, 95% CI) | 1.24 [0.81, 1.89] |
| 8.1 1st line | 2 | 1400 | Risk Ratio (M‐H, Fixed, 95% CI) | 1.05 [0.53, 2.06] |
| 8.2 1st line [Asian] | 2 | 715 | Risk Ratio (M‐H, Fixed, 95% CI) | 1.28 [0.70, 2.32] |
| 8.3 2nd line [EGFRm] | 1 | 264 | Risk Ratio (M‐H, Fixed, 95% CI) | 2.0 [0.51, 7.83] |
| 9 Nausea Show forest plot | 5 | 2379 | Risk Ratio (M‐H, Fixed, 95% CI) | 0.82 [0.58, 1.17] |
| 9.1 1st line | 2 | 1400 | Risk Ratio (M‐H, Fixed, 95% CI) | 1.06 [0.51, 2.18] |
| 9.2 1st line [Asian] | 2 | 715 | Risk Ratio (M‐H, Fixed, 95% CI) | 0.74 [0.48, 1.14] |
| 9.3 2nd line [EGFRm] | 1 | 264 | Risk Ratio (M‐H, Fixed, 95% CI) | 0.83 [0.26, 2.66] |
| 10 Anorexia Show forest plot | 5 | 2379 | Risk Ratio (M‐H, Fixed, 95% CI) | 0.82 [0.55, 1.20] |
| 10.1 1st line | 2 | 1400 | Risk Ratio (M‐H, Fixed, 95% CI) | 1.98 [0.36, 10.76] |
| 10.2 1st line [Asian] | 2 | 715 | Risk Ratio (M‐H, Fixed, 95% CI) | 0.80 [0.53, 1.20] |
| 10.3 2nd line [EGFRm] | 1 | 264 | Risk Ratio (M‐H, Fixed, 95% CI) | 0.33 [0.04, 3.16] |
| 11 Asthenia Show forest plot | 3 | 1664 | Risk Ratio (M‐H, Random, 95% CI) | 0.80 [0.21, 2.99] |
| 11.1 1st line | 2 | 1400 | Risk Ratio (M‐H, Random, 95% CI) | 0.90 [0.10, 7.76] |
| 11.2 2nd line [EGFRm] | 1 | 264 | Risk Ratio (M‐H, Random, 95% CI) | 0.5 [0.09, 2.68] |
| 12 Dyspnoea Show forest plot | 2 | 947 | Risk Ratio (M‐H, Fixed, 95% CI) | 1.00 [0.25, 3.96] |
| 12.1 1st line | 1 | 683 | Risk Ratio (M‐H, Fixed, 95% CI) | 1.99 [0.18, 21.89] |
| 12.2 2nd line [EGFRm] | 1 | 264 | Risk Ratio (M‐H, Fixed, 95% CI) | 0.67 [0.11, 3.93] |
| 13 Anaemia Show forest plot | 3 | 979 | Risk Ratio (M‐H, Fixed, 95% CI) | 0.74 [0.53, 1.03] |
| 13.1 1st line [Asian] | 2 | 715 | Risk Ratio (M‐H, Fixed, 95% CI) | 0.63 [0.44, 0.90] |
| 13.2 2nd line [EGFRm] | 1 | 264 | Risk Ratio (M‐H, Fixed, 95% CI) | 2.2 [0.79, 6.16] |
| 14 Neutropenia Show forest plot | 5 | 2379 | Risk Ratio (M‐H, Fixed, 95% CI) | 0.97 [0.87, 1.08] |
| 14.1 1st line | 2 | 1400 | Risk Ratio (M‐H, Fixed, 95% CI) | 1.18 [0.77, 1.80] |
| 14.2 1st line [Asian] | 2 | 715 | Risk Ratio (M‐H, Fixed, 95% CI) | 0.93 [0.84, 1.03] |
| 14.3 2nd line [EGFRm] | 1 | 264 | Risk Ratio (M‐H, Fixed, 95% CI) | 1.29 [0.49, 3.35] |
| 15 Leukopenia Show forest plot | 4 | 2262 | Risk Ratio (M‐H, Fixed, 95% CI) | 1.08 [0.89, 1.31] |
| 15.1 1st line | 2 | 1400 | Risk Ratio (M‐H, Fixed, 95% CI) | 1.17 [0.61, 2.26] |
| 15.2 1st line [Asian] | 1 | 598 | Risk Ratio (M‐H, Fixed, 95% CI) | 1.06 [0.87, 1.30] |
| 15.3 2nd line [EGFRm] | 1 | 264 | Risk Ratio (M‐H, Fixed, 95% CI) | 1.0 [0.21, 4.86] |
| 16 Overall response rate Show forest plot | 5 | 2314 | Risk Ratio (M‐H, Fixed, 95% CI) | 1.08 [0.97, 1.20] |
| 16.1 1st line | 2 | 1343 | Risk Ratio (M‐H, Fixed, 95% CI) | 1.07 [0.94, 1.22] |
| 16.2 1st line [Asian] | 2 | 706 | Risk Ratio (M‐H, Fixed, 95% CI) | 1.14 [0.93, 1.40] |
| 16.3 2nd line [EGFRm] | 1 | 265 | Risk Ratio (M‐H, Fixed, 95% CI) | 0.93 [0.66, 1.31] |