Gefitinib para el cáncer de pulmón de células no pequeñas avanzado
Información
- DOI:
- https://doi.org/10.1002/14651858.CD006847.pub2Copiar DOI

- Base de datos:
-
- Cochrane Database of Systematic Reviews
- Versión publicada:
-
- 16 enero 2018see what's new
- Tipo:
-
- Intervention
- Etapa:
-
- Review
- Grupo Editorial Cochrane:
-
Grupo Cochrane de Cáncer de pulmón
- Copyright:
-
- Copyright © 2018 The Cochrane Collaboration. Published by John Wiley & Sons, Ltd.
Cifras del artículo
Altmetric:
Citado por:
Autores
Contributions of authors
All authors contributed to the design and methodology of this review. Esther Sim assessed the trials for inclusion, extracted data on included trials, entered data to RevMan, undertook the analysis and wrote the review. Ian Yang independently assessed the trials for inclusion, independently extracted data from included trials, checked the analysis and contributed to writing the review. Rayleen Bowman, Kwun Fong and Richard Wood‐Baker critically commented on the review and provided advice for improving the review.
Sources of support
Internal sources
-
No sources of support supplied
External sources
-
The Lung Foundation (Australia)/Lung Cancer Consultative Group Cochrane Review Scholarship (ES), Australia.
-
Lung Foundation (Australia) Lung Consultative Group (IY, KF, RB), Australia.
-
National Health and Medical Research Council (IY, KF, RB, RWB), Australia.
Declarations of interest
Esther HA Sim (ES): none known
Ian A Yang (IY): none known
Rayleen V Bowman (RB) has received pharmaceutical company sponsored items, meals and travel expenses associated with attendance at scientific meetings including Australian Lung Cancer Conference and Thoracic Society of Australia and New Zealand.
RB is a current member of the Lung Foundation (Australia)'s Lung Cancer Consultative Group, which receives financial sponsorship from a number of pharmaceutical companies.
Kwun M Fong (KF) was an investigator for a clinical trial of gefitinib for lung cancer (Astra Zeneca international trial) ‐ funding received by the Hospital funds the clinical trial and the employment of a trials nurse.
KF's laboratory has also undertaken contract research for a clinical study looking at immunohistochemistry of certain proteins in lung cancer for Novartis ‐ funding received will go to the Project and employment of Research staff for the Project.
KF was previously offered an honorarium from a pharmaceutical company for attending an one‐off Advisory Board Meeting; this was not accepted and asked to be given to a charity.
KF has received occasional pens, pads and minor stationery from industry. KF has occasionally attended/spoken at meetings organised by pharmaceutical companies where meals/travel costs would be sponsored.
KF has organised the Queensland Lung Cancer Interest Group Meeting (two to three meetings per year, a teleconference meeting, which is supported by Eli Lilly. KF has/is also involved in organising and attending professional meetings including those run by the Thoracic Society of Australia and New Zealand, Asia‐Pacific Society of Respirology, Australian Lung Cancer Conference, IASLC, where some sponsorship is usually provided by industry.
KF is involved with the Lung Foundation (Australia)'s Lung Cancer Cooperative Group (not‐for‐profit, public benevolent institution) (http://www.lungnet.org/www.lungnet.org.au) and its activities, which includes promotion of Cochrane Reviews. The LFA receives support from pharmaceutical companies. KF was Chair of the Australian Lung Cancer trials Group, which receives some support funding from pharmaceutical companies.
Richard Wood‐Baker (RWB): none known
Acknowledgements
We would like to thank the Cochrane Lung Cancer Review Group, including Fédérico Capuzzo, Jean‐Paul Sculier, Noelle O’Rourke, Fergus Macbeth, Virginie Westeel, Corynne Marchal, Tom Haswell and Marta Roqué for expert advice and extensive support with this review.
We would also like to thank Vivian Sun, Senior Clinical Research Co‐ordinator (50% Melanoma), Adult Oncology Research Centre, Auckland Regional Cancer and Blood Service for her translation of the Dai 2013 and Li 2010 studies that were published in Mandarin.
Esther Sim was supported by an Australian Lung Foundation/Lung Cancer Consultative Group Cochrane Review Scholarship in 2007. Ian Yang was supported by an NHMRC Career Development Fellowship, and project grants from NHMRC, Cancer Council Queensland, The Prince Charles Hospital Foundation and Queensland Smart State grants. Rayleen Bowman was supported by project grants from NHMRC, Dust Diseases Board, Cancer Australia, Cancer Council Queensland and The Prince Charles Hospital Foundation. Kwun Fong was supported by an NHMRC Practitioner Fellowship, and project grants from NHMRC, Cancer Australia, Dust Diseases Board, Cancer Council Queensland, The Prince Charles Hospital Foundation and Queensland Smart State grants. Richard Wood‐Baker was supported by project grants from NHMRC and Royal Hobart Hospital Research Foundation.
Version history
| Published | Title | Stage | Authors | Version |
| 2018 Jan 16 | Gefitinib for advanced non‐small cell lung cancer | Review | Esther HA Sim, Ian A Yang, Richard Wood‐Baker, Rayleen V Bowman, Kwun M Fong | |
| 2007 Oct 17 | Gefitinib for advanced non‐small cell lung cancer | Protocol | Esther H.A. Sim, Ian A Yang, Kwun Fong, Richard Wood‐Baker, Rayleen Bowman | |
Differences between protocol and review
The text of the protocol section of the review has been updated to included new subheadings.
We have added toxicity to the list of our primary outcomes.
We have included three 'Summary of findings' tables giving overall survival and progression‐free survival for gefitinib compared to chemotherapy for first‐line treatment of advanced NSCLC, gefitinib compared to chemotherapy for second‐line treatment of advanced NSCLC and the toxicity of gefitinib compared to chemotherapy for advanced NSCLC.
Keywords
MeSH
Medical Subject Headings (MeSH) Keywords
- Antineoplastic Agents [adverse effects, *therapeutic use];
- Carcinoma, Non‐Small‐Cell Lung [*drug therapy, ethnology, genetics];
- Disease‐Free Survival;
- Gefitinib;
- Genes, erbB‐1;
- Lung Neoplasms [*drug therapy, ethnology, genetics];
- Mutation;
- Quality of Life;
- Quinazolines [adverse effects, *therapeutic use];
- Randomized Controlled Trials as Topic;
- Treatment Failure;
Medical Subject Headings Check Words
Humans;
PICO

Study flow diagram for searches 1966‐2017.
(EGFR: epidermal growth factor receptor)

'Risk of bias' summary: review authors' judgements about each risk of bias item for each included study.
Progression‐free survival: Gefitinib versus first‐line chemotherapy in an Asian population (Analysis 5.4).

Progression‐free survival: Gefitinib versus second‐line chemotherapy in an Asian population (Analysis 5.5).

Progression‐free survival: Gefitinib versus first‐line chemotherapy in an EGFR mutation positive population (Analysis 6.3).

Progression‐free survival: Gefitinib versus second‐line chemotherapy in an EGFR mutation positive population (Analysis 6.4).
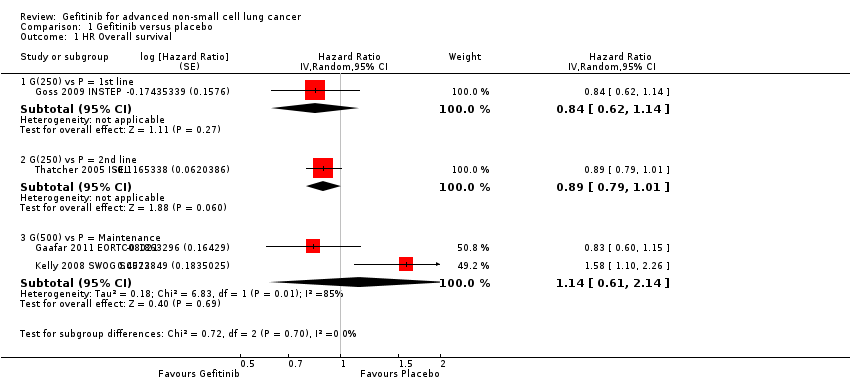
Comparison 1 Gefitinib versus placebo, Outcome 1 HR Overall survival.

Comparison 1 Gefitinib versus placebo, Outcome 2 HR Progression‐free survival.

Comparison 1 Gefitinib versus placebo, Outcome 3 1‐year survival rate.

Comparison 1 Gefitinib versus placebo, Outcome 4 Skin rash.

Comparison 1 Gefitinib versus placebo, Outcome 5 Pruritus.

Comparison 1 Gefitinib versus placebo, Outcome 6 Diarrhoea.

Comparison 1 Gefitinib versus placebo, Outcome 7 Constipation.

Comparison 1 Gefitinib versus placebo, Outcome 8 Nausea.

Comparison 1 Gefitinib versus placebo, Outcome 9 Vomiting.

Comparison 1 Gefitinib versus placebo, Outcome 10 Anorexia.

Comparison 1 Gefitinib versus placebo, Outcome 11 Fatigue.
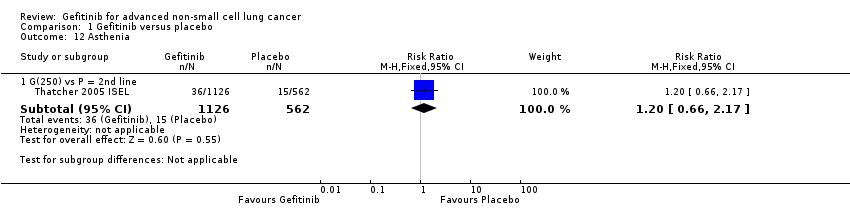
Comparison 1 Gefitinib versus placebo, Outcome 12 Asthenia.

Comparison 1 Gefitinib versus placebo, Outcome 13 Respiratory tract infection.

Comparison 1 Gefitinib versus placebo, Outcome 14 Dyspnoea.
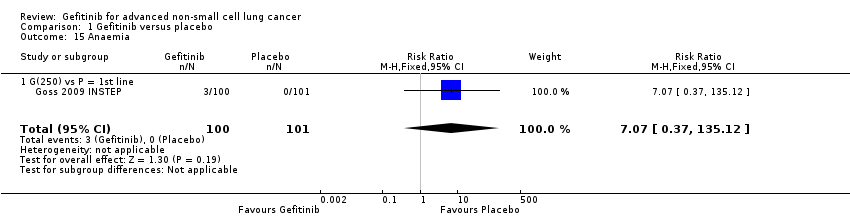
Comparison 1 Gefitinib versus placebo, Outcome 15 Anaemia.

Comparison 1 Gefitinib versus placebo, Outcome 16 Abdominal pain.

Comparison 1 Gefitinib versus placebo, Outcome 17 Increased ALT.

Comparison 1 Gefitinib versus placebo, Outcome 18 Increased AST.

Comparison 1 Gefitinib versus placebo, Outcome 19 Neutropenia.

Comparison 1 Gefitinib versus placebo, Outcome 20 Anaemia.

Comparison 1 Gefitinib versus placebo, Outcome 21 Thrombocytopaenia.

Comparison 1 Gefitinib versus placebo, Outcome 22 Overall response rate.

Comparison 1 Gefitinib versus placebo, Outcome 23 Disease control rate.

Comparison 2 Gefitinib versus placebo (Asian subgroup), Outcome 1 HR Overall survival.
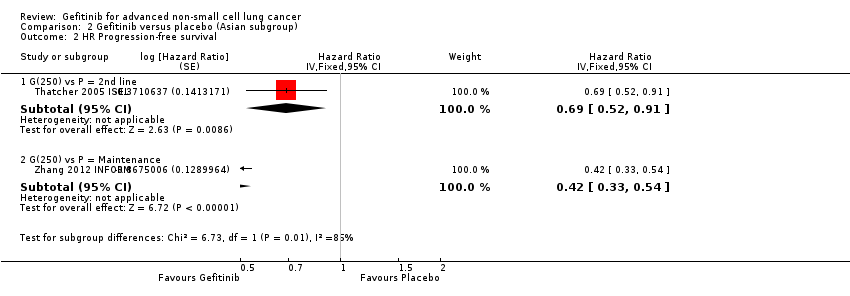
Comparison 2 Gefitinib versus placebo (Asian subgroup), Outcome 2 HR Progression‐free survival.
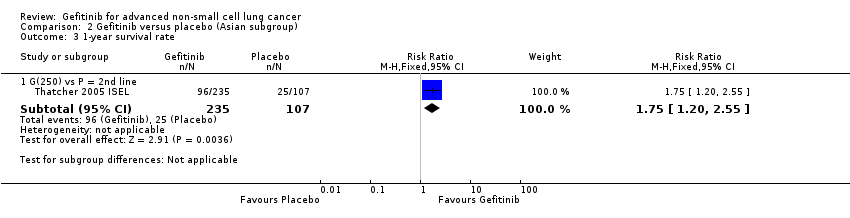
Comparison 2 Gefitinib versus placebo (Asian subgroup), Outcome 3 1‐year survival rate.

Comparison 2 Gefitinib versus placebo (Asian subgroup), Outcome 4 Overall response rate.
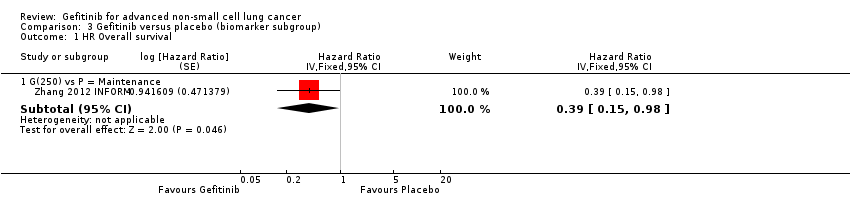
Comparison 3 Gefitinib versus placebo (biomarker subgroup), Outcome 1 HR Overall survival.

Comparison 3 Gefitinib versus placebo (biomarker subgroup), Outcome 2 HR Progression‐free survival.

Comparison 4 Gefitinib versus chemotherapy, Outcome 1 HR Overall survival.

Comparison 4 Gefitinib versus chemotherapy, Outcome 2 HR Progression‐free survival.
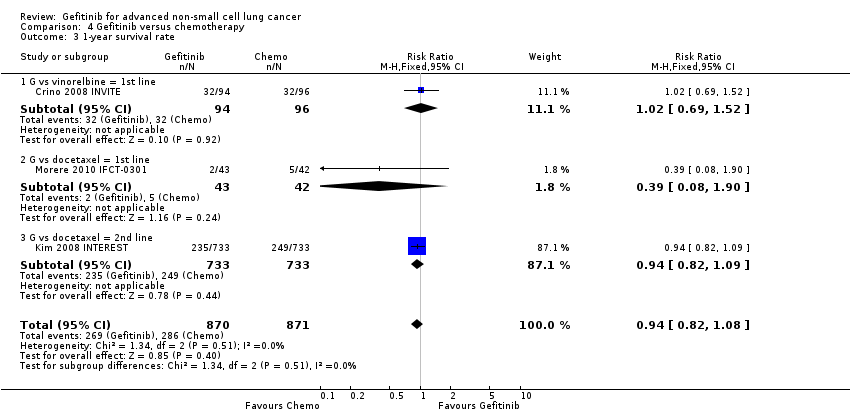
Comparison 4 Gefitinib versus chemotherapy, Outcome 3 1‐year survival rate.

Comparison 4 Gefitinib versus chemotherapy, Outcome 4 Skin rash.
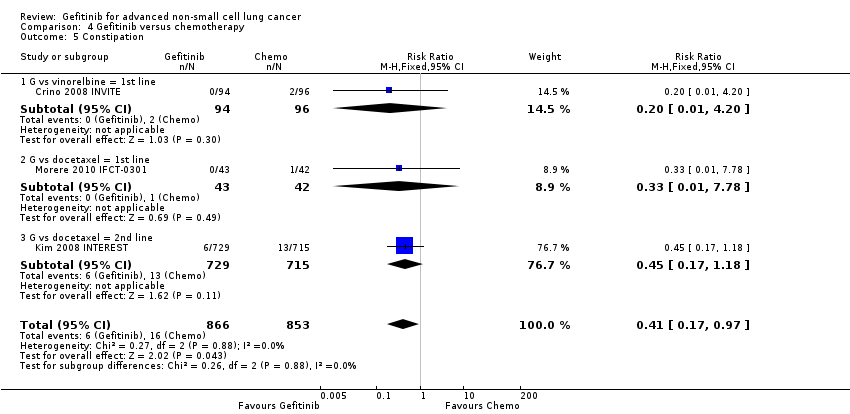
Comparison 4 Gefitinib versus chemotherapy, Outcome 5 Constipation.

Comparison 4 Gefitinib versus chemotherapy, Outcome 6 Fatigue.

Comparison 4 Gefitinib versus chemotherapy, Outcome 7 Asthenia.
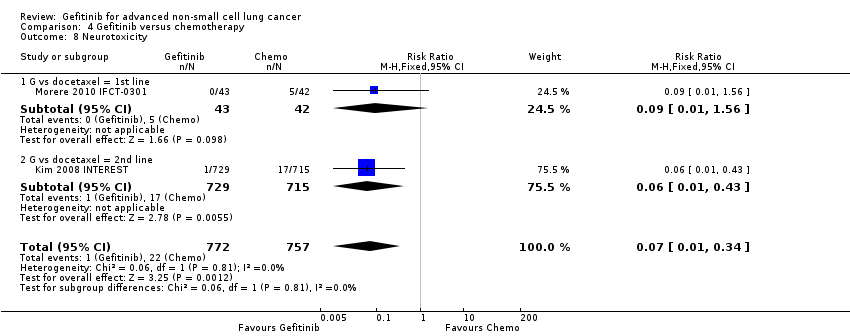
Comparison 4 Gefitinib versus chemotherapy, Outcome 8 Neurotoxicity.

Comparison 4 Gefitinib versus chemotherapy, Outcome 9 Neutropenia.

Comparison 4 Gefitinib versus chemotherapy, Outcome 10 Leukopenia.

Comparison 4 Gefitinib versus chemotherapy, Outcome 11 Febrile neutropenia.

Comparison 4 Gefitinib versus chemotherapy, Outcome 12 Pruritus.
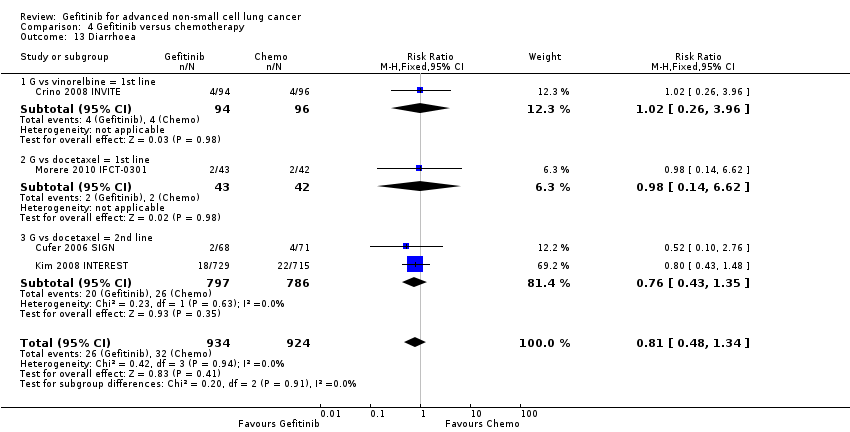
Comparison 4 Gefitinib versus chemotherapy, Outcome 13 Diarrhoea.
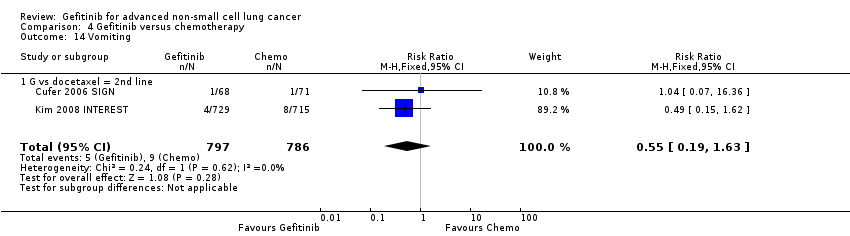
Comparison 4 Gefitinib versus chemotherapy, Outcome 14 Vomiting.
Comparison 4 Gefitinib versus chemotherapy, Outcome 15 Anorexia.
Comparison 4 Gefitinib versus chemotherapy, Outcome 16 Stomatitis.

Comparison 4 Gefitinib versus chemotherapy, Outcome 17 Arthralgia/myalgia.
Comparison 4 Gefitinib versus chemotherapy, Outcome 18 Peripheral oedema.

Comparison 4 Gefitinib versus chemotherapy, Outcome 19 Respiratory tract infection.

Comparison 4 Gefitinib versus chemotherapy, Outcome 20 Dyspnoea.

Comparison 4 Gefitinib versus chemotherapy, Outcome 21 Cough.

Comparison 4 Gefitinib versus chemotherapy, Outcome 22 Anaemia.

Comparison 4 Gefitinib versus chemotherapy, Outcome 23 Thrombocytopenia.
Comparison 4 Gefitinib versus chemotherapy, Outcome 24 Hypokalaemia.

Comparison 4 Gefitinib versus chemotherapy, Outcome 25 Pyrexia.
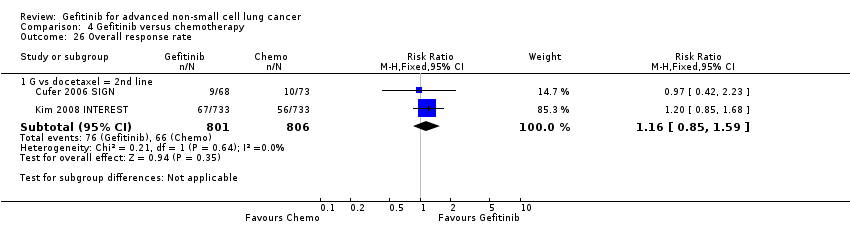
Comparison 4 Gefitinib versus chemotherapy, Outcome 26 Overall response rate.

Comparison 4 Gefitinib versus chemotherapy, Outcome 27 Disease control rate.
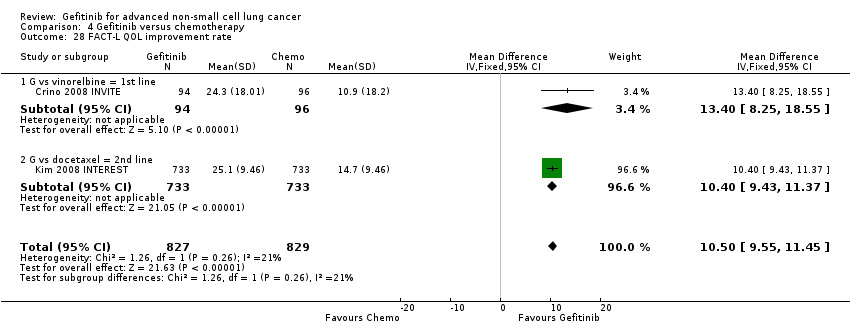
Comparison 4 Gefitinib versus chemotherapy, Outcome 28 FACT‐L QOL improvement rate.

Comparison 4 Gefitinib versus chemotherapy, Outcome 29 LCS QOL improvement rate.

Comparison 4 Gefitinib versus chemotherapy, Outcome 30 TOI QOL improvement rate.

Comparison 4 Gefitinib versus chemotherapy, Outcome 31 PSI QOL improvement rate.

Comparison 5 Gefitinib versus chemotherapy (Asian subgroup), Outcome 1 HR Overall survival = 1st line.

Comparison 5 Gefitinib versus chemotherapy (Asian subgroup), Outcome 2 HR Overall survival = 2nd line.

Comparison 5 Gefitinib versus chemotherapy (Asian subgroup), Outcome 3 HR Overall survival = Maintenance.

Comparison 5 Gefitinib versus chemotherapy (Asian subgroup), Outcome 4 HR Progression‐free survival = 1st line.
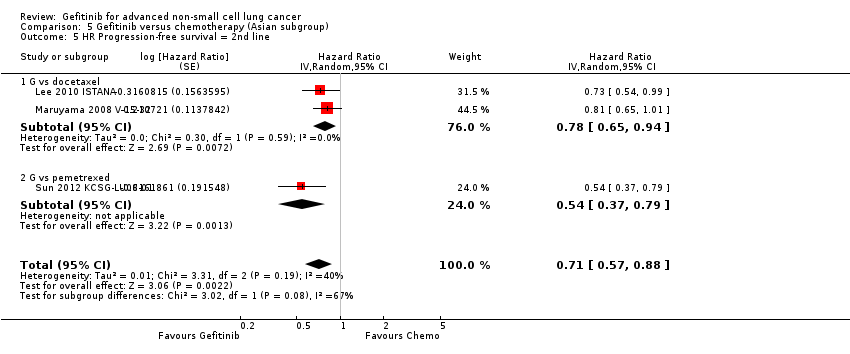
Comparison 5 Gefitinib versus chemotherapy (Asian subgroup), Outcome 5 HR Progression‐free survival = 2nd line.

Comparison 5 Gefitinib versus chemotherapy (Asian subgroup), Outcome 6 HR Progression‐free survival = Maintenance.

Comparison 5 Gefitinib versus chemotherapy (Asian subgroup), Outcome 7 1‐year survival rate.

Comparison 5 Gefitinib versus chemotherapy (Asian subgroup), Outcome 8 Nausea.

Comparison 5 Gefitinib versus chemotherapy (Asian subgroup), Outcome 9 Vomiting.

Comparison 5 Gefitinib versus chemotherapy (Asian subgroup), Outcome 10 Anorexia.

Comparison 5 Gefitinib versus chemotherapy (Asian subgroup), Outcome 11 Fatigue.

Comparison 5 Gefitinib versus chemotherapy (Asian subgroup), Outcome 12 Arthralgia/myalgia.

Comparison 5 Gefitinib versus chemotherapy (Asian subgroup), Outcome 13 Asthenia.

Comparison 5 Gefitinib versus chemotherapy (Asian subgroup), Outcome 14 Neurotoxicity.

Comparison 5 Gefitinib versus chemotherapy (Asian subgroup), Outcome 15 Neutropenia.

Comparison 5 Gefitinib versus chemotherapy (Asian subgroup), Outcome 16 Anaemia.
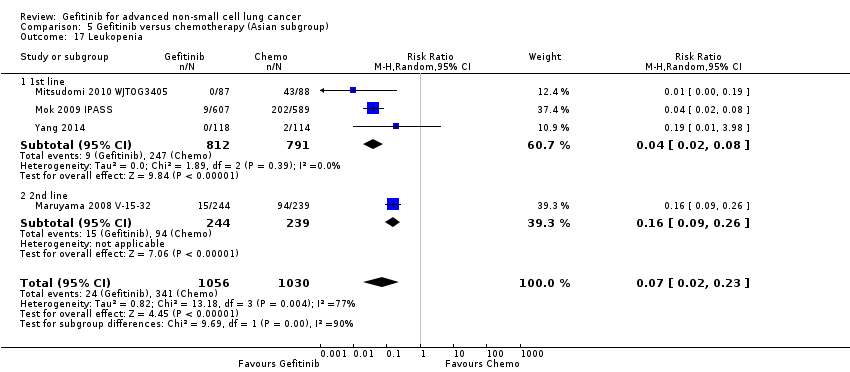
Comparison 5 Gefitinib versus chemotherapy (Asian subgroup), Outcome 17 Leukopenia.

Comparison 5 Gefitinib versus chemotherapy (Asian subgroup), Outcome 18 Thrombocytopenia.
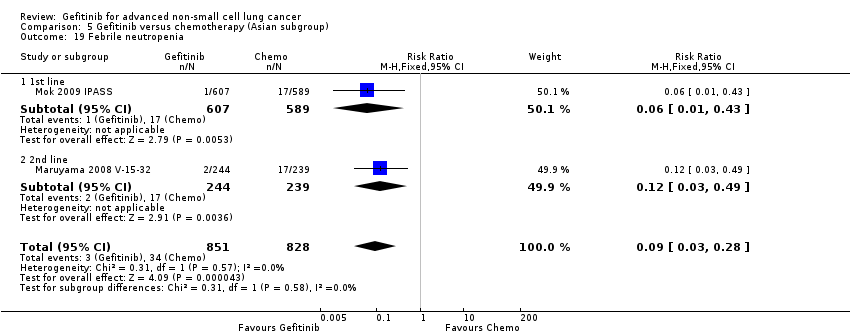
Comparison 5 Gefitinib versus chemotherapy (Asian subgroup), Outcome 19 Febrile neutropenia.

Comparison 5 Gefitinib versus chemotherapy (Asian subgroup), Outcome 20 Skin rash.
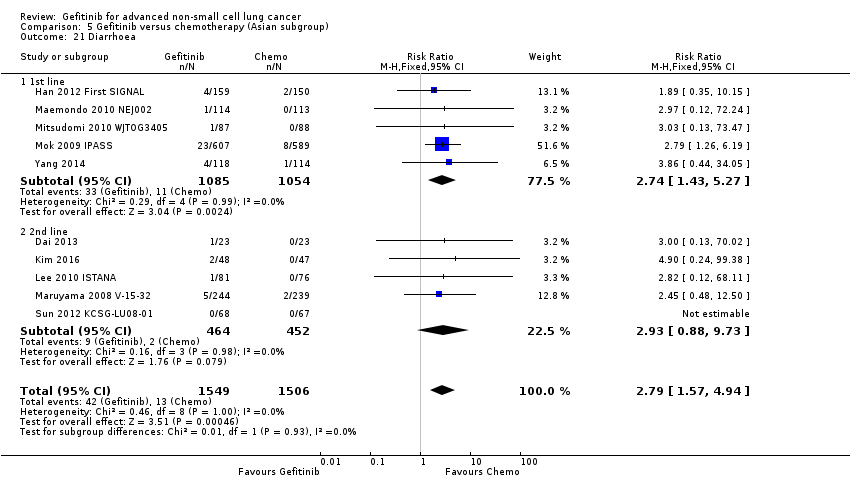
Comparison 5 Gefitinib versus chemotherapy (Asian subgroup), Outcome 21 Diarrhoea.

Comparison 5 Gefitinib versus chemotherapy (Asian subgroup), Outcome 22 Increased ALT.

Comparison 5 Gefitinib versus chemotherapy (Asian subgroup), Outcome 23 Increased AST.

Comparison 5 Gefitinib versus chemotherapy (Asian subgroup), Outcome 24 Overall response rate.
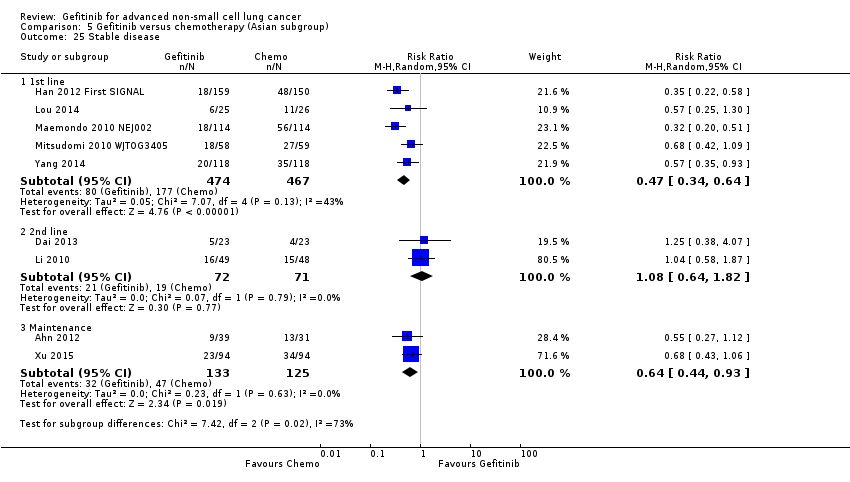
Comparison 5 Gefitinib versus chemotherapy (Asian subgroup), Outcome 25 Stable disease.

Comparison 5 Gefitinib versus chemotherapy (Asian subgroup), Outcome 26 Disease control rate.

Comparison 5 Gefitinib versus chemotherapy (Asian subgroup), Outcome 27 FACT‐L QOL improvement rate.

Comparison 5 Gefitinib versus chemotherapy (Asian subgroup), Outcome 28 LCS QOL improvement rate.
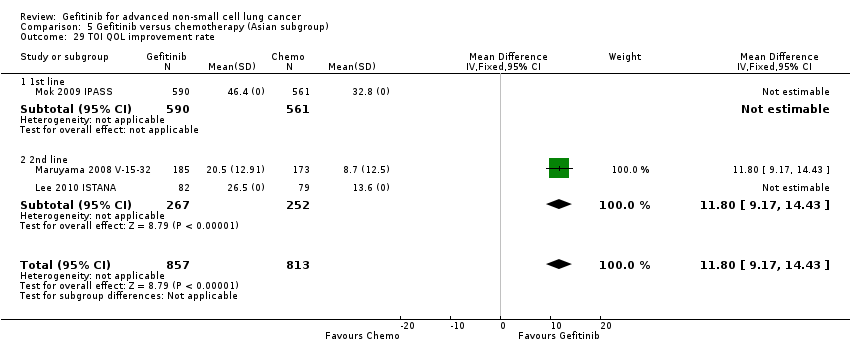
Comparison 5 Gefitinib versus chemotherapy (Asian subgroup), Outcome 29 TOI QOL improvement rate.

Comparison 6 Gefitinib versus chemotherapy (EGFR mutation), Outcome 1 HR Overall survival = 1st line.
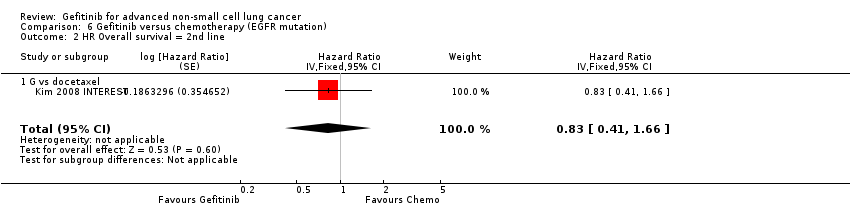
Comparison 6 Gefitinib versus chemotherapy (EGFR mutation), Outcome 2 HR Overall survival = 2nd line.
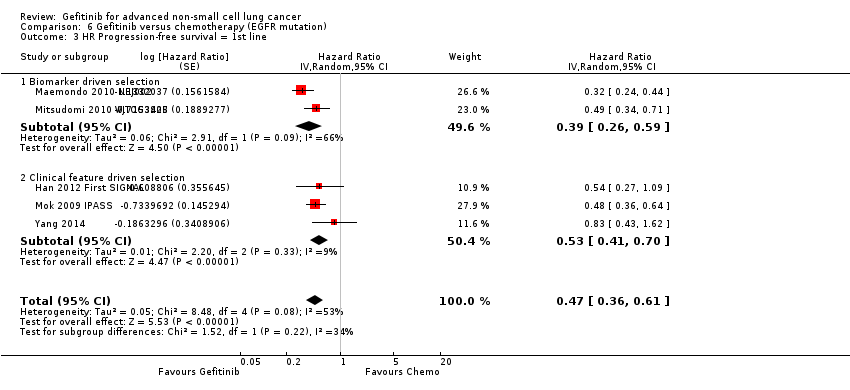
Comparison 6 Gefitinib versus chemotherapy (EGFR mutation), Outcome 3 HR Progression‐free survival = 1st line.
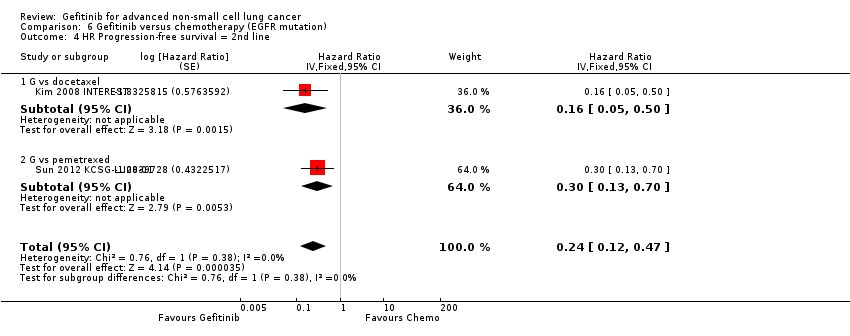
Comparison 6 Gefitinib versus chemotherapy (EGFR mutation), Outcome 4 HR Progression‐free survival = 2nd line.
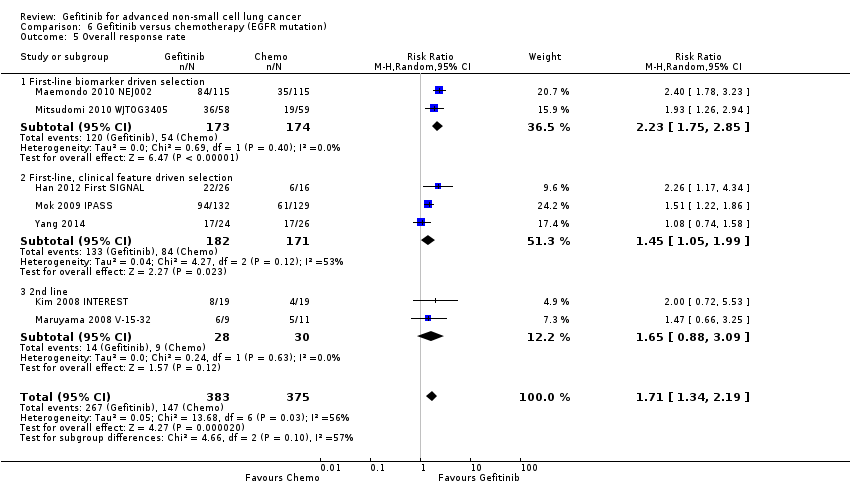
Comparison 6 Gefitinib versus chemotherapy (EGFR mutation), Outcome 5 Overall response rate.
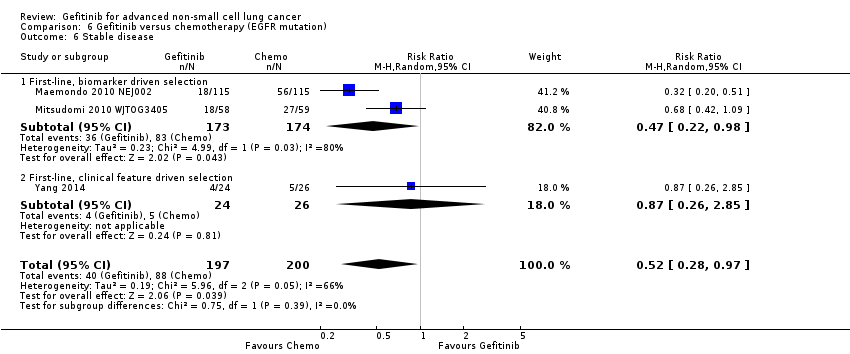
Comparison 6 Gefitinib versus chemotherapy (EGFR mutation), Outcome 6 Stable disease.

Comparison 6 Gefitinib versus chemotherapy (EGFR mutation), Outcome 7 Disease control rate.
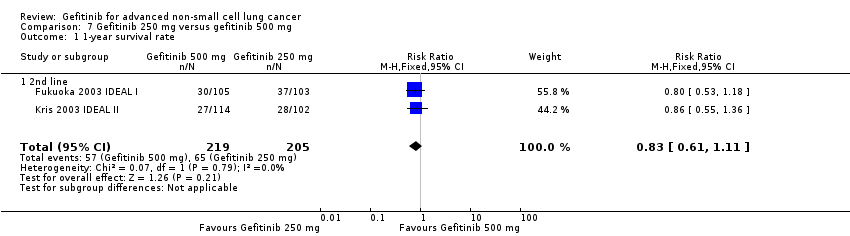
Comparison 7 Gefitinib 250 mg versus gefitinib 500 mg, Outcome 1 1‐year survival rate.

Comparison 7 Gefitinib 250 mg versus gefitinib 500 mg, Outcome 2 Skin rash.
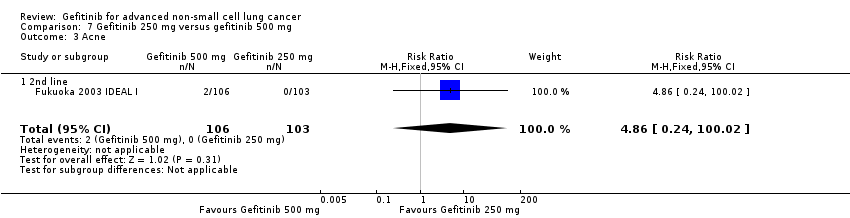
Comparison 7 Gefitinib 250 mg versus gefitinib 500 mg, Outcome 3 Acne.

Comparison 7 Gefitinib 250 mg versus gefitinib 500 mg, Outcome 4 Pruritus.
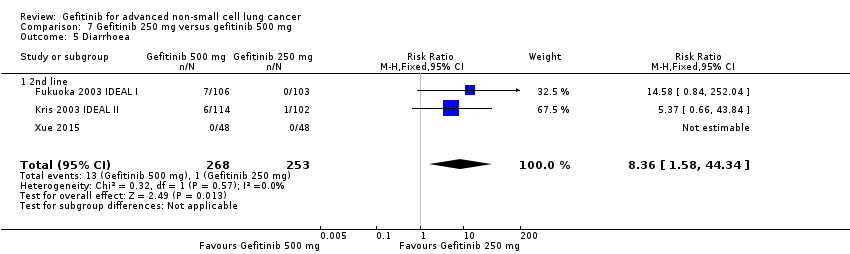
Comparison 7 Gefitinib 250 mg versus gefitinib 500 mg, Outcome 5 Diarrhoea.

Comparison 7 Gefitinib 250 mg versus gefitinib 500 mg, Outcome 6 Nausea.
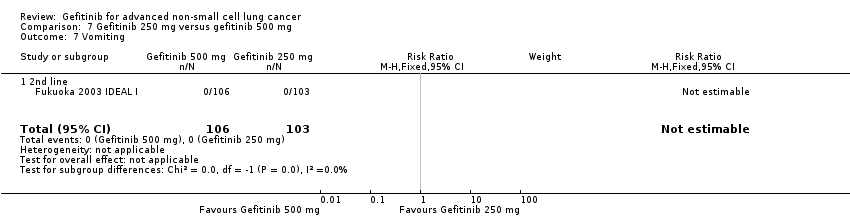
Comparison 7 Gefitinib 250 mg versus gefitinib 500 mg, Outcome 7 Vomiting.

Comparison 7 Gefitinib 250 mg versus gefitinib 500 mg, Outcome 8 Anorexia.

Comparison 7 Gefitinib 250 mg versus gefitinib 500 mg, Outcome 9 Asthenia.

Comparison 7 Gefitinib 250 mg versus gefitinib 500 mg, Outcome 10 Overall response rate.

Comparison 7 Gefitinib 250 mg versus gefitinib 500 mg, Outcome 11 Partial response.
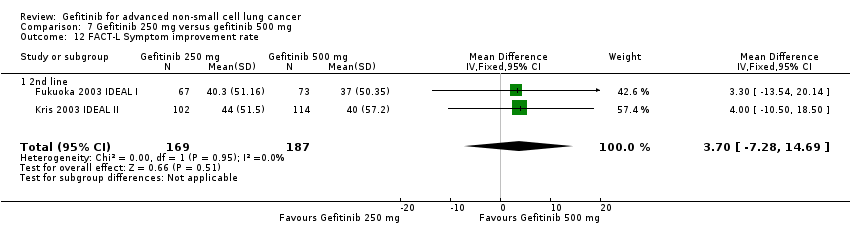
Comparison 7 Gefitinib 250 mg versus gefitinib 500 mg, Outcome 12 FACT‐L Symptom improvement rate.

Comparison 7 Gefitinib 250 mg versus gefitinib 500 mg, Outcome 13 TOI QOL improvement rate.

Comparison 8 Gefitinib versus gefitinib + chemotherapy, Outcome 1 HR Progression‐free survival.

Comparison 8 Gefitinib versus gefitinib + chemotherapy, Outcome 2 1‐year survival rate.
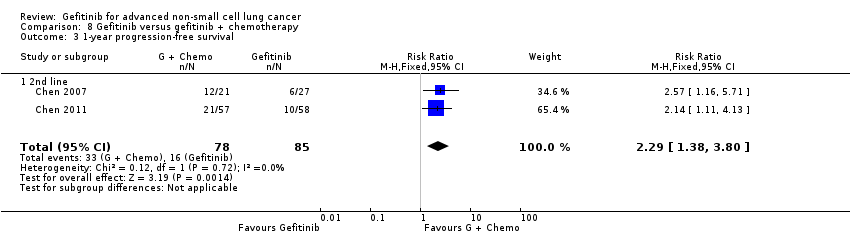
Comparison 8 Gefitinib versus gefitinib + chemotherapy, Outcome 3 1‐year progression‐free survival.
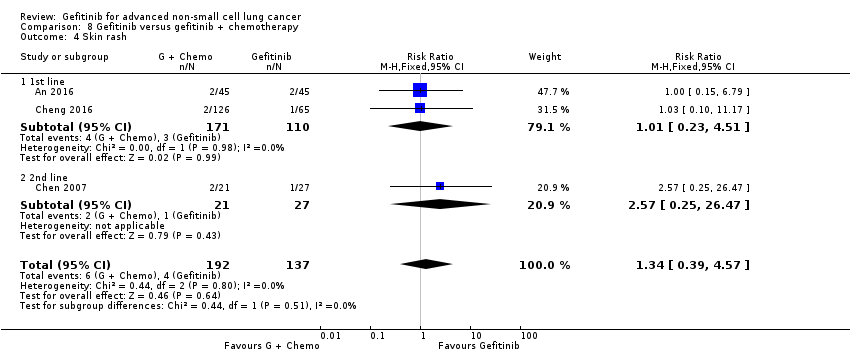
Comparison 8 Gefitinib versus gefitinib + chemotherapy, Outcome 4 Skin rash.

Comparison 8 Gefitinib versus gefitinib + chemotherapy, Outcome 5 Diarrhoea.
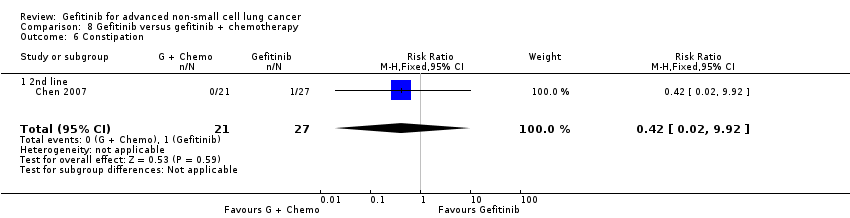
Comparison 8 Gefitinib versus gefitinib + chemotherapy, Outcome 6 Constipation.

Comparison 8 Gefitinib versus gefitinib + chemotherapy, Outcome 7 Fatigue.

Comparison 8 Gefitinib versus gefitinib + chemotherapy, Outcome 8 Leukopenia.

Comparison 8 Gefitinib versus gefitinib + chemotherapy, Outcome 9 Anaemia.

Comparison 8 Gefitinib versus gefitinib + chemotherapy, Outcome 10 Thrombocytopenia.

Comparison 8 Gefitinib versus gefitinib + chemotherapy, Outcome 11 Neutropenia.

Comparison 8 Gefitinib versus gefitinib + chemotherapy, Outcome 12 Increased ALT.

Comparison 8 Gefitinib versus gefitinib + chemotherapy, Outcome 13 Increased AST.

Comparison 8 Gefitinib versus gefitinib + chemotherapy, Outcome 14 Vomiting.

Comparison 8 Gefitinib versus gefitinib + chemotherapy, Outcome 15 Nausea.

Comparison 8 Gefitinib versus gefitinib + chemotherapy, Outcome 16 Overall response rate.

Comparison 8 Gefitinib versus gefitinib + chemotherapy, Outcome 17 Partial response.

Comparison 8 Gefitinib versus gefitinib + chemotherapy, Outcome 18 Stable disease.

Comparison 9 Gefitinib + chemotherapy versus chemotherapy, Outcome 1 HR Overall survival.

Comparison 9 Gefitinib + chemotherapy versus chemotherapy, Outcome 2 HR Progression‐free survival.

Comparison 9 Gefitinib + chemotherapy versus chemotherapy, Outcome 3 1‐year survival rate.

Comparison 9 Gefitinib + chemotherapy versus chemotherapy, Outcome 4 Skin rash.
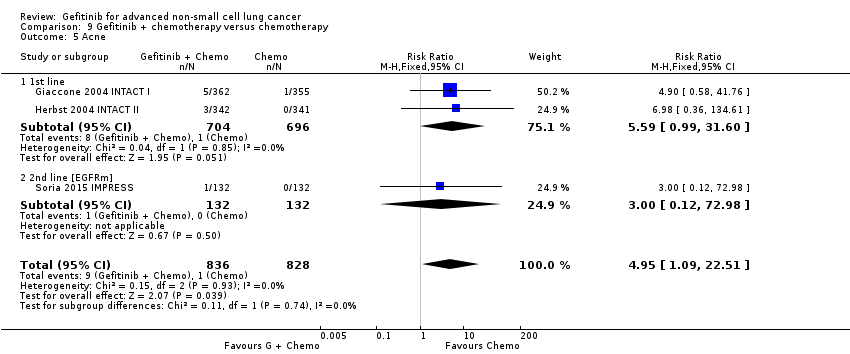
Comparison 9 Gefitinib + chemotherapy versus chemotherapy, Outcome 5 Acne.
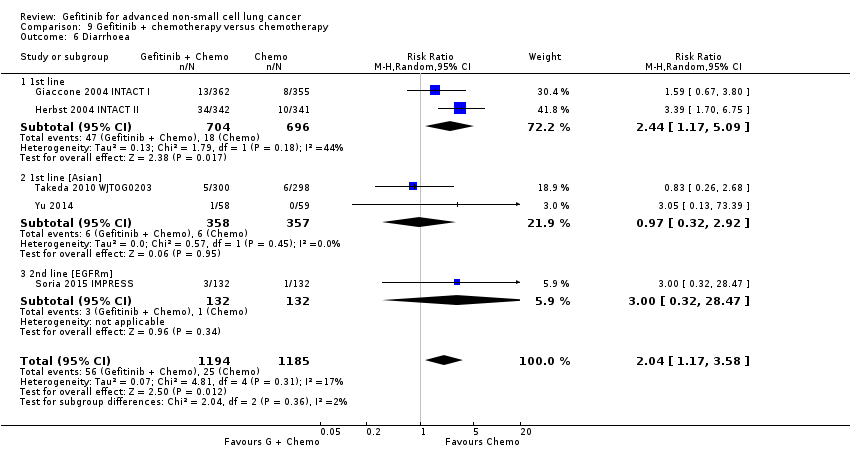
Comparison 9 Gefitinib + chemotherapy versus chemotherapy, Outcome 6 Diarrhoea.

Comparison 9 Gefitinib + chemotherapy versus chemotherapy, Outcome 7 Pruritus.

Comparison 9 Gefitinib + chemotherapy versus chemotherapy, Outcome 8 Vomiting.

Comparison 9 Gefitinib + chemotherapy versus chemotherapy, Outcome 9 Nausea.

Comparison 9 Gefitinib + chemotherapy versus chemotherapy, Outcome 10 Anorexia.

Comparison 9 Gefitinib + chemotherapy versus chemotherapy, Outcome 11 Asthenia.

Comparison 9 Gefitinib + chemotherapy versus chemotherapy, Outcome 12 Dyspnoea.

Comparison 9 Gefitinib + chemotherapy versus chemotherapy, Outcome 13 Anaemia.
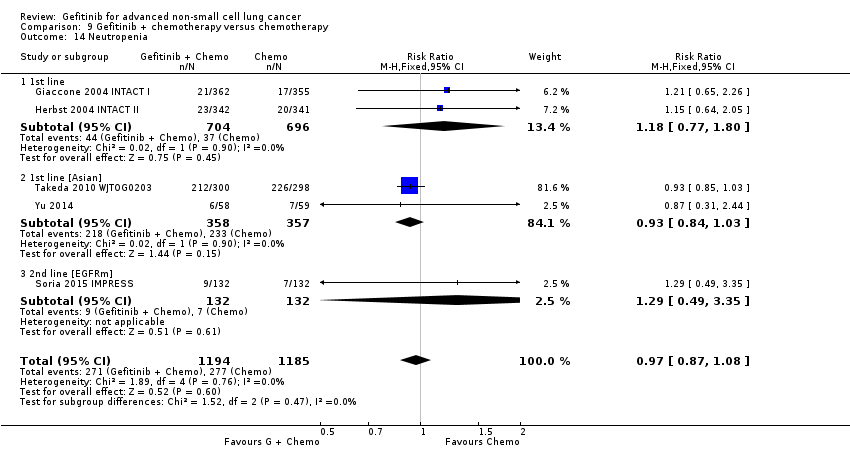
Comparison 9 Gefitinib + chemotherapy versus chemotherapy, Outcome 14 Neutropenia.
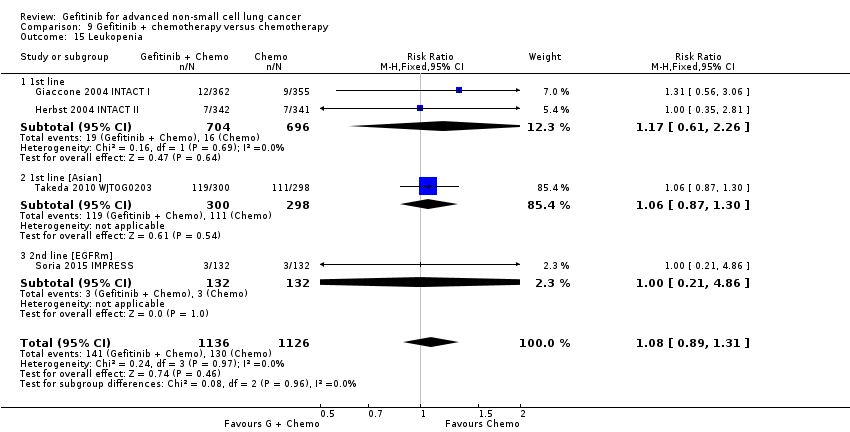
Comparison 9 Gefitinib + chemotherapy versus chemotherapy, Outcome 15 Leukopenia.

Comparison 9 Gefitinib + chemotherapy versus chemotherapy, Outcome 16 Overall response rate.
| Gefitinib compared to chemotherapy for first‐line treatment of advanced NSCLC | ||||||
| Patient or population: advanced NSCLC | ||||||
| Outcomes | Illustrative comparative risks* (95% CI) | Relative effect | No of participants | Quality of the evidence | Comments | |
| Assumed risk | Corresponding risk | |||||
| Chemotherapy | Gefitinib | |||||
| Overall survival (OS) | The mean OS ranged across control groups from 3.5 to 8 months | The mean OS in the intervention group ranged from 2.2 to 5.9 months | HR 0.98 (0.91 to 1.46) | 275 | ⊕⊕⊕⊝ | OS similar in the Asian (HR 0.94, 0.82 to 1.06) and EGFR mutation positive subgroups (HR 0.97, 0.77 to 1.21) |
| Progression‐free survival (PFS) | The PFS ranged across control groups from 2 to 2.9 months | The mean PFS in the intervention group ranged from 1.9 to 2.7 months | HR 1.19 (0.86 to 1.65) | 275 | ⊕⊕⊕⊝ | PFS improved with gefitinib in the Asian subgroup (HR 0.65, 0.43 to 0.98) and the EGFR mutation positive subgroup (HR 0.47, 0.36 to 0.61) |
| *The basis for the assumed risk (e.g. the median control group risk across studies) is provided in footnotes. The corresponding risk (and its 95% confidence interval) is based on the assumed risk in the comparison group and the relative effect of the intervention (and its 95% CI). | ||||||
| GRADE Working Group grades of evidence | ||||||
| 1We downgraded the quality of evidence by one level because of serious indirectness as one study included only elderly patients (> 70 years old). | ||||||
| Gefitinib compared to chemotherapy for second‐line treatment of advanced NSCLC | ||||||
| Patient or population: advanced NSCLC | ||||||
| Outcomes | Illustrative comparative risks* (95% CI) | Relative effect | No of participants | Quality of the evidence | Comments | |
| Assumed risk | Corresponding risk | |||||
| Chemotherapy | Gefitinib | |||||
| Overall survival (OS) | The mean OS ranged across control groups from 7.1 to 8 months | The mean OS in the intervention group ranged from 7.5 to 7.6 months | HR 1.02 (0.91 to 1.15) | 1607 | ⊕⊕⊕⊝ | OS similar in Asian patients (HR 0.94, 0.79 to 1.12) and EGFR mutation positive patients (HR 0.83, 0.41 to 1.66). |
| Progression‐free survival (PFS) | The mean PFS ranged across control groups from 2.7 to 3.4 months | The mean PFS in the intervention group ranged from 2.2 to 3 months | HR 1.04 (0.92 to 1.17) | 1607 | ⊕⊕⊕⊝ | PFS significantly improved in Asian patients (HR 0.71, 0.57 to 0.88) and in patients positive for EGFR mutation (HR 0.24, 0.12 to 0.47) (ranged from 2.7 to 4.1 months versus 4.5 to 7 months). |
| *The basis for the assumed risk (e.g. the median control group risk across studies) is provided in footnotes. The corresponding risk (and its 95% confidence interval) is based on the assumed risk in the comparison group and the relative effect of the intervention (and its 95% CI). | ||||||
| GRADE Working Group grades of evidence | ||||||
| 1We downgraded the quality of evidence by one level because of imprecision based on the wide confidence interval. | ||||||
| Gefitinib compared to chemotherapy for advanced NSCLC | |||||
| Patient or population: advanced NSCLC | |||||
| Outcomes | Illustrative comparative risks* (95% CI) | Relative effect | No of participants | Quality of the evidence | |
| Assumed risk | Corresponding risk | ||||
| Chemotherapy | Gefitinib | ||||
| Skin rash | Study population | RR 2.40 | 1858 | ⊕⊕⊕⊕ | |
| 9 per 1000 | 21 per 1000 | ||||
| Constipation | Study population | RR 0.41 | 1719 | ⊕⊕⊕⊕ | |
| 19 per 1000 | 8 per 1000 | ||||
| Fatigue | Study population | RR 0.16 | 275 | ⊕⊕⊕⊝ | |
| 65 per 1000 | 10 per 1000 | ||||
| Asthenia | Study population | RR 0.51 | 1773 | ⊕⊕⊕⊕ | |
| 79 per 1000 | 40 per 1000 | ||||
| Neurotoxicity | Study population | RR 0.07 | 1529 | ⊕⊕⊕⊕ | |
| 29 per 1000 | 2 per 1000 | ||||
| Neutropenia | Study population | RR 0.04 | 1857 | ⊕⊕⊕⊕ | |
| 505 per 1000 | 20 per 1000 | ||||
| Febrile neutropenia | Study population | RR 0.12 | 1768 | ⊕⊕⊕⊕ | |
| 92 per 1000 | 11 per 1000 | ||||
| *The basis for the assumed risk (e.g. the median control group risk across studies) is provided in footnotes. The corresponding risk (and its 95% confidence interval) is based on the assumed risk in the comparison group and the relative effect of the intervention (and its 95% CI). | |||||
| GRADE Working Group grades of evidence | |||||
| 1We downgraded the quality of evidence by one level because of serious indirectness as one study included only elderly patients (> 70 years old). | |||||
| Author/Year (Study name) | Journal | N | Comparison | Inclusion criteria | Phase | Asian | EGFR mutation | Line? |
| 1. Gefitinib versus placebo | ||||||||
| Goss 2009 (INSTEP) | JCO 27(13):2253‐2260 | 201 | Placebo | Poor PS | II | N | Subgroup | 1st line |
| Thatcher 2005 (ISEL) | Lancet 366:1527‐37 | 1692 | Placebo | — | III | Subset (Chang) | Subgroup (Hirsch) | 2nd line |
| Gaafar 2011 (EORTC08021) | Eur J Cancer (47):2331‐2340 | 173 | Placebo | Maintenance | III | N | N | Maintenance |
| Kelly 2008 (SWOGS0023) | JCO 26(15):2450‐2456 | 243 | Placebo | Consolidation | III | N | N | Maintenance |
| Zhang 2012 (INFORM) | Lancet Oncology 13:466‐475 | 296 | Placebo | Maintenance | III | Y | Subgroup | Maintenance |
| 2. Gefitinib versus chemotherapy | ||||||||
| Crino 2008 (INVITE) | JCO 26(26):4253‐4260 | 196 | Vinorelbine | Elderly patients | II | N | Subgroup | 1st line |
| Lou 2014 | Natl Med J China 94(30): 2337‐2341 | 51 | Carboplatin + paclitaxel | Asian | II | Y | N | 1st line |
| Morere 2010 (IFCT0301) | Lung Cancer 70:301‐307 | 85 | Docetaxel | Poor PS | II | N | N | 1st line |
| Han 2013 (First‐SIGNAL) | JCO 30(10): 1122‐1128 | 313 | Gemcitabine + cisplatin | — | III | Y | Planned Subgroup | 1st line |
| Mok 2009 (IPASS) | NEJM 361(10):947‐957 | 1217 | Carboplatin + paclitaxel | Asian, adenocarcinomas | III | Y | Subgroup | 1st line |
| Maemondo 2010 (NEJ002) | NEJM 362(25):2580‐2588 | 230 | Carboplatin + paclitaxel | Asian, EGFR mutation | III | Y | Y | 1st line |
| Mitsudomi 2010 (WJTOG3405) | Lancet Oncol 11:121‐128 | 177 | Cisplatin + docetaxel | Asian, EGFR mutation | III | Y | Y | 1st line |
| Yang 2014 | Eur J Cancer 50:2219‐2230 | 236 | Pemetrexed + cisplatin | Asian | III | Y | Subgroup | 1st line + maintenance |
| Cufer 2006 (SIGN) | Anti‐cancer Drugs 14:401‐409 | 141 | Docetaxel | Open‐label | II | N | N | 2nd line |
| Dai 2013 | Chin J Lung Cancer 16(8):405‐410 | 46 | Pemetrexed | Asian | II | Y | N | 2nd line |
| Kim 2016 | Cancer Res Treat 48(1):80‐87 | 95 | Pemetrexed | Asian | II | Y | N | 2nd/3rd line |
| Li 2010 | Chinese J Clin Onc 37:16‐18 | 98 | Docetaxel | Asian | II | Y | N | 2nd line |
| Kim 2008 (INTEREST) | Lancet 372:1809‐1818 | 1466 | Docetaxel | — | III | N | Subgroup (Doulliard) | 2nd line |
| Lee 2010 (ISTANA) | Clin Cancer Res 16(4):1307‐1314 | 161 | Docetaxel | Asian | III | Y | N | 2nd/3rd line |
| Maruyama 2008 (V‐15‐32) | JCO 26(26):4244‐4252 | 489 | Docetaxel | Asian | III | Y | Subgroup | 2nd/3rd line |
| Sun 2012 (KSCG‐LU08‐01) | Cancer 118:6234‐6242 | 141 | Pemetrexed | Adenocarcinoma, non‐smoker | III | Y | Subgroup | 2nd line |
| Ahn 2012 | Lung Cancer 77:346‐352 | 73 | Pemetrexed | Asian, never‐smokers | II | Y | N | Maintenance |
| Xu 2015 | Int J Clin Exp Med 8(4):6242‐6246 | 188 | Pemetrexed | Asian | II | Y | N | Maintenance |
| 3. Gefitinib 250 mg versus gefitinib 500 mg | ||||||||
| Fukuoka 2003 (IDEAL I) | JCO 21(12):2237‐2246 | 210 | G250 versus G500 | — | II | N | N | 2rd/3rd line |
| Kris 2003 (IDEAL II) | JAMA 290(16):2149‐2158 | 216 | G250 versus G500 | — | II | N | N | 3rd line |
| Xue 2015 | Int J Clin Exp Med 8(4):6242‐6246 | 188 | G250 versus G500 | Asian | II | Y | N | Maintenance |
| 4. Gefitinib versus gefitinib + chemotherapy | ||||||||
| An 2016 | Pathol Oncol Res 22:763‐768 | 90 | Gefitinib + Pemetrexed | Asian, EGFR mutation | II | Y | Y | 1st line |
| Cheng 2016 | JCO 34(27): 3258‐3266 | 191 | Gefitinib + Pemetrexed | Asian, EGFR mutation | II | Y | Y | 1st line |
| Chen 2007 | Cancer 109:1821‐8 | 48 | Gefitinib + Vinorelbine | Adenocarcinoma | II | N | Subgroup | 3rd line |
| Chen 2011 | J Thor Oncol 6:1110‐1116 | 115 | Gefitinib + Tegafur | Adenocarcinoma | II | Y | Subgroup | 2nd/3rd line |
| 5. Gefitinib + chemotherapy versus chemotherapy | ||||||||
| Giaccone 2004 (INTACT I) | JCO 22(5):777‐784 | 1093 | Gemcitabine + Cisplatin | — | III | N | N | 1st line |
| Herbst 2004 (INTACT II) | JCO 22(5):785‐794 | 1037 | Carboplatin + paclitaxel | — | III | N | N | 1st line |
| Takeda 2010 (WTOG0203) | JCO 28(5):753‐760 | 604 | Platinum doublet | — | III | Y | N | 1st line |
| Yu 2014 | Cancer Biology & Therapy 15:832‐839 | 117 | Pemetrexed + platinum | Asian | II | Y | N | 1st line |
| Soria 2015 (IMPRESS) | Lancet Oncology 16:990‐98 | 265 | Pemetrexed + cisplatin | EGFR mutation positive | III | N | Y | 2nd line |
| EGFR: epidermal growth factor receptor Journals: Cancer Res Treat: Cancer Research and Treatment | ||||||||
| Study | ORR (%) | PFS (months) | OS (months) | ||||||
| 1. Gefitinib versus placebo | Gefitinib | Control | P | Gefitinib | Control | P | Gefitinib | Control | P |
| 1st line | |||||||||
| Goss 2009 | 6 | 1.0 | NS | 1.43 | 1.37 | NS | 3.7 | 2.8 | NS |
| 2nd line | |||||||||
| Thatcher 2005 ISEL | 37.5 | 48.3 | NS | 3 | 2.6 | 0.0006 | 5.6 | 5.1 | 0.087 |
| Maintenance therapy | |||||||||
| Kelly 2008 SWOGS0023 | ‐ | ‐ | ‐ | 8.3 | 11.7 | NS | 23 | 35 | 0.013 |
| Gaafar 2011 EORTC08021 | 12 | 1 | 0.004 | 4.1 | 2.9 | 0.0015 | 10.9 | 9.4 | NS |
| 2. Gefitinib versus placebo (Asian population) | Gefitinib | Control | P | Gefitinib | Control | P | Gefitinib | Control | P |
| Chang 2006 ISEL | 12.4 | 2.1 | 0.01 | 4.4 | 2.2 | 0.008 | 9.5 | 5.5 | 0.01 |
| Zhang 2012 INFORM | 24 | 1 | 0.0001 | 4.8 | 2.6 | < 0.0001 | 18.7 | 16.0 | NS |
| 3. Gefitinib versus placebo (EGFR mutation positive) | Gefitinib | Control | P | Gefitinib | Control | P | Gefitinib | Control | P |
| Zhang 2012 INFORM | ‐ | ‐ | ‐ | 16.6 | 2.8 | 0.0063 | 46.87 | 20.97 | 0.036 |
| Gefitinib vs chemotherapy | |||||||||
| 4. General population | Gefitinib | Chemo | P | Gefitinib | Chemo | P | Gefitinib | Chemo | P |
| versus 1st line chemotherapy | |||||||||
| Crino 2008 INVITE | 3.1 | 5.1 | ‐ | 2.7 | 2.9 | NS | 5.9 | 8 | NS |
| Morere 2010 IFCT0301 | ‐ | ‐ | ‐ | 1.9 | 2 | 0.078 | 2.2 | 3.5 | 0.088 |
| Morere 2010 IFCT0301 (Adenocarcinoma) | ‐ | ‐ | ‐ | 1.9 | 2.1 | 0.272 | 2.3 | 4.4 | NS |
| versus 2nd line chemotherapy | |||||||||
| Cufer 2006 SIGN | 13.2 | 13.7 | NS | 7.5 | 7.1 | NS | 3 | 3.4 | NS |
| Kim 2008 INTEREST | 9.1 | 7.6 | NS | 2.2 | 2.7 | NS | 7.6 | 8 | NS |
| Kim 2008 INTEREST | ‐ | ‐ | ‐ | ‐ | ‐ | ‐ | 8.5 | 8.9 | NS |
| 5. Asian population | Gefitinib | Chemo | P | Gefitinib | Chemo | P | Gefitinib | Chemo | P |
| versus 1st line chemotherapy | |||||||||
| Lou 2014 | 36 | 42.3 | NS | 4.2 | 8.3 | NS | 14.4 | 15 | NS |
| Maemondo 2010 (EGFR mutation positive) | 73.7 | 30.7 | < 0.001 | 10.8 | 5.4 | < 0.001 | 30.5 | 23.6 | NS |
| Mitsudomi 2010 WJTOG (EGFR mutation positive) | 62.1 | 32.2 | < 0.0001 | 9.2 | 6.3 | < 0.0001 | ‐ | ‐ | ‐ |
| Mok 2009 IPASS | 43 | 32.2 | < 0.001 | 5.7 | 5.8 | NS | 18.6 | 17.3 | NS |
| Han 2012 First‐SIGNAL (adenocarcinoma) | 55.4 | 46 | NS | 5.8 | 6.4 | NS | 22.3 | 22.9 | NS |
| Yang 2014 (Asian) | 47.5 | 41.5 | NS | 9.63 | 8.38 | NS | 27.9 | 26.9 | NS |
| versus 2nd line chemotherapy | |||||||||
| Dai 2013 | 17.4 | 13 | NS | 4.4 | 3.1 | NS | ‐ | ‐ | ‐ |
| Kim 2016 | 8 | 13 | NS | 2 | 2 | NS | 8.5 | 8.5 | NS |
| Li 2010 | 22.4 | 18.8 | NS | ‐ | ‐ | ‐ | 7.1 | 6.9 | NS |
| Kim 2008 INTEREST (subgroup) | ‐ | ‐ | ‐ | ‐ | ‐ | ‐ | 10.4 | 12.2 | NS |
| Lee 2010 ISTANA | 28.1 | 7.6 | 0.0007 | 3.3 | 3.4 | NS | 14.1 | 12.2 | NS |
| Maruyama 2008 V‐15‐32 | 22.5 | 12.8 | 0.009 | 2 | 2 | NS | 11.5 | 14 | NS |
| Sun 2012 KCSG‐LU08‐01 (adenocarcinoma, subgroup) | 58.8 | 22.4 | < 0.001 | 9.0 | 3.0 | 0.0006 | 22.2 | 18.9 | NS |
| versus maintenance therapy | |||||||||
| Ahn 2012 (Asian) | 46 | 35 | NS | 9.95 | 6.83 | NS | ‐ | ‐ | ‐ |
| Xu 2015 (Asian) | 18.1 | 29.8 | NS | ‐ | ‐ | ‐ | ‐ | ‐ | ‐ |
| 6. EGFR mutation positive | Gefitinib | Chemo | P | Gefitinib | Chemo | P | Gefitinib | Chemo | P |
| versus 1st line chemotherapy | |||||||||
| Maemondo 2010 (EGFR mutation positive) | 73.7 | 30.7 | < 0.001 | 10.8 | 5.4 | < 0.001 | 30.5 | 23.6 | NS |
| Mitsudomi 2010 WJTOG (EGFR mutation positive) | 62.1 | 32.2 | < 0.0001 | 9.2 | 6.3 | < 0.0001 | ‐ | ‐ | ‐ |
| Mok 2009 IPASS (subgroup) | 71.2 | 47.3 | < 0.001 | ‐ | ‐ | ‐ | ‐ | ‐ | ‐ |
| Han 2012 First‐SIGNAL (subgroup) | 84.6 | 37.5 | 0.002 | ‐ | ‐ | ‐ | ‐ | ‐ | ‐ |
| Yang 2014 (subgroup) | 70.8 | 65.4 | NS | 16.62 | 12.91 | NS | 45.7 | 32.4 | 0.255 |
| versus 2nd line chemotherapy | |||||||||
| INTEREST Doulliard 2010 (subgroup) | 42.1 | 21.1 | 0.04 | 7 | 4.1 | 0.001 | 14.2 | 16.6 | NS |
| Maruyama 2008 (subgroup) | 67 | 46 | ‐ | ‐ | ‐ | ‐ | ‐ | ‐ | ‐ |
| Sun 2012 KCSG‐LU08‐01 (subgroup) | ‐ | ‐ | ‐ | 15.7 | 2.9 | 0.005 | ‐ | ‐ | ‐ |
| 7. Gefitinib 250 mg versus gefitinib 500 mg | 250 mg | 500 mg | P | 250 mg | 500 mg | P | 250 mg | 500 mg | P |
| 2nd+ line | |||||||||
| Fukuoka 2003 | 18.4 | 19 | NS | 2.7 | 2.8 | NS | 7.6 | 8 | NS |
| Kris 2004 | 12 | 9 | NS | ‐ | ‐ | ‐ | 7 | 6 | NS |
| Maintenance therapy | |||||||||
| Xue 2015 (Asian) | 12.5 | 12.5 | NS | ‐ | ‐ | ‐ | ‐ | ‐ | ‐ |
| 8. Gefitinib versus gefitinib + chemotherapy | Gefitinib | G + Chemo | P | Gefitinib | G + Chemo | P | Gefitinib | G + Chemo | P |
| 1st line | |||||||||
| An 2016 | 73.33 | 80 | NS | 14 | 18 | < 0.05 | 32 | 34 | NS |
| Cheng 2016 | 74 | 80 | NS | 10.9 | 15.8 | 0.014 | ‐ | ‐ | ‐ |
| 2nd+ line | |||||||||
| Chen 2007(Asian, adenocarcinoma) | 55.6 | 52.4 | NS | 7.1 | 12.8 | NS | 13.3 | 23.4 | NS |
| Chen 2011(Asian, adenocarcinoma) | 35 | 37 | NS | 5.3 | 8.3 | 0.04 | ‐ | ‐ | ‐ |
| Chen 2011 (EGFR mutation positive subgroup) | ‐ | ‐ | ‐ | 7.6 | 14.4 | 0.0061 | ‐ | ‐ | ‐ |
| 9. Gefitinib + chemotherapy versus chemotherapy | 250 mg + Chemo | Chemo | P | 250 mg + Chemo | Chemo | P | 250 mg + Chemo | Chemo | P |
| 1st line | |||||||||
| Giaccone 2004 | 51.2 | 47.2 | NS | 5.8 | 6 | NS | 9.9 | 10.9 | NS |
| Herbst 2004 | 30.4 | 28.7 | NS | 5.3 | 5 | NS | 9.8 | 9.9 | NS |
| Takeda 2010 (Asian) | 34.2 | 29.3 | NS | 4.3 | 4.6 | < 0.001 | 12.9 | 13.7 | NS |
| Yu 2014 (Asian) | 47.4 | 50 | NS | 7.9 | 7 | NS | 25.4 | 20.5 | NS |
| 2nd line | |||||||||
| Soria 2015 IMPRESS (EGFR mutation positive) | 32 | 34 | NS | 5.4 | 5.4 | NS | 14.8 | 17.2 | NS |
| Chemo: chemotherapy | |||||||||
| Outcome or subgroup title | No. of studies | No. of participants | Statistical method | Effect size |
| 1 HR Overall survival Show forest plot | 4 | Hazard Ratio (Random, 95% CI) | Subtotals only | |
| 1.1 G(250) vs P = 1st line | 1 | Hazard Ratio (Random, 95% CI) | 0.84 [0.62, 1.14] | |
| 1.2 G(250) vs P = 2nd line | 1 | Hazard Ratio (Random, 95% CI) | 0.89 [0.79, 1.01] | |
| 1.3 G(500) vs P = Maintenance | 2 | Hazard Ratio (Random, 95% CI) | 1.14 [0.61, 2.14] | |
| 2 HR Progression‐free survival Show forest plot | 4 | Hazard Ratio (Random, 95% CI) | Subtotals only | |
| 2.1 G(250) vs P = 1st line | 1 | Hazard Ratio (Random, 95% CI) | 0.82 [0.60, 1.12] | |
| 2.2 G(250) vs P = 2nd line | 1 | Hazard Ratio (Random, 95% CI) | 0.82 [0.75, 0.90] | |
| 2.3 G(500) vs P = Maintenance | 2 | Hazard Ratio (Random, 95% CI) | 0.70 [0.53, 0.91] | |
| 3 1‐year survival rate Show forest plot | 2 | Risk Ratio (M‐H, Fixed, 95% CI) | Subtotals only | |
| 3.1 G(250) vs P = 2nd line | 1 | 1439 | Risk Ratio (M‐H, Fixed, 95% CI) | 1.28 [1.05, 1.57] |
| 3.2 G(500) vs P = Maintenance | 1 | 243 | Risk Ratio (M‐H, Fixed, 95% CI) | 0.90 [0.78, 1.04] |
| 4 Skin rash Show forest plot | 3 | 2060 | Risk Ratio (M‐H, Fixed, 95% CI) | 7.92 [1.46, 43.03] |
| 4.1 G(250) vs P = 1st line | 1 | 201 | Risk Ratio (M‐H, Fixed, 95% CI) | 0.0 [0.0, 0.0] |
| 4.2 G(250) vs P = 2nd line | 1 | 1688 | Risk Ratio (M‐H, Fixed, 95% CI) | 8.98 [1.20, 67.13] |
| 4.3 G(250) vs P = Maintenance | 1 | 171 | Risk Ratio (M‐H, Fixed, 95% CI) | 5.06 [0.25, 103.82] |
| 5 Pruritus Show forest plot | 2 | 1889 | Risk Ratio (M‐H, Fixed, 95% CI) | 2.00 [0.22, 17.82] |
| 5.1 G(250) vs P = 1st line | 1 | 201 | Risk Ratio (M‐H, Fixed, 95% CI) | 0.0 [0.0, 0.0] |
| 5.2 G(250) vs P = 2nd line | 1 | 1688 | Risk Ratio (M‐H, Fixed, 95% CI) | 2.00 [0.22, 17.82] |
| 6 Diarrhoea Show forest plot | 3 | 2060 | Risk Ratio (M‐H, Fixed, 95% CI) | 2.48 [1.15, 5.35] |
| 6.1 G(250) vs P = 1st line | 1 | 201 | Risk Ratio (M‐H, Fixed, 95% CI) | 1.01 [0.21, 4.89] |
| 6.2 G(250) vs P = 2nd line | 1 | 1688 | Risk Ratio (M‐H, Fixed, 95% CI) | 3.09 [1.21, 7.91] |
| 6.3 G(250) vs P = Maintenance | 1 | 171 | Risk Ratio (M‐H, Fixed, 95% CI) | 3.03 [0.13, 73.47] |
| 7 Constipation Show forest plot | 1 | 201 | Risk Ratio (M‐H, Fixed, 95% CI) | 1.01 [0.06, 15.93] |
| 7.1 G(250) vs P = 1st line | 1 | 201 | Risk Ratio (M‐H, Fixed, 95% CI) | 1.01 [0.06, 15.93] |
| 8 Nausea Show forest plot | 2 | 1889 | Risk Ratio (M‐H, Random, 95% CI) | 0.65 [0.03, 12.44] |
| 8.1 G(250) vs P = 1st line | 1 | 201 | Risk Ratio (M‐H, Random, 95% CI) | 0.11 [0.01, 2.06] |
| 8.2 G(250) vs P = 2nd line | 1 | 1688 | Risk Ratio (M‐H, Random, 95% CI) | 2.25 [0.49, 10.36] |
| 9 Vomiting Show forest plot | 2 | 1859 | Risk Ratio (M‐H, Fixed, 95% CI) | 3.21 [0.83, 12.38] |
| 9.1 G(250) vs P = 2nd line | 1 | 1688 | Risk Ratio (M‐H, Fixed, 95% CI) | 3.24 [0.73, 14.33] |
| 9.2 G(250) vs P = Maintenance | 1 | 171 | Risk Ratio (M‐H, Fixed, 95% CI) | 3.03 [0.13, 73.47] |
| 10 Anorexia Show forest plot | 3 | 2060 | Risk Ratio (M‐H, Fixed, 95% CI) | 1.22 [0.64, 2.33] |
| 10.1 G(250) vs P = 1st line | 1 | 201 | Risk Ratio (M‐H, Fixed, 95% CI) | 5.05 [0.25, 103.87] |
| 10.2 G(250) vs P = 2nd line | 1 | 1688 | Risk Ratio (M‐H, Fixed, 95% CI) | 1.18 [0.59, 2.37] |
| 10.3 G(250) vs P = Maintenance | 1 | 171 | Risk Ratio (M‐H, Fixed, 95% CI) | 0.34 [0.01, 8.16] |
| 11 Fatigue Show forest plot | 2 | Risk Ratio (M‐H, Fixed, 95% CI) | Subtotals only | |
| 11.1 G(250) vs P = 1st line | 1 | 201 | Risk Ratio (M‐H, Fixed, 95% CI) | 0.76 [0.27, 2.10] |
| 11.2 G(250) vs P = Maintenance | 1 | 171 | Risk Ratio (M‐H, Fixed, 95% CI) | 4.05 [0.46, 35.47] |
| 12 Asthenia Show forest plot | 1 | Risk Ratio (M‐H, Fixed, 95% CI) | Subtotals only | |
| 12.1 G(250) vs P = 2nd line | 1 | 1688 | Risk Ratio (M‐H, Fixed, 95% CI) | 1.20 [0.66, 2.17] |
| 13 Respiratory tract infection Show forest plot | 2 | 1889 | Risk Ratio (M‐H, Random, 95% CI) | 0.53 [0.07, 3.83] |
| 13.1 G(250) vs P = 1st line | 1 | 201 | Risk Ratio (M‐H, Random, 95% CI) | 0.11 [0.01, 2.06] |
| 13.2 G(250) vs P = 2nd line | 1 | 1688 | Risk Ratio (M‐H, Random, 95% CI) | 1.00 [0.54, 1.84] |
| 14 Dyspnoea Show forest plot | 3 | 2060 | Risk Ratio (M‐H, Random, 95% CI) | 0.98 [0.59, 1.63] |
| 14.1 G(250) vs P = 1st line | 1 | 201 | Risk Ratio (M‐H, Random, 95% CI) | 1.85 [0.71, 4.81] |
| 14.2 G(250) vs P = 2nd line | 1 | 1688 | Risk Ratio (M‐H, Random, 95% CI) | 0.83 [0.49, 1.42] |
| 14.3 G(250) vs P = Maintenance | 1 | 171 | Risk Ratio (M‐H, Random, 95% CI) | 0.67 [0.20, 2.31] |
| 15 Anaemia Show forest plot | 1 | 201 | Risk Ratio (M‐H, Fixed, 95% CI) | 7.07 [0.37, 135.12] |
| 15.1 G(250) vs P = 1st line | 1 | 201 | Risk Ratio (M‐H, Fixed, 95% CI) | 7.07 [0.37, 135.12] |
| 16 Abdominal pain Show forest plot | 1 | 201 | Risk Ratio (M‐H, Fixed, 95% CI) | 0.51 [0.05, 5.48] |
| 16.1 G(250) vs P = 1st line | 1 | 201 | Risk Ratio (M‐H, Fixed, 95% CI) | 0.51 [0.05, 5.48] |
| 17 Increased ALT Show forest plot | 1 | 171 | Risk Ratio (M‐H, Fixed, 95% CI) | 9.11 [1.18, 70.32] |
| 17.1 G(250) vs P = Maintenance | 1 | 171 | Risk Ratio (M‐H, Fixed, 95% CI) | 9.11 [1.18, 70.32] |
| 18 Increased AST Show forest plot | 1 | 171 | Risk Ratio (M‐H, Fixed, 95% CI) | 7.08 [0.89, 56.34] |
| 18.1 G(250) vs P = Maintenance | 1 | 171 | Risk Ratio (M‐H, Fixed, 95% CI) | 7.08 [0.89, 56.34] |
| 19 Neutropenia Show forest plot | 1 | 171 | Risk Ratio (M‐H, Fixed, 95% CI) | 3.03 [0.13, 73.47] |
| 19.1 G(250) vs P = Maintenance | 1 | 171 | Risk Ratio (M‐H, Fixed, 95% CI) | 3.03 [0.13, 73.47] |
| 20 Anaemia Show forest plot | 1 | 171 | Risk Ratio (M‐H, Fixed, 95% CI) | 0.20 [0.01, 4.15] |
| 20.1 G(250) vs P = Maintenance | 1 | 171 | Risk Ratio (M‐H, Fixed, 95% CI) | 0.20 [0.01, 4.15] |
| 21 Thrombocytopaenia Show forest plot | 1 | 171 | Risk Ratio (M‐H, Fixed, 95% CI) | 3.03 [0.13, 73.47] |
| 21.1 G(250) vs P = Maintenance | 1 | 171 | Risk Ratio (M‐H, Fixed, 95% CI) | 3.03 [0.13, 73.47] |
| 22 Overall response rate Show forest plot | 3 | Risk Ratio (M‐H, Fixed, 95% CI) | Subtotals only | |
| 22.1 G(250) vs P = 1st line | 1 | 201 | Risk Ratio (M‐H, Fixed, 95% CI) | 6.06 [0.74, 49.43] |
| 22.2 G(250) vs P= 2nd line | 1 | 1439 | Risk Ratio (M‐H, Fixed, 95% CI) | 6.42 [2.82, 14.64] |
| 22.3 G(250) vs P = Maintenance | 1 | 173 | Risk Ratio (M‐H, Fixed, 95% CI) | 10.12 [1.32, 77.33] |
| 23 Disease control rate Show forest plot | 3 | Risk Ratio (M‐H, Fixed, 95% CI) | Subtotals only | |
| 23.1 G(250) vs P = 1st line | 1 | 201 | Risk Ratio (M‐H, Fixed, 95% CI) | 1.36 [0.86, 2.16] |
| 23.2 G(250) vs P = 2nd line | 1 | 1439 | Risk Ratio (M‐H, Fixed, 95% CI) | 1.24 [1.06, 1.44] |
| 23.3 G(250) vs P = Maintenance | 1 | 173 | Risk Ratio (M‐H, Fixed, 95% CI) | 1.21 [1.00, 1.46] |
| Outcome or subgroup title | No. of studies | No. of participants | Statistical method | Effect size |
| 1 HR Overall survival Show forest plot | 2 | Hazard Ratio (Fixed, 95% CI) | Subtotals only | |
| 1.1 G(250) vs P = 2nd line | 1 | Hazard Ratio (Fixed, 95% CI) | 0.66 [0.48, 0.91] | |
| 1.2 G(250) vs P = Maintenance | 1 | Hazard Ratio (Fixed, 95% CI) | 0.88 [0.68, 1.14] | |
| 2 HR Progression‐free survival Show forest plot | 2 | Hazard Ratio (Fixed, 95% CI) | Subtotals only | |
| 2.1 G(250) vs P = 2nd line | 1 | Hazard Ratio (Fixed, 95% CI) | 0.69 [0.52, 0.91] | |
| 2.2 G(250) vs P = Maintenance | 1 | Hazard Ratio (Fixed, 95% CI) | 0.42 [0.33, 0.54] | |
| 3 1‐year survival rate Show forest plot | 1 | Risk Ratio (M‐H, Fixed, 95% CI) | Subtotals only | |
| 3.1 G(250) vs P = 2nd line | 1 | 342 | Risk Ratio (M‐H, Fixed, 95% CI) | 1.75 [1.20, 2.55] |
| 4 Overall response rate Show forest plot | 2 | Risk Ratio (M‐H, Random, 95% CI) | Subtotals only | |
| 4.1 G(250) vs P = 2nd line | 1 | 306 | Risk Ratio (M‐H, Random, 95% CI) | 6.03 [1.46, 24.91] |
| 4.2 G(250) vs P = Maintenance | 1 | 296 | Risk Ratio (M‐H, Random, 95% CI) | 35.00 [4.86, 252.15] |
| Outcome or subgroup title | No. of studies | No. of participants | Statistical method | Effect size |
| 1 HR Overall survival Show forest plot | 1 | Hazard Ratio (Fixed, 95% CI) | Subtotals only | |
| 1.1 G(250) vs P = Maintenance | 1 | Hazard Ratio (Fixed, 95% CI) | 0.39 [0.15, 0.98] | |
| 2 HR Progression‐free survival Show forest plot | 1 | Hazard Ratio (Fixed, 95% CI) | Subtotals only | |
| 2.1 G(250) vs P = Maintenance | 1 | Hazard Ratio (Fixed, 95% CI) | 0.17 [0.07, 0.41] | |
| Outcome or subgroup title | No. of studies | No. of participants | Statistical method | Effect size |
| 1 HR Overall survival Show forest plot | 2 | Hazard Ratio (Fixed, 95% CI) | Subtotals only | |
| 1.1 G vs vinorelbine = 1st line | 1 | Hazard Ratio (Fixed, 95% CI) | 0.98 [0.66, 1.46] | |
| 1.2 G vs docetaxel = 2nd line | 1 | Hazard Ratio (Fixed, 95% CI) | 1.02 [0.91, 1.15] | |
| 2 HR Progression‐free survival Show forest plot | 2 | Hazard Ratio (Fixed, 95% CI) | Subtotals only | |
| 2.1 G vs vinorelbine = 1st line | 1 | Hazard Ratio (Fixed, 95% CI) | 1.19 [0.86, 1.65] | |
| 2.2 G vs docetaxel = 2nd line | 1 | Hazard Ratio (Fixed, 95% CI) | 1.04 [0.92, 1.17] | |
| 3 1‐year survival rate Show forest plot | 3 | 1741 | Risk Ratio (M‐H, Fixed, 95% CI) | 0.94 [0.82, 1.08] |
| 3.1 G vs vinorelbine = 1st line | 1 | 190 | Risk Ratio (M‐H, Fixed, 95% CI) | 1.02 [0.69, 1.52] |
| 3.2 G vs docetaxel = 1st line | 1 | 85 | Risk Ratio (M‐H, Fixed, 95% CI) | 0.39 [0.08, 1.90] |
| 3.3 G vs docetaxel = 2nd line | 1 | 1466 | Risk Ratio (M‐H, Fixed, 95% CI) | 0.94 [0.82, 1.09] |
| 4 Skin rash Show forest plot | 4 | 1858 | Risk Ratio (M‐H, Fixed, 95% CI) | 2.40 [1.08, 5.31] |
| 4.1 G vs vinorelbine = 1st line | 1 | 190 | Risk Ratio (M‐H, Fixed, 95% CI) | 5.11 [0.25, 104.94] |
| 4.2 G vs docetaxel = 1st line | 1 | 85 | Risk Ratio (M‐H, Fixed, 95% CI) | 0.49 [0.05, 5.19] |
| 4.3 G vs docetaxel = 2nd line | 2 | 1583 | Risk Ratio (M‐H, Fixed, 95% CI) | 2.82 [1.11, 7.13] |
| 5 Constipation Show forest plot | 3 | 1719 | Risk Ratio (M‐H, Fixed, 95% CI) | 0.41 [0.17, 0.97] |
| 5.1 G vs vinorelbine = 1st line | 1 | 190 | Risk Ratio (M‐H, Fixed, 95% CI) | 0.20 [0.01, 4.20] |
| 5.2 G vs docetaxel = 1st line | 1 | 85 | Risk Ratio (M‐H, Fixed, 95% CI) | 0.33 [0.01, 7.78] |
| 5.3 G vs docetaxel = 2nd line | 1 | 1444 | Risk Ratio (M‐H, Fixed, 95% CI) | 0.45 [0.17, 1.18] |
| 6 Fatigue Show forest plot | 2 | 275 | Risk Ratio (M‐H, Fixed, 95% CI) | 0.16 [0.03, 0.88] |
| 6.1 G vs vinorelbine = 1st line | 1 | 190 | Risk Ratio (M‐H, Fixed, 95% CI) | 0.07 [0.00, 1.18] |
| 6.2 G vs docetaxel = 1st line | 1 | 85 | Risk Ratio (M‐H, Fixed, 95% CI) | 0.49 [0.05, 5.19] |
| 7 Asthenia Show forest plot | 3 | 1773 | Risk Ratio (M‐H, Fixed, 95% CI) | 0.51 [0.35, 0.75] |
| 7.1 G vs vinorelbine = 1st line | 1 | 190 | Risk Ratio (M‐H, Fixed, 95% CI) | 0.15 [0.01, 2.79] |
| 7.2 G vs docetaxel = 2nd line | 2 | 1583 | Risk Ratio (M‐H, Fixed, 95% CI) | 0.53 [0.36, 0.78] |
| 8 Neurotoxicity Show forest plot | 2 | 1529 | Risk Ratio (M‐H, Fixed, 95% CI) | 0.07 [0.01, 0.34] |
| 8.1 G vs docetaxel = 1st line | 1 | 85 | Risk Ratio (M‐H, Fixed, 95% CI) | 0.09 [0.01, 1.56] |
| 8.2 G vs docetaxel = 2nd line | 1 | 1444 | Risk Ratio (M‐H, Fixed, 95% CI) | 0.06 [0.01, 0.43] |
| 9 Neutropenia Show forest plot | 4 | 1857 | Risk Ratio (M‐H, Fixed, 95% CI) | 0.04 [0.02, 0.06] |
| 9.1 G vs vinorelbine = 1st line | 1 | 190 | Risk Ratio (M‐H, Fixed, 95% CI) | 0.03 [0.00, 0.43] |
| 9.2 G vs docetaxel = 1st line | 1 | 85 | Risk Ratio (M‐H, Fixed, 95% CI) | 0.15 [0.04, 0.63] |
| 9.3 G vs docetaxel = 2nd line | 2 | 1582 | Risk Ratio (M‐H, Fixed, 95% CI) | 0.04 [0.02, 0.06] |
| 10 Leukopenia Show forest plot | 2 | 324 | Risk Ratio (M‐H, Fixed, 95% CI) | 0.03 [0.00, 0.22] |
| 10.1 G vs vinorelbine = 1st line | 1 | 190 | Risk Ratio (M‐H, Fixed, 95% CI) | 0.07 [0.00, 1.18] |
| 10.2 G vs docetaxel = 2nd line | 1 | 134 | Risk Ratio (M‐H, Fixed, 95% CI) | 0.02 [0.00, 0.32] |
| 11 Febrile neutropenia Show forest plot | 3 | 1768 | Risk Ratio (M‐H, Fixed, 95% CI) | 0.12 [0.06, 0.23] |
| 11.1 G vs vinorelbine = 1st line | 1 | 190 | Risk Ratio (M‐H, Fixed, 95% CI) | 0.07 [0.00, 1.18] |
| 11.2 G vs docetaxel = 2nd line | 2 | 1578 | Risk Ratio (M‐H, Fixed, 95% CI) | 0.13 [0.06, 0.24] |
| 12 Pruritus Show forest plot | 1 | 139 | Risk Ratio (M‐H, Fixed, 95% CI) | 5.22 [0.26, 106.74] |
| 12.1 G vs docetaxel = 2nd line | 1 | 139 | Risk Ratio (M‐H, Fixed, 95% CI) | 5.22 [0.26, 106.74] |
| 13 Diarrhoea Show forest plot | 4 | 1858 | Risk Ratio (M‐H, Fixed, 95% CI) | 0.81 [0.48, 1.34] |
| 13.1 G vs vinorelbine = 1st line | 1 | 190 | Risk Ratio (M‐H, Fixed, 95% CI) | 1.02 [0.26, 3.96] |
| 13.2 G vs docetaxel = 1st line | 1 | 85 | Risk Ratio (M‐H, Fixed, 95% CI) | 0.98 [0.14, 6.62] |
| 13.3 G vs docetaxel = 2nd line | 2 | 1583 | Risk Ratio (M‐H, Fixed, 95% CI) | 0.76 [0.43, 1.35] |
| 14 Vomiting Show forest plot | 2 | 1583 | Risk Ratio (M‐H, Fixed, 95% CI) | 0.55 [0.19, 1.63] |
| 14.1 G vs docetaxel = 2nd line | 2 | 1583 | Risk Ratio (M‐H, Fixed, 95% CI) | 0.55 [0.19, 1.63] |
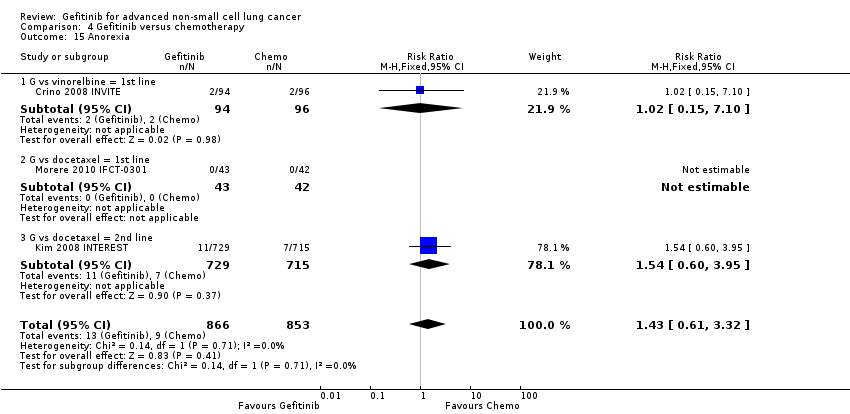
| 15 Anorexia Show forest plot | 3 | 1719 | Risk Ratio (M‐H, Fixed, 95% CI) | 1.43 [0.61, 3.32] |
| 15.1 G vs vinorelbine = 1st line | 1 | 190 | Risk Ratio (M‐H, Fixed, 95% CI) | 1.02 [0.15, 7.10] |
| 15.2 G vs docetaxel = 1st line | 1 | 85 | Risk Ratio (M‐H, Fixed, 95% CI) | 0.0 [0.0, 0.0] |
| 15.3 G vs docetaxel = 2nd line | 1 | 1444 | Risk Ratio (M‐H, Fixed, 95% CI) | 1.54 [0.60, 3.95] |
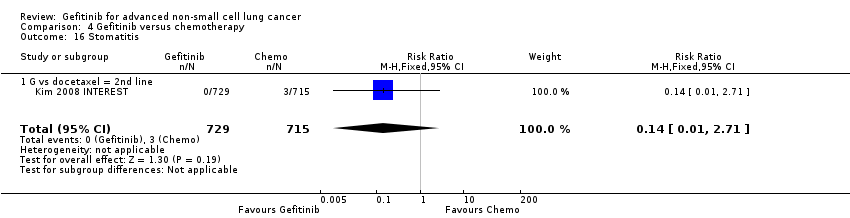
| 16 Stomatitis Show forest plot | 1 | 1444 | Risk Ratio (M‐H, Fixed, 95% CI) | 0.14 [0.01, 2.71] |
| 16.1 G vs docetaxel = 2nd line | 1 | 1444 | Risk Ratio (M‐H, Fixed, 95% CI) | 0.14 [0.01, 2.71] |
| 17 Arthralgia/myalgia Show forest plot | 2 | 1529 | Risk Ratio (M‐H, Fixed, 95% CI) | 0.25 [0.03, 2.19] |
| 17.1 G vs docetaxel = 1st line | 1 | 85 | Risk Ratio (M‐H, Fixed, 95% CI) | 0.0 [0.0, 0.0] |
| 17.2 G vs docetaxel = 2nd line | 1 | 1444 | Risk Ratio (M‐H, Fixed, 95% CI) | 0.25 [0.03, 2.19] |
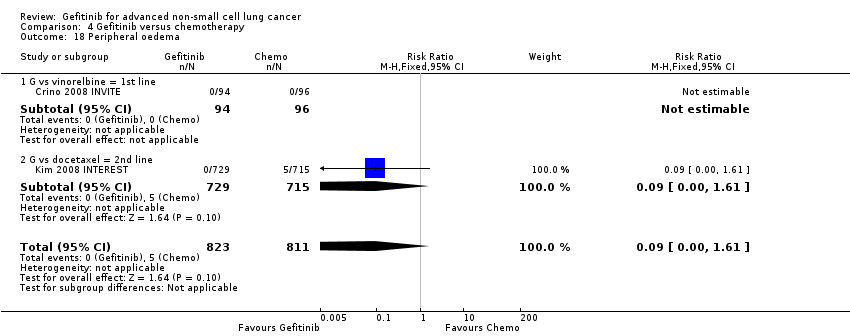
| 18 Peripheral oedema Show forest plot | 2 | 1634 | Risk Ratio (M‐H, Fixed, 95% CI) | 0.09 [0.00, 1.61] |
| 18.1 G vs vinorelbine = 1st line | 1 | 190 | Risk Ratio (M‐H, Fixed, 95% CI) | 0.0 [0.0, 0.0] |
| 18.2 G vs docetaxel = 2nd line | 1 | 1444 | Risk Ratio (M‐H, Fixed, 95% CI) | 0.09 [0.00, 1.61] |
| 19 Respiratory tract infection Show forest plot | 1 | 1444 | Risk Ratio (M‐H, Fixed, 95% CI) | 0.90 [0.52, 1.57] |
| 19.1 G vs docetaxel = 2nd line | 1 | 1444 | Risk Ratio (M‐H, Fixed, 95% CI) | 0.90 [0.52, 1.57] |
| 20 Dyspnoea Show forest plot | 3 | 1773 | Risk Ratio (M‐H, Fixed, 95% CI) | 0.82 [0.57, 1.16] |
| 20.1 G vs vinorelbine = 1st line | 1 | 190 | Risk Ratio (M‐H, Fixed, 95% CI) | 0.26 [0.03, 2.24] |
| 20.2 G vs docetaxel = 2nd line | 2 | 1583 | Risk Ratio (M‐H, Fixed, 95% CI) | 0.85 [0.59, 1.22] |
| 21 Cough Show forest plot | 2 | 1583 | Risk Ratio (M‐H, Fixed, 95% CI) | 1.18 [0.36, 3.84] |
| 21.1 G vs docetaxel = 2nd line | 2 | 1583 | Risk Ratio (M‐H, Fixed, 95% CI) | 1.18 [0.36, 3.84] |
| 22 Anaemia Show forest plot | 4 | 1853 | Risk Ratio (M‐H, Fixed, 95% CI) | 0.70 [0.36, 1.36] |
| 22.1 G vs vinorelbine = 1st line | 1 | 190 | Risk Ratio (M‐H, Fixed, 95% CI) | 0.34 [0.01, 8.25] |
| 22.2 G vs docetaxel = 1st line | 1 | 85 | Risk Ratio (M‐H, Fixed, 95% CI) | 0.14 [0.01, 2.62] |
| 22.3 G vs docetaxel = 2nd line | 2 | 1578 | Risk Ratio (M‐H, Fixed, 95% CI) | 0.86 [0.42, 1.75] |
| 23 Thrombocytopenia Show forest plot | 2 | 219 | Risk Ratio (M‐H, Fixed, 95% CI) | 3.0 [0.12, 72.35] |
| 23.1 G vs docetaxel = 1st line | 1 | 85 | Risk Ratio (M‐H, Fixed, 95% CI) | 0.0 [0.0, 0.0] |
| 23.2 G vs docetaxel = 2nd line | 1 | 134 | Risk Ratio (M‐H, Fixed, 95% CI) | 3.0 [0.12, 72.35] |
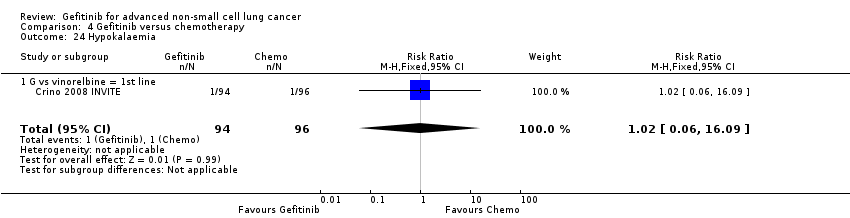
| 24 Hypokalaemia Show forest plot | 1 | 190 | Risk Ratio (M‐H, Fixed, 95% CI) | 1.02 [0.06, 16.09] |
| 24.1 G vs vinorelbine = 1st line | 1 | 190 | Risk Ratio (M‐H, Fixed, 95% CI) | 1.02 [0.06, 16.09] |
| 25 Pyrexia Show forest plot | 3 | 1773 | Risk Ratio (M‐H, Fixed, 95% CI) | 0.59 [0.14, 2.47] |
| 25.1 G vs vinorelbine = 1st line | 1 | 190 | Risk Ratio (M‐H, Fixed, 95% CI) | 1.02 [0.06, 16.09] |
| 25.2 G vs docetaxel = 2nd line | 2 | 1583 | Risk Ratio (M‐H, Fixed, 95% CI) | 0.49 [0.09, 2.67] |
| 26 Overall response rate Show forest plot | 2 | Risk Ratio (M‐H, Fixed, 95% CI) | Subtotals only | |
| 26.1 G vs docetaxel = 2nd line | 2 | 1607 | Risk Ratio (M‐H, Fixed, 95% CI) | 1.16 [0.85, 1.59] |
| 27 Disease control rate Show forest plot | 2 | Risk Ratio (M‐H, Fixed, 95% CI) | Subtotals only | |
| 27.1 G vs docetaxel = 1st line | 1 | 190 | Risk Ratio (M‐H, Fixed, 95% CI) | 0.82 [0.61, 1.10] |
| 27.2 G vs docetaxel = 2nd line | 1 | 141 | Risk Ratio (M‐H, Fixed, 95% CI) | 1.07 [0.82, 1.40] |
| 28 FACT‐L QOL improvement rate Show forest plot | 2 | 1656 | Mean Difference (IV, Fixed, 95% CI) | 10.50 [9.55, 11.45] |
| 28.1 G vs vinorelbine = 1st line | 1 | 190 | Mean Difference (IV, Fixed, 95% CI) | 13.4 [8.25, 18.55] |
| 28.2 G vs docetaxel = 2nd line | 1 | 1466 | Mean Difference (IV, Fixed, 95% CI) | 10.40 [9.43, 11.37] |
| 29 LCS QOL improvement rate Show forest plot | 2 | 1656 | Mean Difference (IV, Fixed, 95% CI) | 3.63 [3.08, 4.19] |
| 29.1 G vs vinorelbine = 1st line | 1 | 190 | Mean Difference (IV, Fixed, 95% CI) | 3.80 [2.42, 5.18] |
| 29.2 G vs docetaxel = 2nd line | 1 | 1466 | Mean Difference (IV, Fixed, 95% CI) | 3.60 [2.99, 4.21] |
| 30 TOI QOL improvement rate Show forest plot | 2 | 1656 | Mean Difference (IV, Random, 95% CI) | 9.87 [1.26, 18.48] |
| 30.1 G vs vinorelbine = 1st line | 1 | 190 | Mean Difference (IV, Random, 95% CI) | 16.60 [4.61, 28.59] |
| 30.2 G vs docetaxel = 2nd line | 1 | 1466 | Mean Difference (IV, Random, 95% CI) | 7.0 [5.97, 8.03] |
| 31 PSI QOL improvement rate Show forest plot | 1 | 190 | Mean Difference (IV, Fixed, 95% CI) | 5.60 [3.55, 7.65] |
| 31.1 G vs vinorelbine = 1st line | 1 | 190 | Mean Difference (IV, Fixed, 95% CI) | 5.60 [3.55, 7.65] |
| Outcome or subgroup title | No. of studies | No. of participants | Statistical method | Effect size |
| 1 HR Overall survival = 1st line Show forest plot | 4 | Hazard Ratio (Random, 95% CI) | 0.94 [0.82, 1.06] | |
| 1.1 G vs carboplatin + paclitaxel | 2 | Hazard Ratio (Random, 95% CI) | 1.09 [0.64, 1.84] | |
| 1.2 G vs gemcitabine + cisplatin | 1 | Hazard Ratio (Random, 95% CI) | 0.93 [0.72, 1.21] | |
| 1.3 G vs pemetrexed + cisplatin | 1 | Hazard Ratio (Random, 95% CI) | 0.94 [0.68, 1.30] | |
| 2 HR Overall survival = 2nd line Show forest plot | 3 | Hazard Ratio (Random, 95% CI) | 0.94 [0.79, 1.12] | |
| 2.1 G vs docetaxel | 2 | Hazard Ratio (Random, 95% CI) | 0.97 [0.80, 1.17] | |
| 2.2 G vs pemetrexed | 1 | Hazard Ratio (Random, 95% CI) | 0.80 [0.50, 1.28] | |
| 3 HR Overall survival = Maintenance Show forest plot | 1 | Hazard Ratio (Random, 95% CI) | 2.15 [0.83, 5.55] | |
| 3.1 G vs pemetrexed | 1 | Hazard Ratio (Random, 95% CI) | 2.15 [0.83, 5.55] | |
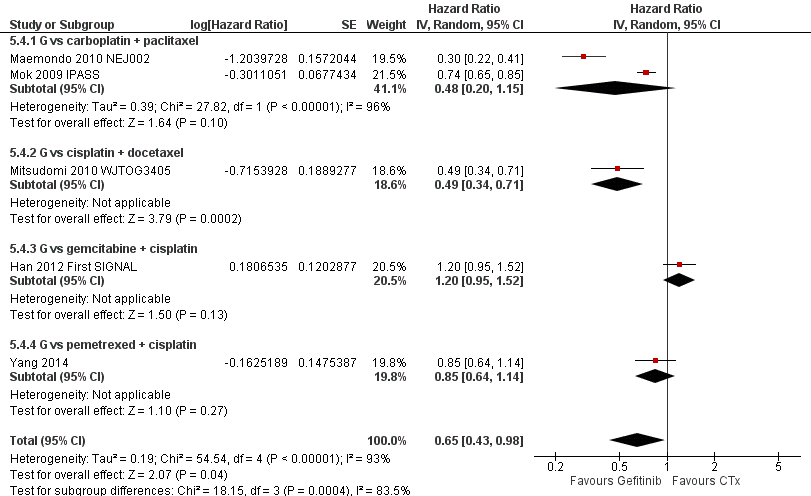
| 4 HR Progression‐free survival = 1st line Show forest plot | 5 | Hazard Ratio (Random, 95% CI) | 0.65 [0.43, 0.98] | |
| 4.1 G vs carboplatin + paclitaxel | 2 | Hazard Ratio (Random, 95% CI) | 0.48 [0.20, 1.15] | |
| 4.2 G vs cisplatin + docetaxel | 1 | Hazard Ratio (Random, 95% CI) | 0.49 [0.34, 0.71] | |
| 4.3 G vs gemcitabine + cisplatin | 1 | Hazard Ratio (Random, 95% CI) | 1.20 [0.95, 1.52] | |
| 4.4 G vs pemetrexed + cisplatin | 1 | Hazard Ratio (Random, 95% CI) | 0.85 [0.64, 1.14] | |
| 5 HR Progression‐free survival = 2nd line Show forest plot | 3 | Hazard Ratio (Random, 95% CI) | 0.71 [0.57, 0.88] | |
| 5.1 G vs docetaxel | 2 | Hazard Ratio (Random, 95% CI) | 0.78 [0.65, 0.94] | |
| 5.2 G vs pemetrexed | 1 | Hazard Ratio (Random, 95% CI) | 0.54 [0.37, 0.79] | |
| 6 HR Progression‐free survival = Maintenance Show forest plot | 1 | Hazard Ratio (Random, 95% CI) | 0.53 [0.27, 1.04] | |
| 6.1 G vs pemetrexed | 1 | Hazard Ratio (Random, 95% CI) | 0.53 [0.27, 1.04] | |
| 7 1‐year survival rate Show forest plot | 7 | Risk Ratio (M‐H, Fixed, 95% CI) | Subtotals only | |
| 7.1 1st line | 3 | 1754 | Risk Ratio (M‐H, Fixed, 95% CI) | 1.03 [0.97, 1.09] |
| 7.2 2nd line | 3 | 681 | Risk Ratio (M‐H, Fixed, 95% CI) | 0.94 [0.81, 1.11] |
| 7.3 Maintenance | 1 | 70 | Risk Ratio (M‐H, Fixed, 95% CI) | 0.79 [0.65, 0.98] |
| 8 Nausea Show forest plot | 10 | 2898 | Risk Ratio (M‐H, Fixed, 95% CI) | 0.34 [0.17, 0.64] |
| 8.1 1st line | 4 | 1912 | Risk Ratio (M‐H, Fixed, 95% CI) | 0.19 [0.06, 0.54] |
| 8.2 2nd line | 5 | 916 | Risk Ratio (M‐H, Fixed, 95% CI) | 0.59 [0.22, 1.60] |
| 8.3 Maintenance | 1 | 70 | Risk Ratio (M‐H, Fixed, 95% CI) | 0.53 [0.09, 2.98] |
| 9 Vomiting Show forest plot | 6 | 2447 | Risk Ratio (M‐H, Random, 95% CI) | 0.19 [0.05, 0.77] |
| 9.1 1st line | 3 | 1737 | Risk Ratio (M‐H, Random, 95% CI) | 0.08 [0.02, 0.29] |
| 9.2 2nd line | 2 | 640 | Risk Ratio (M‐H, Random, 95% CI) | 1.31 [0.30, 5.77] |
| 9.3 Maintenance | 1 | 70 | Risk Ratio (M‐H, Random, 95% CI) | 0.20 [0.02, 1.69] |
| 10 Anorexia Show forest plot | 10 | 2950 | Risk Ratio (M‐H, Fixed, 95% CI) | 0.36 [0.27, 0.49] |
| 10.1 1st line | 4 | 1964 | Risk Ratio (M‐H, Fixed, 95% CI) | 0.32 [0.23, 0.45] |
| 10.2 2nd line | 5 | 916 | Risk Ratio (M‐H, Fixed, 95% CI) | 0.53 [0.27, 1.02] |
| 10.3 Maintenance | 1 | 70 | Risk Ratio (M‐H, Fixed, 95% CI) | 0.79 [0.05, 12.20] |
| 11 Fatigue Show forest plot | 10 | 1960 | Risk Ratio (M‐H, Fixed, 95% CI) | 0.32 [0.22, 0.46] |
| 11.1 1st line | 4 | 943 | Risk Ratio (M‐H, Fixed, 95% CI) | 0.26 [0.17, 0.40] |
| 11.2 2nd line | 4 | 759 | Risk Ratio (M‐H, Fixed, 95% CI) | 0.26 [0.06, 1.03] |
| 11.3 Maintenance | 2 | 258 | Risk Ratio (M‐H, Fixed, 95% CI) | 1.09 [0.41, 2.89] |
| 12 Arthralgia/myalgia Show forest plot | 4 | 2063 | Risk Ratio (M‐H, Fixed, 95% CI) | 0.14 [0.03, 0.61] |
| 12.1 1st line | 2 | 1423 | Risk Ratio (M‐H, Fixed, 95% CI) | 0.14 [0.03, 0.61] |
| 12.2 2nd line | 2 | 640 | Risk Ratio (M‐H, Fixed, 95% CI) | 0.0 [0.0, 0.0] |
| 13 Asthenia Show forest plot | 4 | 1755 | Risk Ratio (M‐H, Fixed, 95% CI) | 0.22 [0.08, 0.58] |
| 13.1 1st line | 3 | 1598 | Risk Ratio (M‐H, Fixed, 95% CI) | 0.21 [0.07, 0.61] |
| 13.2 2nd line | 1 | 157 | Risk Ratio (M‐H, Fixed, 95% CI) | 0.31 [0.03, 2.94] |
| 14 Neurotoxicity Show forest plot | 4 | 1797 | Risk Ratio (M‐H, Fixed, 95% CI) | 0.07 [0.02, 0.24] |
| 14.1 1st line | 2 | 1505 | Risk Ratio (M‐H, Fixed, 95% CI) | 0.07 [0.02, 0.24] |
| 14.2 2nd line | 2 | 292 | Risk Ratio (M‐H, Fixed, 95% CI) | 0.0 [0.0, 0.0] |
| 15 Neutropenia Show forest plot | 10 | 3061 | Risk Ratio (M‐H, Random, 95% CI) | 0.11 [0.05, 0.27] |
| 15.1 1st line | 5 | 2139 | Risk Ratio (M‐H, Random, 95% CI) | 0.05 [0.03, 0.07] |
| 15.2 2nd line | 3 | 664 | Risk Ratio (M‐H, Random, 95% CI) | 0.12 [0.08, 0.18] |
| 15.3 Maintenance | 2 | 258 | Risk Ratio (M‐H, Random, 95% CI) | 1.20 [0.49, 2.96] |
| 16 Anaemia Show forest plot | 9 | 2538 | Risk Ratio (M‐H, Fixed, 95% CI) | 0.18 [0.12, 0.29] |
| 16.1 1st line | 5 | 2139 | Risk Ratio (M‐H, Fixed, 95% CI) | 0.16 [0.10, 0.26] |
| 16.2 2nd line | 2 | 141 | Risk Ratio (M‐H, Fixed, 95% CI) | 0.20 [0.02, 1.61] |
| 16.3 Maintenance | 2 | 258 | Risk Ratio (M‐H, Fixed, 95% CI) | 1.36 [0.24, 7.87] |
| 17 Leukopenia Show forest plot | 4 | 2086 | Risk Ratio (M‐H, Random, 95% CI) | 0.07 [0.02, 0.23] |
| 17.1 1st line | 3 | 1603 | Risk Ratio (M‐H, Random, 95% CI) | 0.04 [0.02, 0.08] |
| 17.2 2nd line | 1 | 483 | Risk Ratio (M‐H, Random, 95% CI) | 0.16 [0.09, 0.26] |
| 18 Thrombocytopenia Show forest plot | 7 | 1070 | Risk Ratio (M‐H, Fixed, 95% CI) | 0.32 [0.14, 0.72] |
| 18.1 1st line | 2 | 536 | Risk Ratio (M‐H, Fixed, 95% CI) | 0.14 [0.04, 0.51] |
| 18.2 2nd line | 3 | 276 | Risk Ratio (M‐H, Fixed, 95% CI) | 0.25 [0.03, 2.15] |
| 18.3 Maintenance | 2 | 258 | Risk Ratio (M‐H, Fixed, 95% CI) | 3.63 [0.42, 31.44] |
| 19 Febrile neutropenia Show forest plot | 2 | 1679 | Risk Ratio (M‐H, Fixed, 95% CI) | 0.09 [0.03, 0.28] |
| 19.1 1st line | 1 | 1196 | Risk Ratio (M‐H, Fixed, 95% CI) | 0.06 [0.01, 0.43] |
| 19.2 2nd line | 1 | 483 | Risk Ratio (M‐H, Fixed, 95% CI) | 0.12 [0.03, 0.49] |
| 20 Skin rash Show forest plot | 10 | 3174 | Risk Ratio (M‐H, Random, 95% CI) | 3.11 [1.28, 7.55] |
| 20.1 1st line | 5 | 2141 | Risk Ratio (M‐H, Random, 95% CI) | 5.09 [2.21, 11.72] |
| 20.2 2nd line | 3 | 775 | Risk Ratio (M‐H, Random, 95% CI) | 2.54 [0.46, 13.95] |
| 20.3 Maintenance | 2 | 258 | Risk Ratio (M‐H, Random, 95% CI) | 0.91 [0.24, 3.44] |
| 21 Diarrhoea Show forest plot | 10 | 3055 | Risk Ratio (M‐H, Fixed, 95% CI) | 2.79 [1.57, 4.94] |
| 21.1 1st line | 5 | 2139 | Risk Ratio (M‐H, Fixed, 95% CI) | 2.74 [1.43, 5.27] |
| 21.2 2nd line | 5 | 916 | Risk Ratio (M‐H, Fixed, 95% CI) | 2.93 [0.88, 9.73] |
| 22 Increased ALT Show forest plot | 7 | 1542 | Risk Ratio (M‐H, Fixed, 95% CI) | 10.03 [5.23, 19.26] |
| 22.1 1st line | 4 | 943 | Risk Ratio (M‐H, Fixed, 95% CI) | 11.66 [5.13, 26.49] |
| 22.2 2nd line | 2 | 529 | Risk Ratio (M‐H, Fixed, 95% CI) | 13.22 [3.18, 54.99] |
| 22.3 Maintenance | 1 | 70 | Risk Ratio (M‐H, Fixed, 95% CI) | 0.27 [0.01, 6.33] |
| 23 Increased AST Show forest plot | 4 | 762 | Risk Ratio (M‐H, Fixed, 95% CI) | 7.73 [2.78, 21.46] |
| 23.1 1st line | 3 | 716 | Risk Ratio (M‐H, Fixed, 95% CI) | 7.73 [2.78, 21.46] |
| 23.2 2nd line | 1 | 46 | Risk Ratio (M‐H, Fixed, 95% CI) | 0.0 [0.0, 0.0] |
| 24 Overall response rate Show forest plot | 14 | Risk Ratio (M‐H, Random, 95% CI) | Subtotals only | |
| 24.1 1st line | 6 | 2158 | Risk Ratio (M‐H, Random, 95% CI) | 1.43 [1.13, 1.82] |
| 24.2 2nd line | 6 | 921 | Risk Ratio (M‐H, Random, 95% CI) | 1.43 [0.92, 2.22] |
| 24.3 Maintenance | 2 | 258 | Risk Ratio (M‐H, Random, 95% CI) | 0.88 [0.41, 1.87] |
| 25 Stable disease Show forest plot | 9 | Risk Ratio (M‐H, Random, 95% CI) | Subtotals only | |
| 25.1 1st line | 5 | 941 | Risk Ratio (M‐H, Random, 95% CI) | 0.47 [0.34, 0.64] |
| 25.2 2nd line | 2 | 143 | Risk Ratio (M‐H, Random, 95% CI) | 1.08 [0.64, 1.82] |
| 25.3 Maintenance | 2 | 258 | Risk Ratio (M‐H, Random, 95% CI) | 0.64 [0.44, 0.93] |
| 26 Disease control rate Show forest plot | 9 | Risk Ratio (M‐H, Random, 95% CI) | Subtotals only | |
| 26.1 1st line | 5 | 1848 | Risk Ratio (M‐H, Random, 95% CI) | 0.99 [0.86, 1.13] |
| 26.2 2nd line | 3 | 528 | Risk Ratio (M‐H, Random, 95% CI) | 0.99 [0.78, 1.25] |
| 26.3 Maintenance | 1 | 188 | Risk Ratio (M‐H, Random, 95% CI) | 0.65 [0.49, 0.85] |
| 27 FACT‐L QOL improvement rate Show forest plot | 3 | 1670 | Mean Difference (IV, Fixed, 95% CI) | 9.50 [7.95, 11.05] |
| 27.1 1st line | 1 | 1151 | Mean Difference (IV, Fixed, 95% CI) | 0.0 [0.0, 0.0] |
| 27.2 2nd line | 2 | 519 | Mean Difference (IV, Fixed, 95% CI) | 9.50 [7.95, 11.05] |
| 28 LCS QOL improvement rate Show forest plot | 3 | 1748 | Mean Difference (IV, Fixed, 95% CI) | 2.30 [1.53, 3.07] |
| 28.1 1st line | 1 | 1151 | Mean Difference (IV, Fixed, 95% CI) | 0.0 [0.0, 0.0] |
| 28.2 2nd line | 2 | 597 | Mean Difference (IV, Fixed, 95% CI) | 2.30 [1.53, 3.07] |
| 29 TOI QOL improvement rate Show forest plot | 3 | 1670 | Mean Difference (IV, Fixed, 95% CI) | 11.8 [9.17, 14.43] |
| 29.1 1st line | 1 | 1151 | Mean Difference (IV, Fixed, 95% CI) | 0.0 [0.0, 0.0] |
| 29.2 2nd line | 2 | 519 | Mean Difference (IV, Fixed, 95% CI) | 11.8 [9.17, 14.43] |
| Outcome or subgroup title | No. of studies | No. of participants | Statistical method | Effect size |
| 1 HR Overall survival = 1st line Show forest plot | 5 | Hazard Ratio (Fixed, 95% CI) | 0.97 [0.77, 1.21] | |
| 1.1 Biomarker driven selection | 2 | Hazard Ratio (Fixed, 95% CI) | 0.98 [0.72, 1.33] | |
| 1.2 Clinical feature driven selection | 3 | Hazard Ratio (Fixed, 95% CI) | 0.95 [0.68, 1.33] | |
| 2 HR Overall survival = 2nd line Show forest plot | 1 | Hazard Ratio (Fixed, 95% CI) | 0.83 [0.41, 1.66] | |
| 2.1 G vs docetaxel | 1 | Hazard Ratio (Fixed, 95% CI) | 0.83 [0.41, 1.66] | |
| 3 HR Progression‐free survival = 1st line Show forest plot | 5 | Hazard Ratio (Random, 95% CI) | 0.47 [0.36, 0.61] | |
| 3.1 Biomarker driven selection | 2 | Hazard Ratio (Random, 95% CI) | 0.39 [0.26, 0.59] | |
| 3.2 Clinical feature driven selection | 3 | Hazard Ratio (Random, 95% CI) | 0.53 [0.41, 0.70] | |
| 4 HR Progression‐free survival = 2nd line Show forest plot | 2 | Hazard Ratio (Fixed, 95% CI) | 0.24 [0.12, 0.47] | |
| 4.1 G vs docetaxel | 1 | Hazard Ratio (Fixed, 95% CI) | 0.16 [0.05, 0.50] | |
| 4.2 G vs pemetrexed | 1 | Hazard Ratio (Fixed, 95% CI) | 0.30 [0.13, 0.70] | |
| 5 Overall response rate Show forest plot | 7 | 758 | Risk Ratio (M‐H, Random, 95% CI) | 1.71 [1.34, 2.19] |
| 5.1 First‐line biomarker driven selection | 2 | 347 | Risk Ratio (M‐H, Random, 95% CI) | 2.23 [1.75, 2.85] |
| 5.2 First‐line, clinical feature driven selection | 3 | 353 | Risk Ratio (M‐H, Random, 95% CI) | 1.45 [1.05, 1.99] |
| 5.3 2nd line | 2 | 58 | Risk Ratio (M‐H, Random, 95% CI) | 1.65 [0.88, 3.09] |
| 6 Stable disease Show forest plot | 3 | 397 | Risk Ratio (M‐H, Random, 95% CI) | 0.52 [0.28, 0.97] |
| 6.1 First‐line, biomarker driven selection | 2 | 347 | Risk Ratio (M‐H, Random, 95% CI) | 0.47 [0.22, 0.98] |
| 6.2 First‐line, clinical feature driven selection | 1 | 50 | Risk Ratio (M‐H, Random, 95% CI) | 0.87 [0.26, 2.85] |
| 7 Disease control rate Show forest plot | 5 | 2001 | Risk Ratio (M‐H, Random, 95% CI) | 1.05 [0.93, 1.19] |
| 7.1 First‐line, biomarker driven selection | 2 | 347 | Risk Ratio (M‐H, Random, 95% CI) | 1.15 [1.05, 1.26] |
| 7.2 First‐line, clinical feature driven selection | 2 | 1267 | Risk Ratio (M‐H, Random, 95% CI) | 0.93 [0.87, 0.99] |
| 7.3 Second‐line | 1 | 387 | Risk Ratio (M‐H, Random, 95% CI) | 1.03 [0.77, 1.36] |
| Outcome or subgroup title | No. of studies | No. of participants | Statistical method | Effect size |
| 1 1‐year survival rate Show forest plot | 2 | 424 | Risk Ratio (M‐H, Fixed, 95% CI) | 0.83 [0.61, 1.11] |
| 1.1 2nd line | 2 | 424 | Risk Ratio (M‐H, Fixed, 95% CI) | 0.83 [0.61, 1.11] |
| 2 Skin rash Show forest plot | 2 | 290 | Risk Ratio (M‐H, Fixed, 95% CI) | 8.13 [1.51, 43.72] |
| 2.1 2nd line | 1 | 209 | Risk Ratio (M‐H, Fixed, 95% CI) | 6.80 [0.85, 54.32] |
| 2.2 Maintenance | 1 | 81 | Risk Ratio (M‐H, Fixed, 95% CI) | 10.41 [0.61, 176.21] |
| 3 Acne Show forest plot | 1 | 209 | Risk Ratio (M‐H, Fixed, 95% CI) | 4.86 [0.24, 100.02] |
| 3.1 2nd line | 1 | 209 | Risk Ratio (M‐H, Fixed, 95% CI) | 4.86 [0.24, 100.02] |
| 4 Pruritus Show forest plot | 1 | 209 | Risk Ratio (M‐H, Fixed, 95% CI) | 2.92 [0.12, 70.77] |
| 4.1 2nd line | 1 | 209 | Risk Ratio (M‐H, Fixed, 95% CI) | 2.92 [0.12, 70.77] |
| 5 Diarrhoea Show forest plot | 3 | 521 | Risk Ratio (M‐H, Fixed, 95% CI) | 8.36 [1.58, 44.34] |
| 5.1 2nd line | 3 | 521 | Risk Ratio (M‐H, Fixed, 95% CI) | 8.36 [1.58, 44.34] |
| 6 Nausea Show forest plot | 1 | 209 | Risk Ratio (M‐H, Fixed, 95% CI) | 0.97 [0.06, 15.33] |
| 6.1 2nd line | 1 | 209 | Risk Ratio (M‐H, Fixed, 95% CI) | 0.97 [0.06, 15.33] |
| 7 Vomiting Show forest plot | 1 | 209 | Risk Ratio (M‐H, Fixed, 95% CI) | 0.0 [0.0, 0.0] |
| 7.1 2nd line | 1 | 209 | Risk Ratio (M‐H, Fixed, 95% CI) | 0.0 [0.0, 0.0] |
| 8 Anorexia Show forest plot | 1 | 209 | Risk Ratio (M‐H, Fixed, 95% CI) | 2.92 [0.12, 70.77] |
| 8.1 2nd line | 1 | 209 | Risk Ratio (M‐H, Fixed, 95% CI) | 2.92 [0.12, 70.77] |
| 9 Asthenia Show forest plot | 1 | 209 | Risk Ratio (M‐H, Fixed, 95% CI) | 2.92 [0.12, 70.77] |
| 9.1 2nd line | 1 | 209 | Risk Ratio (M‐H, Fixed, 95% CI) | 2.92 [0.12, 70.77] |
| 10 Overall response rate Show forest plot | 3 | Risk Ratio (M‐H, Fixed, 95% CI) | Subtotals only | |
| 10.1 2nd line | 2 | 424 | Risk Ratio (M‐H, Fixed, 95% CI) | 0.92 [0.58, 1.46] |
| 10.2 Maintenance | 1 | 96 | Risk Ratio (M‐H, Fixed, 95% CI) | 1.0 [0.35, 2.88] |
| 11 Partial response Show forest plot | 1 | 216 | Risk Ratio (M‐H, Fixed, 95% CI) | 0.75 [0.34, 1.65] |
| 11.1 2nd line | 1 | 216 | Risk Ratio (M‐H, Fixed, 95% CI) | 0.75 [0.34, 1.65] |
| 12 FACT‐L Symptom improvement rate Show forest plot | 2 | 356 | Mean Difference (IV, Fixed, 95% CI) | 3.70 [‐7.28, 14.69] |
| 12.1 2nd line | 2 | 356 | Mean Difference (IV, Fixed, 95% CI) | 3.70 [‐7.28, 14.69] |
| 13 TOI QOL improvement rate Show forest plot | 2 | 424 | Mean Difference (IV, Fixed, 95% CI) | 7.38 [‐2.30, 17.05] |
| 13.1 2nd line | 2 | 424 | Mean Difference (IV, Fixed, 95% CI) | 7.38 [‐2.30, 17.05] |
| Outcome or subgroup title | No. of studies | No. of participants | Statistical method | Effect size |
| 1 HR Progression‐free survival Show forest plot | 2 | Hazard Ratio (Random, 95% CI) | Subtotals only | |
| 1.1 1st line | 1 | Hazard Ratio (Random, 95% CI) | 0.69 [0.49, 0.96] | |
| 1.2 2nd line | 1 | Hazard Ratio (Random, 95% CI) | 0.65 [0.43, 0.97] | |
| 2 1‐year survival rate Show forest plot | 2 | 163 | Risk Ratio (M‐H, Fixed, 95% CI) | 1.15 [0.92, 1.43] |
| 2.1 2nd line | 2 | 163 | Risk Ratio (M‐H, Fixed, 95% CI) | 1.15 [0.92, 1.43] |
| 3 1‐year progression‐free survival Show forest plot | 2 | 163 | Risk Ratio (M‐H, Fixed, 95% CI) | 2.29 [1.38, 3.80] |
| 3.1 2nd line | 2 | 163 | Risk Ratio (M‐H, Fixed, 95% CI) | 2.29 [1.38, 3.80] |
| 4 Skin rash Show forest plot | 3 | 329 | Risk Ratio (M‐H, Fixed, 95% CI) | 1.34 [0.39, 4.57] |
| 4.1 1st line | 2 | 281 | Risk Ratio (M‐H, Fixed, 95% CI) | 1.01 [0.23, 4.51] |
| 4.2 2nd line | 1 | 48 | Risk Ratio (M‐H, Fixed, 95% CI) | 2.57 [0.25, 26.47] |
| 5 Diarrhoea Show forest plot | 3 | 329 | Risk Ratio (M‐H, Fixed, 95% CI) | 1.16 [0.21, 6.34] |
| 5.1 1st line | 2 | 281 | Risk Ratio (M‐H, Fixed, 95% CI) | 1.16 [0.21, 6.34] |
| 5.2 2nd line | 1 | 48 | Risk Ratio (M‐H, Fixed, 95% CI) | 0.0 [0.0, 0.0] |
| 6 Constipation Show forest plot | 1 | 48 | Risk Ratio (M‐H, Fixed, 95% CI) | 0.42 [0.02, 9.92] |
| 6.1 2nd line | 1 | 48 | Risk Ratio (M‐H, Fixed, 95% CI) | 0.42 [0.02, 9.92] |
| 7 Fatigue Show forest plot | 3 | 329 | Risk Ratio (M‐H, Fixed, 95% CI) | 2.68 [0.60, 11.90] |
| 7.1 1st line | 2 | 281 | Risk Ratio (M‐H, Fixed, 95% CI) | 2.68 [0.60, 11.90] |
| 7.2 2nd line | 1 | 48 | Risk Ratio (M‐H, Fixed, 95% CI) | 0.0 [0.0, 0.0] |
| 8 Leukopenia Show forest plot | 2 | 138 | Risk Ratio (M‐H, Fixed, 95% CI) | 1.50 [0.48, 4.70] |
| 8.1 1st line | 1 | 90 | Risk Ratio (M‐H, Fixed, 95% CI) | 1.25 [0.36, 4.35] |
| 8.2 2nd line | 1 | 48 | Risk Ratio (M‐H, Fixed, 95% CI) | 3.82 [0.16, 89.24] |
| 9 Anaemia Show forest plot | 3 | 329 | Risk Ratio (M‐H, Fixed, 95% CI) | 3.22 [0.66, 15.72] |
| 9.1 1st line | 2 | 281 | Risk Ratio (M‐H, Fixed, 95% CI) | 3.06 [0.49, 19.15] |
| 9.2 2nd line | 1 | 48 | Risk Ratio (M‐H, Fixed, 95% CI) | 3.82 [0.16, 89.24] |
| 10 Thrombocytopenia Show forest plot | 2 | 138 | Risk Ratio (M‐H, Fixed, 95% CI) | 0.0 [0.0, 0.0] |
| 10.1 1st line | 1 | 90 | Risk Ratio (M‐H, Fixed, 95% CI) | 0.0 [0.0, 0.0] |
| 10.2 2nd line | 1 | 48 | Risk Ratio (M‐H, Fixed, 95% CI) | 0.0 [0.0, 0.0] |
| 11 Neutropenia Show forest plot | 3 | 329 | Risk Ratio (M‐H, Fixed, 95% CI) | 1.47 [0.71, 3.02] |
| 11.1 1st line | 2 | 281 | Risk Ratio (M‐H, Fixed, 95% CI) | 1.36 [0.65, 2.88] |
| 11.2 2nd line | 1 | 48 | Risk Ratio (M‐H, Fixed, 95% CI) | 3.82 [0.16, 89.24] |
| 12 Increased ALT Show forest plot | 2 | 281 | Risk Ratio (M‐H, Fixed, 95% CI) | 2.57 [1.09, 6.04] |
| 12.1 1st line | 2 | 281 | Risk Ratio (M‐H, Fixed, 95% CI) | 2.57 [1.09, 6.04] |
| 13 Increased AST Show forest plot | 2 | 281 | Risk Ratio (M‐H, Fixed, 95% CI) | 1.47 [0.56, 3.88] |
| 13.1 1st line | 2 | 281 | Risk Ratio (M‐H, Fixed, 95% CI) | 1.47 [0.56, 3.88] |
| 14 Vomiting Show forest plot | 1 | 191 | Risk Ratio (M‐H, Fixed, 95% CI) | 1.56 [0.06, 37.74] |
| 14.1 1st line | 1 | 191 | Risk Ratio (M‐H, Fixed, 95% CI) | 1.56 [0.06, 37.74] |
| 15 Nausea Show forest plot | 1 | 191 | Risk Ratio (M‐H, Fixed, 95% CI) | 1.56 [0.06, 37.74] |
| 15.1 1st line | 1 | 191 | Risk Ratio (M‐H, Fixed, 95% CI) | 1.56 [0.06, 37.74] |
| 16 Overall response rate Show forest plot | 2 | 281 | Risk Ratio (M‐H, Fixed, 95% CI) | 1.02 [0.89, 1.17] |
| 16.1 1st line | 2 | 281 | Risk Ratio (M‐H, Fixed, 95% CI) | 1.02 [0.89, 1.17] |
| 17 Partial response Show forest plot | 4 | 444 | Risk Ratio (M‐H, Fixed, 95% CI) | 1.01 [0.88, 1.16] |
| 17.1 1st line | 2 | 281 | Risk Ratio (M‐H, Fixed, 95% CI) | 1.01 [0.88, 1.16] |
| 17.2 2nd line | 2 | 163 | Risk Ratio (M‐H, Fixed, 95% CI) | 1.02 [0.71, 1.47] |
| 18 Stable disease Show forest plot | 4 | 444 | Risk Ratio (M‐H, Fixed, 95% CI) | 0.97 [0.69, 1.37] |
| 18.1 1st line | 2 | 281 | Risk Ratio (M‐H, Fixed, 95% CI) | 0.67 [0.39, 1.16] |
| 18.2 2nd line | 2 | 163 | Risk Ratio (M‐H, Fixed, 95% CI) | 1.30 [0.84, 2.03] |
| Outcome or subgroup title | No. of studies | No. of participants | Statistical method | Effect size |
| 1 HR Overall survival Show forest plot | 3 | Hazard Ratio (Fixed, 95% CI) | Subtotals only | |
| 1.1 1st line [Asian] | 2 | Hazard Ratio (Fixed, 95% CI) | 0.86 [0.72, 1.02] | |
| 1.2 2nd line [EGFRm] | 1 | Hazard Ratio (Fixed, 95% CI) | 1.62 [1.05, 2.50] | |
| 2 HR Progression‐free survival Show forest plot | 3 | Hazard Ratio (Fixed, 95% CI) | Subtotals only | |
| 2.1 1st line [Asian] | 2 | Hazard Ratio (Fixed, 95% CI) | 0.69 [0.62, 0.77] | |
| 2.2 2nd line [EGFRm] | 1 | Hazard Ratio (Fixed, 95% CI) | 0.86 [0.65, 1.13] | |
| 3 1‐year survival rate Show forest plot | 2 | 1411 | Risk Ratio (M‐H, Fixed, 95% CI) | 0.95 [0.84, 1.08] |
| 3.1 1st line | 2 | 1411 | Risk Ratio (M‐H, Fixed, 95% CI) | 0.95 [0.84, 1.08] |
| 4 Skin rash Show forest plot | 5 | 2379 | Risk Ratio (M‐H, Fixed, 95% CI) | 2.98 [1.54, 5.77] |
| 4.1 1st line | 2 | 1400 | Risk Ratio (M‐H, Fixed, 95% CI) | 2.64 [1.23, 5.63] |
| 4.2 1st line [Asian] | 2 | 715 | Risk Ratio (M‐H, Fixed, 95% CI) | 4.23 [1.08, 16.54] |
| 4.3 2nd line [EGFRm] | 1 | 264 | Risk Ratio (M‐H, Fixed, 95% CI) | 0.0 [0.0, 0.0] |
| 5 Acne Show forest plot | 3 | 1664 | Risk Ratio (M‐H, Fixed, 95% CI) | 4.95 [1.09, 22.51] |
| 5.1 1st line | 2 | 1400 | Risk Ratio (M‐H, Fixed, 95% CI) | 5.59 [0.99, 31.60] |
| 5.2 2nd line [EGFRm] | 1 | 264 | Risk Ratio (M‐H, Fixed, 95% CI) | 3.0 [0.12, 72.98] |
| 6 Diarrhoea Show forest plot | 5 | 2379 | Risk Ratio (M‐H, Random, 95% CI) | 2.04 [1.17, 3.58] |
| 6.1 1st line | 2 | 1400 | Risk Ratio (M‐H, Random, 95% CI) | 2.44 [1.17, 5.09] |
| 6.2 1st line [Asian] | 2 | 715 | Risk Ratio (M‐H, Random, 95% CI) | 0.97 [0.32, 2.92] |
| 6.3 2nd line [EGFRm] | 1 | 264 | Risk Ratio (M‐H, Random, 95% CI) | 3.0 [0.32, 28.47] |
| 7 Pruritus Show forest plot | 2 | 1400 | Risk Ratio (M‐H, Fixed, 95% CI) | 1.99 [0.18, 21.89] |
| 7.1 1st line | 2 | 1400 | Risk Ratio (M‐H, Fixed, 95% CI) | 1.99 [0.18, 21.89] |
| 8 Vomiting Show forest plot | 5 | 2379 | Risk Ratio (M‐H, Fixed, 95% CI) | 1.24 [0.81, 1.89] |
| 8.1 1st line | 2 | 1400 | Risk Ratio (M‐H, Fixed, 95% CI) | 1.05 [0.53, 2.06] |
| 8.2 1st line [Asian] | 2 | 715 | Risk Ratio (M‐H, Fixed, 95% CI) | 1.28 [0.70, 2.32] |
| 8.3 2nd line [EGFRm] | 1 | 264 | Risk Ratio (M‐H, Fixed, 95% CI) | 2.0 [0.51, 7.83] |
| 9 Nausea Show forest plot | 5 | 2379 | Risk Ratio (M‐H, Fixed, 95% CI) | 0.82 [0.58, 1.17] |
| 9.1 1st line | 2 | 1400 | Risk Ratio (M‐H, Fixed, 95% CI) | 1.06 [0.51, 2.18] |
| 9.2 1st line [Asian] | 2 | 715 | Risk Ratio (M‐H, Fixed, 95% CI) | 0.74 [0.48, 1.14] |
| 9.3 2nd line [EGFRm] | 1 | 264 | Risk Ratio (M‐H, Fixed, 95% CI) | 0.83 [0.26, 2.66] |
| 10 Anorexia Show forest plot | 5 | 2379 | Risk Ratio (M‐H, Fixed, 95% CI) | 0.82 [0.55, 1.20] |
| 10.1 1st line | 2 | 1400 | Risk Ratio (M‐H, Fixed, 95% CI) | 1.98 [0.36, 10.76] |
| 10.2 1st line [Asian] | 2 | 715 | Risk Ratio (M‐H, Fixed, 95% CI) | 0.80 [0.53, 1.20] |
| 10.3 2nd line [EGFRm] | 1 | 264 | Risk Ratio (M‐H, Fixed, 95% CI) | 0.33 [0.04, 3.16] |
| 11 Asthenia Show forest plot | 3 | 1664 | Risk Ratio (M‐H, Random, 95% CI) | 0.80 [0.21, 2.99] |
| 11.1 1st line | 2 | 1400 | Risk Ratio (M‐H, Random, 95% CI) | 0.90 [0.10, 7.76] |
| 11.2 2nd line [EGFRm] | 1 | 264 | Risk Ratio (M‐H, Random, 95% CI) | 0.5 [0.09, 2.68] |
| 12 Dyspnoea Show forest plot | 2 | 947 | Risk Ratio (M‐H, Fixed, 95% CI) | 1.00 [0.25, 3.96] |
| 12.1 1st line | 1 | 683 | Risk Ratio (M‐H, Fixed, 95% CI) | 1.99 [0.18, 21.89] |
| 12.2 2nd line [EGFRm] | 1 | 264 | Risk Ratio (M‐H, Fixed, 95% CI) | 0.67 [0.11, 3.93] |
| 13 Anaemia Show forest plot | 3 | 979 | Risk Ratio (M‐H, Fixed, 95% CI) | 0.74 [0.53, 1.03] |
| 13.1 1st line [Asian] | 2 | 715 | Risk Ratio (M‐H, Fixed, 95% CI) | 0.63 [0.44, 0.90] |
| 13.2 2nd line [EGFRm] | 1 | 264 | Risk Ratio (M‐H, Fixed, 95% CI) | 2.2 [0.79, 6.16] |
| 14 Neutropenia Show forest plot | 5 | 2379 | Risk Ratio (M‐H, Fixed, 95% CI) | 0.97 [0.87, 1.08] |
| 14.1 1st line | 2 | 1400 | Risk Ratio (M‐H, Fixed, 95% CI) | 1.18 [0.77, 1.80] |
| 14.2 1st line [Asian] | 2 | 715 | Risk Ratio (M‐H, Fixed, 95% CI) | 0.93 [0.84, 1.03] |
| 14.3 2nd line [EGFRm] | 1 | 264 | Risk Ratio (M‐H, Fixed, 95% CI) | 1.29 [0.49, 3.35] |
| 15 Leukopenia Show forest plot | 4 | 2262 | Risk Ratio (M‐H, Fixed, 95% CI) | 1.08 [0.89, 1.31] |
| 15.1 1st line | 2 | 1400 | Risk Ratio (M‐H, Fixed, 95% CI) | 1.17 [0.61, 2.26] |
| 15.2 1st line [Asian] | 1 | 598 | Risk Ratio (M‐H, Fixed, 95% CI) | 1.06 [0.87, 1.30] |
| 15.3 2nd line [EGFRm] | 1 | 264 | Risk Ratio (M‐H, Fixed, 95% CI) | 1.0 [0.21, 4.86] |
| 16 Overall response rate Show forest plot | 5 | 2314 | Risk Ratio (M‐H, Fixed, 95% CI) | 1.08 [0.97, 1.20] |
| 16.1 1st line | 2 | 1343 | Risk Ratio (M‐H, Fixed, 95% CI) | 1.07 [0.94, 1.22] |
| 16.2 1st line [Asian] | 2 | 706 | Risk Ratio (M‐H, Fixed, 95% CI) | 1.14 [0.93, 1.40] |
| 16.3 2nd line [EGFRm] | 1 | 265 | Risk Ratio (M‐H, Fixed, 95% CI) | 0.93 [0.66, 1.31] |