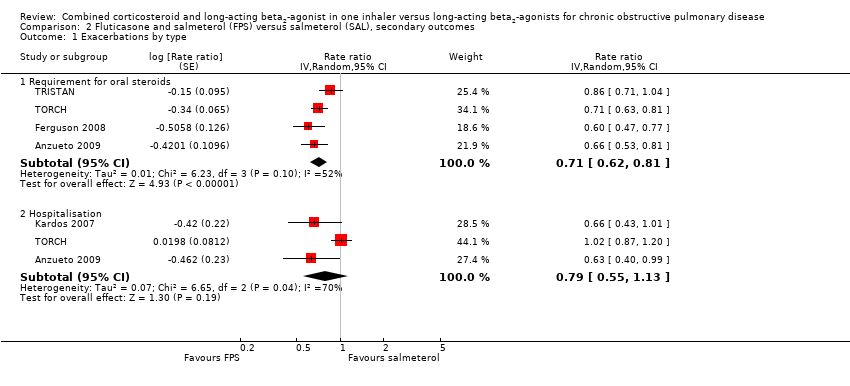
| 1 Exacerbations by type Show forest plot | 5 | | Rate ratio (Random, 95% CI) | Subtotals only |
|
| 1.1 Requirement for oral steroids | 4 | | Rate ratio (Random, 95% CI) | 0.71 [0.62, 0.81] |
| 1.2 Hospitalisation | 3 | | Rate ratio (Random, 95% CI) | 0.79 [0.55, 1.13] |
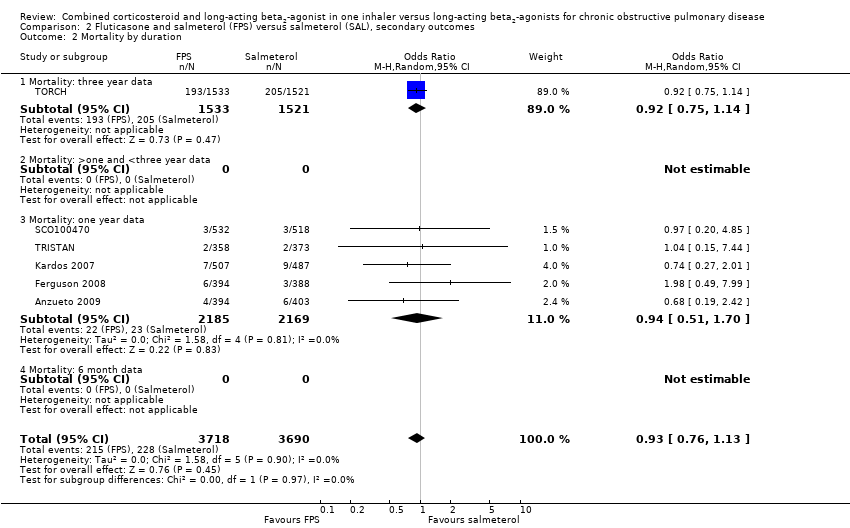
| 2 Mortality by duration Show forest plot | 6 | 7408 | Odds Ratio (M‐H, Random, 95% CI) | 0.93 [0.76, 1.13] |
|
| 2.1 Mortality: three year data | 1 | 3054 | Odds Ratio (M‐H, Random, 95% CI) | 0.92 [0.75, 1.14] |
| 2.2 Mortality: >one and <three year data | 0 | 0 | Odds Ratio (M‐H, Random, 95% CI) | 0.0 [0.0, 0.0] |
| 2.3 Mortality: one year data | 5 | 4354 | Odds Ratio (M‐H, Random, 95% CI) | 0.94 [0.51, 1.70] |
| 2.4 Mortality: 6 month data | 0 | 0 | Odds Ratio (M‐H, Random, 95% CI) | 0.0 [0.0, 0.0] |
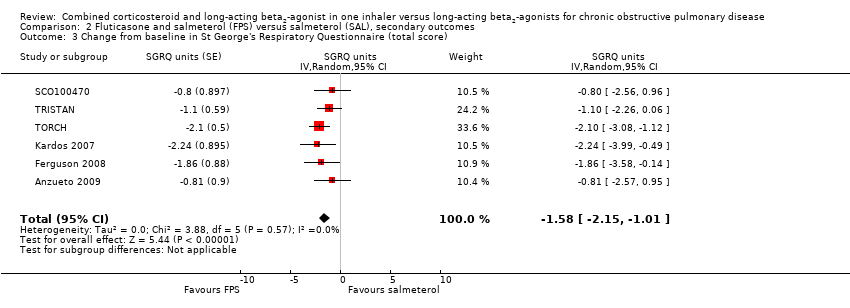
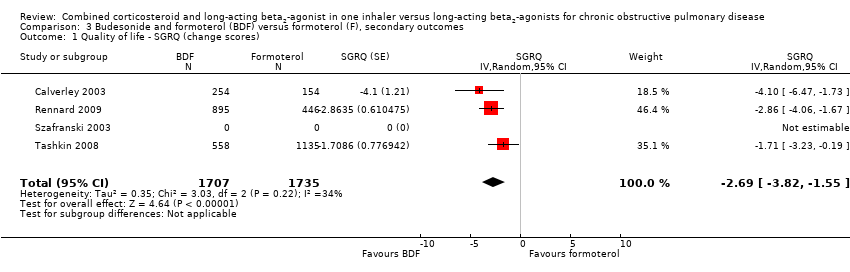
| 3 Change from baseline in St George's Respiratory Questionnaire (total score) Show forest plot | 6 | | SGRQ units (Random, 95% CI) | ‐1.58 [‐2.15, ‐1.01] |
|
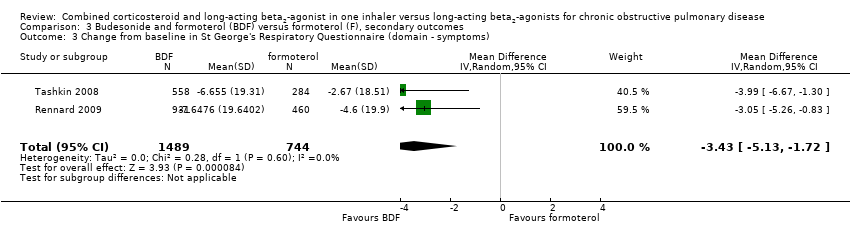
| 4 Change from baseline in St George's Respiratory Questionnaire (domain ‐ symptoms) Show forest plot | 4 | | St George's RQ score (Random, 95% CI) | ‐2.78 [‐3.88, ‐1.68] |
|
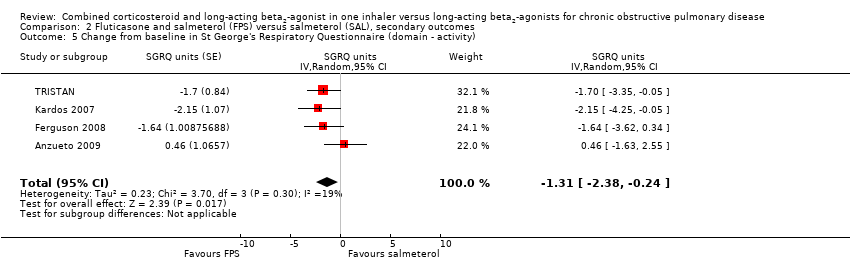
| 5 Change from baseline in St George's Respiratory Questionnaire (domain ‐ activity) Show forest plot | 4 | | SGRQ units (Random, 95% CI) | ‐1.31 [‐2.38, ‐0.24] |
|
| 6 Change from baseline in St George's Respiratory Questionnaire (domain ‐ impact) Show forest plot | 4 | | SGRQ units (Random, 95% CI) | ‐1.41 [‐2.33, ‐0.50] |
|
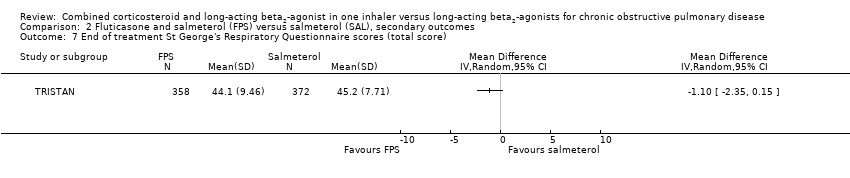
| 7 End of treatment St George's Respiratory Questionnaire scores (total score) Show forest plot | 1 | | Mean Difference (IV, Random, 95% CI) | Totals not selected |
|
| 8 End of treatment St George's Respiratory Questionnaire scores (domain ‐ symptoms) Show forest plot | 1 | | Mean Difference (IV, Random, 95% CI) | Totals not selected |
|
| 9 Change from baseline in Chronic Respiratory Disease Questionnaire scores Show forest plot | 2 | 680 | Mean Difference (IV, Random, 95% CI) | 2.83 [0.25, 5.41] |
|
| 10 End of treatment Transitional dyspnea index (TDI) Show forest plot | 1 | | Mean Difference (IV, Random, 95% CI) | Totals not selected |
|
| 11 End of treatment symptom scores Show forest plot | 1 | | Mean Difference (IV, Random, 95% CI) | Totals not selected |
|
| 12 Change from baseline in Transitional Dyspnoea Index (TDI) Show forest plot | 2 | 677 | Mean Difference (IV, Random, 95% CI) | 0.61 [‐0.47, 1.68] |
|
| 13 Change in MRC rated dyspnoea Show forest plot | 1 | | symptoms (Random, 95% CI) | Totals not selected |
|
| 14 Change from baseline in dyspnoea score Show forest plot | 2 | | Mean Difference (Random, 95% CI) | ‐0.09 [‐0.13, ‐0.05] |
|
| 15 Mean Change nighttime awakenings Show forest plot | 2 | 1554 | Mean Difference (IV, Random, 95% CI) | ‐1.34 [‐2.07, ‐0.61] |
|
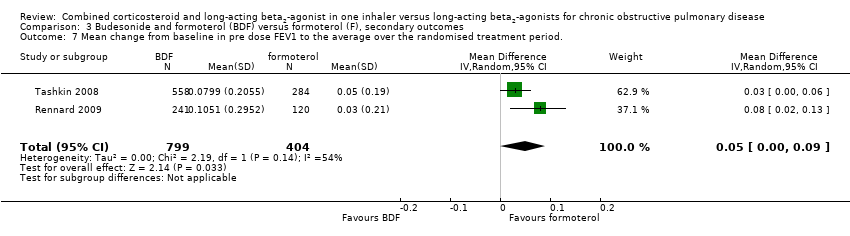
| 16 Change from baseline in predose FEV1 Show forest plot | 5 | | Litres (Random, 95% CI) | 0.07 [0.05, 0.10] |
|
| 16.1 Reversible population | 3 | | Litres (Random, 95% CI) | 0.07 [0.02, 0.12] |
| 16.2 Partially reversible population (mixed population) | 2 | | Litres (Random, 95% CI) | 0.08 [0.04, 0.12] |
| 16.3 Poorly reversible population | 2 | | Litres (Random, 95% CI) | 0.06 [0.01, 0.12] |
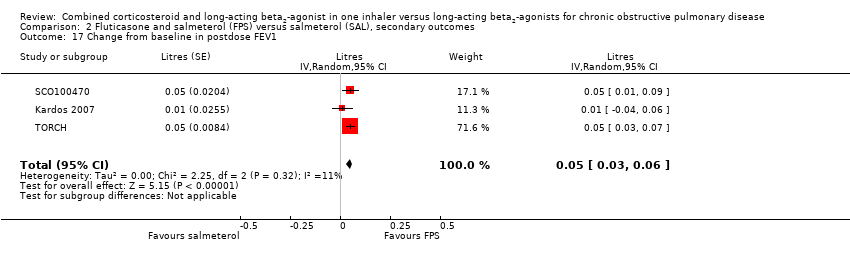
| 17 Change from baseline in postdose FEV1 Show forest plot | 3 | | Litres (Random, 95% CI) | 0.05 [0.03, 0.06] |
|
| 18 End of treatment FEV1 (Litres) Show forest plot | 2 | 1780 | Mean Difference (IV, Random, 95% CI) | 0.01 [‐0.02, 0.03] |
|
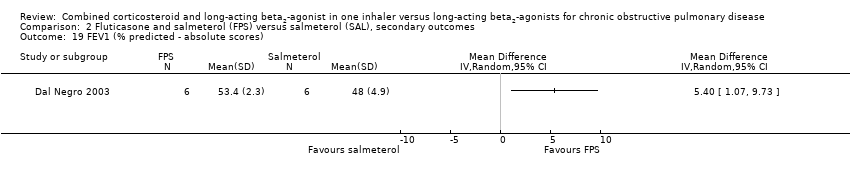
| 19 FEV1 (% predicted ‐ absolute scores) Show forest plot | 1 | | Mean Difference (IV, Random, 95% CI) | Totals not selected |
|
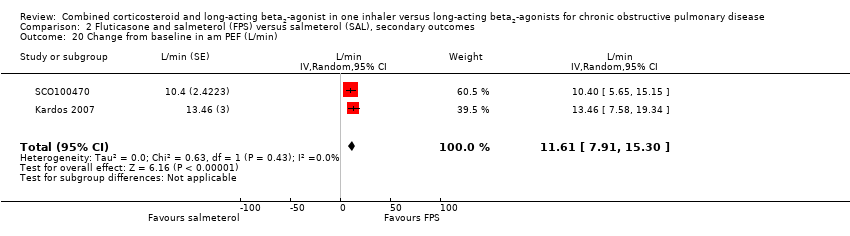
| 20 Change from baseline in am PEF (L/min) Show forest plot | 2 | | L/min (Random, 95% CI) | 11.61 [7.91, 15.30] |
|
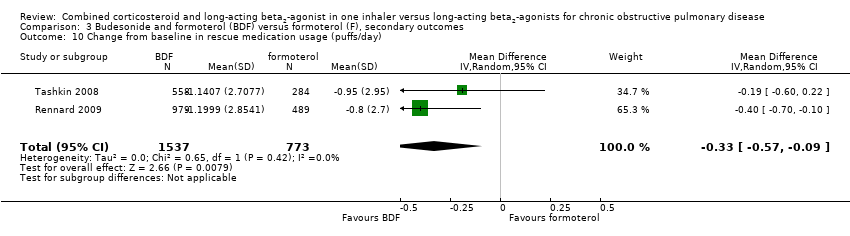
| 21 Change from baseline in rescue medication usage (puffs/day) Show forest plot | 4 | 2435 | Mean Difference (IV, Random, 95% CI) | ‐0.38 [‐0.61, ‐0.16] |
|
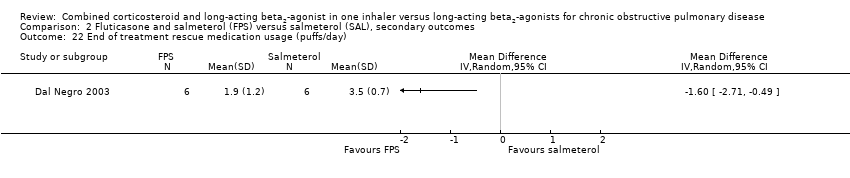
| 22 End of treatment rescue medication usage (puffs/day) Show forest plot | 1 | | Mean Difference (IV, Random, 95% CI) | Totals not selected |
|
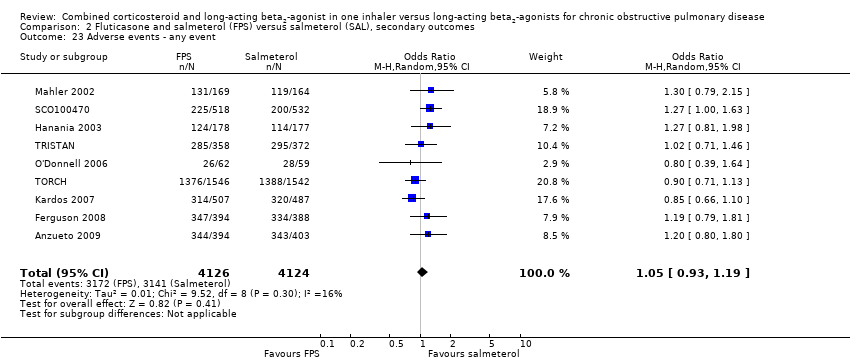
| 23 Adverse events ‐ any event Show forest plot | 9 | 8250 | Odds Ratio (M‐H, Random, 95% CI) | 1.05 [0.93, 1.19] |
|
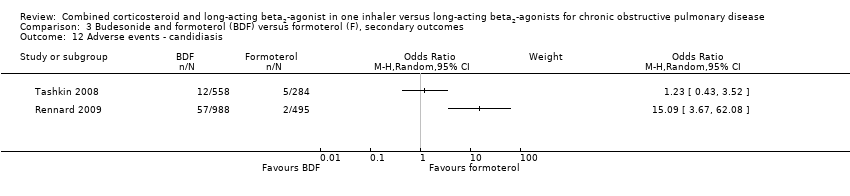
| 24 Adverse events ‐ candidiasis Show forest plot | 6 | 3118 | Odds Ratio (M‐H, Random, 95% CI) | 3.75 [2.33, 6.04] |
|
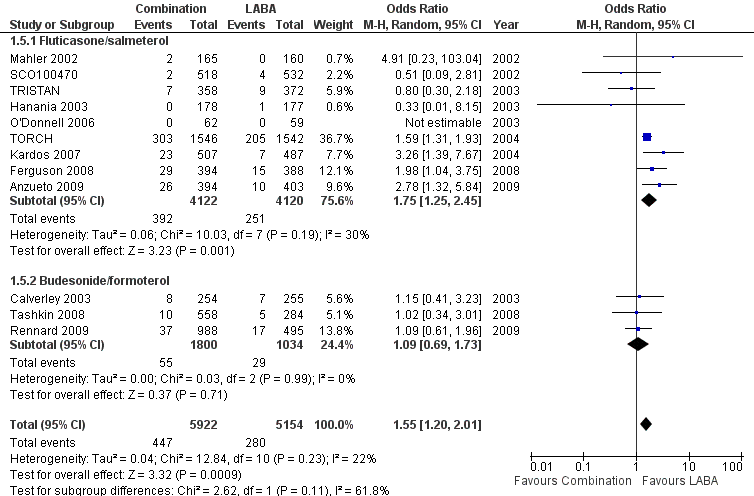
| 25 Adverse events ‐ pneumonia Show forest plot | 9 | 8242 | Odds Ratio (M‐H, Random, 95% CI) | 1.75 [1.25, 2.45] |
|
| 26 Adverse events ‐ headache Show forest plot | 8 | 7237 | Odds Ratio (M‐H, Random, 95% CI) | 1.06 [0.90, 1.26] |
|
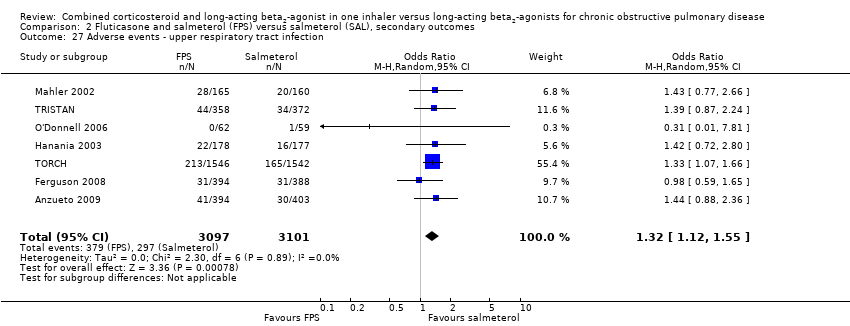
| 27 Adverse events ‐ upper respiratory tract infection Show forest plot | 7 | 6198 | Odds Ratio (M‐H, Random, 95% CI) | 1.32 [1.12, 1.55] |
|
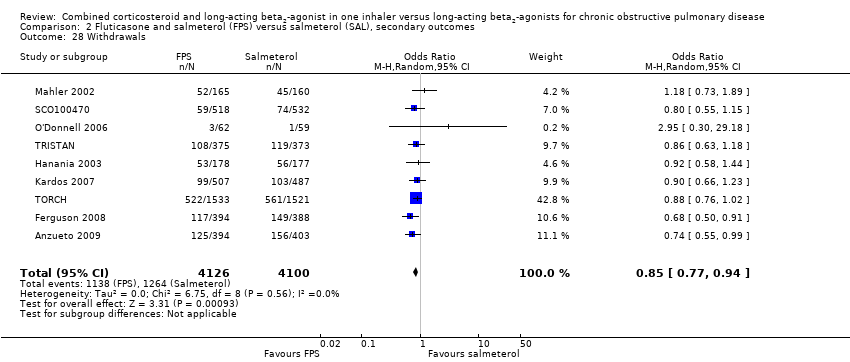
| 28 Withdrawals Show forest plot | 9 | 8226 | Odds Ratio (M‐H, Random, 95% CI) | 0.85 [0.77, 0.94] |
|
| 29 Withdrawals due to lack of efficacy Show forest plot | 6 | 6739 | Odds Ratio (M‐H, Random, 95% CI) | 0.53 [0.39, 0.72] |
|
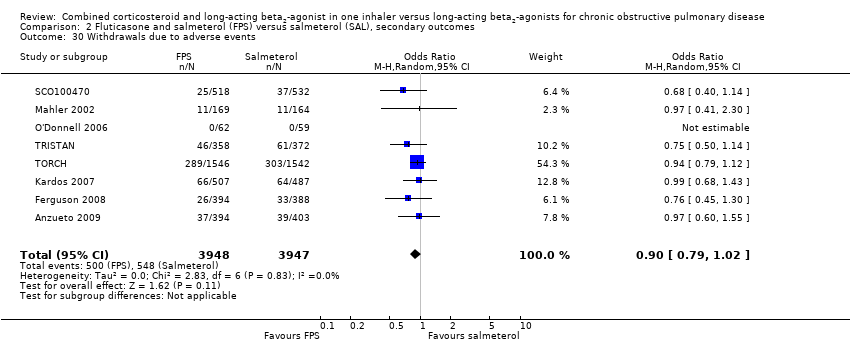
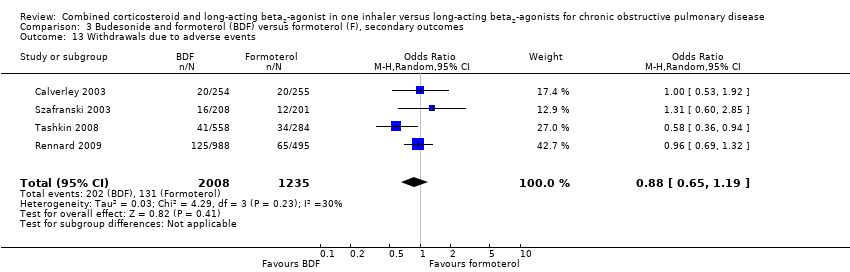
| 30 Withdrawals due to adverse events Show forest plot | 8 | 7895 | Odds Ratio (M‐H, Random, 95% CI) | 0.90 [0.79, 1.02] |
|