Irrigación nasal con solución salina para las infecciones agudas de las vías respiratorias superiores
Referencias
Referencias de los estudios incluidos en esta revisión
Referencias de los estudios excluidos de esta revisión
Referencias adicionales
Referencias de otras versiones publicadas de esta revisión
Characteristics of studies
Characteristics of included studies [ordered by study ID]
Ir a:
| Methods | Randomised controlled trial. 1 year duration | |
| Participants | 143 adults with common cold or acute rhinosinusitis, with symptoms for less than 3 weeks duration, were randomised. Conducted in Minnesota, USA. 119 participants contributed data for analysis | |
| Interventions | Hypertonic saline spray, 2 squirts in each nostril 3 times a day Treatment continued until resolution of symptoms | |
| Outcomes | Nasal symptom score on day 3 | |
| Notes | — | |
| Risk of bias | ||
| Bias | Authors' judgement | Support for judgement |
| Random sequence generation (selection bias) | Low risk | Random numbers table used |
| Allocation concealment (selection bias) | Unclear risk | Not mentioned in paper |
| Blinding (performance bias and detection bias) | Low risk | Patients and clinicians blinded; outcome assessors not discussed |
| Incomplete outcome data (attrition bias) | Unclear risk | Drop‐out and losses to follow‐up not discussed. 24 participants (16%) were lost to follow‐up |
| Selective reporting (reporting bias) | Unclear risk | Intention‐to‐treat analysis performed; original study protocol not available |
| Other bias | Low risk | No other potential sources of bias identified |
| Methods | Randomised controlled trial. November and December 1980 | |
| Participants | 74 children were randomised, from 3 weeks to 2 years of age, with unspecified acute upper respiratory infections. Los Angeles, California, USA. 46 children contributed data for analysis | |
| Interventions | Saline nose drops, 0.9%, 4 drops in each nostril every 2 hours as needed | |
| Outcomes | Measured at 2 days after first visit Nasal symptom score | |
| Notes | — | |
| Risk of bias | ||
| Bias | Authors' judgement | Support for judgement |
| Random sequence generation (selection bias) | Low risk | Random numbers table used |
| Allocation concealment (selection bias) | Unclear risk | Not mentioned in paper |
| Blinding (performance bias and detection bias) | Unclear risk | Outcome assessors blinded; others (including patients/parents) not blinded, control group had no comparable intervention to the intervention groups |
| Incomplete outcome data (attrition bias) | High risk | Drop‐outs and losses to follow‐up adequately discussed; 28 out of 74 participants dropped out, equal in all 3 groups |
| Selective reporting (reporting bias) | Unclear risk | Intention‐to‐treat analysis not performed; original study protocol not available |
| Other bias | Low risk | No other potential sources of bias identified |
| Methods | Randomised controlled trial. 2010 to 2012 | |
| Participants | 62 adults with common cold or URTI diagnosed clinically, Brisbane, Australia. 33 participants contributed data for analysis | |
| Interventions | Saline nasal spray, plus usual treatment. Normal saline, instructed to use 2 to 3 sprays in each nostril at least 4 times daily Control group ‐ usual treatment apart from any other medication delivered by nose spray | |
| Outcomes | Day to wellness Symptom score | |
| Notes | — | |
| Risk of bias | ||
| Bias | Authors' judgement | Support for judgement |
| Random sequence generation (selection bias) | Low risk | Computer‐generated blocks of 10 for randomisation |
| Allocation concealment (selection bias) | Low risk | Allocation done using opaque envelopes that were pre‐packaged |
| Blinding (performance bias and detection bias) | Unclear risk | Participants know which allocation they have received by the nature of their treatment Outcome assessed by patient reporting via symptom diary only |
| Incomplete outcome data (attrition bias) | High risk | Adequately described but many more participants lost to follow‐up in the treatment group compared with placebo. Only 33 of 62 enrolled completed follow‐up |
| Selective reporting (reporting bias) | Low risk | All reported on adequately as pre‐described; original study protocol was available |
| Other bias | Low risk | Recruited from attending GPs who may have biased more serious infections ‐ unlikely to have affected outcome |
| Methods | Randomised controlled trial. Multicentre, open‐label. January to April 2006 | |
| Participants | 401 children aged 6 to 10 years, with common cold or influenza. Czech Republic. 390 contributed study data | |
| Interventions | 3 groups randomised to receive different delivery methods of isotonic saline (sea water), delivered 6 times per day, plus standard treatments Group 1 ‐ medium jet flow Group 2 ‐ fine spray Group 3 ‐ eye and nose wash with a fine spray | |
| Outcomes | Nasal symptom and breathing scores | |
| Notes | — | |
| Risk of bias | ||
| Bias | Authors' judgement | Support for judgement |
| Random sequence generation (selection bias) | High risk | Sequence of clinic arrival used for allocation |
| Allocation concealment (selection bias) | Unclear risk | Not mentioned in paper |
| Blinding (performance bias and detection bias) | Unclear risk | No patient blinding possible due to study design; outcome assessors blinded to saline delivery method but not to intervention versus control |
| Incomplete outcome data (attrition bias) | Low risk | Drop‐out and losses to follow‐up small and adequately discussed. 390 of 401 completed the study (11 lost to follow‐up) |
| Selective reporting (reporting bias) | Unclear risk | Intention‐to‐treat analysis not performed; original study protocol not available |
| Other bias | Low risk | No other potential sources of bias identified |
| Methods | Randomised controlled trial. December 2006 to June 2008 | |
| Participants | 69 children, aged 3 to 12 years, with acute sinusitis. Taiwan. 2 evidently lost to follow‐up | |
| Interventions | Normal saline nasal irrigation, with 15 to 20 ml each nostril, 1 to 3 times a day and standard treatments Standard treatments only | |
| Outcomes | Nasal symptom score Paediatric Rhinoconjunctivitis Quality of Life Score Nasal peak expiratory flow rate Nasal smear Sinus X‐ray | |
| Notes | — | |
| Risk of bias | ||
| Bias | Authors' judgement | Support for judgement |
| Random sequence generation (selection bias) | Unclear risk | Correspondence from authors confirmed randomisation but no detail on method |
| Allocation concealment (selection bias) | Unclear risk | Not described in paper, nor obtained from authors. 30 participants assigned to intervention and 39 to placebo group. Significant differences between groups at baseline, particularly in rhinorrhoea score |
| Blinding (performance bias and detection bias) | High risk | Poorly described. Most outcome measures were not blinded to participants or researchers. Some outcomes were objective measures, less vulnerable to bias |
| Incomplete outcome data (attrition bias) | Low risk | There is a comparatively small loss of participant data (2 out of 69 not included) but no explanation in the paper |
| Selective reporting (reporting bias) | High risk | Not all of the study's pre‐specified primary outcomes have been reported; some outcomes of interest in the review are reported incompletely In addition, there are errors in the reported tabulated data. We clarified with the authors which data are correct before including data in our review |
| Other bias | High risk | In addition to the above, there are some methodological flaws, mainly the averaging of symptoms over a week, especially over the first week that included a baseline measurement. We noted that from the data we cannot conclude that the groups were equal at baseline, nor that the improvement was due to an early treatment effect. We asked the authors to address this issue, with no reply |
OTC = over the counter
URTI = upper respiratory tract infection
Characteristics of excluded studies [ordered by study ID]
Ir a:
| Study | Reason for exclusion |
| Failed to meet the inclusion criteria, as no clinically relevant outcomes measured Method of allocation concealment not described | |
| Failed to meet the inclusion criteria, as no comparison group as a control; both groups in the trial received nasal saline via different delivery methods Methods of randomisation and allocation concealment not described |
Data and analyses
| Outcome or subgroup title | No. of studies | No. of participants | Statistical method | Effect size |
| 1 Mean days to wellness (normal saline plus standard therapy versus standard therapy) Show forest plot | 2 | 111 | Mean Difference (IV, Random, 95% CI) | ‐0.79 [‐4.72, 3.14] |
| Analysis 1.1  Comparison 1 Time to symptom resolution, Outcome 1 Mean days to wellness (normal saline plus standard therapy versus standard therapy). | ||||
| Outcome or subgroup title | No. of studies | No. of participants | Statistical method | Effect size |
| 1 Antibiotic usage (normal saline plus standard therapy versus standard therapy) Show forest plot | 2 | 422 | Odds Ratio (M‐H, Random, 95% CI) | 0.64 [0.29, 1.44] |
| Analysis 2.1  Comparison 2 Antibiotic use, Outcome 1 Antibiotic usage (normal saline plus standard therapy versus standard therapy). | ||||
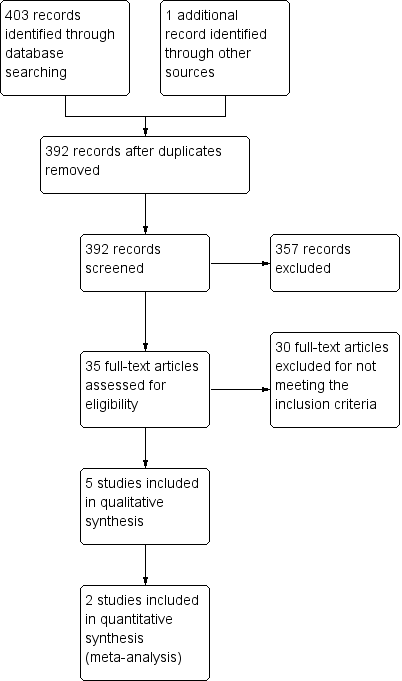
Study flow diagram.

'Risk of bias' summary: review authors' judgements about each risk of bias item for each included study.

'Risk of bias' graph: review authors' judgements about each risk of bias item presented as percentages across all included studies.

Comparison 1 Time to symptom resolution, Outcome 1 Mean days to wellness (normal saline plus standard therapy versus standard therapy).

Comparison 2 Antibiotic use, Outcome 1 Antibiotic usage (normal saline plus standard therapy versus standard therapy).
| Normal saline plus standard treatment compared to standard treatment alone for acute upper respiratory tract infections | ||||||
| Patient or population: patients with acute upper respiratory tract infections | ||||||
| Outcomes | Illustrative comparative risks* (95% CI) | Relative effect | No. of participants | Quality of the evidence | Comments | |
| Assumed risk | Corresponding risk | |||||
| Standard treatment alone | Normal saline plus standard treatment | |||||
| Mean days to wellness | The mean days to wellness in the control groups was | The mean days to wellness in the intervention groups was | 111 | ⊕⊝⊝⊝ | ||
| Antibiotic usage | Study population | OR 0.65 | 422 | ⊕⊝⊝⊝ | ||
| 89 per 1000 | 60 per 1000 | |||||
| Moderate | ||||||
| 88 per 1000 | 59 per 1000 | |||||
| Sore throat | The mean sore throat in the control groups was | The mean sore throat in the intervention groups was | 390 | ⊕⊕⊝⊝ | ||
| *The basis for the assumed risk (e.g. the median control group risk across studies) is provided in footnotes. The corresponding risk (and its 95% confidence interval) is based on the assumed risk in the comparison group and the relative effect of the intervention (and its 95% CI). | ||||||
| GRADE Working Group grades of evidence | ||||||
| 1Bias is likely in the included studies as adequate blinding is not possible with this intervention. | ||||||
| Treatment group | Health status score |
| Symptomatic improvement compared to beginning of illness ‐ Normal treatment only | 2.60 (SD 1.02) ‐ cold 2.00 (SD 0.91) ‐ flu |
| Symptomatic improvement compared to beginning of illness ‐ Normal treatment plus isotonic saline | 1.87 (SD 0.84) ‐ cold 1.59 (SD 0.74) ‐ flu |
| Reported as significant findings (see Results section). Insufficient data to calculate confidence intervals. SD: standard deviation | |
| Treatment group | Day of well‐being |
| Hypertonic saline irrigation | 8.3 days (95% CI 6.9 to 9.7) |
| Normal saline irrigation | 8.3 days (95% CI 6.82 to 9.78) |
| Observation only | 8.0 days (95% CI 6.7 to 9.3) |
| CI: confidence interval | |
| Medication type | Use before study (%) | Use at follow‐up (%) |
| Antipyretics | 23.8 (control) 23.5 (saline wash) | 12.9 (control) 7.6 (saline wash) |
| Decongestants | 40.0 (control) 29.4 (saline wash) | 35.6 (control) 15.9 (saline wash) |
| Mucolytics | 20.0 (control) 15.6 (saline wash) | 31.7 (control) 17.3 (saline wash) |
| Systemic antibiotics | 5.0 (control) 3.1 (saline wash) | 8.9 (control) 5.5 (saline wash) |
| Outcome or subgroup title | No. of studies | No. of participants | Statistical method | Effect size |
| 1 Mean days to wellness (normal saline plus standard therapy versus standard therapy) Show forest plot | 2 | 111 | Mean Difference (IV, Random, 95% CI) | ‐0.79 [‐4.72, 3.14] |
| Outcome or subgroup title | No. of studies | No. of participants | Statistical method | Effect size |
| 1 Antibiotic usage (normal saline plus standard therapy versus standard therapy) Show forest plot | 2 | 422 | Odds Ratio (M‐H, Random, 95% CI) | 0.64 [0.29, 1.44] |