Irrigación nasal con solución salina para las infecciones agudas de las vías respiratorias superiores
Resumen
Antecedentes
Las infecciones agudas de las vías respiratorias superiores (IAVRS), incluidos el resfriado común y la rinosinusitis, son trastornos frecuentes que originan molestia y debilitamiento, y contribuyen significativamente al ausentismo laboral. El tratamiento suele consistir en medicamentos antipiréticos y descongestionantes y, a veces, en antibióticos, aunque la mayoría de las infecciones son virales. La irrigación nasal con solución salina suele emplearse como tratamiento complementario de los síntomas de las IAVRS, a pesar de la relativa falta de evidencia de su beneficio en este entorno clínico. Esta revisión es una actualización de la revisión Cochrane realizada por Kassel y cols., que encontró que la solución salina probablemente fue efectiva para reducir la gravedad de algunos síntomas asociados con las IAVRS.
Objetivos
Evaluar los efectos de la irrigación nasal con solución salina para el tratamiento de los síntomas de las IAVRS.
Métodos de búsqueda
Se hicieron búsquedas en CENTRAL (2014, número 7), MEDLINE (1966 hasta julio, semana 5, 2014), EMBASE (1974 hasta agosto 2014), CINAHL (1982 hasta agosto 2014), AMED (1985 hasta agosto 2014) y LILACS (1982 hasta agosto 2014).
Criterios de selección
Ensayos controlados aleatorizados (ECA) que comparan el tratamiento nasal tópico con solución salina con otras intervenciones en adultos y niños con IAVRS diagnosticadas clínicamente.
Obtención y análisis de los datos
Dos revisores (DK, BM) evaluaron de forma independiente la calidad de los ensayos con la herramienta Cochrane "Riesgo de sesgo" y extrajeron los datos. Se analizaron todos los datos utilizando el software Cochrane Review Manager. Debido a la gran variabilidad de las medidas de resultado, sólo se pudo agrupar un pequeño número de resultados para el análisis estadístico.
Resultados principales
Se identificaron cinco ECA que asignaron al azar a 544 niños (tres estudios) y 205 adultos (exclusivamente de dos estudios). Todos compararon la irrigación salina con el cuidado habitual u otros aerosoles nasales, en lugar de un placebo. Se incluyeron dos nuevos ensayos en esta actualización, que no aportaron datos de tamaño o calidad suficientes para cambiar materialmente los hallazgos originales. La mayoría de los ensayos fueron pequeños y se consideraron de baja calidad, lo que contribuye a un riesgo de sesgo incierto. La mayoría de las medidas de resultado difieren enormemente entre los estudios incluidos y, por lo tanto, no se pueden agrupar. La mayoría de los resultados no exhibieron diferencias entre el tratamiento nasal con solución salina y el control. Sin embargo, un ensayo más grande, realizado con niños, mostró una reducción significativa en la puntuación de secreción nasal (diferencia de medias (DM) ‐0,31; intervalo de confianza (IC) del 95%: ‐0,48 a ‐0,14) y en la puntuación de respiración nasal (obstrucción) (DM ‐0,33; IC del 95%: ‐0,47 a ‐0,19) en el grupo de solución salina. Sin embargo, una DM de ‐0,33 en una escala de síntomas de cuatro puntos puede tener una significancia clínica mínima. El ensayo también mostró una reducción significativa en el uso de medicamentos descongestionantes por parte del grupo de la solución salina. Una minoría de los participantes informó de una pequeña molestia y/o irritación nasal como único efecto secundario.
Conclusiones de los autores
La irrigación salina nasal posiblemente tenga beneficios para aliviar los síntomas de las IVRS agudas. Sin embargo, los ensayos incluidos eran en general demasiado pequeños y tenían un alto riesgo de sesgo, lo que reducía la confianza en la evidencia que la respaldaba. Los ensayos futuros deberían incluir un mayor número de participantes e informar sobre medidas de resultado estandarizadas y clínicamente significativas.
PICO
Resumen en términos sencillos
Irrigación salina nasal para síntomas de infección aguda de las vías respiratorias superiores
Pregunta de la revisión
¿La adición de un aerosol o lavado salino nasal a los cuidados habituales o un placebo reduce la gravedad de los síntomas o acelera la recuperación de adultos y niños con síntomas de resfriado y gripe que han estado presentes durante menos de cuatro semanas?
Antecedentes
Las infecciones agudas de las vías respiratorias superiores (IAVRS) incluyen resfriados, gripe e infecciones de la garganta, la nariz o los senos paranasales. Suelen ser infecciones virales autolimitantes, aunque a veces los síntomas pueden persistir durante muchas semanas después de la eliminación de la infección inicial, con o sin el establecimiento de infecciones bacterianas secundarias. El objetivo del tratamiento es predominantemente el alivio de los síntomas, aunque algunos tratamientos pueden contribuir a reducir la duración de los síntomas postvirales, como la tos. El aerosol nasal salino y los lavados nasales de mayor volumen se han hecho más populares como una de las muchas opciones de tratamiento para las infecciones urinarias, y se ha demostrado que tienen cierta efectividad para la sinusitis crónica y después de la cirugía nasal. Sin embargo, se sabe poco acerca de su efectividad en el tratamiento de las infecciones agudas de las vías respiratorias o de los síntomas para los que pueden ser eficaces.
Características de los estudios
Se identificaron cinco estudios, con un total de 749 participantes inscritos y 565 participantes que proporcionaron datos, que abordaron la cuestión de la investigación y cumplieron los criterios de inclusión. Todos compararon la irrigación salina con los cuidados habituales u otros aerosoles nasales. Estos estudios abarcaron una amplia gama de edades, países, tamaños de muestra, métodos de dosificación y frecuencia, y el tiempo transcurrido desde el inicio de los síntomas de las IAVRS. También fueron muy variables en su diseño y en los síntomas que se midieron. Esto no es sorprendente debido a la falta de medidas consistentes de los síntomas y signos de las IAVRS. Esto dio lugar a muy pocas medidas de resultados comunes que pudieran combinarse en estos cinco estudios. La evidencia está actualizada hasta agosto de 2014.
Resultados clave
Los dos estudios adicionales incluidos desde la revisión sistemática original no han aportado datos de tamaño o calidad suficientes para modificar materialmente las conclusiones originales. Sólo el estudio más grande, que estudió a 401 niños de 6 a 10 años de edad, encontró reducciones significativas en una serie de síntomas, incluyendo secreciones nasales, dolor de garganta, puntuación de respiración nasal y obstrucción nasal, así como una reducción en el uso de medicamentos descongestionantes nasales adicionales. También informó de una mejora significativa en la puntuación del estado de salud. Hubo una reducción en el resultado del tiempo de resolución de los síntomas, que se informó en dos ensayos con participantes adultos, pero la diferencia no fue clínicamente significativa. La solución salina nasal es inocua pero puede causar efectos adversos menores, como irritación o sensación de ardor, en particular con productos que utilizan flujos o concentraciones más elevadas.
Calidad de la evidencia
La mayoría de los estudios eran pequeños y presentaban deficiencias importantes en el diseño o la ejecución de la investigación. Se necesitan más estudios, preferiblemente de mayor tamaño y que utilicen medidas de resultado comunes, para establecer el potencial del papel de la irrigación salina nasal en la reducción de la gravedad y la duración de los síntomas agudos de las IAVRS, las infecciones secundarias y posiblemente el uso de antibióticos.
Authors' conclusions
Summary of findings
| Normal saline plus standard treatment compared to standard treatment alone for acute upper respiratory tract infections | ||||||
| Patient or population: patients with acute upper respiratory tract infections | ||||||
| Outcomes | Illustrative comparative risks* (95% CI) | Relative effect | No. of participants | Quality of the evidence | Comments | |
| Assumed risk | Corresponding risk | |||||
| Standard treatment alone | Normal saline plus standard treatment | |||||
| Mean days to wellness | The mean days to wellness in the control groups was | The mean days to wellness in the intervention groups was | 111 | ⊕⊝⊝⊝ | ||
| Antibiotic usage | Study population | OR 0.65 | 422 | ⊕⊝⊝⊝ | ||
| 89 per 1000 | 60 per 1000 | |||||
| Moderate | ||||||
| 88 per 1000 | 59 per 1000 | |||||
| Sore throat | The mean sore throat in the control groups was | The mean sore throat in the intervention groups was | 390 | ⊕⊕⊝⊝ | ||
| *The basis for the assumed risk (e.g. the median control group risk across studies) is provided in footnotes. The corresponding risk (and its 95% confidence interval) is based on the assumed risk in the comparison group and the relative effect of the intervention (and its 95% CI). | ||||||
| GRADE Working Group grades of evidence | ||||||
| 1Bias is likely in the included studies as adequate blinding is not possible with this intervention. | ||||||
Background
Description of the condition
Acute upper respiratory tract infections (URTIs) involve the upper airways (the nose, sinuses, larynx and pharynx) and include the common cold, influenza, rhinitis, sinusitis, laryngitis, pharyngitis, tonsillitis and otitis media. Acute infections are defined as those with symptoms lasting up to 28 days (Meltzer 2006).
Acute URTIs are common, can vary in severity from mild to distressing and debilitating and are a major cause of lost days of work and schooling. The economic impact of the common cold alone on workplace absenteeism is estimated to be billions of dollars (Bramley 2002).
Usual treatments for URTIs are symptomatic. Treatment may include antipyretic and analgesic drugs, mucolytics, expectorants and decongestants (NICE 2008; Simasek 2007). While acute URTIs are mainly caused by viruses, antibiotics are often prescribed (Nash 2002). This may lead to increased antibiotic resistance and adverse outcomes, as well as being unnecessary for the patient (NICE 2008).
Description of the intervention
Saline can be delivered to the nose as a large‐volume wash using reservoir pots and tubing, or in a small volume via spray devices that deliver a fine mist or jet of saline into the nose. The usual concentration is 'normal saline', which approximates an iso‐osmolar fluid. Hypertonic saline is sometimes used to deliver a stronger concentration of fluid to the nasal cavity and sinuses.
How the intervention might work
Saline irrigation of the nose, which is a popular treatment for sinonasal conditions, is believed to alleviate URTI symptoms by clearing excess mucus, reducing congestion and improving breathing (Tomooka 2000). It is thought to improve mucociliary clearance by increasing the ciliary beat frequency (Talbot 1997). As well as relieving sinonasal symptoms, saline irrigation may remove infectious material from the sinuses and reduce cough associated with postnasal drip (Kaliner 1998). There is evidence for the effectiveness of nasal saline irrigation for chronic sinusitis (Rabago 2002) and allergic rhinitis (Garavello 2003). It has been used as monotherapy or as an adjunct to other treatments, such as oral antihistamines. It is available commercially in various concentrations and formulations of salt and water combinations and is usually delivered by atomised spray or in larger volumes for lavage.
Why it is important to do this review
Nasal saline treatment may reduce the burden of disease and workplace absenteeism and reduce the over‐prescription of antibiotics for acute URTIs. One non‐systematic review of the existing literature found that most trials of nasal saline in acute URTIs were very small, with some being uncontrolled experiments, and concluded that the evidence in favour of nasal saline was "fair" (Papsin 2003). A Cochrane Review assessed nasal saline irrigation as a treatment for chronic rhinosinusitis and found that it may be useful in providing symptomatic relief, without significant side effects (Harvey 2007).
This systematic review evaluates the efficacy of saline irrigation in the treatment of acute URTIs, to determine whether saline nasal irrigation improves respiratory symptoms of acute URTIs.
Objectives
To assess the effects of saline nasal irrigation for treating the symptoms of acute URTIs.
Methods
Criteria for considering studies for this review
Types of studies
Randomised controlled trials (RCTs) comparing topical nasal saline treatment (liquid, drops or spray) with at least one other intervention or placebo. We excluded studies trialing another therapy where saline irrigation was used as a control treatment. We excluded non‐RCTs or non‐comparative studies.
Types of participants
Adults and children diagnosed with acute URTIs featuring nasal and/or sinus symptoms for less than four weeks. (Types of acute URTIs include rhinosinusitis, pharyngitis, otitis media, tonsillitis, common cold and influenza).
We excluded studies involving patients with allergic respiratory symptoms, chronic respiratory infections or chronic diseases with respiratory features, such as cystic fibrosis, or those recovering from sinus surgery. We also excluded studies that examined the prevention of developing URTIs from regular use of saline irrigation.
Types of interventions
We proposed to include the following interventions.
-
Nasal lavage, irrigation or similar topical nasal liquid saline treatment, compared with a placebo.
-
Nasal lavage, irrigation or similar topical nasal liquid saline treatment, compared with other standard treatment.
-
Nasal saline plus standard treatment compared with standard treatment alone.
We included studies using atomised sprays or irrigation with larger volumes of saline solutions and all types of commercially available saline preparations and concentrations, including isotonic and hypertonic solutions.
Types of outcome measures
Primary outcomes
-
Change in severity of acute URTI‐related symptoms (for example, nasal discharge, congestion, sneezing, headache, sore throat) over periods up to 28 days.
-
Time to resolution of symptomatic illness.
Secondary outcomes
-
Adverse events associated with treatment.
-
Days off work or school.
-
Antibiotic and URTI medication use.
Search methods for identification of studies
Electronic searches
For this update we searched the Cochrane Central Register of Controlled Trials (CENTRAL 2014, Issue 7) (accessed 13 August 2014), which contains the Acute Respiratory Infections (ARI) Group's Specialised Register, MEDLINE (May 2009 to July week 5, 2014), EMBASE (May 2009 to August 2014), CINAHL (May 2009 to August 2014), AMED (May 2009 to August 2014) and LILACS (May 2009 to August 2014). Details of the previous search strategy are in Appendix 1.
We used the search terms described in Appendix 2 to search MEDLINE and CENTRAL. We combined the MEDLINE search with the Cochrane Highly Sensitive Search Strategy for identifying randomised trials in MEDLINE; sensitivity‐ and precision‐maximising version (2008 revision); Ovid format (Lefebvre 2011). We modified the search terms to search EMBASE (Appendix 3), CINAHL (Appendix 4), AMED (Appendix 5) and LILACS (Appendix 6). There were no language or publication restrictions.
Searching other resources
We checked the Australian New Zealand Clinical Trial Register database (http://www.anzctr.org.au/) and the US National Institutes of Health (http://www.clinicaltrials.gov) for relevant studies. We sought evidence of any adverse effects of saline nasal irrigation from other sources, including the US Food and Drug Administration's MedWatch (www.fda.gov/medwatch), the UK Medicines Control Agency (https://www.gov.uk/government/organisations/medicines‐and‐healthcare‐products‐regulatory‐agency) and the Australian Adverse Drug Reactions Bulletin (http://www.health.gov.au).
We made and handsearched a list of relevant journals. This included: Archives of Otolaryngology, Laryngoscope, Archives of Family Medicine, Journal of Family Practice, Clinical Otolaryngology and American Journal of Otolaryngology.
We also identified studies by checking the bibliographies of all studies retrieved. We contacted authors of relevant trials regarding any recent unpublished work.
Data collection and analysis
We considered, processed and reported data from the included trials in close consultation with the Cochrane Handbook for Systematic Reviews of Interventions version 5.1.0 (Higgins 2011).
Selection of studies
In this 2014 update, two review authors (DK, CW) independently screened the titles and abstracts to exclude studies that were clearly irrelevant. We compared the full texts of the potentially relevant studies to the eligibility criteria. In the original search, one review author (JK) selected the studies. Two review authors (DK, GS) checked the results.
Data extraction and management
Two review authors (DK, BM) independently extracted and summarised details of the studies using a data extraction sheet. Data extracted included year and country of study, study population, methodological quality, type of saline solution used, any adverse events and outcomes. We contacted trial authors for missing information where possible. However, the authors of one paper in the updated search replied to questions about methodology but provided no further information (Wang 2009). We managed and analysed data using Review Manager software, version 5.3 (RevMan 2014).
Assessment of risk of bias in included studies
We assessed trials for risk of bias and appropriateness for inclusion as per the Cochrane Handbook for Systematic Reviews of Interventions version 5.1.0 (Higgins 2011). We undertook 'Risk of bias' assessment by evaluating the following components for each included study.
-
The method of generation of the randomisation sequence ‐ if it delivered a known chance allocation to each given group, but individual allocation could not be anticipated.
-
The method of allocation concealment ‐ considered 'adequate' when the assignment could not be foreseen.
-
Who was masked or unmasked to the intervention (participants, clinicians, outcome assessors).
-
Participants lost to follow‐up in each arm of the study (split into post‐randomisation exclusions and later losses if possible) and whether participants were analysed in the groups to which they were originally randomised (intention‐to‐treat).
In addition, we collated aspects related to follow‐up, participants lost to follow‐up, protocol violations and sample size determinations. We recorded the information in the 'Risk of bias' tables and gave a description of the quality of each study, based on a summary of these components.
Measures of treatment effect
We measured treatment effects using odds ratio for categorical outcomes and mean difference for continuous measures such as days of illness and symptom scores. Where continuous outcomes were measuring the same outcome, such as symptom score, but using different scales we used standardised mean difference to assess the potential to combine such studies in a meta‐analysis.
Unit of analysis issues
The unit of analysis was the individual patient who was randomised in each RCT, which allowed standard analysis techniques. Cluster‐randomisation did not occur in the included studies.
Dealing with missing data
Where missing data were present, we intended to contact the original investigators to request the missing data. We assumed that missing data were missing at random. Where studies were missing more than 40% of their data, we intended to conduct sensitivity analysis to explore the nature of the missing data, where the data were available to do this.
Assessment of heterogeneity
We assessed heterogeneity for results measuring similar outcomes. Firstly, we assessed heterogeneity by the degree of overlap in confidence intervals. Where there was little or no overlap, we assumed significant heterogeneity. Secondly, we looked at the Chi2 test and assumed that for results with a P value greater than 0.1, significant heterogeneity was likely. Thirdly, we looked at the I2 statistic and assumed that results greater than 40% indicated concern about heterogeneity. Where we suspected significant heterogeneity, we did not report totals.
Assessment of reporting biases
We attempted to retrieve all the collected data from all included studies (published and unpublished). We intended to compare the results of studies funded by manufacturers of nasal saline delivery products versus those that were funded independently. We also intended to compare the results of published and unpublished studies. We compared the outcomes reported in the trial against the protocol for the studies, whenever possible, to assess for reporting bias.
Data synthesis
We undertook meta‐analysis for outcomes where there were sufficient comparable data using random‐effects methods and heterogeneity did not preclude pooling of results. We conducted narrative synthesis of results where it was not possible to pool outcome data.
Subgroup analysis and investigation of heterogeneity
We intended to analyse by subgroups in the event of multiple outcome measures with significant heterogeneity. Groupings that may have been relevant to this study include gender, geographical location, age of participants and type of intervention. This was not relevant to this review as there were insufficient studies to pool data.
Sensitivity analysis
We intended to consider sensitivity analysis to investigate the effects of published versus unpublished studies, the quality of included studies and the different types of nasal saline delivery. However, these analyses were not required in this review owing to the small number of outcomes for a small number of included studies.
GRADE and 'Summary of findings' table
In this update, we used the GRADE approach to interpret the main findings and report outcome‐specific information and the overall quality of evidence from the included studies in each comparison (GRADE 2009). We used the GRADE profiler (GRADEpro 2014) software to import data from Review Manager 5.3 (RevMan 2014) to create a 'Summary of findings' table. We downgraded the evidence from 'high quality' by one level (two if severe) for study limitations that are likely to have a serious impact on the results, including bias for blinding, inconsistency in treatment effects and imprecision (studies with small numbers had confidence intervals that included minor to very large effect sizes).
Results
Description of studies
Results of the search
The initial (2009) search yielded the following results: 146 articles in MEDLINE, 68 in EMBASE, 49 in CENTRAL, 22 in CINAHL and none in AMED or LILACS. Of the total 285 trials retrieved, we excluded 280 based on a review of titles and abstracts. Of the five remaining trials, we assessed three as meeting the inclusion criteria and excluded two as not meeting the minimum quality criteria.
This 2014 update identified 75 additional records from searches covering April 2009 to August 2014, with the following results: 18 articles in MEDLINE, 32 in EMBASE, 14 in CENTRAL, 10 in CINAHL, none in AMED and one in LILACS. Of the articles found in these searches, we excluded 46 based on a review of titles and abstracts as not meeting the inclusion criteria. We only selected one study as meeting the inclusion criteria after reading the full text and included it in the updated review (Wang 2009).
We included one further study in this updated review (King 2012, unpublished). This unpublished trial was brought to the attention of the review team by one of the authors (DK). His role in the trial was as a supervisor and clinician. The 'Risk of bias' assessment and data extraction were undertaken by an independent author (BM) who had no role in this trial.
A flowchart of study selection is attached (Figure 1).
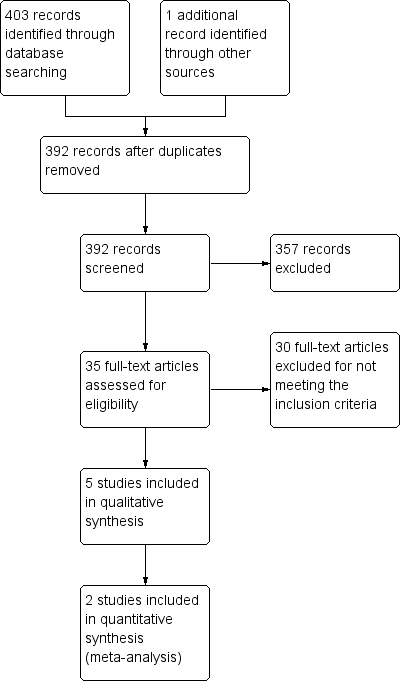
Study flow diagram.
Included studies
See Characteristics of included studies.
Adam 1998 randomised 143 adults in the USA with clinically diagnosed acute rhinosinusitis or common cold to one of three groups: hypertonic nasal saline irrigation, normal saline irrigation or no treatment (control). One hundred and nineteen adults completed follow‐up and contributed data for analysis.
Bollag 1984 studied 74 children in the USA with clinically diagnosed acute URTIs that were randomised to treatment with normal saline drops, phenylephrine drops or no treatment. Forty‐six participants were analysed (28 were lost to follow‐up).
Slapak 2008 studied 401 children in the Czech Republic with clinically diagnosed common cold or influenza that were randomised to receive standard treatment with or without adjunct nasal irrigation with isotonic saline. Three hundred and ninety contributed data for analysis. The intervention group was further subdivided into three subgroups using different delivery strengths: fine spray, medium jet flow and fine spray eye and nose wash. Each subgroup used the same solution of commercial isotonic seawater. Results were reported for each subgroup and for the saline group as a whole; this review considers the results for the saline group as a whole. Data were reported as mean scores at entry into the study and at a second visit (up to three weeks) with standard deviations. Findings were reported as significant with a P value less than 0.05. Data on symptom scores at earlier time points prior to three weeks were not available, so could not be combined with other studies that all reported outcomes at earlier time points, therefore we have reported the findings descriptively in the text.
Wang 2009 randomised 69 children aged three to 12 years, diagnosed with acute sinusitis and who had symptoms for more than seven days, to either usual care (which included systemic antibiotics, mucolytics and nasal decongestants) or usual care plus nasal saline irrigation. Sixty‐seven contributed data for analysis. Participants completed symptoms diaries (averaged over seven days) and these results were considered in this review. Participants also completed a sinus X‐ray (Water's projection), a nasal smear, quality of life scores and nasal peak expiratory flow rates, but no raw data were presented. These data were also not available from the trial authors and therefore not included in this review.
King 2012 met the inclusion criteria as it randomised 62 adults with clinically diagnosed acute URTIs to receive standard treatment (analgesia, lozenges and cold and flu medications), or standard treatment plus isotonic saline nasal spray. Results were reported using symptom diaries and included first day of wellness; daily symptom scores measured on a four‐point scale; days off work or school; return visits to general practice and use of antibiotics. Only 33 participants contributed data for analysis (see Risk of bias in included studies).
Excluded studies
Two trials were excluded from the original review after evaluation (Inanli 2002; Passali 2005). The main reasons for exclusion were lack of description of randomisation, unblinded studies and inadequate data analysis. Mucociliary clearance, the only outcome measure used by Inanli 2002, was further assessed to be an unsuitable measure for acute URTI symptoms. Passali 2005 was excluded due to doubt as to proper randomisation of the study. For details, see Characteristics of excluded studies table. We also excluded these trials from the 2014 review, but on the grounds of not meeting the inclusion criteria, rather than high risk of bias.
Risk of bias in included studies
A summary of the risk of bias is displayed in Figure 2 and Figure 3. Most studies had some degree of bias as outlined below. For further details, see the Characteristics of included studies table.

'Risk of bias' summary: review authors' judgements about each risk of bias item for each included study.
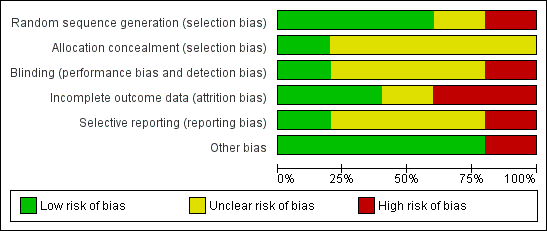
'Risk of bias' graph: review authors' judgements about each risk of bias item presented as percentages across all included studies.
Allocation
Only King 2012 used computer‐generated randomisation to allocate participants to study groups (low risk of bias). Two trials used random number tables (Adam 1998; Bollag 1984). The remaining trials stated that allocation was random but did not describe the method (unclear risk of bias).
Only King 2012 described the method of allocation concealment. An opaque envelope that had been pre‐packaged was used to conceal allocation (low risk of bias). The other included trials did not describe the method of allocation concealment (unclear risk of bias).
Blinding
Each included trial was only partially blinded (patients, clinicians or outcome assessors; sometimes two, but not all three), suggesting some risk of biased results.
In particular, the design of Slapak 2008 made patient blinding largely impossible as each participant either used the saline spray or did not. The outcome assessors were blinded only to the type of saline spray delivery used and not blinded as to whether or not participants were using the saline treatment (unclear risk of bias).
In King 2012, patient blinding was not achievable as the control group did not use a nose spray as placebo. The outcome measures were reported and extracted from a symptom diary so removing the role of any potential for detection bias (unclear risk of bias).
Wang 2009 did not blind participants to the nasal spray. For the unreported outcomes of sinus X‐ray and nasal smear cytology, both of the outcome assessors were blinded to treatment allocation. Blinding was not described for other outcome measures (high risk of bias).
Participants and clinicians were blinded in Adam 1998, but blinding of outcome assessors was not discussed (low risk of bias). Conversely, the outcome assessors in Bollag 1984 were blinded to patient treatment group but blinding of participants (and parents) was not discussed (unclear risk of bias).
Incomplete outcome data
Adam 1998 reported 24 of 143 participants lost to follow‐up, although a further 35 of the completers failed to submit a complete symptom checklist. Intention‐to‐treat analysis was performed (unclear risk of bias).
Bollag 1984 reports that 28 of 74 participants were lost to follow‐up, though evenly distributed between trial groups (high risk of bias).
King 2012 adequately discussed patients lost to follow‐up, however there was a significant difference in numbers lost to follow‐up between the treatment and control groups (high risk of bias).
In Wang 2009 there was no loss to follow‐up. However, there are missing data for two participants for the symptoms scores used in this review. There is one other participant with missing data for an outcome not included in this review (low risk of bias).
Slapak 2008 adequately discussed drop‐outs and losses to follow‐up, which numbered only 11 out of the initial 401 participants enrolled in the trial (low risk of bias).
Selective reporting
Wang 2009 reported statistically significant nasal peak expiratory flow rates but presented no data for this outcome. The authors were unable to provide this. Wang 2009 also reported significantly improved quality of life scores in the nasal saline group but again no data were presented or available to the review authors for inclusion in this review (high risk of bias).
Other potential sources of bias
The Wang 2009 paper also had methodological weaknesses. Patients recorded daily symptoms in a symptom diary, but the baseline score for individual and total symptom score (TSS) was calculated as a mean of daily scores during the baseline period of seven days, rather than on the day of entry to the trial. We also noted that there was a statistically significant difference between the two treatment groups at baseline (which included week one of treatment) as well as at two and three weeks after treatment. This could mean that there was a problem with randomisation or that nasal saline caused the difference within the first week, as these baseline data are averaged over the first seven days. We also noted incorrect data in the tables presented in the Wang 2009 paper. We contacted the trial authors who confirmed this error but stated that the results presented in the text and Table 2 of the paper were correct (high risk of bias). Other potential sources of bias were not identified in the other included studies (low risk of bias).
Bollag 1984 provided incomplete data that were not suitable for pooling, instead reporting only mean scores for each group at baseline and follow‐up two days later, with baseline scores varying considerably. We could calculate the difference in mean improvement across the groups from the data given but standard deviations were not available and we were not able to access original raw data.
Effects of interventions
The clinical measures used in the included studies were so heterogenous as to only allow minimal pooling of data. Other than time to symptom resolution (assessed both by King 2012 and Adam 1998) and antibiotic usage (King 2012; Slapak 2008), the results from each study must be presented individually. Although nasal symptom score was measured by a few studies, differences in methods of data collection make pooling of data impossible or misleading. For example, Adam 1998 reported a nasal symptoms score that was a composite of both nasal and non‐nasal symptoms (cough, headache), which precluded pooling of data. Wang 2009 also measured nasal symptoms scores. However, the data were averaged over a week‐long cycle, without reporting the baseline score at trial entry, and could not be combined.
Primary outcomes
1. Change in severity of acute upper respiratory tract infection (URTI)‐related symptoms over periods up to 28 days
Nasal symptom score
Three studies reported nasal symptoms at day three. All showed no difference between the saline nasal irrigation group and the observation only group (Adam 1998; Bollag 1984; King 2012). King 2012 rated symptoms on a four‐point symptom scale, from zero (no symptoms) to three (severe symptoms). Bollag 1984 used a similar scale but reversed, with one representing severe symptoms and four indicating no symptoms. Both of these studies failed to adjust for baseline difference, while Adam 1998 used multivariate linear regression to adjust for baseline severity. Adam 1998 claimed to use a four‐point symptom scale similar to King 2012, but their results were presented as mean scores up to a maximum of five.
Two studies also reported nasal symptom scores at day seven, again neither reporting statistical differences between the treatment groups (Adam 1998; King 2012). Wang 2009 compared the baseline mean score from the first week to the second and third week score for four nasal and four non‐nasal symptoms, and reported no statistical difference in symptoms scores, with the exception of daytime rhinorrhoea and nocturnal nasal congestion (P value < 0.05).
Slapak 2008 reported a significant reduction nasal secretion score at visit two (up to three weeks after enrolment) for all nasal saline groups compared to control as a mean difference (MD) of ‐0.31 (95% confidence interval (CI) ‐0.48 to ‐0.14) on a four‐point scale.
Nasal secretion type
Participants studied by Slapak 2008 were assessed at the first and second visits (up to three weeks from study entry) for type of nasal secretions and the qualitative assessment (absent, serous, seropurulent or purulent) was translated to a numerical score for grouping of results. For this comparison of the saline wash and control groups at the second visit on a four‐point scale the MD was ‐0.34 (95% CI ‐0.50 to ‐0.18), indicating a small improvement with nasal saline irrigation.
Nasal patency
Slapak 2008 evaluated the degree of difficulty of nasal breathing as a four‐point "breathing score" for each patient at the first and second visits. The difference for the saline wash group compared with the control group at the second visit was MD ‐0.33 (95% CI ‐0.47 to ‐0.19).
Wang 2009 recorded nasal peak expiratory flow rate at three intervals during their study period. The authors reported a statistically significant mean improvement in nasal peak expiratory flow rate for the normal saline group at an undisclosed medium time point and end of study time point. However, no raw data were available and therefore we cannot report the size of this difference nor comment on the clinical significance. Baseline differences were also not reported.
Respiratory symptom score
Only one included study, examining infants and children up to 24 months of age, provided respiratory symptom scores for each group of patients (Bollag 1984). This score included cough and difficulty in breathing. At day three, there was no significant difference in respiratory symptom score between any of the compared treatment or control groups based on a direct comparison to group scores on day three. However, the saline group improved by 0.91 from baseline compared to 0.26 for the phenylephrine group and 0.80 for the control group on a four‐point scale.
Activity symptom score
This is a score reflecting the child's degree of wellness in terms of behaviours such as feeding, playing and sleeping. Analysis of the data for activity symptom score at day three showed no difference, statistical or otherwise, between any of the compared treatment or control groups (Bollag 1984).
Overall health status
Slapak 2008 included health status scores, indicating the degree of symptomatic improvement based on patient reports (Table 1). Scores were given on a scale of one to four, with a health status score of one indicating cure and a score of four representing no change. The mean health status score at the follow‐up examination for the subgroups 'entry during cold' and 'entry during flu' respectively was 2.6 (standard deviation (SD) 1.02) and 2.00 (SD 0.91) for the control group, compared with 1.87 (SD 0.84) and 1.59 (SD 0.74) for the saline wash group, with a P value of < 0.05 reported for both groups.
| Treatment group | Health status score |
| Symptomatic improvement compared to beginning of illness ‐ Normal treatment only | 2.60 (SD 1.02) ‐ cold 2.00 (SD 0.91) ‐ flu |
| Symptomatic improvement compared to beginning of illness ‐ Normal treatment plus isotonic saline | 1.87 (SD 0.84) ‐ cold 1.59 (SD 0.74) ‐ flu |
Reported as significant findings (see Results section). Insufficient data to calculate confidence intervals.
SD: standard deviation
2. Time to resolution of symptomatic illness
Two studies included data on the 'day of well‐being' for patients in each group, indicating on which day participants felt 'back to normal' (Adam 1998; King 2012). Adam 1998 reported the mean day of well‐being for the three study groups and found no statistically significant difference in mean day of well‐being between any of the groups (Table 2).
| Treatment group | Day of well‐being |
| Hypertonic saline irrigation | 8.3 days (95% CI 6.9 to 9.7) |
| Normal saline irrigation | 8.3 days (95% CI 6.82 to 9.78) |
| Observation only | 8.0 days (95% CI 6.7 to 9.3) |
CI: confidence interval
King 2012 measured 'day to wellness' of participants who were asked to fill out a symptom diary. The mean day of well‐being for the group treated with isotonic nasal saline was 7.67 days (95% CI 5.33 to 10.00) compared to 10.48 days (95% CI 8.03 to 12.93) for the control group. This was not a statistically significant difference. The pooled data for King 2012 and Adam 1998 showed no significant difference between normal saline and the control group (Analysis 1.1)
Secondary outcomes
1. Adverse events associated with treatment
Three studies reported adverse effects from treatment with nasal saline, or difficulty with patient toleration of treatment. The study using infant patients reported that six out of 15 participants (40.0%) did not tolerate treatment with saline nasal drops, while seven out of 16 (43.7%) did not tolerate treatment with phenylephrine drops (Bollag 1984). While the group numbers are small, the similar proportions suggest that the infants may not have tolerated the delivery of nasal drops, rather than the saline itself.
In the study using adult patients with the common cold or rhinosinusitis, in the group using hypertonic saline irrigation seven out of 33 participants (21.2%) complained of dry nose and 11 out of 33 (33.3%) reported pain or irritation (Adam 1998). Among the group treated with normal saline irrigation, 11 out of 36 (30.5%) complained of dry nose and four out of 31 (12.9%) reported pain or irritation from the treatment (P value = 0.05 for nasal irritation).
The third study, using children, found an overall rate of adverse events of 8.7%, most of which were reported by participants in the medium jet group and associated with the higher flow rate (Slapak 2008). The rates of adverse effects were not reported for the control group, only the reporting of rates for all the saline intervention groups. The trial authors did not specify further the type of complaints but mention that three participants experienced nosebleeds.
As none of the trials discussed patient withdrawal in detail, it is possible that some may have left the studies for reasons related to adverse effects or discomfort from treatment.
2. Days off work or school
Only King 2012 reported days off work with no significant difference between groups (1.3 days for the control group versus 1.9 for the saline group).
3. Antibiotic and URTI medication use
King 2012 and Slapak 2008 compared the use of antibiotics in saline groups versus controls and found a trend to reduced antibiotic use in the nasal saline group, though this did not reach statistical significance (Analysis 2.1).
Slapak 2008 did report statistically significant reductions in nasal decongestant and mucolytic medication used for symptomatic relief in the saline groups (P value < 0.5) (Table 3).
| Medication type | Use before study (%) | Use at follow‐up (%) |
| Antipyretics | 23.8 (control) 23.5 (saline wash) | 12.9 (control) 7.6 (saline wash) |
| Decongestants | 40.0 (control) 29.4 (saline wash) | 35.6 (control) 15.9 (saline wash) |
| Mucolytics | 20.0 (control) 15.6 (saline wash) | 31.7 (control) 17.3 (saline wash) |
| Systemic antibiotics | 5.0 (control) 3.1 (saline wash) | 8.9 (control) 5.5 (saline wash) |
Discussion
Summary of main results
The five included randomised controlled trials (RCTs) of saline nasal irrigation provide limited evidence that treatment is effective for symptoms of acute upper respiratory tract infections (URTIs). Nasal symptom scores, combined from a complex of different symptoms in different trials, were statistically similar between treatment and control groups. There was a reduction in the outcome of time to resolution of symptoms, which was reported in two trials, but the difference was not clinically significant. The largest trial, which also had a high risk of bias, reported a number of statistically significant outcomes for the nasal saline group at follow‐up, including reduction of sore throat, nasal secretion and secretion type and nasal breathing score (Slapak 2008). It also reported a significant improvement in the health status score.
There was a trend towards reduced antibiotic use in one study with saline nasal irrigation and this study also demonstrated a statistically significant reduction in the use of adjunct nasal decongestant treatment with nasal saline irrigation compared to control (Slapak 2008). One study, reported a significant difference in quality of life and peak nasal expiratory flow (Wang 2009). However, there were significant methodological and reporting flaws that limit the interpretation of these data.
No serious adverse effects occurred in the included trials, although three children in one study experienced nosebleeds (Slapak 2008). Minor adverse events were not uncommon and 40% to 44% of babies were shown to have difficulty with nasal drops. Discomfort in one study was associated with higher application pressures rather than the nasal saline solution itself (Slapak 2008).
Overall completeness and applicability of evidence
This review focused on RCTs of saline nasal irrigation for the symptomatic treatment of acute URTIs. The nature of saline nasal irrigation makes double‐blinding difficult and an appropriate placebo difficult to find. There were a limited number of RCTs available and all of these studies were small in size. Of the five included trials, only two main outcomes could be combined for pooled analysis due to the differences in the clinical measures used. The two additional studies included since the original systematic review have not contributed data of sufficient size or quality to materially change the original findings (King 2012; Wang 2009).
Each trial reviewed used different strengths of saline solution, again limiting the possibilities for data comparison. In particular, Slapak 2008 used a commercial isotonic seawater product containing zinc and other elements that may be a factor in the effects of the product.
Only one of the included papers examined the effect of saline irrigation on other symptoms, such as anosmia (loss of the sense of smell) and cough associated with acute URTIs (Slapak 2008). This is a potential clinical application of the treatment but we located no other papers addressing the topic.
The clinical outcomes measured by each study were largely subjective, focusing on patient‐reported symptoms, which increases risk of bias in the results. Furthermore, Bollag 1984 and Wang 2009 relied on interpretation and reporting of infant patients' symptoms by parents, contributing to potential bias and this is a limitation in the interpretation of the results of these studies.
Two excluded studies, although excluded for not meeting the inclusion criteria, provided some corroborating evidence to support the need for future research that is better structured and controlled to investigate nasal saline irrigation as a treatment for acute URTIs (Inanli 2002; Passali 2005). The measure of mucociliary clearance (measured by Inanli 2002) is not clinically relevant and data relating to symptom relief and duration of illness would be more useful.
Quality of the evidence
The summary of the evidence is presented in the summary of findings Table for the main comparison. For nasal saline versus a standard therapy or observation, we judged the evidence for a reduction in nasal symptoms or time to wellness to be of very low or low quality, meaning that we cannot have a high degree of confidence in this result. The studies are generally at unclear risk of bias and the sample sizes are small (most with fewer than 100 participants overall) and the possibility of chance findings and publication bias is high. Most of the data come from one or two trials. Further research is very likely to have an important impact on our confidence in the estimate of effect.
Potential biases in the review process
We included one unpublished study in this updated review (King 2012). This unpublished trial was supervised by one of the authors (DK), whose role in the trial was as a supervisor and clinician. The 'Risk of bias' assessment and data extraction were undertaken by independent authors (BM, CW), who had no role in this trial.

Study flow diagram.

'Risk of bias' summary: review authors' judgements about each risk of bias item for each included study.

'Risk of bias' graph: review authors' judgements about each risk of bias item presented as percentages across all included studies.

Comparison 1 Time to symptom resolution, Outcome 1 Mean days to wellness (normal saline plus standard therapy versus standard therapy).

Comparison 2 Antibiotic use, Outcome 1 Antibiotic usage (normal saline plus standard therapy versus standard therapy).
| Normal saline plus standard treatment compared to standard treatment alone for acute upper respiratory tract infections | ||||||
| Patient or population: patients with acute upper respiratory tract infections | ||||||
| Outcomes | Illustrative comparative risks* (95% CI) | Relative effect | No. of participants | Quality of the evidence | Comments | |
| Assumed risk | Corresponding risk | |||||
| Standard treatment alone | Normal saline plus standard treatment | |||||
| Mean days to wellness | The mean days to wellness in the control groups was | The mean days to wellness in the intervention groups was | 111 | ⊕⊝⊝⊝ | ||
| Antibiotic usage | Study population | OR 0.65 | 422 | ⊕⊝⊝⊝ | ||
| 89 per 1000 | 60 per 1000 | |||||
| Moderate | ||||||
| 88 per 1000 | 59 per 1000 | |||||
| Sore throat | The mean sore throat in the control groups was | The mean sore throat in the intervention groups was | 390 | ⊕⊕⊝⊝ | ||
| *The basis for the assumed risk (e.g. the median control group risk across studies) is provided in footnotes. The corresponding risk (and its 95% confidence interval) is based on the assumed risk in the comparison group and the relative effect of the intervention (and its 95% CI). | ||||||
| GRADE Working Group grades of evidence | ||||||
| 1Bias is likely in the included studies as adequate blinding is not possible with this intervention. | ||||||
| Treatment group | Health status score |
| Symptomatic improvement compared to beginning of illness ‐ Normal treatment only | 2.60 (SD 1.02) ‐ cold 2.00 (SD 0.91) ‐ flu |
| Symptomatic improvement compared to beginning of illness ‐ Normal treatment plus isotonic saline | 1.87 (SD 0.84) ‐ cold 1.59 (SD 0.74) ‐ flu |
| Reported as significant findings (see Results section). Insufficient data to calculate confidence intervals. SD: standard deviation | |
| Treatment group | Day of well‐being |
| Hypertonic saline irrigation | 8.3 days (95% CI 6.9 to 9.7) |
| Normal saline irrigation | 8.3 days (95% CI 6.82 to 9.78) |
| Observation only | 8.0 days (95% CI 6.7 to 9.3) |
| CI: confidence interval | |
| Medication type | Use before study (%) | Use at follow‐up (%) |
| Antipyretics | 23.8 (control) 23.5 (saline wash) | 12.9 (control) 7.6 (saline wash) |
| Decongestants | 40.0 (control) 29.4 (saline wash) | 35.6 (control) 15.9 (saline wash) |
| Mucolytics | 20.0 (control) 15.6 (saline wash) | 31.7 (control) 17.3 (saline wash) |
| Systemic antibiotics | 5.0 (control) 3.1 (saline wash) | 8.9 (control) 5.5 (saline wash) |
| Outcome or subgroup title | No. of studies | No. of participants | Statistical method | Effect size |
| 1 Mean days to wellness (normal saline plus standard therapy versus standard therapy) Show forest plot | 2 | 111 | Mean Difference (IV, Random, 95% CI) | ‐0.79 [‐4.72, 3.14] |
| Outcome or subgroup title | No. of studies | No. of participants | Statistical method | Effect size |
| 1 Antibiotic usage (normal saline plus standard therapy versus standard therapy) Show forest plot | 2 | 422 | Odds Ratio (M‐H, Random, 95% CI) | 0.64 [0.29, 1.44] |