Quimioterapia y radioterapia adyuvante después de la cirugía para el carcinosarcoma uterino
Appendices
Appendix 1. MEDLINE search strategy
Medline 1950 to November 2012
-
exp Uterine Neoplasms/
-
(uter* or endometri*).mp.
-
1 or 2
-
exp Carcinosarcoma/
-
carcinosarcoma*.mp.
-
Mixed Tumor, Mullerian/
-
Mixed Tumor, Mesodermal/
-
(mixed and tumo* and (mullerian or mesodermal)).mp.
-
4 or 5 or 6 or 7 or 8
-
3 and 9
-
exp Radiotherapy/
-
radiotherap*.mp.
-
radiation.mp.
-
radiotherapy.fs.
-
11 or 12 or 13 or 14
-
exp Antineoplastic Agents/
-
Antineoplastic Combined Chemotherapy Protocols/
-
Chemotherapy, Adjuvant/
-
chemotherap*.mp.
-
drug therapy.fs.
-
16 or 17 or 18 or 19 or 20
-
15 or 21
-
10 and 22
key: mp=title, original title, abstract, name of substance word, subject heading word, unique identifier, fs=floating subheading
Appendix 2. EMBASE search strategy
Embase Ovid 1980 to November 2012
-
exp uterus cancer/
-
(uter* or endometr*).mp.
-
1 or 2
-
exp mixed tumor/
-
carcinosarcoma.mp.
-
(mixed and tumo* and (mullerian or mesodermal)).mp.
-
4 or 5 or 6
-
3 and 7
-
cancer radiotherapy/
-
exp radiotherapy/
-
radiotherap*.mp.
-
radiation.mp.
-
rt.fs.
-
9 or 10 or 11 or 12 or 13
-
exp chemotherapy/
-
exp antineoplastic agent/
-
combination chemotherapy/
-
chemotherap*.mp.
-
dt.fs.
-
15 or 16 or 17 or 18 or 19
-
14 or 20
-
8 and 21
key: mp=title, abstract, subject headings, heading word, drug trade name, original title, device manufacturer, drug manufacturer name, fs=floating subheading
Appendix 3. CENTRAL search strategy
CENTRAL Issue 10, 2012
-
MeSH descriptor Uterine Neoplasms explode all trees
-
uter* or endometri*
-
(#1 OR #2)
-
MeSH descriptor Carcinosarcoma explode all trees
-
carcinosarcoma*
-
MeSH descriptor Mixed Tumor, Mullerian explode all trees
-
MeSH descriptor Mixed Tumor, Mesodermal explode all trees
-
mixed and tumo* and (mullerian or mesodermal)
-
(#4 OR #5 OR #6 OR #7 OR #8)
-
(#3 AND #9)
-
MeSH descriptor Radiotherapy explode all trees
-
radiotherap*
-
radiation
-
Any MeSH descriptor with qualifier: RT
-
(#11 OR #12 OR #13 OR #14)
-
MeSH descriptor Antineoplastic Agents explode all trees
-
MeSH descriptor Antineoplastic Combined Chemotherapy Protocols explode all trees
-
MeSH descriptor Chemotherapy, Adjuvant explode all trees
-
chemotherap*
-
Any MeSH descriptor with qualifier: DT
-
(#16 OR #17 OR #18 OR #19 OR #20)
-
(#15 OR #21)
-
(#10 AND #22)
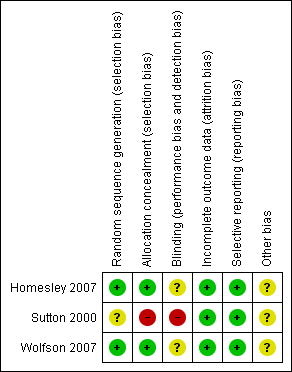
Methodological quality summary: review authors' judgements about each methodological quality item for each included study.

Methodological quality graph: review authors' judgements about each methodological quality item presented as percentages across all included studies.
Comparison 1 Combination therapy versus Ifosfamide, Outcome 1 Overall survival.

Comparison 1 Combination therapy versus Ifosfamide, Outcome 2 Progression‐free survival.
Comparison 1 Combination therapy versus Ifosfamide, Outcome 3 G3‐4 Nausea/vomiting.
Comparison 1 Combination therapy versus Ifosfamide, Outcome 4 Diarrhoea and other GI.
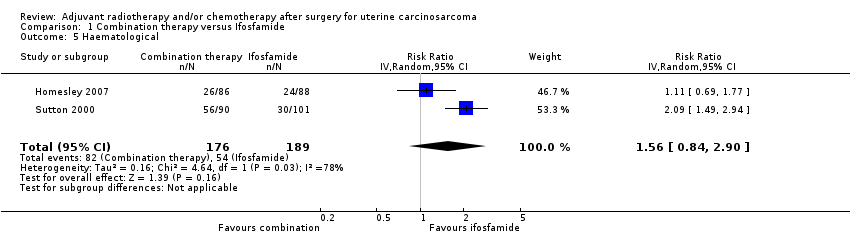
Comparison 1 Combination therapy versus Ifosfamide, Outcome 5 Haematological.

Comparison 1 Combination therapy versus Ifosfamide, Outcome 6 Genitourinary.
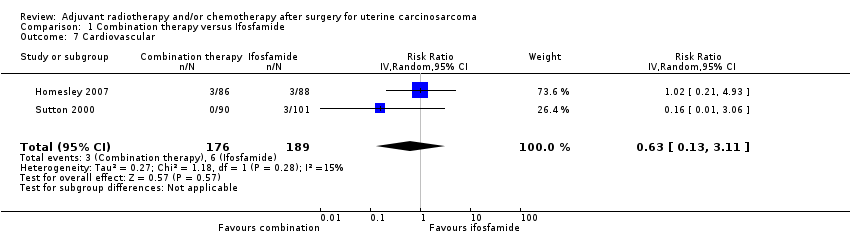
Comparison 1 Combination therapy versus Ifosfamide, Outcome 7 Cardiovascular.

Comparison 1 Combination therapy versus Ifosfamide, Outcome 8 Hepatic.

Comparison 1 Combination therapy versus Ifosfamide, Outcome 9 Neuropathy.

Comparison 2 Whole body irradiation versus chemotherapy, Outcome 1 Overall survival.

Comparison 2 Whole body irradiation versus chemotherapy, Outcome 2 Progression‐free survival.

Comparison 2 Whole body irradiation versus chemotherapy, Outcome 3 G3‐4 Gastrointestinal.

Comparison 2 Whole body irradiation versus chemotherapy, Outcome 4 Haematological.
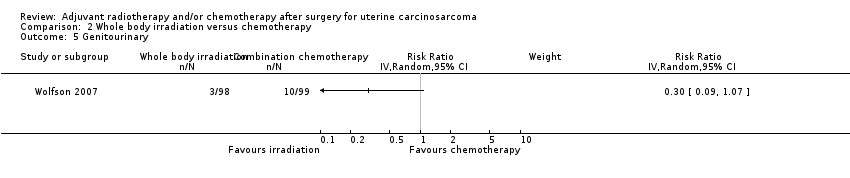
Comparison 2 Whole body irradiation versus chemotherapy, Outcome 5 Genitourinary.
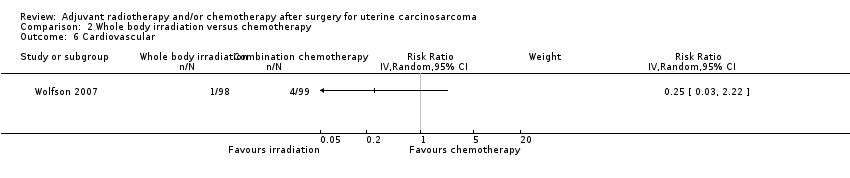
Comparison 2 Whole body irradiation versus chemotherapy, Outcome 6 Cardiovascular.

Comparison 2 Whole body irradiation versus chemotherapy, Outcome 7 Hepatic.

Comparison 2 Whole body irradiation versus chemotherapy, Outcome 8 Neuropathy.
| Outcome or subgroup title | No. of studies | No. of participants | Statistical method | Effect size |
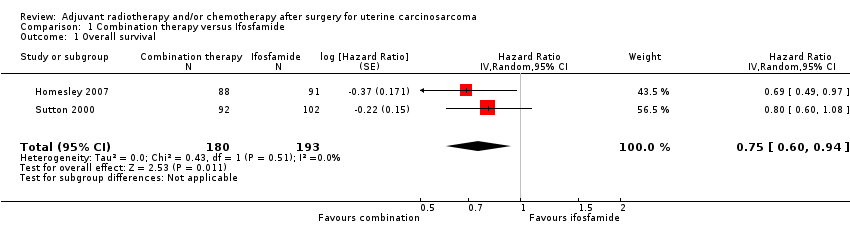
| 1 Overall survival Show forest plot | 2 | 373 | Hazard Ratio (Random, 95% CI) | 0.75 [0.60, 0.94] |
| 2 Progression‐free survival Show forest plot | 2 | 373 | Hazard Ratio (Random, 95% CI) | 0.72 [0.58, 0.90] |
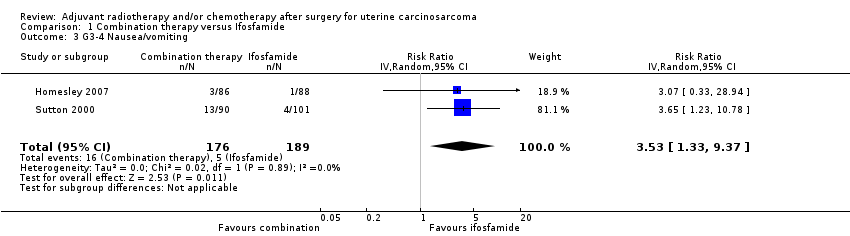
| 3 G3‐4 Nausea/vomiting Show forest plot | 2 | 365 | Risk Ratio (IV, Random, 95% CI) | 3.53 [1.33, 9.37] |
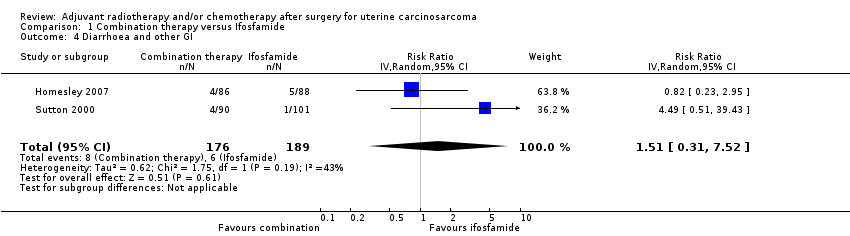
| 4 Diarrhoea and other GI Show forest plot | 2 | 365 | Risk Ratio (IV, Random, 95% CI) | 1.51 [0.31, 7.52] |
| 5 Haematological Show forest plot | 2 | 365 | Risk Ratio (IV, Random, 95% CI) | 1.56 [0.84, 2.90] |
| 6 Genitourinary Show forest plot | 2 | 365 | Risk Ratio (IV, Random, 95% CI) | 1.68 [0.54, 5.18] |
| 7 Cardiovascular Show forest plot | 2 | 365 | Risk Ratio (IV, Random, 95% CI) | 0.63 [0.13, 3.11] |
| 8 Hepatic Show forest plot | 1 | 174 | Risk Ratio (IV, Random, 95% CI) | 2.05 [0.73, 5.74] |
| 9 Neuropathy Show forest plot | 2 | 365 | Risk Ratio (IV, Random, 95% CI) | 1.59 [0.99, 2.55] |
| Outcome or subgroup title | No. of studies | No. of participants | Statistical method | Effect size |
| 1 Overall survival Show forest plot | 1 | Hazard Ratio (Random, 95% CI) | Subtotals only | |
| 2 Progression‐free survival Show forest plot | 1 | Hazard Ratio (Random, 95% CI) | Subtotals only | |
| 3 G3‐4 Gastrointestinal Show forest plot | 1 | Risk Ratio (IV, Random, 95% CI) | Subtotals only | |
| 4 Haematological Show forest plot | 1 | Risk Ratio (IV, Random, 95% CI) | Subtotals only | |
| 5 Genitourinary Show forest plot | 1 | Risk Ratio (IV, Random, 95% CI) | Subtotals only | |
| 6 Cardiovascular Show forest plot | 1 | Risk Ratio (IV, Random, 95% CI) | Subtotals only | |
| 7 Hepatic Show forest plot | 1 | Risk Ratio (IV, Random, 95% CI) | Subtotals only | |
| 8 Neuropathy Show forest plot | 1 | Risk Ratio (IV, Random, 95% CI) | Subtotals only | |